THE URBAN LABOUR FORCE SURVEY 2009 REPORT UGANDA BUREAU OF STATISTICS Plot 9, Colville Street P. O. Box 7186 Kampala Tel: 256 414 706 000 Fax: 256 414 237 553 Email: [email protected]Website: www.ubos.org October 2010
Transcript
THE URBAN LABOUR FORCE
SURVEY 2009 REPORT
UGANDA BUREAU OF STATISTICS Plot 9, Colville Street P. O. Box 7186 Kampala Tel: 256 414 706 000 Fax: 256 414 237 553 Email: [email protected] Website: www.ubos.org October 2010
UGANDA BUREAU OF STATISTICS Plot 9, Colville Street P. O. Box 7186 Kampala Tel: 256 414 706 000 Fax: 256 414 237 553 Email: [email protected] Website: www.ubos.org October 2010
Recommended Citation Uganda Bureau of Statistics (2010), “The Urban Labour Force Survey, 2009 Report”, September 2010, Kampala, Uganda
i
FOREWORD
Labour Statistics are used to measure the conditions of the labour market and are among the
highly regarded socio-economic indicators. They are used in the monitoring of the labour
market, employment, income and industrial relations policies in reference to the general
population. Apart from Governments and their agencies, labour statistics is used by employer
organizations, trade unions and lobby groups in assessing the general welfare of the working
population and hence negotiating for a position that is agreeable to the different stakeholders.
Labour statistics is also very useful to researchers.
Traditionally, labour market indicators in Uganda have been mostly generated from socio-
economic surveys, population and housing censuses and establishment surveys. The
Uganda National Household Surveys (UNHS) of 2002/2003 and 2005/2006 included a fully
fledged labour force module. However such studies are not able to provide detailed
information about the labour market at the required frequency. In order to address the ever
increasing data needs both nationally and internationally, UBOS planned an annual Labour
Force Survey (ULFS) to collect detailed data on the structure of the labour force in Uganda.
However due to resource constraints, the 2009 ULFS was restricted to only Kampala City
Council and the adjacent parts of Wakiso and Mukono districts where regular changes in the
labour structure are expected to take place in a short time change. This report presents
findings from the Urban Labour Force Survey, 2009. In terms of content, the study was the
most comprehensive ever ULFS undertaken in Uganda. This same survey will be conducted
annually and possibly more frequently so that data comparisons may be made over time and
trends established. With increased availability of the resources, the survey will in future be
expanded to cover all the urban areas in the country and extend to the rural areas.
The Uganda Bureau of Statistics would wish to express its appreciation to all institutions and
individuals who worked tirelessly to enable the successful implementation of the survey. They
include the World Bank General Data Dissemination System (GDDS II) project which was
very instrumental in the design of the survey, the Ministry of Gender, Labour and Social
Development for the enormous technical advice and the respondents who provided the data
included in the report. The 2009 survey was co-funded by the Government of Uganda and the
Department for International Development (DFID) of the United Kingdom through the Plan for
National Statistical Development (PNSD).
The Bureau calls upon all stakeholders to use the available invaluable information in evidence
based policy formulation, monitoring, planning and evaluation.
John B. Male-Mukasa
Executive Director
ii
SELECTED LABOUR FORCE INDICATORS
Indicator category Male Female Kampala City
Peri-urban
Total
Population (000’s) 1,110 1,094 1,493 711 2,204
Size of labour force (000’s) 508 412 632 289 920
Size of the working force(000’s) 474 323 547 251 797
No formal schooling 1.5 3.5 3.1 0.5 2.3
Primary 28.3 30.5 29.6 28.4 29.2
Incomplete Secondary 34.8 35.3 34.5 36.0 35.0
Complete S6 11.7 6.0 10.3 7.3 9.4
Above secondary 20.5 19.6 18.3 23.5 20.1
Post primary specialised training 2.0 4.7 2.8 3.7 3.1
Post secondary specialised training 8.8 8.5 7.4 11.5 8.7
Degree and above 11.2 9.9 10.7 10.8 10.7
Not stated 1.2 1.6 1.6 1.9 1.7
With an area of specialization 20.7 21.4 19.3 24.7 21.0
Employment to population ratio 72.1 48.1 59.8 60.4 60.0
Unemployment rate 6.7 21.5 13.4 13.2 13.3
Underemployment
(a) Time related 15.1 7.6 11.8 13.0 12.2
(b) Skills related 14.7 9.9 11.4 15.6 12.7
(c) Income related 3.6 4.4 4.6 2.7 4.0
Average hours worked (per week) 61.6 55.3 61.5 53.6 59.0
Median wages(in ‘000s per month) 200 127 150 200 150
Activity Status of the Work Force
a) Employers 8.0 4.7 7.8 4.2 6.7
b) Own Account workers 28.1 40.6 31.6 36.6 33.2
c) Unpaid workers 4.2 6.2 5.6 3.8 5.0
d) Working on household farm 2.4 6.1 1.4 9.5 3.9
e) Apprentice 1.5 1.3 1.5 1.3 1.4
f) Paid employee 55.8 41.1 52.2 44.7 49.8
Sector of Employment
a) Service 86.5 81.6 87.7 77.5 84.5
b) Manufacturing 7.7 10.0 9.0 7.7 8.6
c) Primary 5.8 8.3 3.3 14.8 6.8
Mean Years of Tenure
a) Public 10.7 12.9 10.1 13.8 11.4
b) Private 6.1 4.6 5.4 5.9 5.6
iii
TABLE OF CONTENTS
FOREWORD .............................................................................................................................. i SELECTED LABOUR FORCE INDICATORS .......................................................................... ii TABLE OF CONTENTS ........................................................................................................... iii EXECUTIVE SUMMARY ........................................................................................................... v LIST OF ACRONYMS ............................................................................................................ viii CHAPTER ONE: INTRODUCTION ........................................................................................... 1
CHAPTER TWO: CHARACTERISTICS OF THE STUDY POPULATION ............................... 7 2.0 Introduction ................................................................................................................ 7 2.1 Population .................................................................................................................. 7 2.2 Population by Age Groups ........................................................................................ 7 2.3 Households ................................................................................................................ 8
CHAPTER THREE: LABOUR FORCE ..................................................................................... 9 3.0 Introduction ................................................................................................................ 9 3.1 The Labour Force ...................................................................................................... 9 3.2 The Labour Force Participation Rate ....................................................................... 10 3.3 The Working Population .......................................................................................... 11 3.4 Weekly Hours Worked ............................................................................................ 18 3.5 Previous Activity ..................................................................................................... 19
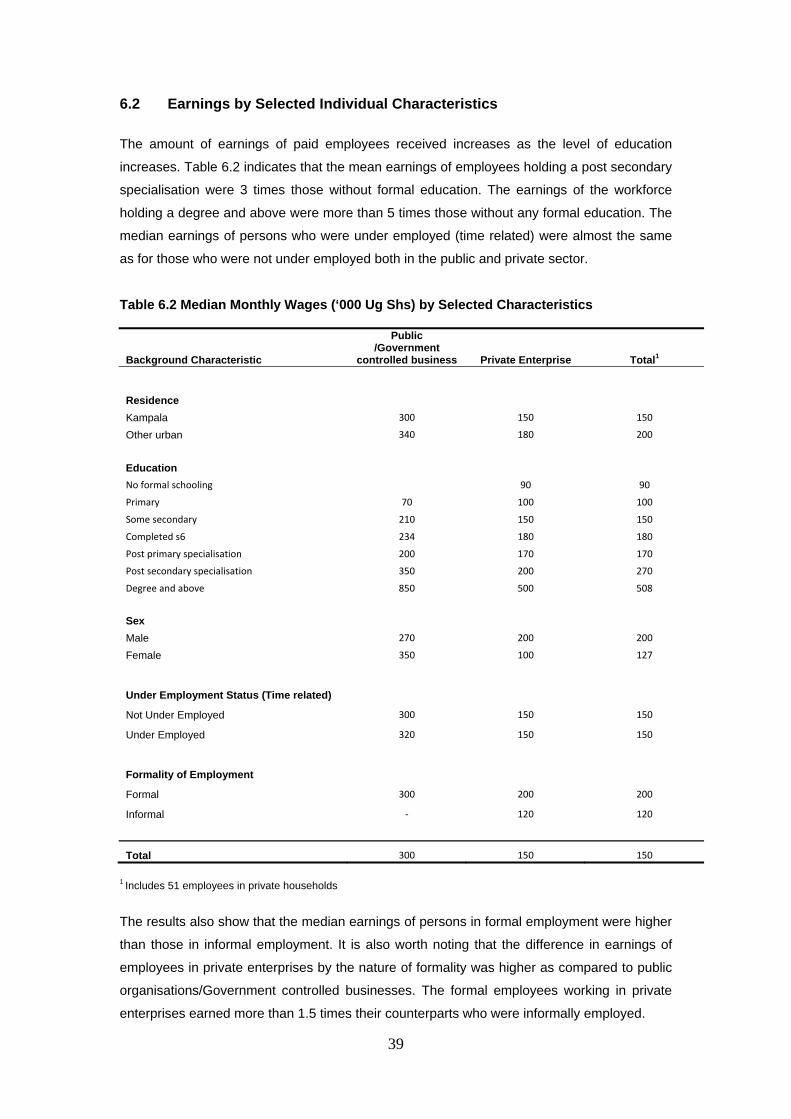
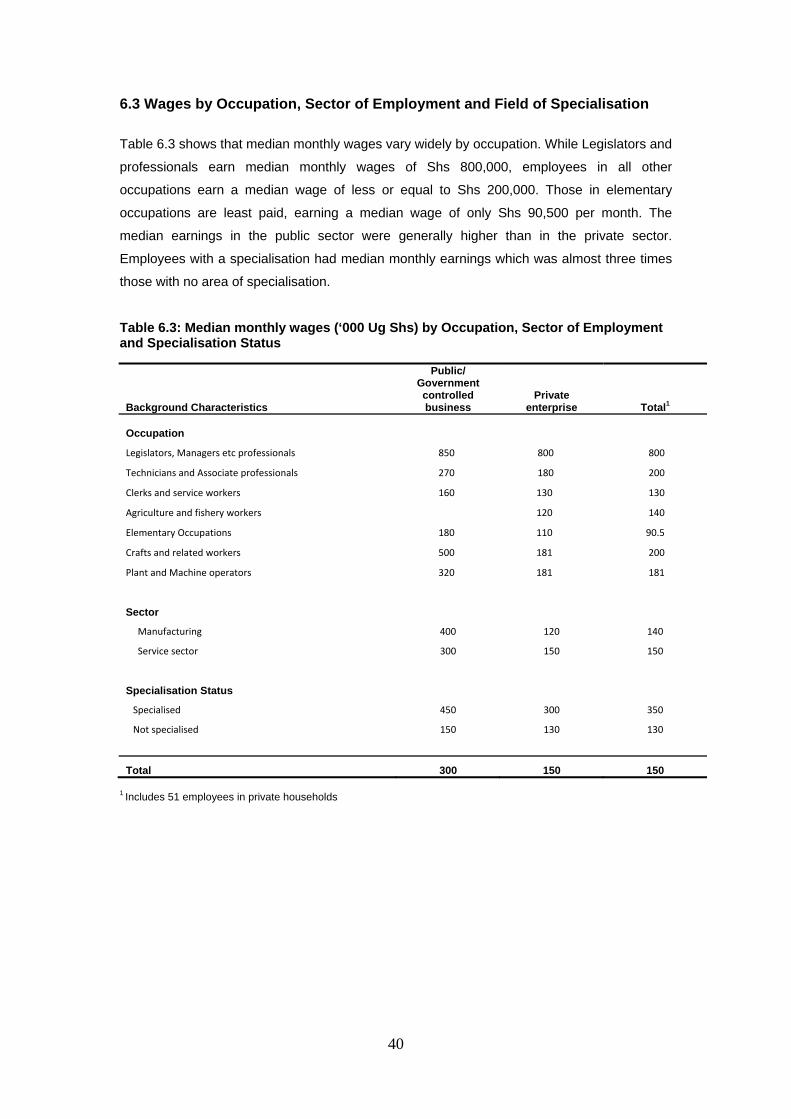
CHAPTER SIX: EARNINGS OF PAID EMPLOYEES ............................................................ 38
6.0 Introduction ............................................................................................................... 38 6.1 Wages by Sector of Employment ............................................................................. 38 6.2 Earnings by Selected Individual Characteristics ..................................................... 39 6.3 Wages by Occupation, Sector of Employment and Field of Specialisation ............. 40
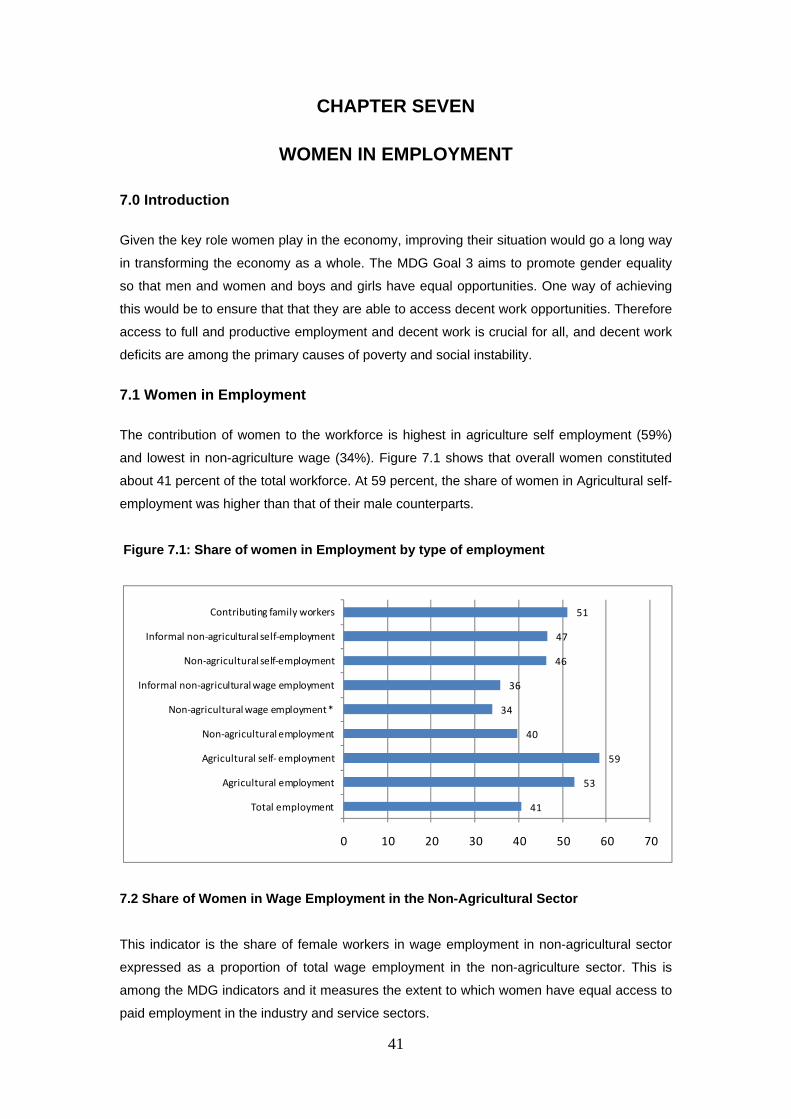
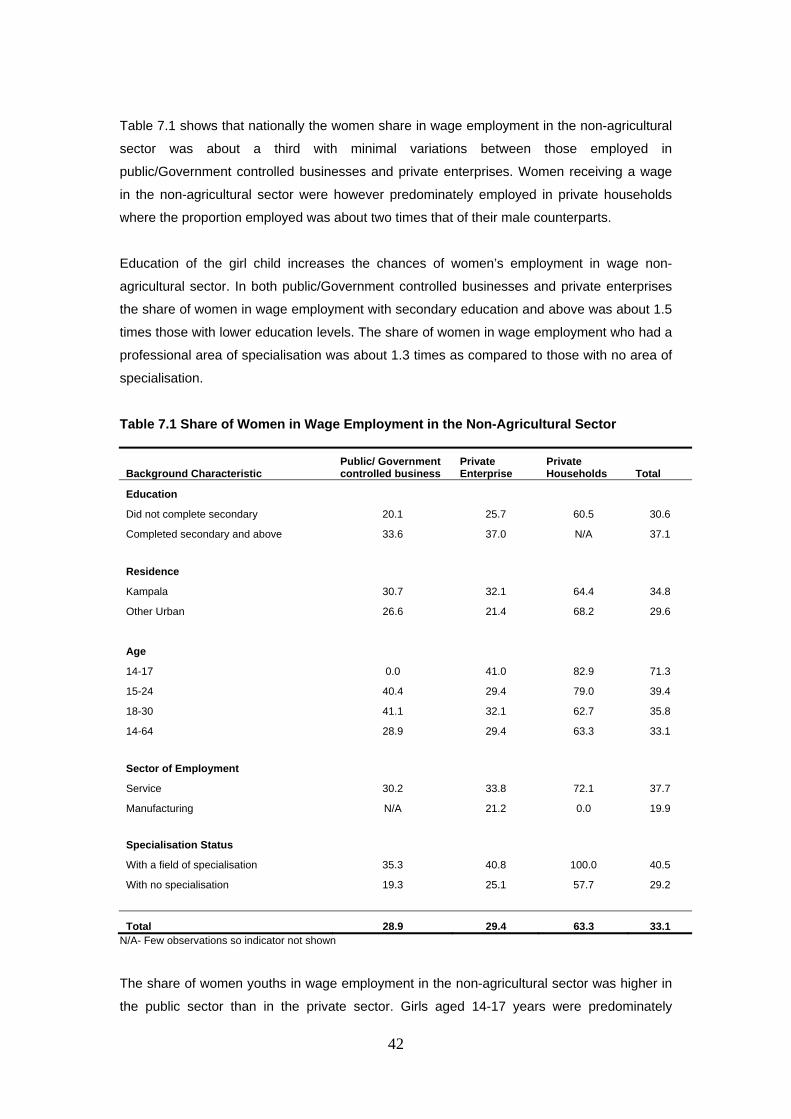
CHAPTER SEVEN: WOMEN IN EMPLOYMENT .................................................................. 41 7.0 Introduction ............................................................................................................. 41 7.1 Women in Employment........................................................................................... 41
CHAPTER EIGHT: INVOLVEMENT OF CHILDREN IN WORK AND SCHOOLING ............ 44 8.0 Introduction .............................................................................................................. 44 8.1 Involvement in Economic Activities ......................................................................... 44 8.2 Activity status and Occupations of working children age 5-17 years ...................... 46 8.3 Child labour .............................................................................................................. 47
CHAPTER NINE: POPULATION NOT IN THE LABOUR FORCE ........................................ 50 9.0 Introduction .................................................................................................................... 50 9.1 Inactivity Rates by Background Characteristics ............................................................ 50 9.2 Reasons for Not Being in the Labour Force .................................................................. 52
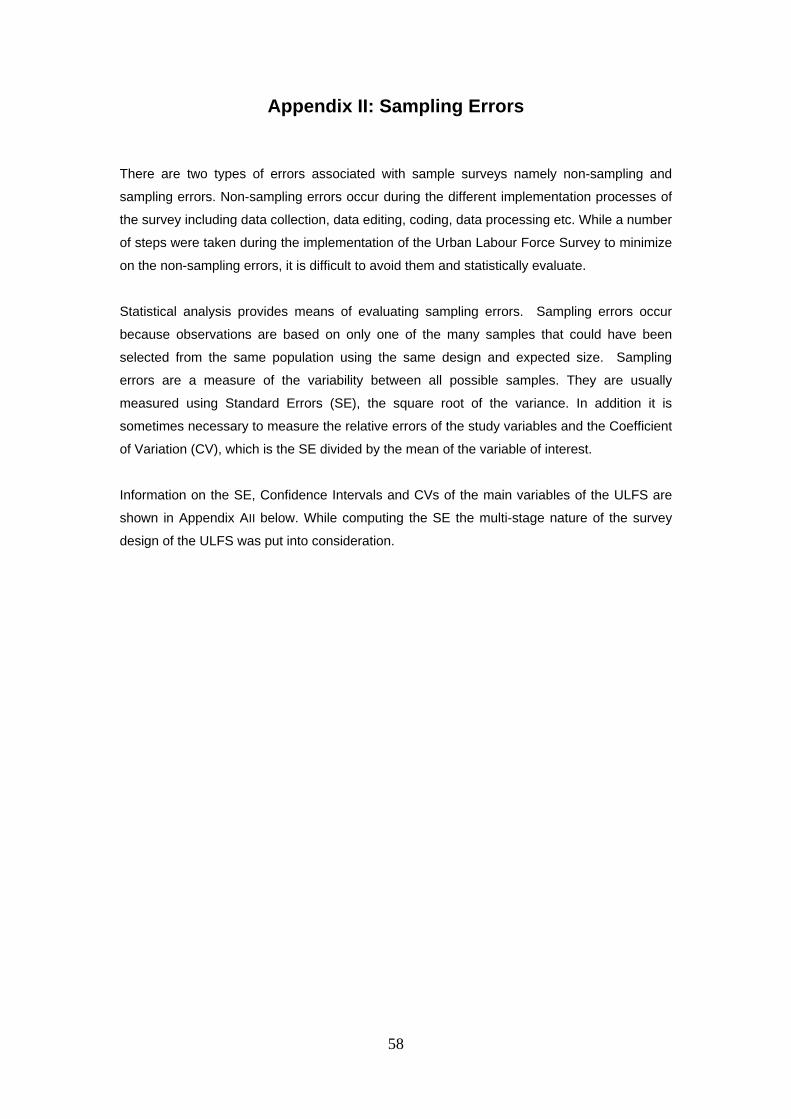
CHAPTER TEN: POLICY IMPLICATIONS ............................................................................ 53 10.1 Policy Recommendations ........................................................................................ 53 Appendix I: Glossary of Labour Terms ................................................................................ 55 Appendix II: Sampling Errors .............................................................................................. 58 Appendix III: Children's work and child labour: a note on terminology ............................... 60 Appendix IV: The ULFS Questionnaire ............................................................................... 62 Appendix V: Labour Force Framework ............................................................................. 106
v
EXECUTIVE SUMMARY
The Uganda Bureau of Statistics (UBOS), in collaboration with the Ministry of Gender, Labour
and Social Development implemented a household based Urban Labour Force Survey
(ULFS) in 2009. The need to have detailed and updated information on the Labour Market
necessitated the undertaking of this survey. The survey was undertaken in the “Greater
Kampala” area, comprising of Kampala City Council and parts of Wakiso and Mukono
districts. The ULFS was specifically designed to provide key indicators of the labour market
such as unemployment rates, underemployment rates, informal employment, employment in
the informal sector, hours of work, labour under utilisation etc. During the design of the survey
considerable technical assistance was received from the World Bank General Data
Dissemination System (GDDS) project.
The specific objectives of the Urban Labour Force Survey 2009 were:
(i) To determine the size, composition and distribution of the labour force in the “Greater
Kampala” area;
(ii) To determine the level of unemployment, under-employment, informal employment,
employment in the informal sector and related labour market indicators in the survey area;
and
(iii) To determine the participation of special groups of the population especially women and
youths in the labour force in the study area.
Size of the Labour force The survey results show that of the working age population between 14-64 years, the size of
the labour force in the surveyed area was about 919,900 people in 2009. Overall the labour
force participation rate (LFPR) was 69 percent indicating that a substantial proportion of the
working age population was involved in economic activities. The employment to population
ratio for the survey area was 60 percent.
About one half the total numbers of employed persons in the survey were self-employed while
the other half was paid employees. The results further indicate that a high proportion (85%) of
the employed population was working in the service sector while the manufacturing sector
engaged 8 percent and the primary sector 7 percent. In addition about four-fifths of the
workforce did not have any specialised training.
Unemployment and Underemployment Overall, 13 percent of the population in the “Greater Kampala” area was unemployed, with
notable differences among sexes (22% for females and 7% for males). The findings also
reveal that a higher proportion of the youths was unemployed (18%) as compared to adults
vi
(12%). There were considerable variations in unemployment rate by sex among the youths.
The unemployment rate for the female youth aged 18-30 years (National definition) was 25
percent compared to 7 percent for male youths, while for youth aged 15-24 years
(International definition), the female unemployment rate was 27 percent and 9 percent for
males. In terms of time spent working, 12 percent of the workers were under-employed (time-
related) i.e. working less than 40 hours per week.
Informal Employment The ULFS results show that the majority of the workforce in the “Greater Kampala” area were
in informal employment. About 63 percent of the workforce outside agriculture were in
informal employment. Among employers and own account workers working outside
agriculture, 68 percent and 83 percent respectively were in informal employment. Seventy-
three of the workforce in self employment was in informal employment with a higher
proportion observed in the non-agriculture sector than the agriculture sector.
Earnings of Paid Employees More than one-tenth of the employees in private enterprises earned less than Ug shs 100,000
monthly while the corresponding proportion for employees of private households was 31
percent.
The ULFS results also indicate that the amount of earnings of paid employees increases as
the level of education increases. The median earnings of employees holding a post
secondary specialisation were about 3 times those without any formal education. The paid
employees holding a degree and above earned about 5 times the earnings for those with no
formal training.
The median earnings of persons engaged in formal employment were higher than those
engaged in informal employment. The difference in earnings of employees in private
enterprises by the nature of formality was higher as compared to public
organisations/Government controlled businesses. Median monthly wages vary widely by
occupation. While legislators and professionals earned median monthly wages of Shs
800,000, employees in all other occupations earned a median wage of less or equal to Shs
200,000.
Women in Employment Overall women constituted about 41 percent of the total workforce. The contribution of women
to the workforce is highest in agriculture self employment (59%) and lowest in non-agriculture
wage (34%). The share of women in wage employment in the non-agricultural sector was
about a third with minimal variations between those employed in the public/Government
controlled businesses and private enterprises.
vii
Education of the girl child increases the chances of women’s employment in wage non-
agricultural sector. In both public/Government controlled businesses and private enterprises
the share of women in wage employment with secondary education and above was about 1.5
times those with lower education levels.
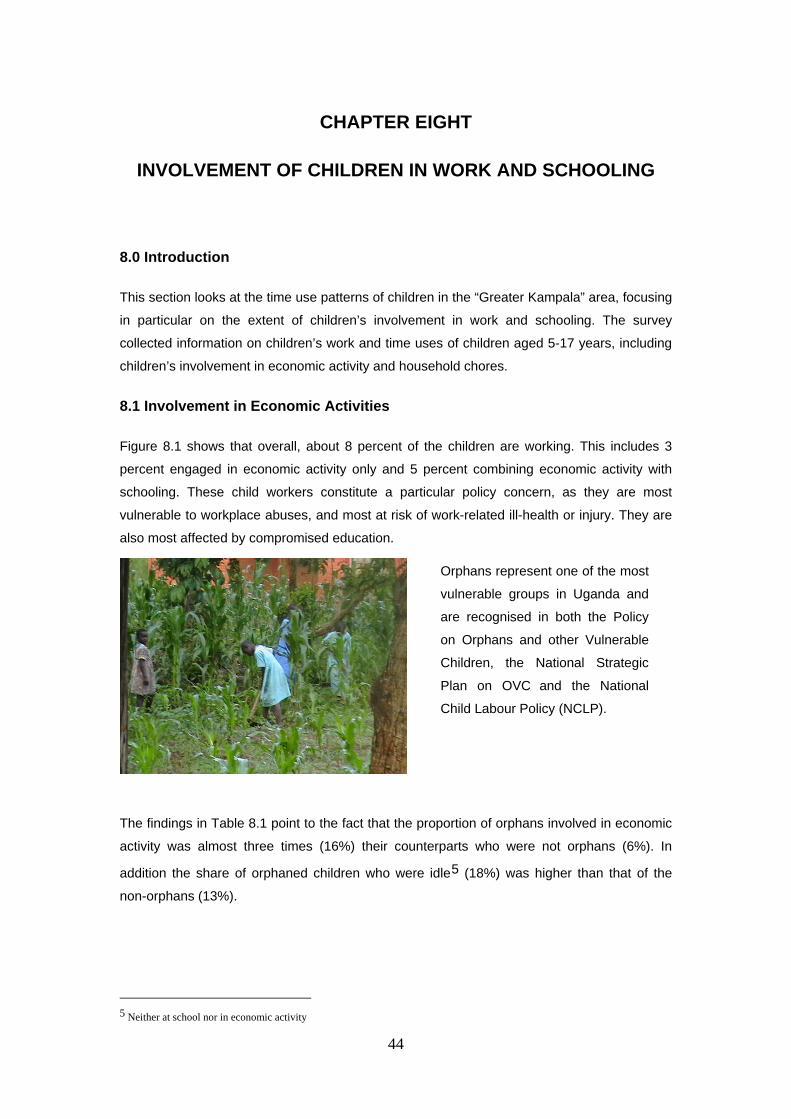
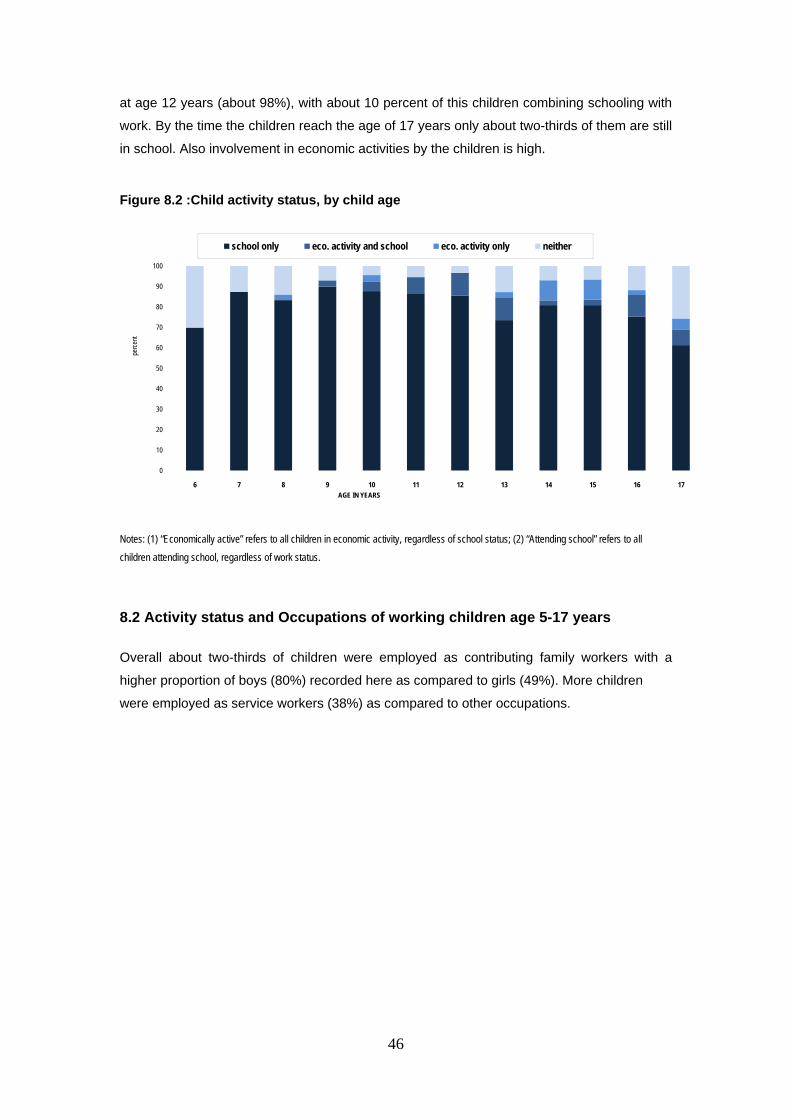
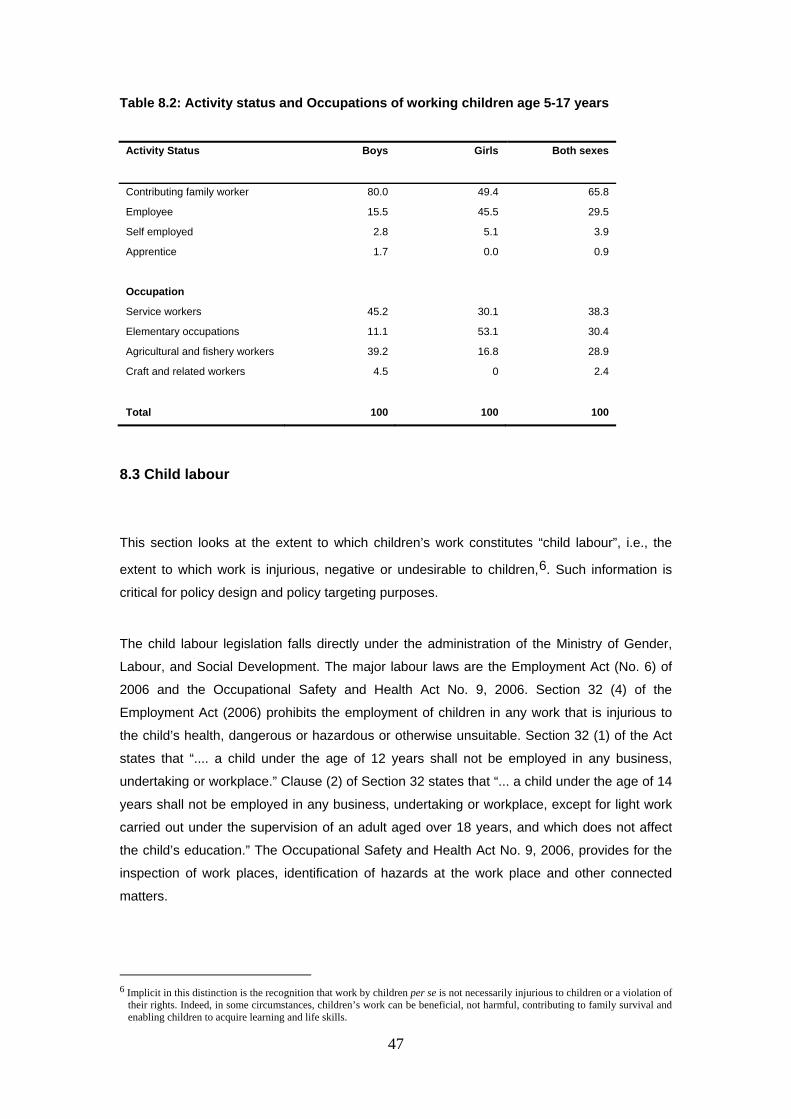
Involvement of Children in Work and Schooling About 8 percent of the children aged 5-17 years were in the workforce, including 3 percent
engaged in economic activity only and 5 percent combining economic activity with schooling.
Overall about two-thirds of the working children were employed as contributing family workers
with a higher proportion of boys (80%) compared to girls (49%). In terms of occupations held,
more children were employed as service workers (38%) as compared to other occupations.
The survey results also indicate that 6 percent of children in the “Greater Kampala” area
(about 38,000 in absolute terms) were engaged in child labour, with minimal variations by the
sex of the child.
viii
LIST OF ACRONYMS
CSPro Census and Survey Processing System
GDDS General Data Dissemination System
EA Enumeration Area
EPR Employment to Population Ratio
ILO International Labour Organisation
ISCED International Standard Classification of Education
ISCO International Standard Classification of Occupation
ISIC International Standard Classification of Industries
KCC Kampala City Council
LC Local Council
LFPR Labour Force Participation Rate
LMIS Labour Market Information System
MDG Millennium Development Goals
MGLSD Ministry of Gender, Labour and Social Development
NCLP National Child Labour Policy
NDP National Development Plan
NGO Non-Government Organisation
NOTU National Organisation of Trade Unions
NSDS National Service Delivery Survey
NSSF National Social Security Fund
PAYE Pay As You Earn
PEAP Poverty eradication Action Plan
PPS Probability Proportional to Size
SNA System of National Accounts
UBOS Uganda Bureau of Statistics
UDHS Uganda Demographic and Health Survey
ULFS Urban Labour Force Survey
UN United Nations
UNHS Uganda National Household Survey
UPHC Uganda Population and Housing Census
UPE Universal Primary Education
VAT Value Added Tax
1
CHAPTER ONE
INTRODUCTION
1.0 Background
The need to develop good National Labour Market indicators is the desire of every state. One
of the strategies for labour market development in the country is to accelerate and expand the
scope of “pro-poor economic growth”. In particular, the approach takes the expansion of
‘decent employment opportunities through both wage and self-employment’ to absorb the
growing labour force as a key challenge. In this context, the policies focus on adopting a
consolidated and gender-sensitive strategy towards developing the labour market that will
ensure both the rapid growth of productivity-enhancing employment and fulfil the poverty-
reducing labour rights such as the rights to work, employment, social protection and social
dialogue in an integrated manner. This calls for implementing the ‘decent work agenda’ as
proposed by the ILO.
The primary objective of Uganda’s economic policy is to improve the material welfare and the
quality of life of the population of the country. A sure way of achieving this objective is through
a broad-based economic growth which will ensure that an increasing number of workers are
gainfully employed. In a bid to respond to the need for reducing poverty and improving the
welfare of the people, the Government has made the issue of investment and employment
creation an urgent priority area of the National Development Plan (NDP). The NDP, whose
theme is “growth, employment and prosperity for socio-economic transformation”,
emphasises the need for government to take action to enhance the productivity of workers,
including the reform of vocational education, and to continue monitoring working conditions.
To realise the objectives of the NDP, there is therefore need to have updated indicators on
the labour market.
In order to meet the NDP data demands, a set of indicators of the labour market have been
established and will be monitored annually in urban areas, and on a relatively less frequent
basis (5 years) in rural areas. This will be achieved through conducting annual Urban Labour
Force Surveys (ULFS) and the National Labour Force Surveys (NLFS) every 5 years. The
first in a series of these surveys is the 2009 Urban Labour Force Survey.
This report presents findings from the ULFS 2009, which collected information on various
indicators such as employment status of household members of the urban population,
earnings of the working class, usual activity and hours of work including household chores
among others.
2
1.1 Survey Objectives
The main objective of the ULFS, 2009 was to collect high quality, consistent data on the
labour force, and earnings characteristics on individuals in accordance with international
standards. Specifically, the survey aimed at:
(a) Providing information on the labour force status of the population as a whole and
disaggregated by demographic characteristics;
(b) Measuring underemployment, formal and informal employment; and
(c) Generating and building social and economic indicators which will be measured
consistently over time, allowing for historical comparisons and monitoring the
progress made towards social and economic development goals of the country.
1.2 Coverage
The 2009 survey aimed to provide up-to-date information on “Greater Kampala” area,
comprising of Kampala City and selected subcounties of Wakiso and Mukono districts. The
criterion used for selection was based mostly on the main type of economic activity that the
sub-county was engaged in. The areas that were covered in the exercise are shown in a map
in Figure 1.1. The criteria used to select sub-counties in the two districts of Wakiso and
Mukono to constitute “Other urban” areas was as follows;
1. The sub-county was geographically continuous i.e. there was no area between Kampala
City and any component of the ‘Greater Kampala’
2. Basing on 2002 UPHC more than 50 percent of the working population in the sub-
counties were in non-agricultural employment.
3
Figure 1.1: A list of EAs covered during the 2009, Urban Labour Force Survey
4
1.3 Survey Design
A two-stage stratified random sampling design was used for the ULFS 2009. In the first stage,
EAs were selected from all EAs in the study area as provided by the 2002 Population and
Housing Census. A total of 100 Enumeration Areas (EAs) was deemed sufficient to enable
generate reliable estimates for the study area. The sample was split into 2 i.e., Kampala
district (70 EAs) and other urban areas (30 EAs). A list of EAs and the corresponding number
of households in each EA according to the 2002 Population and Housing Census was used
as the sampling frame. The EAs were selected using Probability Proportional to Size (PPS),
with the number of households in each EA taken as a measure of size.
At the 2nd stage, the interviewers compiled an updated list of the households in the selected
enumeration areas. From the household list of each EA, 10 households were randomly
selected and interviewed.
1.4 Sampling Weights
A two stage stratified systematic random sample design was used for the ULFS. Sampling
weights were co mputed separately at each stage of sampling. Assuming the following
notation:
P1hi: The first stage sampling probability of the ith EA in stratum h
P2hi: second-stage’s sampling probability of households within the ith EA
Phi: overall sampling probability of households of the ith EA in the hth stratum
If Eh are the number of EAs selected in Stratum h (either Kampala or other Urban), Nhi the
number of households according to the 2002 population census in the ith EA, and ∑ hiN the
total number of households in the stratum h. The probability of selecting the ith EA in stratum h
(Kampala or other urban) was calculated as:
N N EP
hi
hihhi ∑=1
Let hiL be the number of households listed in the household listing operation in EA i in
stratum h, hig the number of households selected in the EA. The second stage’s selection
probability for each household in the EA was computed as follows:
5
hi
hihi L
gP =2
The overall selection probability of each household in the i th EA of stratum h is the product of
the selection probabilities:
hihihi PPP 21 ×=
Since the ULFS was based on a probability sample there was need to assign sampling
weights to the sample in order to compute the estimates of the population parameters. The
sampling weight (Whi) for each household in EA i of stratum h is the inverse of its selection
probability:
hihi PW /1=
The overall weight, ( hioW ) for each household in EA i of stratum h is given as:
=hioW XWhihi
hi
gg'
Where hig ' is the number of households actually covered in the EA i of stratum h i
1.5 Survey Organisation
Two field teams were constituted, each with a supervisor and three data collectors. The
Supervisor played a dual role of being the overall leader and field editor for the exercise. To
help in tracing the EAs, maps were provided to the supervisors and they were tasked to
locate the Enumeration Area with the help of a member of an LC1 Executive of that Local
Council area where the EA was located. In total 2 supervisors, 6 Enumerators and 5 listers
were used in the field activities. In addition, UBOS Headquarters staff maintained close
contact with the field teams through frequent visits to the field.
1.6 Data Management and Processing
Data capture, verification and validation was centrally done using computer programs.
Data quality was assured through three measures:
1. The necessary checks, including filters and skips were included in the questionnaire
to ensure consistency during data collection.
6
2. A manual system was used where office editors were recruited to check on the
consistency of the information collected. Furthermore consistency formalities were
included in the data capture program which was developed using the Census and
Survey Processing (CSPro) system.
3. A computer program for verification and validation was also developed and operated
during data processing using both CSPro and STATA softwares.
1.7 Response Rate
Out of the 1,000 targeted households, a total of 697 households were successfully
interviewed, giving an overall response rate of 70 percent which was good enough
considering the problems of collecting data in urban areas especially Kampala. The table
below summaries the response rates for the study districts.
Table 1.1: Response Rate by District District
Households interviewed
Households not interviewed
Total
Response rate (%)
Kampala 498 202 700 71
Mukono 17 3 20 85
Wakiso 182 98 280 65
Total 697 303 1,000 69.7
The estimates presented in this report were generated using scientifically accepted methods
of analysing survey data.
7
CHAPTER TWO
CHARACTERISTICS OF THE STUDY POPULATION
2.0 Introduction
Since 1948, Population Censuses in Uganda have remained the main source of data on
socio-demographic characteristics of the population. Other sources available for socio-
economic data at national level in the country include the Uganda Demographic and Health
Surveys (UDHS), the Uganda National Household Surveys (UNHS) and National Service
Delivery Surveys (NSDS).
The Urban Labour Force Survey 2009 collected information on personal characteristics of
household members, including information on age, sex, and relationship to the household
head, among others. In presenting demographic characteristics of the population, trends have
been included where possible for comparison with previous surveys.
2.1 Population
The ULFS 2009 estimated the household population of Greater Kampala population at 2.2
million, of which 1.5 million was in Kampala City. This compares well with the 2009
population projection of 1.5 million. The estimates further showed that Kampala City had a
sex ratio of 99 ( 99 males per 100 females) compared to 107 for the other urban areas.
Table 2.1: Household Population for greater Kampala by geographical area (‘000s), 2009
ULFS 2009 Sex ratio
Male Female Total
Kampala 741.8 751.3 1,492.9 98.8
Other urban 368.1 342.8 710.9 107.4
Total 1,109.9 1,093.8 2,203.7 101.5
2.2 Population by Age Groups
Table 2.2 shows that 35 percent of the population of Greater Kampala was below 14years of
age while the population aged 14-64 years was 64 percent.
8
Table 2.2: Distribution of Population by Age Groups
Age group
0-13 14-64 65+ Total
Kampala 34.5 64.1 1.4 100
Peri-urban 36.6 63.4 0.9 100
Total 34.9 63.9 1.2 100
2.3 Households
A household is defined as a group of people who normally live and eat together. Table 2.3
shows that the number of households in the “Greater Kampala” area was about 555,800 while
the average household size was estimated at 4.1. The Kampala City average household size
was slightly lower (4.0) than that of the peri-urban (4.3). This is almost consistent with the
2002 Uganda Population and Housing Census.
The household head was defined as the member under whose guidance the major decisions
of the household were undertaken. Overall, 78 percent of the households were headed by
males with no variations observed between the two domains of study.
Table 2.3: Selected Household Characteristics
Characteristic Kampala Peri-urban Total
ULFS UNHS 05/06
Number of Households (‘000s) 383.7 366.3 172.1 555.8
Proportion of Households 69.0 31.0 100
Average Household Size 4.0 4.2 4.3 4.1
Sex of Head
Male headed (%) 77.9 71.0 78.5 78.1
Female headed (%) 22.1 29.0 21.5 21.9
9
CHAPTER THREE
LABOUR FORCE
3.0 Introduction
Uganda with support from ILO is implementing the Uganda Decent Work Programme
(UDWP). In a country such as Uganda, the concept of decent work is important not only as an
objective in its own right and a means of ensuring human rights, but also as a fundamental
way to promoting sustainable and poverty-reducing development.
The ULFS 2009 provides data for monitoring the performance of the Uganda labour market.
The information collected gives an opportunity to monitor some of the decent work indicators.
Detailed Information is available on employment, under-employment, unemployment and
related indicators on the labour market.
In Uganda the labour force is the population aged 14-64 years which is either employed or
unemployed. The age range of 14-64 years is considered as the working age. The
measurement of labour market indicators in this report is therefore based mainly on the above
age category.
3.1 The Labour Force
The labour force (economically active population) refers to those persons who supply labour
for the production of goods and services, as well as the unemployed. It is the sum of the
number of persons engaged in economic activities in the last 7 days and the number actively
looking for work.
When we add the the discouraged workers and other individuals who are not economically
active but currently available for work to the labour force we get what is termed as the
enlarged labour force. Discouraged workers are people who would want to work, but are not
seeking work because they believe no suitable job is available for them or there are no jobs
for which they have the required qualifications. Discouraged workers are included among
those outside the labour force under the current international statistical standards as they are
not seeking work.
10
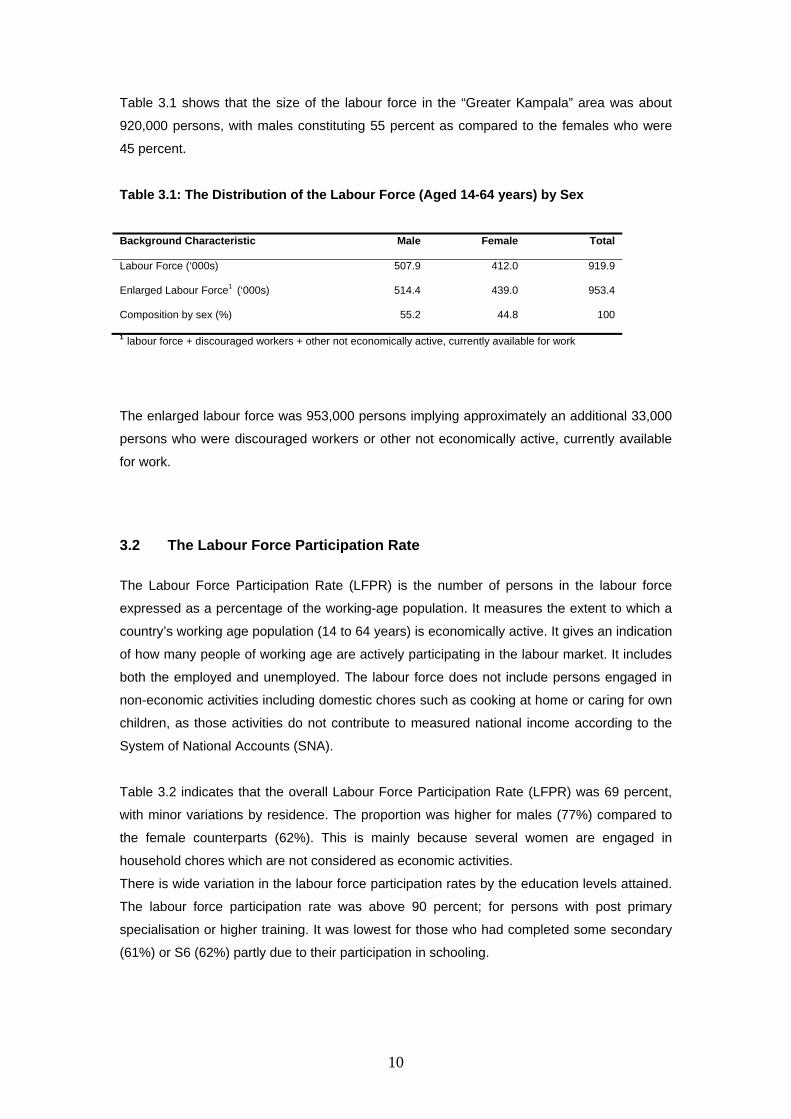
Table 3.1 shows that the size of the labour force in the “Greater Kampala” area was about
920,000 persons, with males constituting 55 percent as compared to the females who were
45 percent.
Table 3.1: The Distribution of the Labour Force (Aged 14-64 years) by Sex Background Characteristic Male Female Total
Labour Force (‘000s) 507.9 412.0 919.9
Enlarged Labour Force1 (‘000s) 514.4 439.0 953.4
Composition by sex (%) 55.2 44.8 100
1 labour force + discouraged workers + other not economically active, currently available for work
The enlarged labour force was 953,000 persons implying approximately an additional 33,000
persons who were discouraged workers or other not economically active, currently available
for work.
3.2 The Labour Force Participation Rate
The Labour Force Participation Rate (LFPR) is the number of persons in the labour force
expressed as a percentage of the working-age population. It measures the extent to which a
country’s working age population (14 to 64 years) is economically active. It gives an indication
of how many people of working age are actively participating in the labour market. It includes
both the employed and unemployed. The labour force does not include persons engaged in
non-economic activities including domestic chores such as cooking at home or caring for own
children, as those activities do not contribute to measured national income according to the
System of National Accounts (SNA).
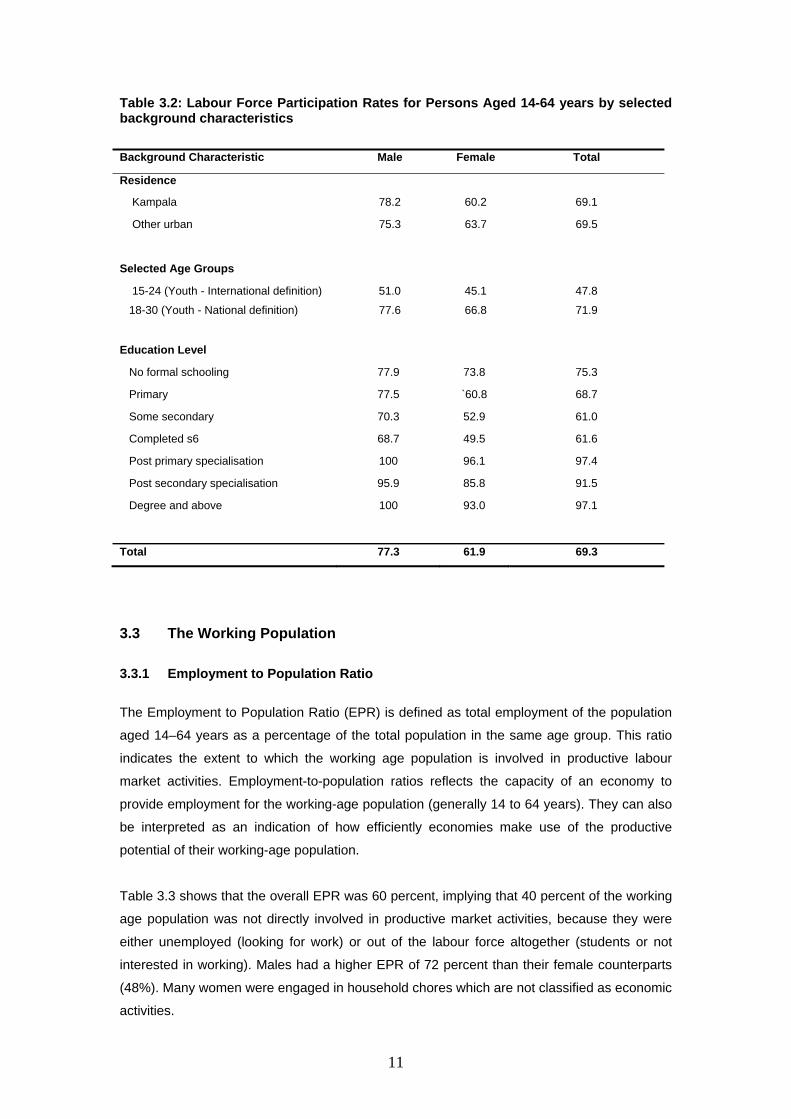
Table 3.2 indicates that the overall Labour Force Participation Rate (LFPR) was 69 percent,
with minor variations by residence. The proportion was higher for males (77%) compared to
the female counterparts (62%). This is mainly because several women are engaged in
household chores which are not considered as economic activities.
There is wide variation in the labour force participation rates by the education levels attained.
The labour force participation rate was above 90 percent; for persons with post primary
specialisation or higher training. It was lowest for those who had completed some secondary
(61%) or S6 (62%) partly due to their participation in schooling.
11
Table 3.2: Labour Force Participation Rates for Persons Aged 14-64 years by selected background characteristics Background Characteristic Male Female Total
Residence
Kampala 78.2 60.2 69.1
Other urban 75.3 63.7 69.5
Selected Age Groups
15-24 (Youth - International definition) 51.0 45.1 47.8
18-30 (Youth - National definition) 77.6 66.8 71.9
Education Level
No formal schooling 77.9 73.8 75.3
Primary 77.5 `60.8 68.7
Some secondary 70.3 52.9 61.0
Completed s6 68.7 49.5 61.6
Post primary specialisation 100 96.1 97.4
Post secondary specialisation 95.9 85.8 91.5
Degree and above 100 93.0 97.1
Total 77.3 61.9 69.3
3.3 The Working Population
3.3.1 Employment to Population Ratio
The Employment to Population Ratio (EPR) is defined as total employment of the population
aged 14–64 years as a percentage of the total population in the same age group. This ratio
indicates the extent to which the working age population is involved in productive labour
market activities. Employment-to-population ratios reflects the capacity of an economy to
provide employment for the working-age population (generally 14 to 64 years). They can also
be interpreted as an indication of how efficiently economies make use of the productive
potential of their working-age population.
Table 3.3 shows that the overall EPR was 60 percent, implying that 40 percent of the working
age population was not directly involved in productive market activities, because they were
either unemployed (looking for work) or out of the labour force altogether (students or not
interested in working). Males had a higher EPR of 72 percent than their female counterparts
(48%). Many women were engaged in household chores which are not classified as economic
activities.
12
Table 3.3: Employment to Population Ratio for Persons 14-64 years by Selected Characteristics Background Characteristic Male Female Total
Residence Kampala 72.8 47.1 59.8
Other urban 70.7 50.3 60.4
Selected age groups
15 – 24 (Young adults) 46.6 32.9 39.2
18 – 30 (Youth – National definition) 72.0 50.2 60.6
Total 72.1 48.1 60.0
3.3.2 Education Level of the Working Population
Noting that human capital is a prerequisite for development, raising its quality and therefore
productivity is recognised as a critical factor for increasing economic growth and reducing
poverty levels. Low levels of education continue to be the main obstacle to higher productivity.
The results in Table 3.4 show that about 797,000 persons worked or had a job during the
seven days preceding the survey. About 6 percent of all workers were illiterate while about
only one third of the working population had a minimum qualification of Senior 6 and above or
certificate level. This workforce with low education levels tend to be vulnerable and hence
participate in low quality jobs with low earnings. The earnings of such categories of workers in
most cases are not able to sustain them and their families and therefore they would be among
the working poor. There are notable sex variations in the distribution of the working population
by education. Four percent of the working females had no education at all compared to two
percent of their male counterparts. While 34 percent of the male working population had
education level of senior 6 and above the corresponding proportion of the female workforce
with the same education level was 29 percent.
13
Table 3.4 Characteristics of the Working Population 14-64 years (%) Education level Male Female Total
Degree and above 11.3 9.7 10.7
Post secondary specialisation 8.8 8.5 8.7
Post primary specialisation 2.0 4.7 3.1
Completed s6 11.7 6.0 9.4
Some secondary 34.8 35.3 35.0
Primary 28.3 30.5 29.2
No formal schooling 1.5 3.5 2.3
Not stated 1.7 1.6 1.7
Literacy rates
Literate 94.6 82.9 93.9
Illiterate 5.4 7.1 6.1
Total 100 100 100
Number (‘000) 474 323 797
3.3.3 Status in Employment of the main Job Employment status is broadly categorised into three groups, namely self-employed, paid
employees and apprentices. The self-employed are further subdivided into employers (who
could create jobs for others), own account workers, contributing family workers (who assist in
the household enterprises), and those working on own household farms.
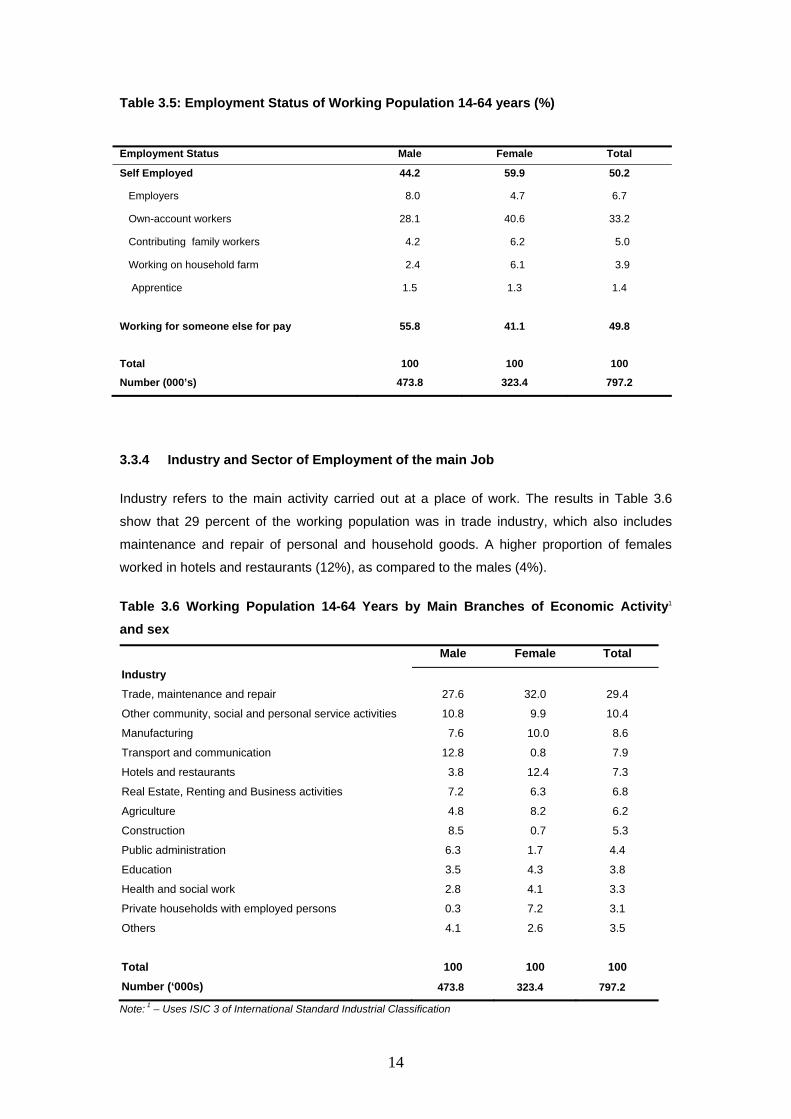
The data in Table 3.5 shows that about one half of the working population were self-
employed, the proportion being higher for females (60%) compared to that of males (44%).
Contributing family workers in household enterprises constituted 5 percent of the working
population. The existence of a sizeable proportion of self employed persons and contributing
family workers is an indication of low growth in the formal economy and high rate of job
creation in the informal economy. According to the ILO, these categories of workers are in
vulnerable employment. They are most likely to be characterised by low and insecure
employment, low earnings and low productivity.
14
Table 3.5: Employment Status of Working Population 14-64 years (%)
Employment Status Male Female Total
Self Employed 44.2 59.9 50.2
Employers 8.0 4.7 6.7
Own-account workers 28.1 40.6 33.2
Contributing family workers 4.2 6.2 5.0
Working on household farm 2.4 6.1 3.9
Apprentice 1.5 1.3 1.4
Working for someone else for pay 55.8 41.1 49.8
Total 100 100 100
Number (000’s) 473.8 323.4 797.2
3.3.4 Industry and Sector of Employment of the main Job
Industry refers to the main activity carried out at a place of work. The results in Table 3.6
show that 29 percent of the working population was in trade industry, which also includes
maintenance and repair of personal and household goods. A higher proportion of females
worked in hotels and restaurants (12%), as compared to the males (4%).
Table 3.6 Working Population 14-64 Years by Main Branches of Economic Activity1 and sex
Male Female Total
Industry
Trade, maintenance and repair 27.6 32.0 29.4
Other community, social and personal service activities 10.8 9.9 10.4
Manufacturing 7.6 10.0 8.6
Transport and communication 12.8 0.8 7.9
Hotels and restaurants 3.8 12.4 7.3
Real Estate, Renting and Business activities 7.2 6.3 6.8
Agriculture 4.8 8.2 6.2
Construction 8.5 0.7 5.3
Public administration 6.3 1.7 4.4
Education 3.5 4.3 3.8
Health and social work 2.8 4.1 3.3
Private households with employed persons 0.3 7.2 3.1
Others 4.1 2.6 3.5
Total 100 100 100 Number (‘000s) 473.8 323.4 797.2
Note: 1 – Uses ISIC 3 of International Standard Industrial Classification
15
The indicator for employment by sector divides employment into three broad groupings of
economic activity: primary, manufacturing and services. With the higher rates of world
urbanisation and a leveling of world manufacturing employment, the service sector has come
to dominate global employment. In some developing countries, the service sector has
become a leading driver of economic growth. The results from the survey in Figure 3.1
indicate that the service sector was very popular in the urban areas whereby 85 percent of the
working population was engaged in this sector. Nationally the share of services in GDP at
current prices has been growing over the years and in 2009 stood at 48 percent (UBOS 2010
Statistical Abstract). Only 9 percent and 7 percent of the working population were engaged in
manufacturing and in the primary sector respectively. However, the service sector also
includes many less skilled occupations such as petty commerce and personal services. Such
jobs are important for absorbing surplus labour, but do not drive economic growth.
Figure 3.1 Working Population 14-64 Years by Sector of Employment and sex
6 8
87
8 10
82
7 9
85
0
10
20
30
40
50
60
70
80
90
Primary Manufacturing Service
Male Female Total
3.3.5 Skills on the Job
Job skills are of fundamental importance in the productivity process. There is therefore an
impact of lack of skill on productivity as nations with a high proportion of skilled workforce are
relatively more productive as compared to those whose workforce is not highly skilled.
Respondents who had completed education level of above secondary or had post primary
specialised training were asked about their areas of specialisation. Overall about four-fifths of
the workforce did not have any specialised training as indicated in Figure 3.2. The proportion
16
was much higher in the primary and manufacturing sectors with only 9 and 12 percent of the
workforce in the two sectors respectively having an area of specialisation.
Figure 3.1 Population Working with any area of Training Specialisation by Sector (%)
912
2321
0.0
5.0
10.0
15.0
20.0
25.0
Primary Sector Manufacturing Sector
Service Sector All Sectors
3.3.6 Occupational Structure of the Working Population
During the analysis of the survey results, some of the Major occupation groups were
collapsed to have enough observations for deriving estimates. The following Major groups
were put together; Legislators and Managers were added to professionals, Clerks were
regrouped with Technicians and Associate professionals to make one group.
The distribution of the workforce in the different occupations on the main job is presented in
Table 3.7. The results reveal that persons employed as service workers or in shop and
market sales accounted for 38 percent. The elementary occupations (occupations which do
not require skill training) which include shoe cleaners, car washers, house maids,
messengers, and other labourers accounted for 16 percent of the working population. The
more skilled occupations such as professionals and associate professionals, together
accounted for 16 percent of the total workforce.
17
Table 3.7 Distribution of Work Force by Occupation (ISCO-88) and sex (%)
3.3.7 Job Tenure A question was asked on when the respondent started working for the current employer (for
employees and unpaid helpers in household business) or when (s)he started running the
current business (for own account workers). This was to determine the employment job
tenure of the work force (how long workers have been in their current employment). If
monitored for a period, such information can determine whether the employment security is
improving or deteriorating.
Table 3.8 indicates that overall, the mean number of years of working people in the current
employment was 5.7 years. The gender differentials show that overall, males have a job
tenure which is higher (6.2 years) than that of the females (4.9 years). Among the
occupations, legislators, senior officials, managers and administrators had the highest mean
tenure of 8 years. On the other hand, persons in elementary occupations (generally younger
than those in management positions) had the lowest mean tenure of 3 years. The mean
tenure of workers in the public sector (11.4 years) was double the mean tenure of the private
sector workers (5.6 years), while those working in private households had the lowest mean
years of tenure (4.3 years).
Occupation Male Female Total
Service workers, shop and market sales workers 30.0 48.5 37.5
Elementary occupations 16.7 14.4 15.7
Crafts and related workers 18.6 6.5 13.7
Associate professionals (diploma and certificate holders) 9.8 8.8 9.4
Professionals (graduates) 6.2 8.2 7.0
Plant and machine operators 10.6 0.8 6.6
Agricultural and fishery workers 4.9 8.4 6.3
Others 3.3 4.4 3.7
Total 100 100 100 Number (‘000s) 474 323 797
18
Table 3.8: Mean Years of Tenure with the Current Employment by Occupation and Sex
3.4 Weekly Hours Worked
Information on the number of hours worked help to gauge the intensity of work among the
employed population. Information was collected on the usual and actual hours worked per
week on the main job.
3.4.1 Weekly Hours Worked by industry
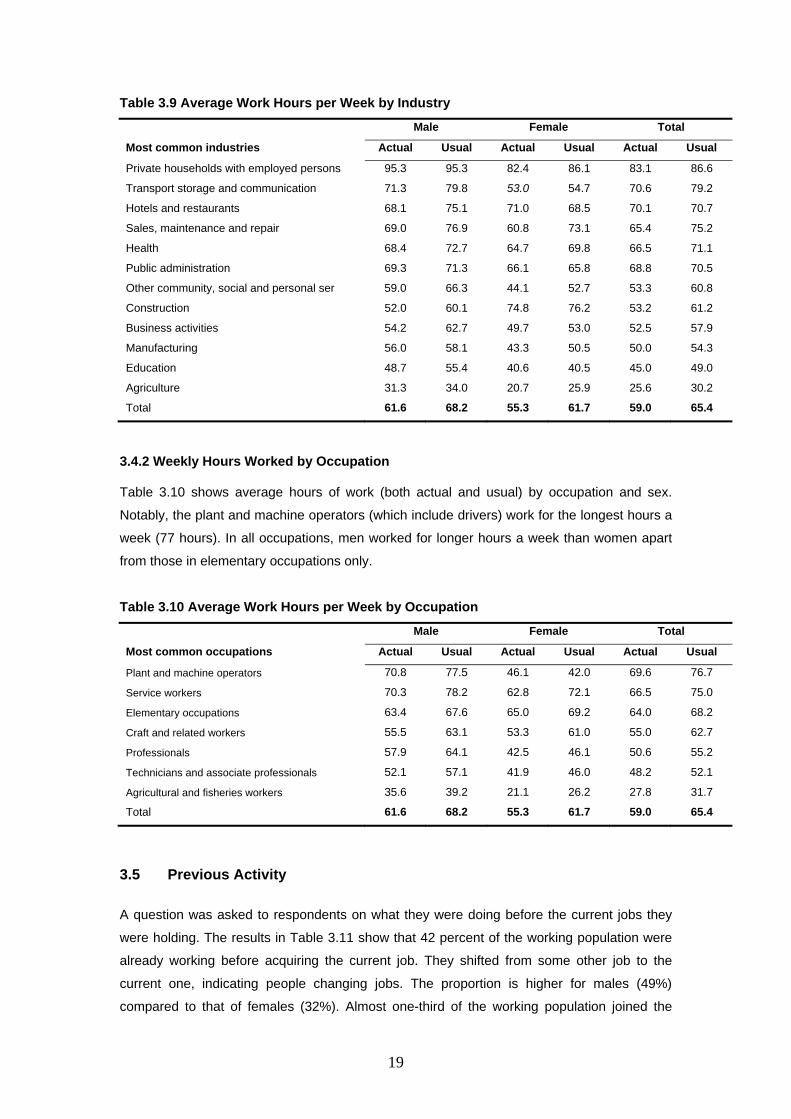
The average number of actual and usual hours per week on the main job is given in Table
3.9. Overall, the average actual number of hours worked per week on the main job was 59
hours (62 hours for males and 55 hours for females). On the other hand, overall, the average
usual number of hours worked per week on the main job was 65 hours (68 hours for males
and 62 hours for females). The average working hours (both actual and usual) vary widely
among the different sectors. The workforce in the private households with employed persons,
followed by those in transport storage and communication worked for the longest time of 83
and 71 hours a week respectively. The workforce in agriculture worked for the shortest
number of hours a week (26 hours). In almost all cases, respondents reported having actually
worked for fewer hours than the usual.
Occupation Male Female Total
Legislators, Managers, etc 10.7 3.6 8.1
Agricultural and fisheries workers 5.4 9.7 7.7
Technicians and Associate Professionals 7.1 8.9 7.7
Plant and machine operators 7.7 1.4 7.5
Craft and related workers 7.1 7.3 7.2
Professionals 7.1 5.9 6.5
Service workers 5.6 4.1 4.8
Elementary occupations 4.4 1.7 3.4
Place of work Public 10.7 12.9 11.4
Private 6.1 4.6 5.6
Private household 4.7 3.9 4.3
Total 6.2 4.9 5.7
19
Table 3.9 Average Work Hours per Week by Industry
Male Female Total
Most common industries Actual Usual Actual Usual Actual Usual
Craft and related workers 55.5 63.1 53.3 61.0 55.0 62.7
Professionals 57.9 64.1 42.5 46.1 50.6 55.2
Technicians and associate professionals 52.1 57.1 41.9 46.0 48.2 52.1
Agricultural and fisheries workers 35.6 39.2 21.1 26.2 27.8 31.7
Total 61.6 68.2 55.3 61.7 59.0 65.4
3.5 Previous Activity
A question was asked to respondents on what they were doing before the current jobs they
were holding. The results in Table 3.11 show that 42 percent of the working population were
already working before acquiring the current job. They shifted from some other job to the
current one, indicating people changing jobs. The proportion is higher for males (49%)
compared to that of females (32%). Almost one-third of the working population joined the
20
current working force from school, while 16 percent came from home making (domestic work
or household chores). Sex differentials indicate that the proportion of the current workforce
with the previous activity as homemaking was 5 percent for males and 33 percent for females.
Table 3.11 Distribution of Work Force by what was done before the current job
Previous activity Male Female Total
Working elsewhere 49.2 31.5 42.0
Student 36.0 27.8 32.7
Home maker 4.5 32.6 15.9
Looking for work 3.7 3.5 3.6
Others 6.6 4.6 5.8
Total 100 100 100
21
22
CHAPTER FOUR
UNEMPLOYMENT AND UNDEREMPLOYMENT
4.0 Introduction
Originally, unemployment was for use in macroeconomic analysis. The concept of
unemployment tended to reflect a situation of complete lack of work and to ensure that
employment is defined as work for at least one hour.
From the economic perspective, unemployment rate is criticised for failing to capture labour
market downturns in all contexts as people’s responses during downturns depend on specific
circumstances such as availability of unemployment or social insurance schemes and
channels and opportunities for seeking employment
The standard method of collecting employment and unemployment data uses a reference
period of one week. According to the 1982 ILO Resolution, a person who worked for at least
one hour in the reference week is regarded as employed, while a person who was “without
work”, “available for work”, and “actively seeking work” is counted as unemployed. Actively
seeking work can be signified by “registering at public or private employment exchanges,
direct application to employers, checking at worksites, farms, factory gates, market or
assembly places, placing or answering newspaper advertisements, seeking assistance of
friends or relatives, looking for financial resources, land, building, machinery, or equipment, or
permits or licenses to establish own enterprise”.
4.1 Unemployment
The Urban Labour Force Survey defined unemployment as:
(i) Without work during the reference week
(ii) Available for work during the reference week
(iii) Actively looking for work during the last 4 weeks
This is the same international definition, however in addition to computing the above standard
indicator of unemployment; the section compiles a range of unemployment indicators. These
are contained in Table 4.2.
23
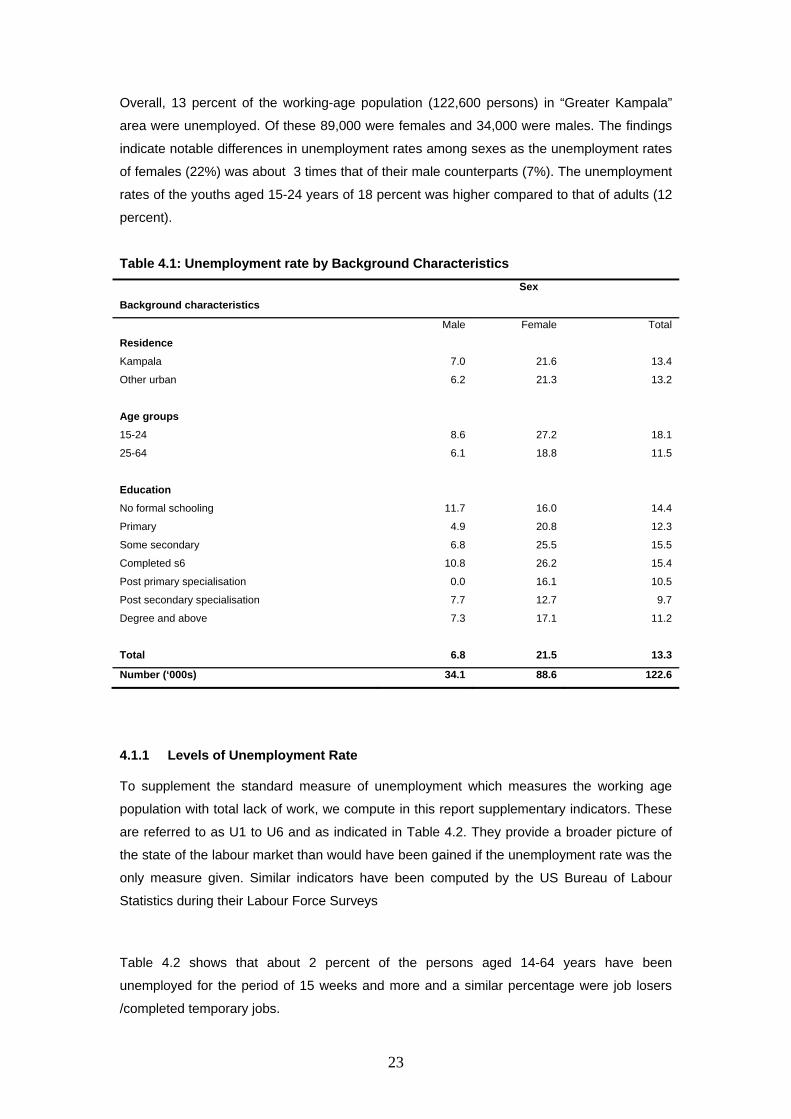
Overall, 13 percent of the working-age population (122,600 persons) in “Greater Kampala”
area were unemployed. Of these 89,000 were females and 34,000 were males. The findings
indicate notable differences in unemployment rates among sexes as the unemployment rates
of females (22%) was about 3 times that of their male counterparts (7%). The unemployment
rates of the youths aged 15-24 years of 18 percent was higher compared to that of adults (12
percent).
Table 4.1: Unemployment rate by Background Characteristics
Background characteristics Sex
Male Female Total
Residence
Kampala 7.0 21.6 13.4
Other urban 6.2 21.3 13.2
Age groups
15-24 8.6 27.2 18.1
25-64 6.1 18.8 11.5
Education
No formal schooling 11.7 16.0 14.4
Primary 4.9 20.8 12.3
Some secondary 6.8 25.5 15.5
Completed s6 10.8 26.2 15.4
Post primary specialisation 0.0 16.1 10.5
Post secondary specialisation 7.7 12.7 9.7
Degree and above 7.3 17.1 11.2
Total 6.8 21.5 13.3
Number (‘000s) 34.1 88.6 122.6
4.1.1 Levels of Unemployment Rate
To supplement the standard measure of unemployment which measures the working age
population with total lack of work, we compute in this report supplementary indicators. These
are referred to as U1 to U6 and as indicated in Table 4.2. They provide a broader picture of
the state of the labour market than would have been gained if the unemployment rate was the
only measure given. Similar indicators have been computed by the US Bureau of Labour
Statistics during their Labour Force Surveys
Table 4.2 shows that about 2 percent of the persons aged 14-64 years have been
unemployed for the period of 15 weeks and more and a similar percentage were job losers
/completed temporary jobs.
24
Table 4.2: Levels of unemployment rate
Male Female Total
U1- unemployed for 15 weeks or more 1.2 2.4 1.8
U2- job losers and persons who completed temporary jobs 1.8 1.8 1.8
U3- official unemployment rate 6.7 21.5 13.3
U4- Unemployed and discouraged workers 6.7 21.5 13.3
U5- unemployed and marginally attached Labour force 6.7 21.5 13.3
U6- unemployed , marginally attached and part-time worker for economic
reasons 7.1 21.6 13.6
4.1.2 Reasons for Unemployment
The reasons for unemployment are divided into four major groups:
(1) Job losers, defined as; (a) persons on temporary layoff, who have been given a date
to return to work or who expect to return within 6 months (persons on layoff need not be
looking for work to be classified as unemployed); (b) permanent job losers, whose
employment ended involuntarily and who began looking for work; and (c) persons who
completed a temporary job, and who began looking for work after the job ended.;
(2) Job leavers, defined as persons who quit or otherwise terminated their employment
voluntarily and immediately began looking for work;
(3) Re-entrants, defined as persons who previously worked but were out of the labour
force prior to beginning their job search;
(4) New entrants, defined as persons who had never worked but were searching for work.
Overall, 75 percent of the unemployed persons were entering the labour force for the first
time, followed by job losers with 15 percent (Figure 4.1). The findings show sex differentials
among sexes. There are more females entering the labour market for the first time, while
more males are job losers. This can be partly explained by women empowerment and the
conducive working environment which does not discriminate against women. The country has
in place labour laws that protect women in addition to promoting workplace equality between
men and women.
25
Figure 4.1: Reasons for being unemployed by sex
54
33
103
84
8 80
75
159
10
20
40
60
80
100
New Entrants Permanent Job Losers Job Leavers Completed Temporary JobMale Female Total
4.1.3 Youth Unemployment
Nationally, youths are defined as persons aged 18 to 30 years, while internationally they are
defined as aged 15 to 24 years.
Unemployment is high among the youth in the “Greater Kampala” areas. The youth
unemployment rate was recorded at 18 per cent for the youth aged 15-24 years and 16
percent for youth aged 18-30 years as shown in Table 4.3. The findings show a notable
difference of unemployment rates among sexes of youths. The unemployment rate for the
female youths aged 18-30 years of 25 percent was greater than that of their male
counterparts of 7 percent.
Table 4.3: Unemployed Youth by Selected Background Characteristics
Sex
Background
Characteristic Male Female Both sexes
Residence (18-30 years)
Kampala district 8.2 22.9 15.1
Others 4.6 28.3 17.0
Age group
Youth (15-24) 8.6 27.2 18.1
Youth(18-30) 7.2 24.6 15.7
26
Youth unemployment was highest among those with secondary and higher education and
those with no education (Figure 4.2)
Figure 4.2: Educational Status of Unemployed Youths
19
15
16
17
18
10
17
0 10 20
No formal schooling
Primary
Somesecondary
Completed s6
Post primary specialisation
Post secondary …
Degree and above
percent
4.2 Underemployment
Sometimes employed persons experience various forms of underemployment depending on
whether they experience insufficient hours of work, underutilization of their
skills/competencies, or low earnings. Time related underemployment refers to insufficient
volume of work. Due to scarcity of jobs, there is a section of the workforce that tend not to
fully utilise its education, skills and experience in the current employment. The skills related
underemployment concept refers to such a situation.
4.2.1 Time Related Underemployment
The under employed (time related) include all persons in employment who:
– Are willing to work additional hours in the present job, in an additional job, or in a new
job in replacement of current job
– Are available to work additional hours (within a specified period of time, given
opportunities for additional work)
– Worked less than the specified number of hours
During the Urban Labour Force Survey, the working age population that satisfied conditions 1
and 2 above and was engaged for less than 40 hours during the reference week, was taken
to be time rated underemployed.
27
Table 4.4 shows that, overall, in terms of time spent working, 12 percent of the workers were
time related under-employed in the “Greater Kampala” area. The rates were 15 and 8 percent
for males and females, respectively. The under-employment rate is lower for females than for
males, partly because the share of females engaged in domestic duties in addition to
economic activities is higher than that of males. The results did not show marked differences
in the time-related underemployment among ages and among metropolitan areas.
Table 4.4: Time-related Underemployment by Back ground Characteristics Sex
Background Characteristic Male Female Both sexes
Residence
Kampala 15.0 7.1 11.8
Other urban 15.3 9.7 13.0
Age group
15-24 16.7 6.5 12.0
25-64 14.3 8.4 12.0
Education levels
No formal schooling 35.6 11.3 20.4 Primary 13.4 6.2 10.3 Some secondary 13.6 8.0 11.3 Completed S6 13.0 0.0 9.6 Post primary specialisation 23.0 16.4 19.0 Post secondary specialisation 8.7 5.5 7.4 Degree and above 21.1 16.3 19.3
Sector of employment
Primary 4.8 2.5 3.6
Manufacturing 11.6 6.5 9.3
Service 16 8.4 13
Occupation
Plant and machine operators 23.1 0.0 22.0
Technicians and Associate Professionals 25.4 11.4 20.3
Professionals 24.2 9.4 17.1
Elementary occupations 12.3 16.7 13.9
Craft and related workers 12.4 13.1 12.5
Service workers 11.2 5.0 8.0
Agricultural and fisheries workers 5.8 2.4 3.9
Total 15.1 7.9 12.2
28
4.2.2 Skills Underutilisation
Skills underutilisation includes employed persons who, during the reference week were not
already categorised as time-related underemployed; and whose educational attainment were
higher than the educational level required by their current main jobs.
These include:
• Persons with second stage tertiary and higher education (6th or higher level of
education according to ISCED 1997) engaged in occupations falling in ISCO-88
major groups 3-9; associate professionals, clerks, service workers, shop and market
sales workers, agricultural and fishery workers, crafts and related workers, plant and
machine operators, and elementary occupations.
• Persons with the first stage of tertiary education (5th level of education according to
ISCED 1997) engaged in occupations falling in ISCO-88 major groups 4-9; clerks,
service workers, shop and market sales workers, agricultural and fishery workers,
crafts and related workers, plant and machine operators, and elementary
occupations.
• Persons with lower secondary or second stage of basic education, with upper
secondary education, and with post-secondary non-tertiary education (2nd, 3rd, and
4th level of education according to ISCED 1997) engaged in elementary occupations
(ISCO-88 major group 9);
Overall 13 percent of working persons had educational attainment higher than the educational
level required by their current main jobs. The percent was higher for the other urban areas
(16%) as compared to Kampala. The findings show sex differentials as more males (15%)
were affected compared to 10 percent of the females.
29
Table 4.5: Skill underutilisation by area, sex and age group
sex
Metropolitan Area Male Female Both sexes
Kampala City 13.2 8.8 11.4
Other urban 18.0 12.3 15.6
Age group
15-24 12.6 9.6 11.2
25-64 15.5 10.1 13.4
Total 14.7 9.9 12.7
4.2.3 Low Earnings
Low earners refers to wage/salary earners who were either employed full-time with low
monthly earnings or were employed less than full-time albeit with low hourly earnings or
overly employed with low earnings . Table 4.6 shows that overall 4 percent of the employed
persons were inadequately paid. The findings indicated that female employees were paid
less compared to males. Employees with no formal education are the most affected.
Table 4.6: Wage related inadequate employment by area, sex and age group
sex
Metropolitan Area Male Female Both sexes
Kampala City 4.0 5.2 4.6
Peri-urban 2.8 2.6 2.7
Age group
15-24 2.5 4.9 3.8
25-64 4.2 3.8 4.0
Education
No formal schooling 0.0 16.6 10.7
Primary 5.3 6.1 5.8
Some secondary 4.1 2.5 3.2
Completed s6 2.5 8.2 4.6
Post primary specialisation 0 0 0
Post secondary specialisation 1.7 4.8 3.1
Degree and above 1.6 0 0.9
Total 3.6 4.4 4.0
30
CHAPTER FIVE
INFORMAL EMPLOYMENT
5.0 Introduction
One of the challenges for the labour markets of developing countries is informal employment.
Contrary to the predictions of standard economic models that informal employment would
disappear or diminish with economic development, it remains, persistent and, in some regions
of the world, is even rising1. Informal employment, as defined by the 17th International
Conference of Labour Statisticians in 2003, refers to the total number of informal jobs,
whether carried out in formal sector enterprises, informal sector enterprises, or households”.
Informal employment includes: (1) own-account workers and employers employed in informal
sector enterprises; (2) family workers; (3) employees in informal jobs, whether employed in
formal sector enterprises, informal sector enterprises, or households; (4) members of informal
producers cooperatives; and (5) own-account workers engaged in production of goods
exclusively for own final use.
The informal sector represents a significant part of the economy, and certainly of the labour
market, in many economies, especially those in developing countries. It plays a major role in
employment creation, production and income generation. The informal sector enterprises are
normally characterised by a high degree of vulnerability. Workers have little or no legal or
social protection and are excluded from or have limited access to public infrastructure and
benefits. The available evidence indicates that informal sector employment tends to be far
more important in developing countries than in the developed countries.
The sum of informal sector employment and informal employment outside the informal sector
constitute the informal economy. In economies with high rates of population growth and/or
urbanisation, the informal economy tends to absorb most of the expanding labour force
especially in the urban areas. Informal economy employment is therefore a necessary
survival strategy in economies that lack social safety nets.
5.1 Employment in the Informal Sector
The ULFS 2009 included questions that were aimed at classifying workers into formal and
informal enterprises. For employers, own account workers and contributing family workers, 1 Charmes, J. 2000. “Size, Trends, and Productivity of Women’s Work in the Informal Sector.” Paper presented at the annual
IAFFE conference, Istanbul 15-17, August.
31
the sector of the enterprise employment was considered formal if the business at the place of
work was registered for Value Added Tax (VAT) and income tax , or the place of work was
government (national, local government or government controlled) or commercial bank. In the
case of employees, the sector of the enterprise was considered formal if at the place of work
the employer deducts income tax (PAYE) from the gross pay or had five or more other
persons working for the employer/business. In the two cases if the specified conditions did
not apply, then the place of work was regarded as an informal enterprise.
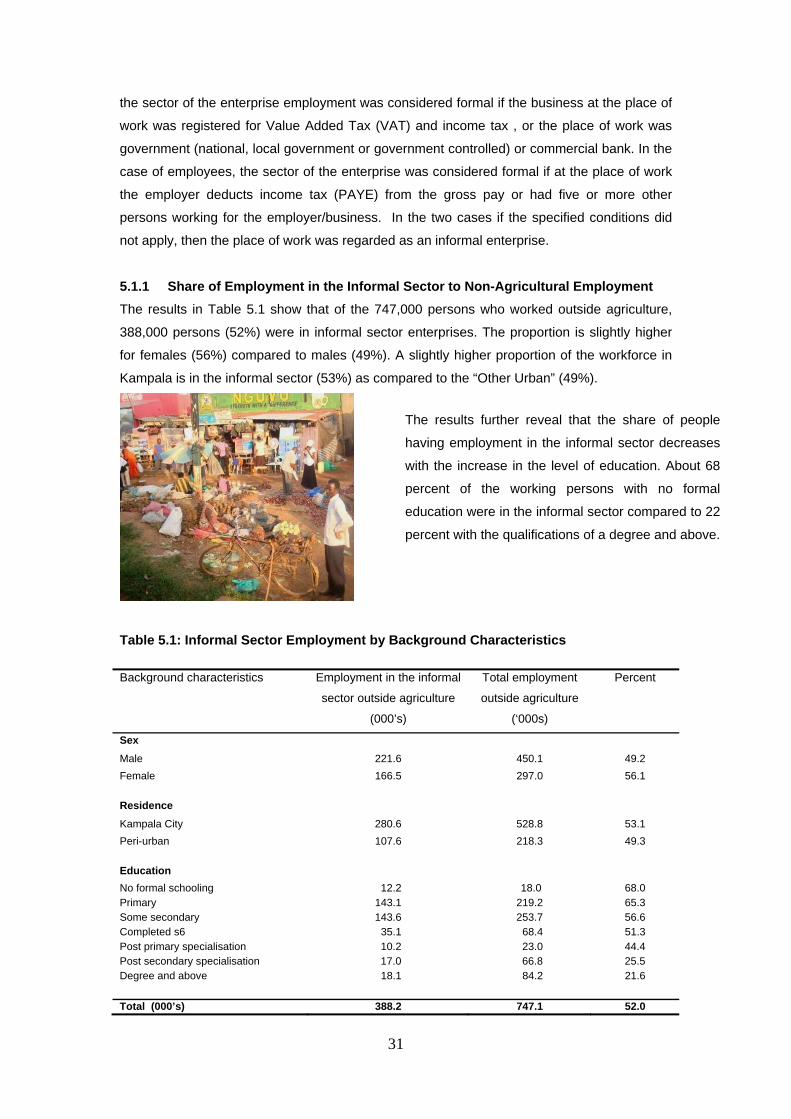
5.1.1 Share of Employment in the Informal Sector to Non-Agricultural Employment The results in Table 5.1 show that of the 747,000 persons who worked outside agriculture,
388,000 persons (52%) were in informal sector enterprises. The proportion is slightly higher
for females (56%) compared to males (49%). A slightly higher proportion of the workforce in
Kampala is in the informal sector (53%) as compared to the “Other Urban” (49%).
Table 5.1: Informal Sector Employment by Background Characteristics
Background characteristics Employment in the informal
sector outside agriculture
(000’s)
Total employment
outside agriculture
(‘000s)
Percent
Sex
Male 221.6 450.1 49.2 Female 166.5 297.0 56.1 Residence Kampala City 280.6 528.8 53.1 Peri-urban 107.6 218.3 49.3 Education No formal schooling 12.2 18.0 68.0 Primary 143.1 219.2 65.3 Some secondary 143.6 253.7 56.6 Completed s6 35.1 68.4 51.3 Post primary specialisation 10.2 23.0 44.4 Post secondary specialisation 17.0 66.8 25.5 Degree and above 18.1 84.2 21.6 Total (000’s) 388.2 747.1 52.0
The results further reveal that the share of people
having employment in the informal sector decreases
with the increase in the level of education. About 68
percent of the working persons with no formal
education were in the informal sector compared to 22
percent with the qualifications of a degree and above.
32
5.1.2 Status in Employment in the Informal Sector Table 5.2 below shows the distribution of employment in informal sector. Sixty five percent of
the informal sector employment were employers/own account workers. The proportion of
females employed in the informal sector as employers or owns account workers was higher
than that of males. The proportion of males who were paid employees in the informal sector
was 34 percent compared to 20 percent for females.
Table 5.2: Distribution of status in employment in the informal sector
Status in employment Men Women Total
Employers, and own-account workers 61.4 71.2 65.3
Contributing family workers 5.5 9.2 7.1
Employees 33.8 19.6 27.7
Total 100 100 100
5.2 Informal Employment
The ULFS 2009 included a set of questions to determine the formality of employment of the
working population. The questions administered to paid employees included:
a) Whether the employer was contributing to pension/retirement fund;
b) Employee entitlement to paid leave;
c) Employee entitlement to medical benefits; and
d) Deduction of income tax (PAYE) from employee’s wages.
For those engaged as employers, own-account workers and unpaid family helpers, questions
were asked whether the respective businesses were registered for VAT and income tax.
The totality of those in informal employment according to the ULFS included all persons
working on a household farm, all apprentices and:
(i) All employees who did not satisfy any of above categories (a)-(d)
(ii) All employers, own account workers and unpaid family helpers not registered for
income tax and VAT
5.2.1 Informal Employment in non-agricultural Employment The ULFS results show that most people engaged outside agriculture in the “Greater
Kampala” area were in informal employment. Table 5.3 indicates that about 470,000 persons
of the 747,000 working persons outside agriculture were in informal employment (63%). Sixty
33
one percent of males working outside agriculture were engaged in informal employment,
slightly lower than that of females.
Table 5.3: Informal employment outside Agriculture as a percentage of total employment outside Agriculture Male Female Total
Total employment outside agriculture (000’s) 450,114 296,958 747,071
Percentage 61.1 65.3 62.8
Figure 5.2 illustrates the share of urban informal employment to total employment in Sub-
Saharan countries. The share of urban informal employment is especially high, exceeding 70
per cent in case of Ghana, Uganda2 and Mali.
Figure 5.1: Share of urban informal employment to total employment for selected African countries
28
39
45
57
71
63
79
0 10 20 30 40 50 60 70 80 90
Ghana
Uganda
Mali
Cameroun
Kenya
Tunisia
Morocco
Source: ILO, 1999b.
2 The results for Uganda relate to 2009 whereas data for other countries relate to 1999.
34
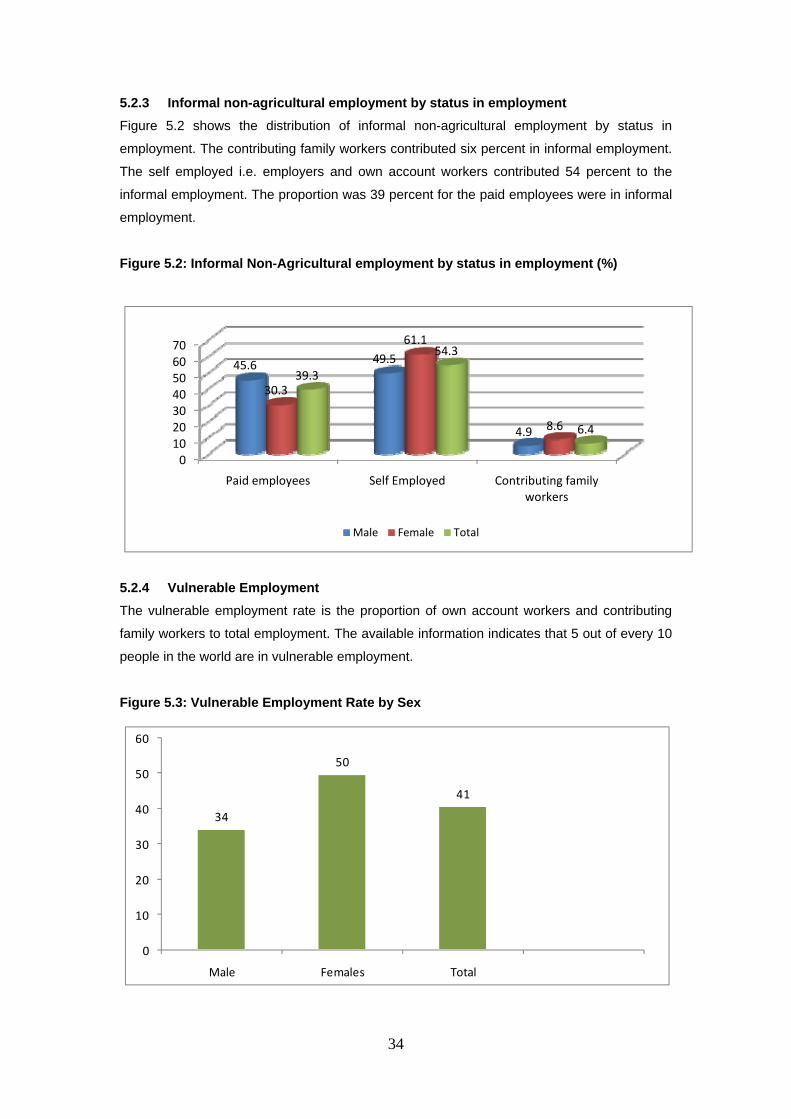
5.2.3 Informal non-agricultural employment by status in employment Figure 5.2 shows the distribution of informal non-agricultural employment by status in
employment. The contributing family workers contributed six percent in informal employment.
The self employed i.e. employers and own account workers contributed 54 percent to the
informal employment. The proportion was 39 percent for the paid employees were in informal
employment.
Figure 5.2: Informal Non-Agricultural employment by status in employment (%)
010203040506070
Paid employees Self Employed Contributing family workers
39.3
54.3
6.4
45.6 49.5
4.9
30.3
61.1
8.6
Male Female Total
5.2.4 Vulnerable Employment The vulnerable employment rate is the proportion of own account workers and contributing
family workers to total employment. The available information indicates that 5 out of every 10
people in the world are in vulnerable employment.
Figure 5.3: Vulnerable Employment Rate by Sex
34
50
41
0
10
20
30
40
50
60
Male Females Total
35
This group has a high risk of working informally and being unprotected. It hence has jobs that
leave it vulnerable to poverty and to risks such as low earnings, dangerous working conditions
and lack of health insurance. In the survey area, about 41 percent of the informally employed
were in vulnerable employment with a high proportion observed for the females as compared
to the males.
Table 5.4: Distribution of Informal Employment by Status in Employment and Type of Production Unit (All Branches of Economic Activity Excluding Agriculture)3
Status in employment General Informal Non Agricultural
Employment Males Females Total Males Females Total
Employers, own-account workers and
members of producers’ cooperatives48.4 56.9 51.9 50.1 57.8 53.3
Among the population in informal employment about 52 percent were owners of informal
sector enterprises while another 41 percent and 7 percent respectively were employees and
contributing family workers. While the proportion of females in informal employment working
as owners of informal sector enterprises is higher than that for males, the reverse holds for
those working as employees and was holding informal employment. The distribution of
informal employment in the non-agricultural employment did not differ significantly from the
general outlook, where about 53 percent were owners of informal sector enterprises, 41
percent were employees and 6 percent were contributing family workers.
5.2.5 Share of Informal Wage Employment to total Wage Employment The results in Table 5.5 show that the proportion of paid employees in the informal sector who
were informally employed was more than 2 times their counterparts in the formal sector (83%
against 33%). This variation is expected, given the fact that informal establishments are not
legally registered. In such a setting the security of jobs and other characteristics that would
qualify employees to be regarded as being in formal employment are more likely to be
compromised compared to the formal sector. High variations by sex were observed among
3 The comparisons including and excluding Agriculture in this chapter are limited since the survey was taken in “Greater
Kampala where only 6% of the population was involved in Agriculture.
36
formal sector employees where 37 percent of the males were in informal employment
compared to 26 percent of the females.
Table 5.5: Informal wage employment as % of total wage employment by type of employees Type of employees Males Females Total
Agricultural employees 100.0 100.0 100.0
Non-agricultural employees 47.7 44.5 46.6
Formal sector employees 36.5 26.0 33.4
Informal sector employees 82.1 84.6 82.9
Domestic workers employed by households 55.7 0 59.0
Total employees 48.7 44.5 47.3
5.2.6 Informal self-employment in relation to total self-employment
Persons in self-employment include the workforce who, during the reference period (the last 7
days), performed some work for profit or family gain in their establishments in cash or in kind
or had an enterprise but were temporarily out of work for a specified reason. They include
employers, own account workers and contributing family members.
Overall about 73 percent of the workforce in self-employment was in informal employment
with a higher proportion observed in the non-agriculture sector. Figure 5.4: Informal self-employment as percentage of total self-employment by branch of activity
33
1321
78 81 7974 71 73
0
20
40
60
80
100
Males Females Total
Agriculture Non‐agriculture Total
37
5.2.7 Informal employment in the formal sector Informal employment in the formal sector includes persons working in the formal sector but
their employment does not meet all the formal employment requirements. These include
registration for VAT and income tax as well as entitlement to paid leave, medical benefits, etc.
This accounted for about 15 percent of total employment with the share of women of the total
female employment outside the informal sector being slightly lower than their male
counterparts. About 14 percent of the employment in the non-agricultural sector was outside
the informal sector. Nearly all the workforce of informal employment outside the informal
sector (92%) was composed of employees.
Table 5.6: Informal employment outside the informal sector by selected characteristics Characteristic Males Females Total Proportion of Total employment 17.3 11.8 15.0 Percentage of non-agricultural employment 15.7 11.7 14.1 Type of Employment Contributing family workers 7.5 9.0 8.0 CFW: agriculture 7.5 9.0 8.0 CFW: formal sector 0.0 0.0 0.0 Employees 92.5 91.0 92.0 Employees: agriculture 6.1 0.0 4.1 Employees: formal sector 86.4 54.9 76.4 Employees: domestic work 0.0 36.1 11.5
Total 100 100 100
38
CHAPTER SIX
EARNINGS OF PAID EMPLOYEES
6.0 Introduction
The ULFS included a section which was used to elicit information on income from both those
individuals in self-employment and paid employment. Information was collected on different
modes of payment i.e. set piece, on the basis of sales, a combination of set piece and basis
of sales, in kind or some other way. The earnings of individuals were collected from all jobs in
which they were engaged. The analysis of Earnings in the report considers only those
individuals on paid employment. Therefore Income of those working as employers and own
account workers, rental income and other forms of income are excluded from the analysis in
this Chapter4.
The data on income of paid employees is classified into two types i.e. payments in cash or in
kind. The income from paid employees were collected basing on the mode of payment as
appropriate and were recorded as gross income, that is before the deduction of Pay As You
Earn (PAYE), National Social Security Fund (NSSF), or pension payments. During analysis
they were, for ease of comparison, converted into monthly payments.
6.1 Wages by Sector of Employment
Table 6.1 shows that overall, less than 15 percent of the wage earners received Ug shs
1,000,000 or more. The median monthly earnings for employees of public organisations/
Government controlled businesses was higher than for private enterprises and private
households. More than one tenth (12%) of wage earners in private enterprises received less
than Ug shs 100,000 monthly while the corresponding proportion for employees of private
households was 31 percent. Table 6.1 Monthly Wages and Mean Wages (‘000s) by Sector of Employment
Monthly wage Public/Government controlled business
Private Enterprise
Private Households Total
Less than shs 100,00 3.7 12.1 31.2 12.6
>=100,000- <300,000 35.0 47.5 55.9 46.2
>=300,000-<1,000,000 31.4 27.7 7.2 26.3
1 million and above 29.8 12.7 5.8 14.9
Total 100 100 100 100 Number of Employees 72 372 51 473
4 This is because of their informal nature and poor record keeping
39
6.2 Earnings by Selected Individual Characteristics
The amount of earnings of paid employees received increases as the level of education
increases. Table 6.2 indicates that the mean earnings of employees holding a post secondary
specialisation were 3 times those without formal education. The earnings of the workforce
holding a degree and above were more than 5 times those without any formal education. The
median earnings of persons who were under employed (time related) were almost the same
as for those who were not under employed both in the public and private sector.
Table 6.2 Median Monthly Wages (‘000 Ug Shs) by Selected Characteristics
Background Characteristic
Public /Government
controlled business Private Enterprise Total1
Residence Kampala 300 150 150
Other urban 340 180 200
Education No formal schooling 90 90 Primary 70 100 100 Some secondary 210 150 150 Completed s6 234 180 180 Post primary specialisation 200 170 170 Post secondary specialisation 350 200 270 Degree and above 850 500 508
Sex Male 270 200 200
Female 350 100 127
Under Employment Status (Time related)
Not Under Employed 300 150 150
Under Employed 320 150 150
Formality of Employment
Formal 300 200 200
Informal ‐ 120 120
Total 300 150 150
1 Includes 51 employees in private households
The results also show that the median earnings of persons in formal employment were higher
than those in informal employment. It is also worth noting that the difference in earnings of
employees in private enterprises by the nature of formality was higher as compared to public
organisations/Government controlled businesses. The formal employees working in private
enterprises earned more than 1.5 times their counterparts who were informally employed.
40
6.3 Wages by Occupation, Sector of Employment and Field of Specialisation
Table 6.3 shows that median monthly wages vary widely by occupation. While Legislators and
professionals earn median monthly wages of Shs 800,000, employees in all other
occupations earn a median wage of less or equal to Shs 200,000. Those in elementary
occupations are least paid, earning a median wage of only Shs 90,500 per month. The
median earnings in the public sector were generally higher than in the private sector.
Employees with a specialisation had median monthly earnings which was almost three times
those with no area of specialisation.
Table 6.3: Median monthly wages (‘000 Ug Shs) by Occupation, Sector of Employment and Specialisation Status
Technicians and Associate professionals 270 180 200
Clerks and service workers 160 130 130
Agriculture and fishery workers 120 140
Elementary Occupations 180 110 90.5
Crafts and related workers 500 181 200
Plant and Machine operators 320 181 181
Sector
Manufacturing 400 120 140
Service sector 300 150 150
Specialisation Status
Specialised 450 300 350
Not specialised 150 130 130
Total 300 150 150
1 Includes 51 employees in private households
41
CHAPTER SEVEN
WOMEN IN EMPLOYMENT
7.0 Introduction
Given the key role women play in the economy, improving their situation would go a long way
in transforming the economy as a whole. The MDG Goal 3 aims to promote gender equality
so that men and women and boys and girls have equal opportunities. One way of achieving
this would be to ensure that that they are able to access decent work opportunities. Therefore
access to full and productive employment and decent work is crucial for all, and decent work
deficits are among the primary causes of poverty and social instability.
7.1 Women in Employment
The contribution of women to the workforce is highest in agriculture self employment (59%)
and lowest in non-agriculture wage (34%). Figure 7.1 shows that overall women constituted
about 41 percent of the total workforce. At 59 percent, the share of women in Agricultural self-
employment was higher than that of their male counterparts.
Figure 7.1: Share of women in Employment by type of employment
7.2 Share of Women in Wage Employment in the Non-Agricultural Sector This indicator is the share of female workers in wage employment in non-agricultural sector
expressed as a proportion of total wage employment in the non-agriculture sector. This is
among the MDG indicators and it measures the extent to which women have equal access to
paid employment in the industry and service sectors.
41
53
59
40
34
36
46
47
51
0 10 20 30 40 50 60 70
Total employment
Agricultural employment
Agricultural self‐ employment
Non‐agricultural employment
Non‐agricultural wage employment *
Informal non‐agricultural wage employment
Non‐agricultural self‐employment
Informal non‐agricultural self‐employment
Contributing family workers
42
Table 7.1 shows that nationally the women share in wage employment in the non-agricultural
sector was about a third with minimal variations between those employed in
public/Government controlled businesses and private enterprises. Women receiving a wage
in the non-agricultural sector were however predominately employed in private households
where the proportion employed was about two times that of their male counterparts.
Education of the girl child increases the chances of women’s employment in wage non-
agricultural sector. In both public/Government controlled businesses and private enterprises
the share of women in wage employment with secondary education and above was about 1.5
times those with lower education levels. The share of women in wage employment who had a
professional area of specialisation was about 1.3 times as compared to those with no area of
specialisation.
Table 7.1 Share of Women in Wage Employment in the Non-Agricultural Sector
Background Characteristic Public/ Government controlled business
Private Enterprise
Private Households Total
Education
Did not complete secondary 20.1 25.7 60.5 30.6
Completed secondary and above 33.6 37.0 N/A 37.1
Residence
Kampala 30.7 32.1 64.4 34.8
Other Urban 26.6 21.4 68.2 29.6
Age
14-17 0.0 41.0 82.9 71.3
15-24 40.4 29.4 79.0 39.4
18-30 41.1 32.1 62.7 35.8
14-64 28.9 29.4 63.3 33.1
Sector of Employment
Service 30.2 33.8 72.1 37.7
Manufacturing N/A 21.2 0.0 19.9
Specialisation Status
With a field of specialisation 35.3 40.8 100.0 40.5
With no specialisation 19.3 25.1 57.7 29.2
Total 28.9 29.4 63.3 33.1 N/A- Few observations so indicator not shown
The share of women youths in wage employment in the non-agricultural sector was higher in
the public sector than in the private sector. Girls aged 14-17 years were predominately
43
employed in either private enterprises or private households. This can be partly explained by
the use of young girls as house helpers/maids in private households. The results also
indicate that the proportion of women earning a wage in the service sector was about 2 times
those in the manufacturing sector.
44
CHAPTER EIGHT
INVOLVEMENT OF CHILDREN IN WORK AND SCHOOLING
8.0 Introduction
This section looks at the time use patterns of children in the “Greater Kampala” area, focusing
in particular on the extent of children’s involvement in work and schooling. The survey
collected information on children’s work and time uses of children aged 5-17 years, including
children’s involvement in economic activity and household chores.
8.1 Involvement in Economic Activities
Figure 8.1 shows that overall, about 8 percent of the children are working. This includes 3
percent engaged in economic activity only and 5 percent combining economic activity with
schooling. These child workers constitute a particular policy concern, as they are most
vulnerable to workplace abuses, and most at risk of work-related ill-health or injury. They are
also most affected by compromised education.
The findings in Table 8.1 point to the fact that the proportion of orphans involved in economic
activity was almost three times (16%) their counterparts who were not orphans (6%). In
addition the share of orphaned children who were idle5 (18%) was higher than that of the
non-orphans (13%).
5 Neither at school nor in economic activity
Orphans represent one of the most
vulnerable groups in Uganda and
are recognised in both the Policy
on Orphans and other Vulnerable
Children, the National Strategic
Plan on OVC and the National
Child Labour Policy (NCLP).
45
Figure 8.1: Involvement of Children in Work and Schooling
79
5
143
Attending school only Economic activity & School None Economic activity Only
Some working children in “Greater Kampala” are also students. The results indicate that
about 5 percent of children aged 5-17 years ( about 29,000 in absolute numbers) are working
but also in school; with a slightly lower proportion for Kampala City (4%) as compared to the
rest of “Greater Kampala” (7%). The Table further shows that a higher proportion of girls were
neither schooling nor working (15%) compared to boys (12%).
Table 8.1: Child Activity Status, by sex and Metropolitan areas
Involved in eco. activity
only Attending
school only
Involved in eco. activity
and attending school
Not involved in eco. activity and not in
school Total eco.
Active
Total attending
school
Total Children
(I) (II) (III) (IV) (V)
=(I)+(III) (VI)
=(II)+(III) (VII
(V)+(VI Boys 2.6 80.0 5.6 11.8 8.3 85.6 100
Girls 3.4 77.7 3.6 15.3 7.0 81.3 100
Kampala 2.4 80.8 3.7 13.1 6.1 84.5 100
Other urban 4.2 74.6 6.6 14.6 10.8 81.2 100
Non orphan 1.8 81.4 4.2 12.7 6.0 85.5 100
Orphan 9.2 65.4 7.1 18.4 16.3 72.5 100
Both sexes 3 78.8 4.6 13.6 7.6 83.4 100
Number (‘000s) 19.0 500.8 29.4 86.2 48.4 530.2 635.4
Notes: (i) Regardless of school attendance status; (ii) Regardless of economic activity status. A child is considered to be economically active if he or she spent at least one hour per week in work for “payment/non-payment, profit, family gain or own final use of consumption” or “did not work but had a job with assurance for returning.”
Figure 8.2 below shows that by age 6 only about 70 percent of children have enrolled in
school, the other 30 percent being economically inactive. The highest enrolment is recorded
46
at age 12 years (about 98%), with about 10 percent of this children combining schooling with
work. By the time the children reach the age of 17 years only about two-thirds of them are still
in school. Also involvement in economic activities by the children is high.
Figure 8.2 :Child activity status, by child age
0
10
20
30
40
50
60
70
80
90
100
6 7 8 9 10 11 12 13 14 15 16 17
perce
nt
AGE IN YEARS
school only eco. activity and school eco. activity only neither
Notes: (1) “Economically active” refers to all children in economic activity, regardless of school status; (2) “Attending school” refers to all children attending school, regardless of work status.
8.2 Activity status and Occupations of working children age 5-17 years
Overall about two-thirds of children were employed as contributing family workers with a
higher proportion of boys (80%) recorded here as compared to girls (49%). More children were employed as service workers (38%) as compared to other occupations.
47
Table 8.2: Activity status and Occupations of working children age 5-17 years
Activity Status Boys Girls Both sexes
Contributing family worker 80.0 49.4 65.8
Employee 15.5 45.5 29.5
Self employed 2.8 5.1 3.9
Apprentice 1.7 0.0 0.9
Occupation
Service workers 45.2 30.1 38.3
Elementary occupations 11.1 53.1 30.4
Agricultural and fishery workers 39.2 16.8 28.9
Craft and related workers 4.5 0 2.4
Total 100 100 100
8.3 Child labour
This section looks at the extent to which children’s work constitutes “child labour”, i.e., the
extent to which work is injurious, negative or undesirable to children,6. Such information is
critical for policy design and policy targeting purposes.
The child labour legislation falls directly under the administration of the Ministry of Gender,
Labour, and Social Development. The major labour laws are the Employment Act (No. 6) of
2006 and the Occupational Safety and Health Act No. 9, 2006. Section 32 (4) of the
Employment Act (2006) prohibits the employment of children in any work that is injurious to
the child’s health, dangerous or hazardous or otherwise unsuitable. Section 32 (1) of the Act
states that “.... a child under the age of 12 years shall not be employed in any business,
undertaking or workplace.” Clause (2) of Section 32 states that “... a child under the age of 14
years shall not be employed in any business, undertaking or workplace, except for light work
carried out under the supervision of an adult aged over 18 years, and which does not affect
the child’s education.” The Occupational Safety and Health Act No. 9, 2006, provides for the
inspection of work places, identification of hazards at the work place and other connected
matters.
6 Implicit in this distinction is the recognition that work by children per se is not necessarily injurious to children or a violation of
their rights. Indeed, in some circumstances, children’s work can be beneficial, not harmful, contributing to family survival and enabling children to acquire learning and life skills.
48
Figure 8.3 Distinction between child labour and other forms of child work
AGE GROUPS
FORMS OF WORK Non-hazardous work
(in non-hazardous industries and occupations and not for
excessive hours) Hazardous work (in specified
hazardous industries and occupations) or excessive hours
Light work
Regular
(“non-light”) work
5-11 years
12-13 years
14-17 years
Source: ILO/IPEC
Child Labour includes all work for those aged 5-11 years, regular non-light work for those in
the age category 12-13 years and hazardous work or those working excessive hours for
children aged 14-17. This is in accordance with the National legislation.
CHILD LABOUR TO BE ELIMINATED
PERMITTED FORMS OF
WORK
49
Table 8.3: Lower-bound Estimate of Child Labour Involvement
sex
(a) children aged 5-11 years in economic
activity
(b)children aged 12-
13 years in economic activity excluding those in
light economic activity(i)
(a)&(b)
Total in child labour,
5-13 years
(c) Children aged 14-
17 years in hazardous work
or working excessive hours(ii)
(a)&(b)&(c)
Total in child labour,
5-17 years(iii)
% of
total
children
No.(‘000s)
% of
total
children
No.(000’s)
% of
total
children
No.(000s)
% of
total
children
No.(000s)
% of
total
children
No.(000s)
Boys 2.2 6.9 0.5 1.6 2.7 8.5 3.4 10.7 6.2 19.3
Girls 1.0 3.2 1.2 3.8 2.2 7.1 3.6 11.7 5.8 18.7
Both 1.6 10.2 0.9 5.5 2.5 15.6 3.5 22.4 6.0 38.0
Notes: (i) National child labour legislation allows light work for 12-13 year-olds. The definition of “non-light” work used
in ILO/IPEC global estimates (i.e., work equal to or exceeding 14 hours per week) in addition to work less than this
time threshold in hazardous sectors, is therefore used in the calculation included in column B. (ii) Includes 14-17
year-olds in hazardous industries and occupations, and those working 43 or more hours per week. Hazardous work
is identified following the procedure used in the ILO/IPEC Global Estimates. Hazardous industries in ILO/IPEC draft
list are: mining, quarrying and construction. Exclusive of children also in hazardous industries. Hazardous
occupations in ILO/IPEC draft list are: optical and elect equip operators; health associated professional; nursing
midwife; protective services; forestry and related workers; fishery, hunters and trappers; miners, shot fires, stone
cutters and carvers; building frame and related workers; building finishers; metal moulders, welders, and related
workers; blacksmith, tool makers and related workers; machinery mechanics and fitters; electrical and electronic
equip mechanics and fitters; precision workers in metal; potters, glass makers and related workers; mining and
mineral processing plant operators; metal processing plant op.; glass, ceramics and related plant op.; wood
processing & papermaking plant op.; chemical processing plant op.; power production and related plan operators;
metal and mineral machine operators; chemical machine operators; rubber mach. op; wood products mach. op.;
textile, fur, leather mach. op.; food mach. op.; assemblers; other mach. op.; motor vehicle driver; agric and other
mobile plant op.; ships' deck crew and related workers; street vendors and related workers; shoe cleaning other
street services; messengers, porters, doorkeepers, and related workers; garbage collectors and related workers;
agric. fishery and related workers; mining and construction labourers; and transport and freight handlers. Exclusive of
children in hazardous industries and/or in hazardous occupations, excessive hours defined as >43 hours per week
(iii) Does not include children in unconditional worst forms.
The results show that a total of about 10,000 children (2% of boys and 1% of girls) aged 5-11
years were involved in some economic activity. The findings also indicate that another 6,000
children aged 12-13 years were involved in non-light work economic activity, while 22,000
aged 14-17 years were in hazardous work or working excessive hours. Overall 6 percent of
children in the “Greater Kampala” area (about 38,000 in absolute terms) were engaged in
child labour, with minimal variations by sex of the child.
50
CHAPTER NINE
POPULATION NOT IN THE LABOUR FORCE
9.0 Introduction
The population not in the labour force (also referred to as the economically inactive
population) are those persons aged 14 to 64 years who during the reference period (last 7
days) were neither working nor actively looking for work, because of various reasons which
includes attending school, attending to household domestic duties, retirement or old age, not
interested in working, disability etc. Their activities are outside the economic activity as
defined by United Nations Systems of National Accounts (SNA).
9.1 Inactivity Rates by Background Characteristics
The inactivity rate is the proportion of the population that is inactive (not in the labour force) to
the total working age population. Of the 1.4 million working age population, 458,000 persons
were economically inactive (Table 9.1). The proportion was almost similar by residence but
was higher for females (43%) compared to that of males (23 %).
There were variations in economic inactivity rates by levels of education. Persons with some
secondary education (partial or completed) had the highest inactivity rates partly due to
despising work. The inactivity rate among the females who had completed post-secondary
specialisation and those with a degree and above were 20 percent and 11 percent
respectively. In comparison to the males with the same level of education, the rates were 5
percent and 0 percent
51
Table 9.1: Inactivity Rate by Background Characteristics
Inactivity rates
Background Characteristic Male Female Total
Residence
Kampala 22.7 45.3 34.2
Other urban 26.6 43.4 35.1
Education
No formal schooling 22.1 28.7 26.3
Primary 23.0 46.8 35.6
Some secondary 31.8 53.4 43.3
Completed s6 32.3 53.6 40.2
Completed post primary specialisation 7.2 11.5 10.1
Completed post secondary specialisation 4.7 20.0 11.4
Completed degree and above 0.0 10.5 4.4
Age 14
15-24
76.9
49.7
94.2
59.0
87.2
54.8
25-64 4.6 29.0 16.2
Total 22.8 42.7 32.8 Number (000’s) 157.1 301.0 458.1
There are variations by age in the inactivity rates. The inactivity rate was highest among those
aged 14 (87% overall) and declines with age, reaching the lowest level of 16 percent in the
age group of adults (25-64) as indicated in Table 9.1. There is also an indication that more
males enter the labour force at the tender age of 14 to 24 compared to the females since the
inactivity rates of the males is lower than that of females at low ages (Table 9.1). The high
inactivity rates exhibited between the ages of 14 to 24 can be explained partly by the fact that
this is a school going age and many persons are still in the school system. At higher ages
(25-64 years), a higher proportion of the females (29%) were economically inactive as
compared to the males (5%).
52
9.2 Reasons for Not Being in the Labour Force
As indicated in Table 9.2, full time students accounted for 74 percent of the total economically
inactive population. The proportion attending school (full time students) is much higher for
males (87%) than for females (66%). Those taking care of house or family matters, which
includes household chores like cooking, fetching water, washing utensils and clothes,
cleaning the house and compound, accounted for 19 percent of the economically inactive
population. The proportion of women engaged in Household chores (27%) was higher than
that for men (only 4 percent). This could be attributed to the cultural tendencies in society that
regard housework as a domain of females.
Table 9.2: Reasons for Economic Inactivity
Reason Male Female Total
In school (full time student) 87.9 65.9 74.1
Taking care of house and/or family 3.9 27.4 18.6
Ill/sick 3.3 0.9 1.8
Others 4.9 5.9 5.5
Total 100 100 100
53
CHAPTER TEN
POLICY IMPLICATIONS
10.1 Policy Recommendations
Skills training A high proportion of Ugandans, especially the youth finish school without the appropriate set
of skills demanded by employers. In response, governments can provide public-funded
training or financial support for private provision of such measures, which can focus on either
general training or more specific vocational skills. Labour Intensive –Job creation Programmes Introduction of such programmes could include afforestation and other infrastructure
development, especially road maintenance and construction in the country.
Family Planning Households should have manageable family sizes. Government should promote programmes
that encourage the small family size norm.
Under employment Recommendations for the reduction of under utilisation of labour include
• Encouragement of diversification and mixed agricultural production
• Promotion of irrigation schemes
• Education of farmers on what to produce and when
• Facilitation of market outlets for products
• Provision of loan schemes to the workers in the primary sector to enable them
increase their production on the farms
Social Protection In many sectors, especially in the commercial agriculture sector, workers are exploited i.e.
very little pay is given for their produce. Many of those in wage employment are paid very
low salaries/Wages that cannot enable them afford basic requirements. Government should
put in place a minimum wage to protect the vulnerable workers who cannot negotiate better
wages with the employers. This will facilitate them more out of poverty.
54
Improve the match between Skills and Labour Demand While the focus of policy has been on basic education and primary schooling, it is also
apparent that a lot need to be done to develop the skills of young people. Skill mismatch is a
major concern where educated youths acquire skills that are not required by the labour
market. One approach to tackle the problem of a skill mismatch is to combine formal
education with work-based training
Effective Labour Market Information System (LMIS). Put in place an effective LMIS that will inform and advice the labour market participants on
what choices to make in the market
55
Appendix I: Glossary of Labour Terms
Contributing family workers – Members of the household who work in an enterprise
operated by the household without getting pay or profit.
Decent Work - Opportunities for women and men to obtain decent and productive work in
conditions of freedom, equity, security and human dignity’. Economically Active Population – All persons aged 14-64 years were either working or
actively looking for work. They therefore include both the employed and unemployed persons.
Economic Activity - Work which involves the production of goods and/or services for sale or
exchange and production of certain products for own consumption. This excludes household
duties like caring for the sick, cooking food, collecting children from school, fetching water,
etc.
Economically Inactive Population - Refers to all persons aged 14-64 years who were not
engaged in economic activities during the reference period (seven days prior to the survey
date) and did not look for work.
Employed Persons - Persons are considered to be employed if they are of specified age (14
to 64 years) and they performed any work at all, for pay or profit (or pay in kind) during a
specified brief period (one week), or were temporarily absent from a job, for such reasons as
illness, holidays or industrial dispute during that period. They include those who were working
without pay in a family business or farm for at least one hour during the reference period.
Employment-to-population ratio: The employment-to-population ratio is the proportion of
the working-age population that is employed. It is derived by dividing the total number of
employed person aged 14-64 years by the population of the same age group
Industry – The type of economic activity carried out by an enterprise where a person is
working,
Irrespective of what work the person actually does there.
Job losers: The job losers are categorised into; (a) persons on temporary layoff, who have
been given a date to return to work or who expect to return within 6 months (b) permanent job
56
losers, whose employment ended involuntarily and who began looking for work; and (c)
persons who completed a temporary job, and who began looking for work after the job
ended.;
Job leavers: The job losers are persons who quit or otherwise terminated their employment
voluntarily and immediately began looking for work;
Levels of Employment (U-1 to U-6)
U-1: Persons unemployed 15 weeks or longer, as a percent of the total labour force
U-2: Job losers and persons who completed temporary jobs, as a percent of the total labour
force
U-3: Total unemployed persons, as a percent of the total labour force (the official
unemployment rate)
U-4: Total unemployed persons plus discouraged workers, as a percent of the total labour
force plus discouraged workers
U-5: Total unemployed persons, plus discouraged workers, plus all other "marginally
attached" workers, as a percent of the total labour force plus all "marginally attached" workers
U-6: Total unemployed persons, plus all "marginally attached" workers, plus all
personsemployed part-time for economic reasons, as a percent of the total labour force plus
all "marginally attached" workers
Looking for Work – Persons aged 14-64 years and who were without work during the
reference period and had taken specific steps in a specified recent period to seek paid
employment or self-employment.
Marginally attached Workers: These are persons who are currently neither working nor
looking for work but indicate that they want and are available for a job and have looked for
work sometime in the recent past. Discouraged workers, a subset of the marginally attached,
have given a job-market related reason for not looking currently for a job. Persons employed
part time for economic reasons are those who want and are available for full-time work but
have had to settle for a part-time schedule.
New Entrants: These are defined as persons who did not work during the reference period
but were searching for work.
57
Occupation – The actual work that an individual does at the place of work. This is
irrespective of the main activity that the organisation he/she is involved in.
Re-entrants: defined as persons who previously worked but were out of the labour force prior
to beginning their job search;
Share of women in wage employment in the non-agricultural sector: ions
The indicator is the proportion of female workers in wage employment in the non-agricultural
sector expressed as a percentage of total wage employment in the non-agricultural sector.
Usual activities: Usual economic activities refer to the main activity status during a reference
period of one year, i.e. the 12 months preceding the interview date.
Vulnerable employment rate: Proportion of own-account and contributing family workers in
total employment. This indicator captures the proportion of workers whom are less likely to
have formal work arrangements, and are therefore more likely to lack elements associated
with decent employment. .
Q
Working Population – All persons aged 5 years and above whose Activity Status was paid
employee, self employed or unpaid family worked.
58
Appendix II: Sampling Errors
There are two types of errors associated with sample surveys namely non-sampling and
sampling errors. Non-sampling errors occur during the different implementation processes of
the survey including data collection, data editing, coding, data processing etc. While a number
of steps were taken during the implementation of the Urban Labour Force Survey to minimize
on the non-sampling errors, it is difficult to avoid them and statistically evaluate.
Statistical analysis provides means of evaluating sampling errors. Sampling errors occur
because observations are based on only one of the many samples that could have been
selected from the same population using the same design and expected size. Sampling
errors are a measure of the variability between all possible samples. They are usually
measured using Standard Errors (SE), the square root of the variance. In addition it is
sometimes necessary to measure the relative errors of the study variables and the Coefficient
of Variation (CV), which is the SE divided by the mean of the variable of interest.
Information on the SE, Confidence Intervals and CVs of the main variables of the ULFS are
shown in Appendix AII below. While computing the SE the multi-stage nature of the survey
design of the ULFS was put into consideration.
59
AII: Sampling Errors for the ULFS main variables
Variable
Value R
Standard Error
Relative error (SE/R) 95% Confidence limits
Number of Observations
Lower Upper
Population 2,202,548 214,487 0.097 1,773,794 2,631,302 2,742
Labour force 919,430 93,008 0.101 733,511 1,105,349 1,143
LFPR 0.692 0.013 0.019 0.665 0.718 1,648
Education of the labour force
No formal schooling 0.024 0.006 0.247 0.012 0.035 1,124
Primary 0.293 0.018 0.062 0.257 0.330 1,124
Some secondary 0.365 0.017 0.047 0.330 0.399 1,124
Completed s6 0.098 0.009 0.093 0.079 0.116 1,124
Post primary specialisation 0.030 0.008 0.260 0.015 0.046 1,124
Post secondary specialisation 0.084 0.011 0.134 0.062 0.107 1,124
Degree and above 0.106 0.015 0.137 0.077 0.135 1,124
Working population 796,794 78,907 0.099 639,061 954,527 990
Employment Population Ratio 0.600 0.013 0.022 0.574 0.625 1,648
Status in employment
Working for someone else for pay 0.498 0.021 0.042 0.457 0.540 990
An employer 0.067 0.012 0.179 0.043 0.091 990
An own account worker 0.332 0.018 0.055 0.295 0.368 990
Contributing family workers 0.050 0.011 0.216 0.028 0.071 990
An apprentice 0.014 0.004 0.299 0.006 0.023 990
Working on a household firm 0.039 0.014 0.366 0.011 0.068 990
Working for someone else for pay 0.498 0.021 0.042 0.457 0.540 990
Self employed 0.502 0.021 0.041 0.460 0.543 990
Industry of the main job
Agriculture 0.062 0.018 0.291 0.026 0.098 990
Manufacturing 0.086 0.016 0.185 0.054 0.118 990
Construction 0.053 0.009 0.167 0.035 0.071 990
Sales, maintenance and repair 0.293 0.021 0.070 0.252 0.335 990
Hotels and restaurants 0.073 0.012 0.172 0.048 0.098 990
Transport, storage and communications 0.079 0.009 0.112 0.061 0.097 990
Business activities 0.068 0.010 0.152 0.047 0.089 990
Public administration 0.044 0.010 0.228 0.024 0.064 990
Education 0.038 0.007 0.176 0.025 0.052 990
Health and social work 0.033 0.008 0.242 0.017 0.049 990 Other community, social and personal activities 0.104 0.014 0.137 0.076 0.133 990
Appendix III: Children's work and child labour: a note on terminology
Terminology and concepts used for categorising children’s work and child labour (and in distinguishing between the two) are inconsistent in published statistics and research reports, frequently creating confusion and complicating cross-country and longitudinal comparisons. In this study, “children’s work”, is used broadly to refer to all productive activities performed by children. Productive activities, in turn, are defined as all activities falling within the general production boundary, i.e., all activities whose performance can be delegated to another person with the same desired results. This includes production of all goods and the provision of services to others within or outside the individual’s household. The study distinguishes between two broad categories of children's work – economic activity and non-economic activity. The definition of "economic activity" used in the study derives from the System of National Accounts (SNA) (rev. 1993), the conceptual framework that sets the international statistical standards for the measurement of the market economy. It covers all market production and certain types of non-market production, including production of goods for own use. "Non-economic activity" is defined as any productive activity falling outside the SNA production boundary. It consists mainly of work activities performed by household members in service to the household and its members.
The term “child labour” is used to refer to the subset of children’s work that is injurious, negative or undesirable to children and that should be targeted for elimination. It can be either economic or non-economic in nature, though most published estimates refer only to the former. Three main international legal standards – the UN Convention on the Rights of the Child (CRC), ILO Convention No. 182 (Worst Forms) and ILO Convention No. 138 (Minimum Age) – provide the legal definition of child labour and a framework for efforts against it. There is not an agreed international statistical definition of child labour, as child labour is defined by national legislation within the framework of the international legal standards.
62
Appendix IV: PERSONS INVOLVED IN THE 2009 URBAN LABOUR FORCE SURVEY
Management J. B. Male‐Mukasa, Executive Director
Ben Paul Mungyereza, Deputy Executive Director A.L.Mukulu, Director Population Social Statistics
W. Nyegenye – Principal Statistician‐ Social statistics V. F. Ssennono, Senior Statistician‐ coordinator
S. Kyewalanga, Statistician D. Nabukwasi Statistician
GDDS II project 2006 – 2009, World Bank ‐ Technical Support Ronald Luttikhuizen‐ Manager of General Data Dissemination System (GDDS) II
Technical support Edwin L. Robison‐ sampling Expert
Stephanie white‐ Questionnaire Design Graf, Brian ‐ BLS
Supervisors Mugweri sam Birungi sarah Kavuma patrick Editors Namugenyi joanitaJoyce tabingwa Interviewers Nabandeke syliviaKhisa pamela Kyomuhangi annette Ntambi brian jovanTalemwa phionahMwebaza aisha Nakijoba susan Nakiranda victoriaMawooko isaac Nakanwagi dorothy Makonje grace. K.Sekabembe solomon
Data entrants Sarah nampera Nabukalu sharifah shidah
63
Appendix V: The ULFS Questionnaire
64
THE REPUBLIC OF UGANDA
UGANDA BUREAU OF STATISTICS
URBAN LABOUR FORCE SURVEY
SECTION A: IDENTIFICATION PARTICULARS
STRATUM 1. DISTRICT: 2. SUB-STRATUM: (Urban = 1, Other urban = 2, Rural = 3) 3. COUNTY: 4. SUB-COUNTY: 5. PARISH: 6. EA: 7. HOUSEHOLD SER. NO.: 8: SAMPLE NO.: 9 NAME OF HOUSEHOLD HEAD: 10. LOCATION ADDRESS OF HOUSEHOLD:
THIS SURVEY IS BEING CONDUCTED BY THE UGANDA BUREAU OF STATISTICS UNDER THE AUTHORITY OF THE UGANDA BUREAU OF STATISTICS ACT, 1998. THE UGANDA BUREAU OF STATISTICS P.O. BOX 7186, KAMPALA, TEL: 0414 - 706000, 041 - 706000 Fax: 0414 - 237553 E-mail:[email protected] Website: www.ubos.org
SECTION B: STAFF DETAILS AND SURVEY TIME 1. NAME OF INTERVIEWER DD MM YYYY DD MM YYYY DD MM YYYY 2. DATE OF INTERVIEW First attempt Second attempt Third attempt H H M M H H M M H H M M 3. START TIME First attempt Second attempt Third attempt 4.END TIME 5. RESPONSE CODE FIRST ATTEMPT 1 Completed Remarks by interviewer 2 Partially completed 3 Not done SECOND ATTEMPT 1 Completed Remarks by interviewer 2 Partially completed 3 Not done THIRD ATTEMPT 1 Completed Remarks by interviewer 2 Partially completed 3 Not done 6. NAME OF SUPERVISOR DD MM YYYY 7. DATE OF INSPECTION BY SUPERVISOR FOR OFFICE USE ONLY 8. NAME OF OFFICE EDITOR/SCRUTINIZER 9. NAME OF DATA ENTRY OPERATOR DD MM YYYY 10. DATE OF DATA ENTRY
66
Section R: Household Roster We would like to make a complete list of household members.
Names
Residence Status
Sex
Relationship Date of Birth Age Marital status (For those aged 10 years and above)
Living paren(For those
below 18 yeaP E R S O N I D
A What is the name of the head of this household? (This is usually the person who is the main decision maker, who manages the income/expenses of the household, or who owns or rents the house.) B What are the names of the other members of this household? C. Are there any other members of this household who we have missed like babies, students at boarding school, or people temporarily away for work? What are their names?
Is this (Name's) usual place of residence?
1=Yes 2=No
IF NO, ASK NO
FURTHER QUESTIONS FOR THAT
PERSON
READ IF NECESSARY: What is (Name's) sex?
1=Male 2=Female
What is (Name's) relationship to the head of household? 1= Head 2= Spouse 3= Unmarried Partner 4= Son/daughter 5= Other child 6= Other relative 7= Servant 8= Non relative
What is (Name's) date of birth?
What is (Name's) age in completed years? IF LESS THAN ONE
WRITE 0
What is (Name's) marital status? 1= Married, Spouse present 2= Married Spouse absent 3= Divorced 4= Separated 5= Widow/ Widower 6= Never married
Are the parenof (Name) st
alive?
1=Yes 2=No 8=Don’t kno
Day Month Year
Mother FathR1 R2 R3 R4 R5 R6 R7 R8 R9 R10 R11 R1
R13 Do you have a landline or cellular telephone where you can be contacted? Yes No R14 May I please have a number where I can contact you at a later stage?
67
SECTION 1: EDUCATION AND TRAINING FOR ALL PERSONS AGED 5 YEARS AND ABOVE Usual and regular household member
Serial number in HH Roster Skip Pattern Age of household member
1.0 Which household member is providing information on the individual(WRITE SERIAL NUMBER FROM ROSTER)
1.1 What was/is the highest level of education that (you have/name has) successfully completed? (SEE CODES BELOW)
1.2 (Are you/ Is Name) currently enrolled in school? (Students currently on vacation, school breaks, or who are temporarily absent for sickness or other reasons should answer "yes.") 1=Yes 2=No
1 2
1 2
1 2
1 2
1 2
1.3 [ASK IF 1.1 <= 17] (Are you/ Is Name) able to read and write in any language? 1=Yes 2=No
1 2
1 2
1 2
1 2
1 2
1.4 [ASK IF 1.1 >= 41] In what area did (you/Name) specialize (your/his/her) studies? (SEE CODES BELOW)
Description
Code
1.5 Did (you/Name) participate in any business, entrepreneurship, or micro enterprise development training? 1=Yes 2=No
1 2
1 2
1 2
1 2
1 2
CODES FOR 1.1 10=No schooling 15=P5 32=S2 41=Post primary specialised training or Diploma/certificate11= P1 16=P6 33=S3 51=Post secondary specialised training or Diploma/certificate12= P2 17=P7 34=S4 62=Bachelor's degree13= P3 21=Junior Secondary 35=S5 63=Master's degree14= P4 31=S1 36=S6 64=Doctoral Degree CODES FOR 1.4 00=General Programmes 43=Physical sciences 58=Architecture and building 08=Services01=Education 46=Mathematics and statistics 62=Agriculture, forestry, and fishery 98=Don't know02=Humanities and arts 48=Computing 64=Veterinary03=Social science, business, and law 52=Engineering and engineering trades 72=Health42=Life sciences 54=Manufacturing and processing 76=Social services
68
SECTION 1: EDUCATION AND TRAINING FOR ALL PERSONS AGED 5 YEARS AND ABOVE Serial number in HH Roster Skip Pattern
Age of household member
1.6 Did (you/Name) learn a trade or technical skill?1=Yes 2=No (>> NEXT PERSON)
1 2
1 2
1 2
1 2
1 2
1.7 What type of trade or technical skill did (you/Name) learn?(SEE CODES BELOW)
1.8 How did (you/Name) acquire this trade or skill? 1=Vocational school/Course 2=Apprenticeship or on the job training 3=Learned from a friend or family member 4=From an NGO or community organisation 5=Other, specify
1 2 3 4 5
1 2 3 4 5
1 2 3 4 5
1 2 3 4 5
1 2 3 4 5
CODES FOR 1.7 1=Welding 6=Plumbing 11=Crafts/Basket Weaving 16=Massage/Reflexology2=Carpentry 7=Automobile/Transport Repair 12=Catering/Food Service 17=Agriculture/Land Management/Fishery3=Construction 8=Computer Repair 13=Laundry/Dry Cleaning 18=Accounting/Book Keeping4=Masonry 9=Phone Repair 14=Beautician/Hair/Nails 19=Other, specify 5=Electrician 10=Sewing/Tailoring/Textiles 15=Health care/Traditional Medicine
69
SECTION 2: ACTIVITY STATUS OF PERSONS AGED 5 YEARS AND ABOVE Household Line Number
Skip Pattern
Age of household member
2.0 Which Household member is providing data on the Individual (Write Serial number from Roster)
2.0A In the last week, did you work for a wage, salary, commission or any payment in kind, including doing paid domestic work, even if it was for only for one hour? Examples: a regular job, contract, casual or piece work for pay, work in exchange for food or housing, paid domestic work. 1=Yes 2=NO
1 2
1 2
1 2
1 2
1 2
2.0B Did you do this type of work in the last 12 months? 1=Yes 2=NO
1 2
1 2
1 2
1 2
1 2
2.1A In the last week, did you run a business of any size, for yourself or with one or more partners, even if it was for only one hour? Examples: Commercial farming, selling things, making things for sale, construction, repairing things, brewing beer for sale, collecting wood or water for sale, hairdressing, crèche businesses, having a legal or medical practice, performing, having a public phone shop. 1=Yes 2=NO
1 2
1 2
1 2
1 2
1 2
2.1B Did you run a business in the last 12 months? 1=Yes 2=NO
1 2
1 2
1 2
1 2
1 2
2.2A In the last week, did you help without being paid in any kind of business run by your household, even if it was only for one hour? Examples: help to sell things, make things for sale or exchange, doing the accounts, cleaning up for the business, etc. 1=Yes 2=NO
1 2
1 2
1 2
1 2
1 2
2.2B Did you do this in the last 12 months? 1=Yes 2=NO
1 2
1 2
1 2
1 2
1 2
2.3A In the last week, were you an apprentice? (INCLUDE APPRENTICESHIPS THAT ARE PAID CASH, PAID IN KIND, UNPAID, OR FOR WHICH THE APPRENTICE PAYS TO PARTICIPATE.) 1=Yes 2=No
1 2
1 2
1 2
1 2
1 2
2.3B Were you an apprentice in the last 12 months? 1=Yes 2=NO
1 2
1 2
1 2
1 2
1 2
2.4A In the last week, did you work on your household's farm? (Examples: tending crops, feeding animals, collecting eggs, milking cows, repairing tools, weeding) 1=Yes 2=NO
1 2
1 2
1 2
1 2
1 2
2.4B Did you work on your household's farm in the past 12 months? 1=Yes 2=NO
1 2
1 2
1 2
1 2
1 2
CHK 1 IF 1 to ANY ITEM IN 2.0A OR 2.1A OR 2.2A OR 2.3A OR 2.4A
Else
1 2
1 2
1 2
1 2
1 2
(>> SECTION 4 )
(>> 2.5)
70
SECTION 2: ACTIVITY STATUS OF PERSONS AGED 5 YEARS AND ABOVE
Serial number in HH Roster Skip Pattern
Age of household member
2.5 Even though you did not do any work for pay or profit, did not help without pay in a household business, and did not participate in an apprenticeship…
2.5A In the last week, did you have a paid job that you would definitely return to? Examples: a regular job, contract, casual or piece work for pay, work in exchange for food or housing, paid domestic work. 1=Yes 2=No
1 2
1 2
1 2
1 2
1 2
2.5B In the last week, did you have a business that you would definitely return to? Examples: Commercial farming, selling things, making things for sale, construction, repairing things, brewing beer, collecting wood or water for sale, hairdressing, crèche businesses, having a legal or medical practice, performing, having a public phone shop. 1=Yes 2=No
1 2
1 2
1 2
1 2
1 2
2.5C In the last week, did you have an unpaid job in any kind of business run by your household that you would definitely return to? Examples: help to sell things, make things for sale or exchange, doing the accounts, cleaning up for the business, etc. 1=Yes 2=No
1 2
1 2
1 2
1 2
1 2
2.5D In the last week, did you have an apprenticeship that you would definitely return to? 1=Yes 2=No
1 2
1 2
1 2
1 2
1 2
2.5E In the last week, did you have work on your household's farm that you would definitely return to? (Examples: tending crops, feeding animals, collecting eggs, milking cows, repairing tools) 1=Yes 2=No
1 2
1 2
1 2
1 2
1 2
CHK 2 CHECK 2.5A – 2.5E IF 1 TO ANY PART OF 2.5 , Circle 1, otherwise 2 1=Yes 2=No
1 2
1 2
1 2
1 2
1 2
(>>2.6) (>> SECTION) 3
71
SECTION 2: LABOUR FORCE STATUS OF PERSONS AGED 5 YEARS AND ABOVE
Serial number in HH Roster Skip Pattern
Age of household member
2.6 What was the main reason you were absent from your job/business/apprenticeship/household farm work in the last week? 01=Sickness or injury 02=Vacation leave 03=Caring for family or others (Except maternity or paternity leave) 04=Maternity or paternity leave 05=Other family/community obligations eg. – meetings 06=Strike/stay-away/lockout 07=Problems with transportation 08=Bad weather 09=Study or training leave 10=Unrest (Violence) 11=Layoff/reduction in activity 12=Seasonal work 13=Start a new job/business in the next 30 days 14=Other reason, specify
01
02
03
04
05
06
07
08
09
10
11
12
13
14
01
02
03
04
05
06
07
08
09
10
11
12
13
14
01
02
03
04
05
06
07
08
09
10
11
12
13
14
01
02
03
04
05
06
07
08
09
10
11
12
13
14
01
02
03
04
05
06
07
08
09
10
11
12
13
14
(>> SECTION 4)
( >> SECTION 3)
(>> SECTION 4)
72
SECTION 3: UNEMPLOYMENT AND NOT IN THE LABOUR FORCE Serial number in HH Roster Skip Pattern
Age of household member
3.0 In the last four weeks,......
3.0A Were you looking for any kind of job? 1=Yes 2=No
1 2
1 2
1 2
1 2
1 2
IF 3.0A OR 3.0B IS 1, GO TO 3.1 ELSE, GO TO 3.2
3.0B Were you trying to start any kind of business? 1=Yes 2=No
1 2
1 2
1 2
1 2
1 2
3.1 In the last four weeks, what are all of the things you have done to search for work or to start a business? A= Registered or waited at employment agency B= Registered or waited at trade union C=Placed or answered job advertisements D=Enquired at workplaces, farms, factories or called on other possible employers E=Sought assistance from relatives or friends F=Waited at the street side or other place where casual workers are found G=Contacted school or university employment center H=Applied for permit to start business I=Applied for a loan from a bank J=Sought financial assistance from friends or family members K=Sought a loan from a church or mosque L=Purchased land, a building, or equipment M=Other active, specify N=Looked at job advertisements O=Looked for land, a building, or equipment P=Other passive, specify Z=Nothing
A B C D
E F G H I J K L
M N O P
Z
A B C D
E F G H I J K L
M N O P
Z
A B C D
E F G H I J K L
M N O P
Z
A B C D
E F G H I J K L
M N O P
Z
A B C D
E F G H I J K L
M N O P
Z
(>>3.2)
3.2 Was this because you had already arranged to take up a job or start a business in the next 30 days? 1=Yes 2=No
1 2
1 2
1 2
1 2
1 2
( IF 1,>>3.6)
3.3 Would you like to have worked for pay or profit or to have helped without pay in a household business last week? 1=Yes, maybe, it depends 2=No
1 2
1 2
1 2
1 2
1 2
(IF 1, >>3.8)
(>>If ONLY activities in this group are marked, go to 3.5)
(>>If ANY activity in this group is marked, go to 3.6)
73
SECTION 3: UNEMPLOYMENT AND NOT IN THE LABOUR FORCE Serial number in HH Roster Skip Pattern
Age of household member
3.4 What best describes your situation at this time? For example, are you ill, disabled, in school, taking care of house or family, or something else? 1=Ill/sick 2=Disabled 3=In school 4=Taking care of house or family 5=Retired 6=Not willing to work 7=Not interested in work 8=Something else, specify
1
2
3
4
5
6
7
8
1
2
3
4
5
6
7
8
1
2
3
4
5
6
7
8
1
2
3
4
5
6
7
8
1
2
3
4
5
6
7
8
(>>3.13)
3.5 Would you like to have worked for pay or profit or to have helped without pay in a household business last week? 1=Yes, maybe, it depends 2=No ( >>3.4 it is not an error)
1 2
1
2
1 2
1 2
1 2
(IF 1,>>3.10) (IF 2, >>3.4)
3.6 As of the end of last week, how long had you been looking for work? 1=Weeks 2=Months 3=Years PERIOD
1 2 3 1 2 3 1 2 3 1 2 3 1 2 3
3.7 Before you started looking for work, what were you doing: were you working, going to school, or doing something else? 1=Working 2=In school 3=Homemaker 4=other, specify
1 2 3 4
1 2 3 4
1 2 3 4
1 2 3 4
1 2 3 4
(IF 1, >>3.14)
(>>3.16)
74
SECTION 3: UNEMPLOYMENT AND NOT IN THE LABOUR FORCE Serial number in HH Roster Skip Pattern
Age of household member
3.8 What is the main reason why you did not try to find work or start a business in the last four weeks? (DO NOT READ LIST) 01=No jobs available in the area 02=Unable to find work requiring his/her skills 03=Lost hope of finding any kind of work 04=Lacks necessary schooling, training, skills, or experience 05=Too old/too young to work 06=Awaiting the season for work 07=Waiting to be recalled to former job 08=Pregnancy 09=Sickness/injury 10=Disabled or unable to work (handicapped) 11=Housewife/family responsibilities 12=Child care problems 13=Student 14=Undergoing training to help find work 15=Transportation problems 16= Spouse refused 17= Other Specify
1 2 3 4 5 6 7 8 9 10 11 12 13 14 15 16 17
1 2 3 4 5 6 7 8 9 10 11 12 13 14 15 16 17
1 2 3 4 5 6 7 8 9 10 11 12 13 14 15 16 17
1 2 3 4 5 6 7 8 9 10 11 12 13 14 15 16 17
1 2 3 4 5 6 7 8 9 10 11 12 13 14 15 16 17
3.9 Did you look for work or try to start a business at any time during the last 12 months? 1=Yes 2=No
1 2
1 2
1 2
1 2
1 2
3.10 Did you engage in any income generating activities such as a job, business, apprenticeship, household enterprise, or farm during the last 12 months? 1=Yes 2=No
1 2
1 2
1 2
1 2
1 2
(IF 2, >>3.13)
3.11 Did you do any of this work during the last 4 weeks? 1=Yes 2=No
1 2
1 2
1 2
1 2
1 2
3.12 Did you look for work since leaving the last job you held? 1=Yes 2=No
1 2
1 2
1 2
1 2
1 2
3.13 Have you ever worked for pay or profit or helped unpaid in a household business or farm? 1=Yes 2=No
1
2
1
2
1
2
1
2
1
2
(IF 1, >>3.14)
( >> 3.16)
75
SECTION 3: UNEMPLOYMENT AND NOT IN THE LABOUR FORCE Serial number in HH Roster Skip Pattern
Age of household member
3.14 When did you last work at a job or business? 1=In the last 12 months 2=1-3 years ago 3=4-5 years ago 4=More than 5 years ago
1 2 3 4
1 2 3 4
1 2 3 4
1 2 3 4
1 2 3 4
3.15 What is the main reason you stopped working in your last job/business? 01=Lost job/job ended/business was sold/business closed down/laid off 02=Pregnancy 03=Health reasons 04=Became disabled 05=Retired/too old to work 6=Going to school 07=Dissatisfied with job/pay 08=Caring for children/relatives 09=Other family/community responsibilities 10=Moved away 11=Job was temporary 12=Spouse refused 13=Other, specify
1 2 3 4 5 6 7 8 9 10 11 12 13
1 2 3 4 5 6 7 8 9 10 11 12 13
1 2 3 4 5 6 7 8 9 10 11 12 13
1 2 3 4 5 6 7 8 9 10 11 12 13
1 2 3 4 5 6 7 8 9 10 11 12 13
3.16 Last week, could you have started a job if one had been offered? 1=Yes 2=No
1 2
1 2
1 2
1 2
1 2
(IF 1, >>3.18)
3.17 Why is that? 1=Own temporary illness 2=In school 3=Waiting to start a job or business 4=Others, specify
1
2
3
4
1
2
3
4
1
2
3
4
1
2
3
4
1
2
3
4
3.18 CHECK IF 2.0B =1 OR 2.1B=1 OR 2.2B=1 OR 2.3B=1 OR 2.4 B =1 THEN 3.18=1, ELSE 3.18=2
1 2
1 2
1 2
1 2
1 2
(>> SECTION 6)
(>> SECTION 7)
76
SECTION 4: EMPLOYMENT AND HOURS OF WORK Serial number in HH Roster Skip Pattern Age of household member
4.0 In the last week, did you have more than one income generating activity such as a job, business, household enterprise, or farm? 1=Yes 2=No
1 2
1 2
1 2
1 2
1 2
PRE4.1These next questions are about the main income generating activity you engaged in last week. That is the one where you usually work the most hours per week, even if you were absent from it last week for reasons such as illness, holiday, or family obligations.
4.1 What kind of work do you usually do in the (main) job/business that you had during the last week? DESCRIBE THE OCCUPATION AND MAIN TASKS OR DUTIES IN AT LEAST 2 WORDS. (E.g. vegetable farmer, primary school teacher, computer programmer.)
4.2 What are the main goods/services produced at your place of work or its main function? DESCRIBE THE INDUSTRY -e.g.- Restaurant, school, appliance factory, real estate office.)
4.3 When did you start working for this employer or start running this business? Year(YYYY) in four figures: Month(MM) in 2 figures (Ex: 08 for August)
YYYY MM YYYY MM YYYY MM YYYY MM YYYY MM
4.4 In this (main) job/business that you had during the last week, were you...
1=Working for someone else for pay 7
2=An employer (a person who pays one or more people to work for him) 3=An own-account worker (a person running a business with no employees) 4=Helping without pay in a household business 5=An apprentice 6=Working on a household farm
7 Include paid domestic workers, paid workers in household businesses, gardeners, security guards, etc. Payment may be in cash or in kind (eg. Food, accommodation0. This category includes all employees: part-time, casual worker and piecework.
77
SECTION 4: EMPLOYMENT AND HOURS OF WORK Serial number in HH Roster Skip Pattern
Age of household member
FOR EMPLOYEES
4.5 Does your employer contribute to any pension/retirement fund (e.g. NSSF) for you? 1=Yes 2=No
1 2
1 2
1 2
1 2
1 2
4.6 Are you entitled to any paid leave from this employer? 1=Yes 2=No
1 2
1 2
1 2
1 2
1 2
4.7 Are you entitled to medical benefits from this employer? 1=Yes 2=No
1 2
1 2
1 2
1 2
1 2
4.8 Does your employer deduct or pay income tax (PAYE) from your salary/wage? 1=Yes 2=No
1 2
1 2
1 2
1 2
1 2
4.9 Is your employment agreement… 1=a verbal agreement 2=a written agreement
1 2
1 2
1 2
1 2
1 2
4.10 Is your position… 1=permanent and pensionable 2=an open ended appointment 3=a fixed term
1 2 3
1 2 3
1 2 3
1 2 3
1 2 3
(>>4.15) (>>4.15) (>>4.11)
4.11 What is the duration of your contract? 1=a week or less 2= more than a week but less than a month 3= one to six months 4=seven to eleven months 5=one to five years 6=more than five years
1 2 3 4 5 6
1 2 3 4 5 6
1 2 3 4 5 6
1 2 3 4 5 6
1 2 3 4 5 6
(>>4.15)
78
SECTION 4: EMPLOYMENT AND HOURS OF WORK Serial number in HH Roster Skip Pattern
Age of household member
FOR EMPLOYERS, OWN-ACCOUNT, AND UNPAID FAMILY WORKERS
4.12 Is your business (or household business where you work) registered for VAT? 1=Yes 2=No 8=Don’t know 9=refused
1 2 8 9
1 2 8 9
1 2 8 9
1 2 8 9
1 2 8 9
4.13 Is your business (or household business where you work) registered for income tax? 1=Yes 2=No 8=Don’t know 9=refused
1 2 8 9
1 2 8 9
1 2 8 9
1 2 8 9
1 2 8 9
(>>4.15)
FOR APPRENTICES
4.14 In this apprenticeship, were you… (MAY CHOOSE MORE THAN ONE) A=Unpaid B=Paid cash C=Paid in kind D=Paying so you could participate
A
B
C
D
A
B
C
D
A
B
C
D
A
B
C
D
A
B
C
D
(>>4.15
FOR EVERYONE
4.15 Is your employer/business (at your main job).......... 1=National government 2=Local government 3=Government controlled business (NWSC, UMEME) 4=A commercial bank 5=A private enterprise (other than a commercial bank) 6=Non-profit organisation (NGO/CBO) 7=A private household
1
2
3
4
5
6
7
1
2
3
4
5
6
7
1
2
3
4
5
6
7
1
2
3
4
5
6
7
1
2
3
4
5
6
7
79
SECTION 4: EMPLOYMENT AND HOURS OF WORK Serial number in HH Roster Skip Pattern
Age of household member
4.16 How many other people work for your employer/business at your place of work? 1=0 2=1 3=2-4 4=5-9 5=10-19 6=20-49 7=50 or more 8=Don’t know
1 2 3 4 5 6 7 8
1 2 3 4 5 6 7 8
1 2 3 4 5 6 7 8
1 2 3 4 5 6 7 8
1 2 3 4 5 6 7 8
4.17 How many hours do you usually work at this job each week? 998=hours vary (>>4.18)
IF LESS THAN 20,( >> TO 4.19), IF 20 OR GREATER, (>> 4.22)
4.18 Even though they vary (code 998) do you usually work 20 hours or more each week at this job? 1=Yes (>>4.22) 2=No
1 2
1 2
1 2
1 2
1 2
(>>4.22)
4.19 How many hours would you want to work per week at this job? 1=20 or more (>>4.20) 2=Less than 20 hours (>>4.21)
1 2
1 2
1 2
1 2
1 2
(>>4.20) (>>4.21)
4.20 What is your main reason for working fewer than 20 hours a week at this job? 01=Business conditions 02=More hours not available 03=Seasonal work 04=Child care problems 05=Family/personal obligations 06=Health/medical limitations 07=School/training 08=Nature of the job 09=Time is filled by another job 10=Other, specify
01 02 03 04 05 06 07 08 09 10
01 02 03 04 05 06 07 08 09 10
01 02 03 04 05 06 07 08 09 10
01 02 03 04 05 06 07 08 09 10
01 02 03 04 05 06 07 08 09 10
(>>4.22)
80
SECTION 4: EMPLOYMENT AND HOURS OF WORK Serial number in HH Roster Skip Pattern
Age of household member
4.21 What is the main reason you do not want to work 20 hours or more a week at this job? 1=Child care problems 2=Family/personal obligations 3=Health/medical limitations 4=School/training 5=Work is too physically demanding 6=Prefer spending time at other job 7=Other, specify
1
2
3
4
5
6
7
1
2
3
4
5
6
7
1
2
3
4
5
6
7
1
2
3
4
5
6
7
1
2
3
4
5
6
7
4.22 Now I have some questions about the exact number of hours you worked last week. Last week, how many hours did you actually work at this job? Please tell me the hours you worked each day, starting with Sunday.
Sunday
Monday
Tuesday
Wednesday
Thursday
Friday
Saturday
CHK3 CHECK 4.4 (EMPLOYMENT STATUS) IN THIS (MAIN) JOB/BUSINESS THAT YOU HAD DURING THE LAST WEEK, 1=Employee 2=Employer 3=Own-account worker 4=Unpaid Family Worker 5=An apprentice 6=Working on a household farm
1
2
3
4
5
6
1
2
3
4
5
6
1
2
3
4
5
6
1
2
3
4
5
6
1
2
3
4
5
6
(>>4.23) >>(4.24) (>>4.26)
4.23 Last week, would you have liked to work more hours than you actually worked, provided the extra hours had been paid? 1=Yes, in the current job 2=Yes, in taking an additional job 3=Yes, in a different job with more hours 4=No 8=Don’t know
1
2
3
4
8
1
2
3
4
8
1
2
3
4
8
1
2
3
4
8
1
2
3
4
8
(>>4.25)
(>>4.28)
81
SECTION 4: EMPLOYMENT AND HOURS OF WORK Serial number in HH Roster Skip Pattern
Age of household member
4.24 Do you want to work more hours on this job at your current rate of earning? 1=Yes 2=No
1
2
1
2
1
2
1
2
1
2
( IF 2 >>4.28)
4.25 How many additional hours could you have worked on this job last week?
(>> 4.28)
4.26 What kind of work would you want to do to support yourself and family on?
CHK 4 CHECK 4.26, IF STILL “WORKING ON HOUSEHOLD FARM” CIRCLE 1, ELSE CIRCLE 2.
1 2
1 2
1 2
1 2
1 2
(>>4.28) (>>4.27)
4.27 What is preventing you from taking on this type of work? (Circle all that apply) A= Lack of education B= Lack of necessary skills C= Lack of capital D= Inability to find a job E= Sickness or injury F= Caring for family or others G= Unrest or violence H= Too much risk I =Other reason, specify
A B C D E F G H I
A B C D E F G H I
A B C D E F G H I
A B C D E F G H I
A B C D E F G H I
4.28 What was your primary activity before you started this job/business? 1=Working 2=Looking for work 3=Trying to start a business 4=Student 5=Homemaker 6=Sick/injured 7=Other (specify)
1 2 3 4 5 6 7
1 2 3 4 5 6 7
1 2 3 4 5 6 7
1 2 3 4 5 6 7
1 2 3 4 5 6 7
IF 2 OR 3, (>> 4.29), ELSE IF 4.0 IS 1, (>> 4.30) ELSE ( >> 4.60)
4.29 How long were you looking for work or trying to start a business before starting the work you are doing now? 1=Less than six months 2=Six to 12 moths 3=Between one and two years 4=More than two years
1 2 3 4
1 2 3 4
1 2 3 4
1 2 3 4
1 2 3 4
82
SECTION 4: EMPLOYMENT AND HOURS OF WORK
Serial number in HH Roster Skip Pattern Age of household member
CHK 5 CHECK 4.0, IF HAVE MORE THAN ONE ECONOMIC ACTIVITY SUCH AS A JOB, BUSINESS, HOUSEHOLD ENTERPRISE, OR FARM (1=Yes, 2=No)
1 2
1 2
1 2
1 2
1 2
(>> 4.30) (>> 4.60)
Now I'd like to ask about your second job or business. 4.30 What kind of work do you usually do in the secondary
job/business that you had during the last week? DESCRIBE THE OCCUPATION AND MAIN TASKS OR DUTIES IN AT LEAST 2 WORDS. (E.g. vegetable farmer, primary school teacher, computer programmer.)
4.31 What are the main goods/services produced at your place of work or its main function? DESCRIBE THE INDUSTRY -e.g.- Restaurant, school, appliance factory, real estate office.)
4.32 When did you start working for this employer or start running this business? Year(YYYY) in four figures: Month(MM) in 2 figures (Ex: 08 for August)
YYYY MM YYYY MM YYYY MM YYYY MM YYYY MM
4.33 In this (SECOND) job/business that you had during the last week, were you...
1=Working for someone else for pay8 (>>4.34) 2=An employer (a person who pays one or more people to work for him) 3=An own-account worker (a person running a business with no employees) 4=Helping without pay in a household business 5=An apprentice 6=Working on a household farm
1 2 3 4 5 6
1 2 3 4 5 6
1 2 3 4 5 6
1 2 3 4 5 6
1 2 3 4 5 6
(>>4.34)
( >> 4.41)
(>>4.43) (>>4.46)
8 Include paid domestic workers, paid workers in household businesses, gardeners, security guards, etc. Payment may be in cash or in kind (eg. Food, accommodation0. This category
includes all employees: part-time, casual worker and piecework.
83
SECTION 4: EMPLOYMENT AND HOURS OF WORK Serial number in HH Roster Skip Pattern
Age of household member
EMPLOYEES
4.34 Does your employer contribute to any pension/retirement fund (e.g. NSSF) for you? 1=Yes 2=No
1 2
1 2
1 2
1 2
1 2
4.35 Are you entitled to any paid leave from this employer? 1=Yes 2=No
1 2
1 2
1 2
1 2
1 2
4.36 Are you entitled to medical benefits from this employer? 1=Yes 2=No
1 2
1 2
1 2
1 2
1 2
4.37 Does your employer deduct or pay income tax (PAYE) from your salary/wage? 1=Yes 2=No
1 2
1 2
1 2
1 2
1 2
4.38 Is your employment agreement… 1=a verbal agreement 2=a written agreement
1 2
1 2
1 2
1 2
1 2
4.39 Is your position… 1=permanent and pensionable 2=an open ended appointment 3=a fixed term
1 2 3
1 2 3
1 2 3
1 2 3
1 2 3
(>>4.44) (>>4.44) (>>4.40)
4.40 What is the duration of your contract? 1=a week or less 2= more than a week but less than a month 3= one to six months 4=seven to eleven months 5=one to five years 6=more than five years
1 2 3 4 5 6
1 2 3 4 5 6
1 2 3 4 5 6
1 2 3 4 5 6
1 2 3 4 5 6
(>>4.44)
84
SECTION 4: EMPLOYMENT AND HOURS OF WORK Serial number in HH Roster Skip Pattern
Age of household member
FOR EMPLOYERS, OWN-ACCOUNT, AND UNPAID FAMILY WORKERS
4.41 Is your business (or household business where you work) registered for VAT? 1=Yes 2=No 8=Don’t know 9=refused
1 2 8 9
1 2 8 9
1 2 8 9
1 2 8 9
1 2 8 9
4.42 Is your business (or household business where you work) registered for income tax? 1=Yes 2=No 8=Don’t know 9=refused
1 2 8 9
1 2 8 9
1 2 8 9
1 2 8 9
1 2 8 9
(>>4.44)
FOR APPRENTICES
4.43 In this apprenticeship, were you… (MAY CHOOSE MORE THAN ONE) A=unpaid B=paid cash C=paid in kind D=paying so you could participate
A
B
C
D
A
B
C
D
A
B
C
D
A
B
C
D
A
B
C
D
(>>4.44)
FOR EVERYONE
4.44 Is your employer/business (at your SECOND job).......... 1=National government 2=Local government 3=Government controlled business (NWSC, UMEME) 4=A commercial bank 5=A private enterprise (other than a commercial bank) 6=Non-profit organisation (NGO/CBO) 7=A private household
1
2
3
4
5
6
7
1
2
3
4
5
6
7
1
2
3
4
5
6
7
1
2
3
4
5
6
7
1
2
3
4
5
6
7
85
SECTION 4: EMPLOYMENT AND HOURS OF WORK Serial number in HH Roster Skip Pattern
Age of household member
4.45 How many other people work for your employer/business at this place of work? 1=0 2=1 3=2-4 4=5-9 5=10-19 6=20-49 7=50 or more 8=Don’t know
1 2 3 4 5 6 7 8
1 2 3 4 5 6 7 8
1 2 3 4 5 6 7 8
1 2 3 4 5 6 7 8
1 2 3 4 5 6 7 8
4.46 How many hours do you usually work at this job each week? 998=hours vary (>>4.47)
IF<20, GO TO 4.48 IF 20 OR GREATER, GO TO 4.51
4.47 Even though they vary do you usually work 20 hours or more each week at this job? 1=Yes 2=No
1 2
1 2
1 2
1 2
1 2
(>>4.51)
4.48 Do you want to work more hours per week at this job? 1=Yes 2=No
1 2
1 2
1 2
1 2
1 2
(>>4.50)
4.49 What is your main reason for working fewer than 20 hours a week at this job? 01=Business conditions 02=More hours not available 03=Seasonal work 04=Child care problems 05=Family/personal obligations 06=Health/medical limitations 07=School/training 08=Nature of the job 09=Time is filled by another job 10=Other, specify
01 02 03 04 05 06 07 08 09 10
01 02 03 04 05 06 07 08 09 10
01 02 03 04 05 06 07 08 09 10
01 02 03 04 05 06 07 08 09 10
01 02 03 04 05 06 07 08 09 10
(>>4.51)
86
SECTION 4: EMPLOYMENT AND HOURS OF WORK Serial number in HH Roster Skip Pattern
Age of household member
4.50 What is the main reason you do not want to work 20 hours or more a week at this job? 1=Child care problems 2=Family/personal obligations 3=Health/medical limitations 4=School/training 5=Work is too physically demanding 6=Prefer spending time at other job 7=Other, specify
1 2 3 4 5 6 7
1 2 3 4 5 6 7
1 2 3 4 5 6 7
1 2 3 4 5 6 7
1 2 3 4 5 6 7
4.51 Now I have some questions about the exact number of hours you worked last week. Last week, how many hours did you actually work at this job? Please tell me the hours you worked each day, starting with Sunday.
Sunday
Monday
Tuesday
Wednesday
Thursday
Friday
Saturday
CHK 6 CHECK 4.33 IN THIS (SECOND) JOB/BUSINESS THAT YOU HAD DURING THE LAST WEEK, were you an 1=Employee 2=Employer 3=Own-account worker 4=Unpaid Family Worker 5=An apprentice 6=Working on a household farm
1 2 3 4 5 6
1 2 3 4 5 6
1 2 3 4 5 6
1 2 3 4 5 6
1 2 3 4 5 6
(>>4.52) (>>4.54)
87
SECTION 4: EMPLOYMENT AND HOURS OF WORK Serial number in HH Roster Skip Pattern
Age of household member
4.52 Do you want to work more hours on this job at your current rate of earning? 1=Yes 2=No
1
2
1
2
1
2
1
2
1
2
(>>4.56)
4.53 How many additional hours could you have worked on this job last week?
(>>4.56)
4.54 What kind of work would you want to do to support yourself and family?
4.56 Besides the two we have discussed, did you have any other jobs/businesses/income generating activities last week? 1=Yes 2=No
1
2
1
2
1
2
1
2
1
2
(>>PRE4.57)
(>>4.60)
PRE4.57 Now I'd like to ask about the rest of your income generating activities. Please include jobs, own account work, unpaid work in a household business, farming, etc. I will ask about these activities as a group instead of one by one.
4.57 How many hours do you usually work at the rest of your income generating activities combined each week? 998=Hours vary/DK/REFUSED IF 998, DON'T KNOW, OR REFUSED, GO TO 4.58. ELSE GO TO 4.59
IF 998, DON'T KNOW, OR REFUSED, GO TO 4.58. ELSE GO TO 4.59
4.58 Do you usually work 20 hours or more each week at them? 1=Yes 2=No 8=Hours vary
88
SECTION 4: EMPLOYMENT AND HOURS OF WORK
Serial number in HH Roster Skip Pattern
Age of household member
4.59 Last week, how many hours did you actually work at the rest of your income generating activities Combined? Please tell me the hours you worked each day, starting Sunday
Sunday
Monday
Tuesday
Wednesday
Thursday
Friday
Saturday
4.60 Even though you are already working, did you do anything in the past four weeks to find other work or to start a business? 1=Yes 2=No (>>SECTION 5: EARNINGS)
1 2
1 2
1 2
1 2
1 2
(>>SECTION 5)
4.61 What did you do? (Mark all that apply) A=Registered or waited at employment agency B=Registered or waited at trade union C=Placed or answered job advertisements D=Enquired at workplaces, farms, factories or called on other possible employers E=Sought assistance from relatives or friends F=Waited at the street side or other place where casual workers are found G=Contacted school or university employment center H=Applied for permit to start business I=Applied for a loan from a bank J=Applied for a loan from a bank K=Sought financial assistance from friends or family members L=Purchased land, a building, or equipment M= Looked at job advertisements N= Looked for land, a building, or equipment O=Other, specify
A B C D E F G H I J K L M N O
A B C D E F G H I J K L M N O
A B C D E F G H I J K L M N O
A B C D E F G H I J K L M N O
A B C D E F G H I J K L M N O
89
SECTION 5: EARNINGS Serial number in HH Roster Skip to Pattern
Age of household member
CHK 7
CHECK IF 4.4 IS 1, 2,3 & 5 , THEN CIRCLE 1; ELSE IF 4.33 IS 1,2,3 &5 THEN CIRCLE 2; ELSE CIRCLE 3
1 2 3
1 2 3
1 2 3
1 2 3
1 2 3
(>>5.0) (>>5.10) (>>SECTION 6)
MAIN JOB ( EMPLOYEES, EMPLOYERS, OWN ACCOUNT WORKERS AND APPRENTICE 5.0 On your (main) job, are you paid………...?
1 =a set rate 2 =on the basis of sales 3 =both a set rate and on the basis of sales 4 = in kind only (>>5.8) 5 =some other way, specify
1 2 3 4 5
1 2 3 4 5
1 2 3 4 5
1 2 3 4 5
1 2 3 4 5
(>>5.1) (>>5.5) (>>5.1) (>>5.8) (>>5.6)
5.1 What is the set rate you are paid? This should be the pay rate before taxes or other deductions are taken out. (ENTER AMOUNT IN SHILLINGS
5.2 That rate is… 1=Hourly 2=Daily 3=Weekly 4=Twice a month (24 times a year) 5= Bi-weekly (26 times a year) 6= Monthly 7=Annually 8=Other, specify
1 2 3 4 5 6 7 8
1 2 3 4 5 6 7 8
1 2 3 4 5 6 7 8
1 2 3 4 5 6 7 8
1 2 3 4 5 6 7 8
(>>CHK7.5)
(>> 5.3) (>>CHK7.5)
CHK 7.5
CHECK 5.0, IF 5.0=3, CIRCLE 1; ELSE CIRCLE 2 1
2
1
2
1
2
1
2
1
2
>>5.5 >>5.8
5.3 Even though you told me it was easier to report your earnings (FILL UNIT FROM 5.2), are you paid at an hourly rate on this job? 1=Yes 2=No
1
2
1
2
1
2
1
2
90
5.4 What is your hourly rate of pay on this job? This should be the pay rate before taxes or other deductions are taken out. ENTER AMOUNT IN SHILLINGS
If 5.0 was 3, (>>5.5); Else, (>>5.8)
5.5 In the last month, how much did you earn from sales? This should be earnings before taxes or other deductions are taken out. ENTER AMOUNT IN SHILLINGS
(>> 5.7)
5.6 In the last month, how much did you earn? This should be earnings before taxes or other deductions are taken out. ENTER AMOUNT IN SHILLINGS
91
SECTION 5: EARNINGS
Serial number in HH Roster Skip Pattern
Age of household member
5.7 What were your expenses associated with generating this income in the last month? Include the cost of supplies, fuel, repair of vehicle/motorcycle etc.
5.8 Did you receive any payments in kind such as food or housing, transport, or medical care from your (MAIN) job? 1=Yes 2=No
1
2
1
2
1
2
1
2
1
2
(>>CHK 8)
5.9A What is the estimated value of these payments in kind? ENTER AMOUNT IN SHILLINGS
5.9B Per Unit (circle) 1=Hourly 2=Daily 3=Weekly 4=Twice a month (24 times a year) 5= Bi-weekly (26 times a year) 6=Monthly 7=Annually 8=Other, specify
1 2 3 4 5 6 7 8
1 2 3 4 5 6 7 8
1 2 3 4 5 6 7 8
1 2 3 4 5 6 7 8
1 2 3 4 5 6 7 8
CHK 8 CHECK IF 4.33 IS 1,2,3 OR 5 CIRCLE 1 ELSE CIRCLE 2
1 2
1 2
1 2
1 2
1 2
>>5.10 ( >> SECTION6)
SECOND JOB (EMPLOYEES, EMPLOYERS, OWN ACCOUNT WORKERS AND APPRENTICES) 5.10 On your (SECOND) job, are you paid...
1 =a set rate (>>5.11) 2 =on the basis of sales(>>5.15) 3 =both a set rate and on the basis of sales(>>5.11) 4 = in kind only (>>5.18) 5 =some other way, specify (>>5.16)
1 2 3 4 5
1 2 3 4 5
1 2 3 4 5
1 2 3 4 5
1 2 3 4 5
(>>5.11) (>>5.15) (>>5.11) (>>5.18) (>>5.16)
92
SECTION 5: EARNINGS
Serial number in HH Roster Skip Pattern
Age of household member
5.11 What is the set rate you are paid? This should be the pay rate before taxes or other deductions are taken out. ENTER AMOUNT IN SHILLINGS
5.12 That rate is… 1=Hourly 2=Daily 3=Weekly 4= Twice a month (24 times a year)5= Bi-weekly (26 times a year) 6=Monthly 7=Annually 8=Other, specify
1 2 3 4 5 6 7 8
1 2 3 4 5 6 7 8
1 2 3 4 5 6 7 8
1 2 3 4 5 6 7 8
1 2 3 4 5 6 7 8
(>>CHK9) (>>5.13) (>>CHK9)
5.13 Even though you told me it was easier to report your earnings (FILL UNIT FROM 5.12), are you paid at an hourly rate on this job? (1=Yes 2=No)
1
2
1
2
1
2
1
2
5.14 What is your hourly rate of pay on this job? This should be the pay rate before taxes or other deductions are taken out. ENTER AMOUNT IN SHILLINGS
CHK 9 IF 5.10=3 CIRCLE 1, ELSE CIRCLE 2 1 2
1 2
1 2
1 2
1 2
(>>5.15) (>>5.18)
5.15 In the last month, how much did you earn from sales? This should be earnings before taxes or other deductions are taken out.
(>>5.17)
5.16 In the last month, how much did you earn? This should be earnings before taxes or other deductions are taken out. ENTER AMOUNT IN SHILLINGS
5.17 What were your expenses associated with generating this income in the last month? Include the cost of supplies, fuel, repair of vehicle/motorcycle etc. ENTER AMOUNT IN SHILLINGS
93
SECTION 5: EARNINGS
Serial number in HH Roster Skip Pattern
Age of household member
5.18 Did you receive any payments in kind such as food, housing, transport, ormedical care from your (SECOND) job? (1=Yes 2=No)
1 2
1
2
1 2
1
2
1
2
(>>5.20a)
5.19 What is the estimated value of these payments in kind? ENTER AMOUNT IN SHILLINGS
5.20 Per Unit (circle) 1=Hourly 2=Daily 3=Weekly 4= Twice a month (24 times a year) 5=Bi-weekly (26 times a year) 6=Monthly 7=Annually 8=Other, specify
1 2 3 4 5 6 7 8
1 2 3 4 5 6 7 8
1 2 3 4 5 6 7 8
1 2 3 4 5 6 7 8
1 2 3 4 5 6 7 8
5.20a (IF 4.57 WAS 1. ASK:) How much did you earn last week on the rest of your jobs combined? Include the value of both cash and in kind payments.
5.21 If you were offered an important job with a formal appointment letter and paid a salary of (100,000; 200,000; 300,000; 400,000; 500,000) per month, would you accept the job and abandon your small business? (SURVEYOR SHOULD ASK THE QUESTION FILLING IN THE NUMBER--LOWEST TO HIGHEST--UNTIL THE RESPONDENT SAYS YES) 1 = 100,000 UGX 2 =200,000 UGX 3 =300,000 UGX 4 =400,000 UGX 5 =500,000 UGX 6= None
1
2
3
4
5
6
1
2
3
4
5
6
1
2
3
4
5
6
1
2
3
4
5
6
1
2
3
4
5
6
GO TO SECTION 6
94
SECTION 6: ACTIVITY STATUS OF PERSONS AGED 5 YEARS AND ABOVE LAST 12 MONTHS
Serial number in HH Roster Skip Pattern
Age of household member
CHK 10
CHECK IF 2.0B =1 OR 2.1B=1 OR 2.2B=1 OR 2.3B=1 OR 2.4B=1, CIRCLE 1; IF SECTION 4: EARNINGS WAS ANSWERED, CIRCLE 2; ELSE; CIRCLE 3.
1 2
3
1 2
3
1 2
3
1 2
3
1 2
3
(>> SECTION 7)
PRE 6.0
Now I'd like to ask about the income generating activity you spent the most time doing in the past 12 months. This could be work at a job, your own business, a household enterprise, or a farm. It could be work that you still do or work that you have stopped doing. IF PERSON ANSWERED SECTION 4, GO TO 6.0 ELSE, GO TO 6.1.
6.0 You have told me that last week you were doing ………, Is it the same task that you spent most time in the past 12 months? 1= Main job last week 2=Second job last week 3= Other economic activity/work
1
2
3
1
2
3
1
2
3
1
2
3
1
2
3
(>>6.16) (>>6.1)
6.1 What kind of work did you usually do in the job/business that you spent the most time on during the past 12 months? DESCRIBE THE OCCUPATION AND MAIN TASKS OR DUTIES IN AT LEAST 2 WORDS. (Eg. vegetable farmer, primary school teacher, computer programmer.)
6.2 What are the main goods/services produced at this place of work or its main function? (DESCRIBE THE INDUSTRY -e.g.- Restaurant, school, appliance factory, real estate office.)
6.3 In this main job/business that you had during the past 12 months, were you... 1=Working for someone for pay 2=An employer? (a person who pays one or more people to work for him) 3=An own-account worker? (a person running a business with no employees 4=Helping without pay in a household business? 5=An apprentice? 6=Working on a household farm?
SECTION 6 : ACTIVITY STATUS OF PERSONS AGED 5 YEARS AND ABOVE IN THE LAST 12 MONTHS Serial number in HH Roster Skip Pattern
Age of household member
FOR EMPLOYEES
6.4 Did this employer contribute to any pension/retirement fund (e.g. NSSF) for you? 1=Yes 2=No
1 2
1 2
1 2
1 2
1 2
6.5 Were you entitled to any paid leave from this employer? 1=Yes 2=No
1 2
1 2
1 2
1 2
1 2
6.6 Were you entitled to medical benefits from this employer? 1=Yes 2=No
1 2
1 2
1 2
1 2
1 2
6.7 Did this employer deduct or pay income tax (PAYE) from your salary/wage? 1=Yes 2=No
1 2
1 2
1 2
1 2
1 2
6.8 Was your employment agreement… 1=a verbal agreement 2=a written agreement
1 2
1 2
1 2
1 2
1 2
6.9 Was your position… 1=permanent and pensionable 2=an open ended appointment 3=a fixed term
1 2 3
1 2 3
1 2 3
1 2 3
1 2 3
(>>6.14) (>>6.14) (>>6.10)
6.10 What was the duration of your contract? 1=a week or less 2= more than a week but less than a month 3= one to six months 4=seven to eleven months 5=one to five years 6=more than five years
1 2 3 4 5 6
1 2 3 4 5 6
1 2 3 4 5 6
1 2 3 4 5 6
1 2 3 4 5 6
>> 6.14)
96
SECTION 6: ACTIVITY STATUS OF PERSONS AGED 5 YEARS AND ABOVE IN THE LAST 12 MONTHS
Serial number in HH Roster Skip Pattern
Age of household member
FOR EMPLOYERS, OWN-ACCOUNT, AND UNPAID FAMILY WORKERS
6.11 Was your business (or household business where you worked) registered for VAT? 1=Yes 2=No 8=Don’t know 9=refused
1 2 8 9
1 2 8 9
1 2 8 9
1 2 8 9
1 2 8 9
6.12 Was your business (or household business where you worked) registered for income tax? 1=Yes 2=No 8=Don’t know 9=refused
1 2 8 9
1 2 8 9
1 2 8 9
1 2 8 9
1 2 8 9
FOR APPRENTICES
6.13 In this apprenticeship, were you… (MAY CHOOSE MORE THAN ONE) A=unpaid B=paid cash C=paid in kind D=paying so you could participate
A
B
C
D
A
B
C
D
A
B
C
D
A
B
C
D
A
B
C
D
>> 6.14
>> 6.14
97
SECTION 6: ACTIVITY STATUS OF PERSONS AGED 5 YEARS AND ABOVE IN THE LAST 12 MONTHS
Serial number in HH Roster Skip Pattern
Age of household member
FOR EVERYONE
6.14 Was your employer or business.......... 1=National government 2=Local government 3=Government controlled business (NWSC, UMEME) 4=A commercial bank 5=A private enterprise (other than a commercial bank) 6=Non-profit organisation (NGO/CBO) 7=A private household
1 2 3 4 5 6 7
1 2 3 4 5 6 7
1 2 3 4 5 6 7
1 2 3 4 5 6 7
1 2 3 4 5 6 7
6.15 How many other people worked for your employer/business at your place of work? 1=0 2=1 3=2-4 4=5-9 5=10-19 6=20-49 7=50 or more 8=Don’t know
1 2 3 4 5 6 7 8
1 2 3 4 5 6 7 8
1 2 3 4 5 6 7 8
1 2 3 4 5 6 7 8
1 2 3 4 5 6 7 8
98
SECTION 6: ACTIVITY STATUS OF PERSONS AGED 5 YEARS AND ABOVE IN THE LAST 12 MONTHS Serial number in HH Roster Skip Pattern
Age of household member
6.16 During which of the past 12 months did you work at this job/business? (CIRCLE ALL THAT APPLY) A=January
B=February
C= March
D=April
E=May
F=June
G=July
H=August
I=September
J=October
K=November
L=December
(CIRCLE ALL THAT APPLY)
A
B
C
D
E
F
G
H
I
J
K
L
A
B
C
D
E
F
G
H
I
J
K
L
A
B
C
D
E
F
G
H
I
J
K
L
A
B
C
D
E
F
G
H
I
J
K
L
A
B
C
D
E
F
G
H
I
J
K
L
6.17 During the months that you worked at this job/business, how many weeks did you usually work per month? 1=1 week
2=2 Weeks
3=3 Weeks
4=4 Weeks
YOU CAN REPORT DIFFERENT NUMBERS FOR HIGH AND LOW SEASONS OR ONE NUMBER IF IT DIDN'T VARY
L H D L H D L H D L H D L H D
1
2
3
4
1
2
3
4
1
2
3
4
1
2
3
4
1
2
3
4
1
2
3
4
1
2
3
4
1
2
3
4
1
2
3
4
1
2
3
4
1
2
3
4
1
2
3
4
1
2
3
4
1
2
3
4
1
2
3
4
99
SECTION 6: ACTIVITY STATUS OF PERSONS AGED 5 YEARS AND ABOVE IN THE LAST 12 MONTHS
6.18 During the weeks that you worked at this
job/business, how many hours did you usually work per week? You can report different numbers for high and low seasons or one number if it didn't vary. DK=998
IF (998>> 6.19) ELSE (>> 6.20)
6.19 Did you usually work 20 hours or more each week at this job? 1=Yes 2=No 8=Varies
1 2 8
1 2 8
1 2 8
1 2 8
1 2 8
6.20 ASK IF 6.3 IS 1,2,3, OR 5: How much did you usually earn at this job? Please include the value of any in kind payments and use whatever units of time are easiest for you. 1=Hourly 2=Daily 3=Weekly 4=Twice a month (24 times a year) 5=Bi-weekly (26 times a year) 6=Monthly 7=Annually 8=Other, specify
Code Value Code Value Code Value Code Value Code Value
GO TO SECTION 7
100
PRE7.0 Now I'd like to ask about some of your domestic activities.
SECTION 7: NON-MARKET ACTIVITIES IN THE LAST WEEK Serial number in HH Roster Skip Pattern Age of household member
PRE7.0 Now I'd like to ask about some of your domestic activities.
7.0 Last week, how much time in hours did you spend collecting firewood for the household, including travel time? (IF LESS THAN 30 MINUTES, WRITE 0. IF MORE THAN 30 MINUTES BUT LESS THAN AN HOUR, ROUND UP)
7.1 Last week, how much time in hours did you spend fetching water for the household, including travel time? (IF LESS THAN 30 MINUTES, WRITE 0. IF MORE THAN 30 MINUTES BUT LESS THAN AN HOUR, ROUND UP.)
7.2 Last week, how much time in hours did you spend constructing your dwelling, farm buildings, private roads, or wells? (IF LESS THAN 30 MINUTES, WRITE 0. IF MORE THAN 30 MINUTES BUT LESS THAN AN HOUR, ROUND UP.)
7.3 Last week, how much time in hours did you spend making major repairs to your dwelling, farm buildings, private roads, or wells? (IF LESS THAN 30 MINUTES, WRITE 0. IF MORE THAN 30 MINUTES BUT LESS THAN AN HOUR, ROUND UP.)
101
7.4 Last week, how much time in hours did you spend on milling and other food processing for the household? This includes threshing and milling grain, making butter and cheese, slaughtering livestock, curing hides and skins, preserving food for later consumption, making beer and alcohol, and other similar activities. It does not include preparing food for immediate consumption. (IF LESS THAN 30 MINUTES, WRITE 0. IF MORE THAN 30 MINUTES BUT LESS THAN AN HOUR, ROUND UP.)
102
SECTION 7: NON-MARKET ACTIVITIES IN THE LAST WEEK
Serial number in HH Roster Skip Pattern
Age of household member
7.5 Last week, how much time in hours did you spend making handicrafts for household use? This includes making furniture, clothing, clay pots, baskets, mats, and other similar activities. (IF LESS THAN 30 MINUTES, WRITE 0. IF MORE THAN 30 MINUTES BUT LESS THAN AN HOUR, ROUND UP.)
7.6 Last week, how much time in hours did you spend on agriculture? This includes growing or gathering field crops, fruits, and vegetables; producing eggs and milk; burning charcoal; and other similar activities. (IF LESS THAN 30 MINUTES, WRITE 0. IF MORE THAN 30 MINUTES BUT LESS THAN AN HOUR, ROUND UP.)
7.7 Last week, how much time did you spend on hunting and fishing? This includes hunting animals and birds; catching fish, crabs, and shellfish; and other similar activities. (IF LESS THAN 30 MINUTES, WRITE 0. IF MORE THAN 30 MINUTES BUT LESS THAN AN HOUR, ROUND UP.)
7.8 Do you get income or support from any of the following sources? (CODE ALL APPLICABLE) A=Remittances B= Charity/church C= Retirement pension D= NSSF E= Welfare grants F= Bursary, study loan G= Other, specify Z= No
A B C D E F G Z
A B C D E F G Z
A B C D E F G Z
A B C D E F G Z
A B C D E F G Z
103
7.9 Do you use any of the following Financial Services? (CIRLE ALL APPLICABLE) A=Commercial Bank B= Micro Finance Institutions C= Savings and Credit Cooperative D= Village Savings and Loans Association E= Agricultural Association F= NGO lending Associations G= Borrowing from Friends or Family H= Private Money Lender I= Others, Specify Z= No
A B C D E F G H I Z
A B C D E F G H I Z
A B C D E F G H I Z
A B C D E F G H I Z
A B C D E F G H I Z
104
SECTION 8: AGRICULTURE THIS SECTION OF THE SURVEY ASKS ABOUT THE HOUSEHOLD RATHER THAN EACH INDIVIDUAL. ASK IT OF THE PERSON MOST KNOWLEDGEABLE ABOUT THE HOUSEHOLD'S AGRICULTURAL ACTIVITIES. 8.0 Does the household grow any crops? 1=YES 2=NO IF 2 >> ( 8.11) PRE8.1 PLEASE FILL IN THE LAST COMPLETED SEASON 1 =March-May 2= August-October Year
Please list all types of crops grown
during the last completed season, the one that ran from … to ....
ENTER CODE FOR
CROP TYPE
How big was your (CROP
NAME) harvest? When you
planted, did you expect
to harvest…?
1=more
How much of your (CROP NAME)
harvest did you sell...?
1= all/almost all 2= more than half
When you planted this crop, did you intend to sell…?
How much did you receive for this crop? FILL "Total sale" IF KNOWN,
ELSE FILL "Price per unit." IF NONE OF
A CROP WAS SOLD, ENTER "0" FOR
"Total sale."
Please tell me all of the household members who were involved in
growing, processing or selling this crop.
2 =less 3= about half 1 =more
3 =about this amount
4= less than half
2 =less
Amount Units5= very little 3= about
this amount Total sale
Price per unit
(Enter each person ID number)
6=none
8.1 8.2 8.3 8.4 8.5 8.6 8.7 8.8 8.9 8.10
A B C D E F G H
105
8.11 Does the household raise any livestock? 1=YES 2=NO ( IF NO >>, THANK THE RESPONDENT AND END INTERVIEW) (ANIMAL CODES SHOULD BE PROVIDED)