68
• 1 The US Pharmaceutical Market: Trends, Issues and Outlook BY: Doug Long, VP Industry Relations FMI Pharmacy Conference September 2009
•1
The US Pharmaceutical Market: Trends, Issues and Outlook
BY: Doug Long, VP Industry Relations
FMI Pharmacy Conference
September 2009

•2
All reproduction rights, quotations, broadcasting, publications reserved. No part of this publication may be reproduced or transmitted in any form or by any means, electronic or mechanical, including photocopy, recording, or any information storage and retrieval system, without express written consent of IMS HEALTH.
The World pharmaceutical market
2009 Strategic management presentation
•3
About IMS Health®
• Operating in more than 100 countries, IMS is the world’s leading provider of information solutions to the pharmaceutical and healthcare industries.
• With $2.3 Billion in 2008 revenue and more than 50 years of industry experience, IMS offers leading-edge business intelligence products and services that are integral to client’s day-to-day operations, including portfolio optimization capabilities; launch and brand management solutions; sales force effectiveness innovations; and managed care and over-the-counter offerings.
• IMS’s Global Consulting and Services group is the industry premier resource for answers and actionable insights that improve ROI and the delivery of quality healthcare worldwide
• Additional information is available at http//www.imshealth.com

•4
US Market Performance

•5
US market growth in MAT June was 3.2%;
$0
$50
$100
$150
$200
$250
$300
$350
1993
1994
1995
1996
1997
1998
1999
2000
2001
2002
2003
2004
2005
2006
2007
2008
MAT
Jun
2009
SALE
S U
S$BN
0
5
10
15
20
% C
HAN
GE
Source: IMS Health, National Sales Perspectives, Jun 2009

5.6%
9.3%
3.7%
1.8%
3.2%
4.3%
0%1%2%
3%4%5%6%7%
8%9%
10%20
05
2006
2007
2008
MAT
Jun
200
9
YTD
Jun
2009
% G
RO
WTH
US$
Source: IMS Health, National Sales Perspectives, Jun 2009
US market growth is 4.3% for the first half of 2009

•7
US prescription growth is just positive at 0.9% in MAT June 2009
0.0
1.0
2.0
3.0
4.0
1996
1997
1998
1999
2000
2001
2002
2003
2004
2005
2006
2007
2008
MAT Ju
n 20
09
TR
X V
OLU
ME B
N
0
1
2
3
4
5
6
7
8
9
10
TR
X P
PG
US Growth Rate
Source: IMS Health, National Prescription Audit, Jun 2009

3.2
4.5
2.7
1.0 1.1
0
2
4
6
2005 2006 2007 2008 YTD Jun 2009
% G
RO
WTH
TRx
Source: IMS Health, National Prescription Audit, Jun 2009
US prescription growth is positive 1.1% in year to date June 2009
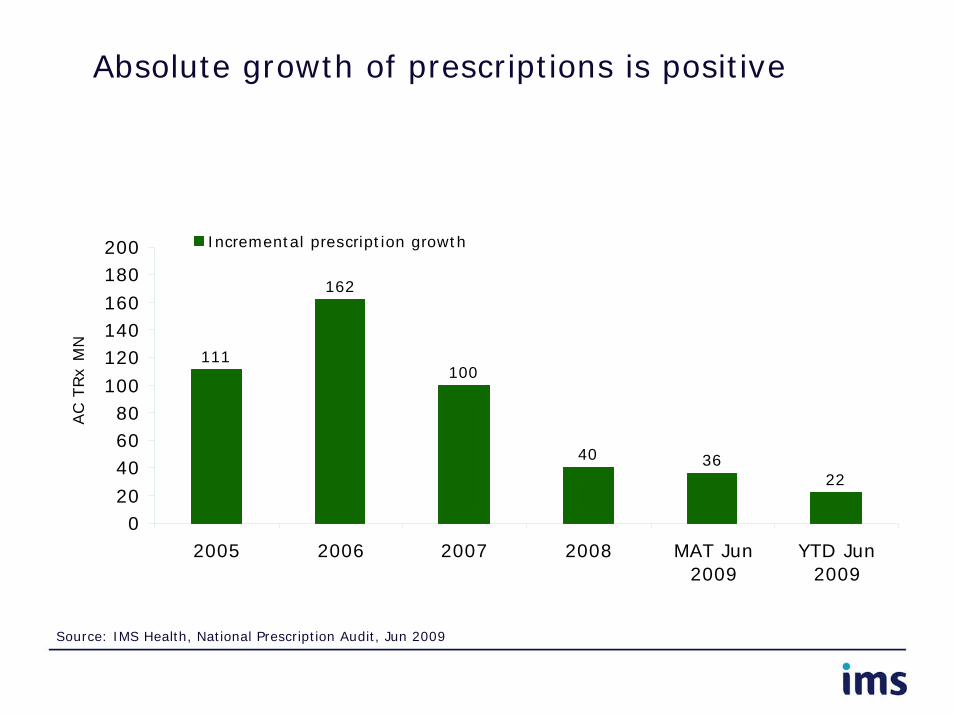
111
162
100
40 3622
020
406080
100
120140160
180200
2005 2006 2007 2008 MAT Jun2009
YTD Jun2009
AC T
Rx M
N
Incremental prescription growth
Source: IMS Health, National Prescription Audit, Jun 2009
Absolute growth of prescriptions is positive
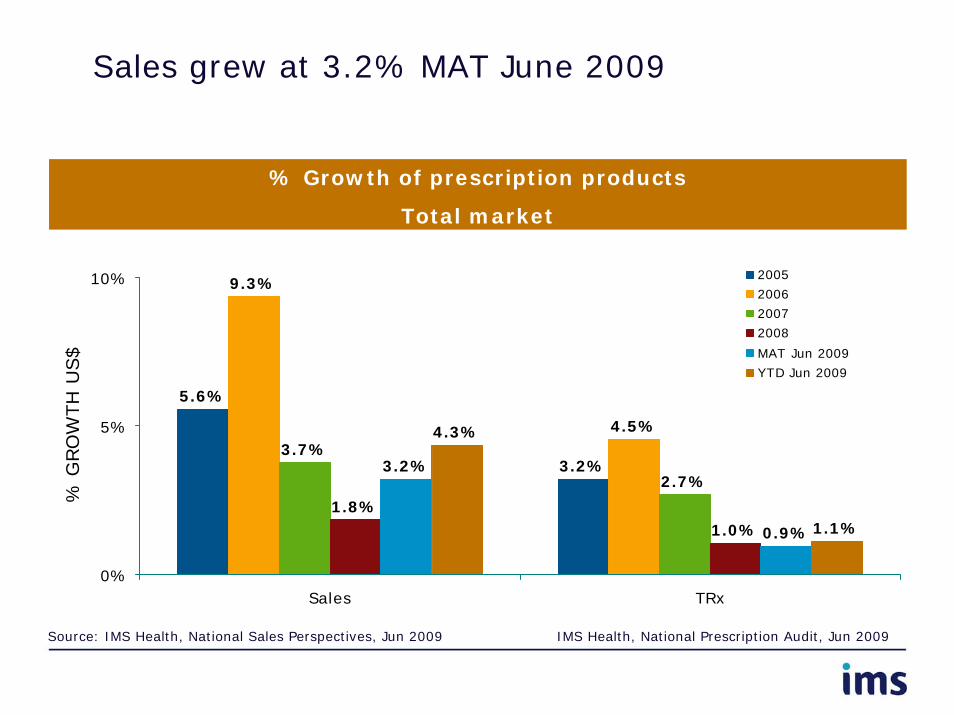
5.6%
3.2%
9.3%
4.5%3.7%
2.7%
1.8%1.0%
3.2%
0.9%
4.3%
1.1%
0%
5%
10%
Sales TRx
% G
RO
WTH
US$
2005
2006
2007
2008
MAT Jun 2009
YTD Jun 2009
Source: IMS Health, National Sales Perspectives, Jun 2009 IMS Health, National Prescription Audit, Jun 2009
% Growth of prescription products
Total market
Sales grew at 3.2% MAT June 2009

4.7%
2.8%
8.6%
4.3%
3.1%2.7%
2.1%
0.8%
3.9%
0.8%
5.0%
1.0%
0%
5%
10%
Sales TRx
% G
RO
WTH
US$
2005
2006
2007
2008
MAT Jun 2009
YTD Jun 2009
Source: IMS Health, National Sales Perspectives, Jun 2009 IMS Health, National Prescription Audit, Jun 2009
% Growth of prescription products
Retail and mail order channels
Year to date sales are 3.9% ahead of last year while Rx volume is flat

•12
Unbranded generic growth leads the market followed by specialist driven products
5.3%
0.8%
3.2%
0.9%
10.2%
5.1%
0%
5%
10%
15%
Total marketsales
Prescriptionvolume
Unbrandedgenerics sales
Biotech sales Brand sales Specialist-driven product
sales
MAT June 2009
GRO
WTH
Source: IMS Health, MIDAS, National Sales Perspectives, Rx Only, June 2009

-4%
-2%
0%
2%
4%
6%
8%
10%
12%
14%
16%
2005 2006 2007 2008 MAT Jun2009
% G
RO
WTH
US$
USPrimary care drivenSpecialist driven
Primary care driven
Primary care driven
Specialist driven
Specialist driven
24%
53%
76%
47%
MAT Jun 2009
Source: IMS Health, National Sales Perspectives, Jun 2009
% Market share US$
% Absolute change US$
Growth in primary care driven products turns positive

4.3% 4.4%
6.0%
10.5%
4.3%
2.2%
12.8%
11.1%
0%
5%
10%
15%
YTD Jun 2009
% G
RO
WTH
Total Market Brand Branded Generic Generic
Primary Care Driven Specialist Driven Biotech Oncologics
Source: IMS Health, National Sales Perspectives, Jun 2009
Source: IMS Health, National Sales Perspectives, Jun 2009% Growth US$
Year to date oncologics and generics lead growth

•15
US Sales by Channel

Channels US$bn% Market
Share% Growth
Retail 208.4 71.4 3.9
Chain 102.1 35.0 4.6
Mail service 48.7 16.7 7.8
Independents 36.8 12.6 -0.8
Food stores 20.7 7.1 0.0
Institutional 83.4 28.6 1.6
Clinics 33.6 11.5 2.1
Hospitals 31.4 10.7 2.4
Long-term care 13.7 4.7 1.1
Home health care 2.5 0.9 -3.6
HMO 1.2 0.4 -14.3
Others 1.0 0.3 2.9
Total 291.8 100.0 3.2
MAT Jun 2009
Source: IMS Health, National Sales Perspectives, Jun 2009
Chains account for more than one third of market sales in MAT June 2009 and grow at 4.6%

Channels US$bn% Market
Share% Growth
Retail 107.0 71.7 5.0
Chain 52.4 35.1 4.9
Mail service 25.4 17.0 10.0
Independents 18.6 12.4 -0.1
Food stores 10.6 7.1 3.5
Institutional 42.2 28.3 2.7
Clinics 17.0 11.4 3.9
Hospitals 16.0 10.7 3.6
Long-term care 6.9 4.6 0.0
Home health care 1.3 0.9 -1.3
HMO 0.5 0.4 -16.1
Others 0.5 0.3 4.8
Total 149.2 100.0 4.3
YTD Jun 2009
Source: IMS Health, National Sales Perspectives, Jun 2009
Year to date growth is strong at 4.3%

•18
The US market exceeded 3.8bn prescriptions with growth a positive 0.9%
Channels TRxs mn% Market
Share% Growth
Retail 3,556 91.9 0.8
Chain 2,075 53.7 2.2
Independents 756 19.6 -3.0
Mail service 240 6.2 -0.1
Food stores 484 12.5 1.4
Non retail channels 311 8.1 2.8
LTC 311 8.1 2.8
Total 3,867 100.0 0.9
MAT Jun 2009
Source: IMS Health, National Prescription Audit, Jun 2009

6.5 6.8 6.8 6.8 6.8 6.7 6.6
13.2 13.8 13.6 13.5 13.3 13.0 12.6
20.9 21.5 22.1 22.1 22.8 23.4 23.8
0
5
10
15
20
25
2004 2005 2006 2007 2008 MAT Jun2009
YTD Jun2009
SH
ARE O
F RETAIL
TRxsExtended units RxsDollars
Mail services share of dollars is three times greater than the share of prescriptions
Source: IMS Health, National Sales Perspectives, Jun 2009, National Prescription Audit, Jun 2009

•20
Generics Performance

4.2%2.7%
11.9%
0%
5%
10%
15%
YTD Jun 2009
% G
RO
WT
H
1.1%
5.6%
-9.2%-10%
-5%
0%
5%
10%
YTD Jun 2009
% G
RO
WTH
Source: IMS Health, National Prescription Audit, Branded generics disaggregated, Jun 2009
Source: IMS Health, National Sales Perspectives, Branded generics disaggregated, Jun 2009
Jan 2009 to Jun 2009Jan 2009 to Jun 2009% Growth US$ % Growth TRx
Branded Generics Disaggregated
Total market Brands Generics
Generic Rx growth is at 5.6% and sales growth is 11.9% in YTD June 2009
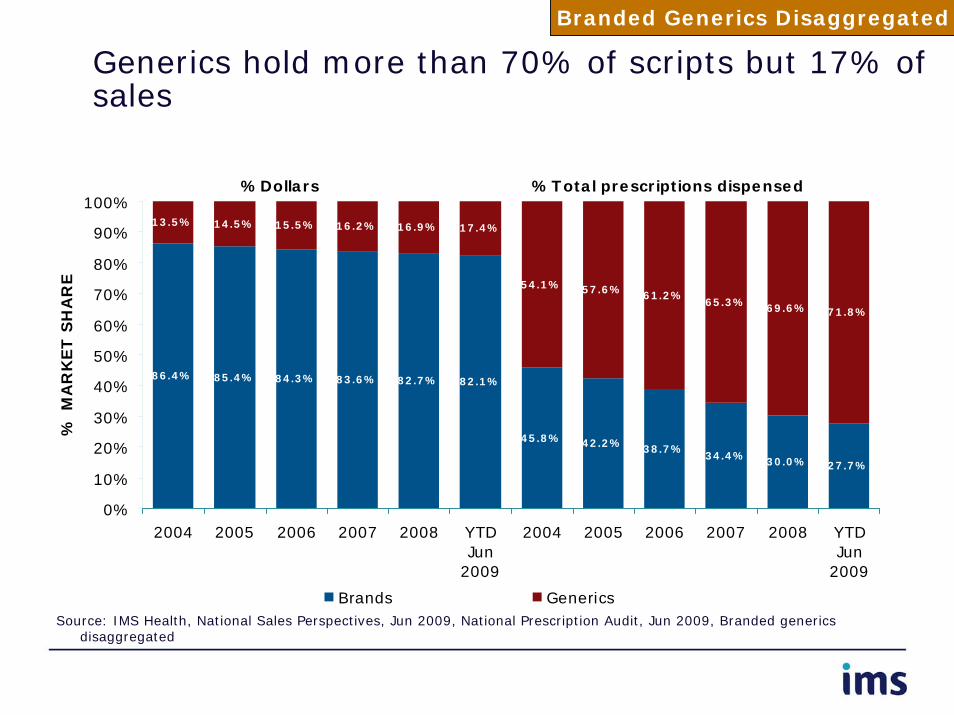
%Dollars %Total prescriptions dispensed
86.4% 85.4% 84.3% 83.6% 82.7% 82.1%
45.8% 42.2% 38.7%34.4% 30.0% 27.7%
13.5% 14.5% 15.5% 16.2% 16.9% 17.4%
54.1% 57.6% 61.2%65.3% 69.6% 71.8%
0%
10%
20%
30%
40%
50%
60%
70%
80%
90%
100%
2004 2005 2006 2007 2008 YTDJun
2009
2004 2005 2006 2007 2008 YTDJun
2009
% M
AR
KET S
HA
RE
Brands GenericsSource: IMS Health, National Sales Perspectives, Jun 2009, National Prescription Audit, Jun 2009, Branded generics
disaggregated
Branded Generics Disaggregated
Generics hold more than 70% of scripts but 17% of sales

•23
Generic sales have more than tripled since 2000 and now exceed $51 billion
Branded Generics Disaggregated
$45.0$48.0
$51.0
$15.0 $15.8$18.1
$21.3
$25.7$28.5
$36.0
$42.0
$0
$9
$18
$27
$36
$45
$54
1999 2000 2001 2002 2003 2004 2005 2006 2007 2008 MATJun
2009
US$BN
0%
5%
10%
15%
20%
25%
GRO
WTH
Generics (branded generics disaggregated)Growth v previous year
Source: IMS Health, National Sales Perspectives, Branded generics disaggregated, Jun 2009

•24
Generic prescription volume tops 2.8 billion as growth drops to 6.2%
Branded Generics Disaggregated
2.52.7 2.8
1.3 1.41.5
1.6 1.7 1.82.0
2.3
0
1
2
3
4
1999 2000 2001 2002 2003 2004 2005 2006 2007 2008 MATJun
2009
TO
TAL
RX B
N
0%
2%
4%
6%
8%
10%
12%
GRO
WTH
Generics (branded generics disaggregated)
Growth v previous year
Source: IMS Health, National Sales Perspectives, Branded generics disaggregated, Jun 2009

4.4%4.2%
2.7%
11.9%
4.3%
0%
5%
10%
15%
YTD Jun 2009
% G
RO
WTH
Total Market Brand Generic Primary Care Driven Specialist Driven
Source: IMS Health, National Sales Perspectives, Branded generics disaggregated, Jun 2009
% Growth US$
Branded Generics Disaggregated
Generic sales growth is 11.9% in YTD June 2009

•26
Sales growth for the top 10 generic companies grow at 12.7%
US$mn% Market
Share% Growth
US Industry 30,362 10.4 10.2
1 Teva 7,281 24.0 16.7
2 Mylan Labs, Inc. 3,329 11.0 29.8
3 Sandoz (Novartis) 2,188 7.2 -25.3
4 Watson Pharma 1,828 6.0 7.3
5 Par Pharma 961 3.2 6.9
6 Apotex Corp 959 3.2 2.5
7 Hospira Inc 883 2.9 11.5
8 Mallinckrodt 868 2.9 70.5
9 Wyeth Corp 789 2.6 195.4
10 Greenstone (Pfizer) 783 2.6 -0.4
Top 10 19,868 65.4 12.7
MAT Jun 2009
Sales of unbranded generics by leading corporations
Source: IMS Health, National Sales Perspectives, Jun 2009

•27
Top 20 generic companies grow at 13.6%
US$mn% Market
Share% Growth
11 Dr Reddy Inc 782 2.6 65.6
12 Boehringer Ingelheim 710 2.3 -11.7
13 Fresenius Kabi 632 2.1 43.8
14 Actavis US 498 1.6 -24.3
15 Johnson & Johnson 431 1.4 1,503.3
16 Lupin Pharma 376 1.2 21.1
17 K.V. Pharm Corp 369 1.2 -17.5
18 Baxter Healthcare 358 1.2 -10.8
19 Qualitest Products 350 1.2 19.8
20 Taro Pharm 308 1.0 24.5
Top 20 24,682 81.3 13.6
MAT Jun 2009
Sales of unbranded generics by leading corporations
Source: IMS Health, National Sales Perspectives, Jun 2009

•28
Two companies account for more than 30% of generic prescriptions
TRxs mn% Market
Share% Growth
US Industry 2,496 64.5 7.3
1 Teva 557 22.3 3.6
2 Mylan Labs, Inc. 317 12.7 7.8
3 Watson Pharma 187 7.5 -3.6
4 Sandoz (Novartis) 176 7.0 -12.3
5 Apotex Corp 101 4.1 32.3
6 Mallinckrodt 92 3.7 3.5
7 Qualitest Products 91 3.6 6.1
8 Greenstone (Pfizer) 87 3.5 4.4
9 Lupin Pharma 80 3.2 87.7
10 Actavis US 69 2.8 -11.8
Top 10 1,758 70.4 4.5
Prescriptions of unbranded generics by leading corporations
MAT Jun 2009
Source: IMS Health, National Prescription Audit, Jun 2009

•29
Top 20 corporations show a 5.3% growth
TRxs mn% Market
Share% Growth
11 Dr Reddy Inc 62 2.5 39.7
12 Amneal Inc 50 2.0 114.8
13 Par Pharma 47 1.9 -20.6
14 Ranbaxy Labs Limit 35 1.4 -32.8
15 Lannett 35 1.4 10.1
16 Aurobindo Pharm 34 1.4 54.8
17 Caraco Pharm 33 1.3 -8.0
18 K.V. Pharm Corp 32 1.3 -16.6
19 West Ward 28 1.1 18.6
20 Zydus Pharm 28 1.1 27.7
Top 20 2,141 85.8 5.3
Prescriptions of unbranded generics by leading corporations
MAT Jun 2009
Source: IMS Health, National Prescription Audit, Jun 2009

•30
Company Performance
•31
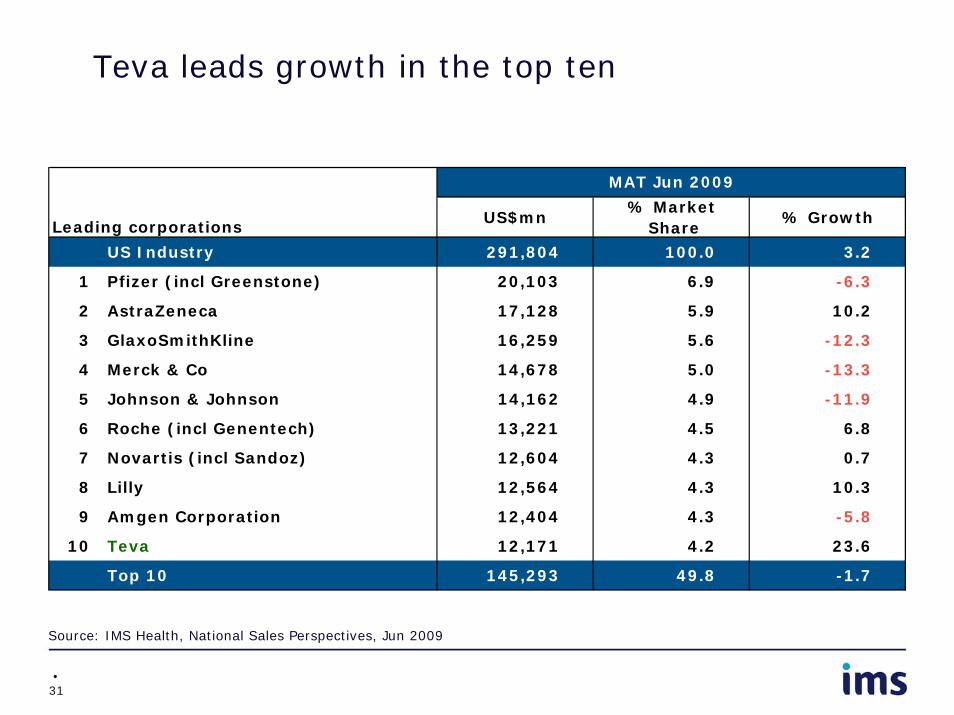
Teva leads growth in the top ten
Leading corporations US$mn% Market
Share% Growth
US Industry 291,804 100.0 3.2
1 Pfizer (incl Greenstone) 20,103 6.9 -6.3
2 AstraZeneca 17,128 5.9 10.2
3 GlaxoSmithKline 16,259 5.6 -12.3
4 Merck & Co 14,678 5.0 -13.3
5 Johnson & Johnson 14,162 4.9 -11.9
6 Roche (incl Genentech) 13,221 4.5 6.8
7 Novartis (incl Sandoz) 12,604 4.3 0.7
8 Lilly 12,564 4.3 10.3
9 Amgen Corporation 12,404 4.3 -5.8
10 Teva 12,171 4.2 23.6
Top 10 145,293 49.8 -1.7
MAT Jun 2009
Source: IMS Health, National Sales Perspectives, Jun 2009

•32
Bristol-Myers Squibb, Boehringer Ingelheim and Mylan achieve double digit growth
Leading corporations US$mn% Market
Share% Growth
11 Sanofi Aventis 11,227 3.8 8.2
12 Abbott 9,566 3.3 1.3
13 Bristol-Myers Squibb 8,422 2.9 13.2
14 Takeda 8,102 2.8 2.9
15 Wyeth Corp 7,693 2.6 -4.1
16 Boehringer Ingelheim 6,908 2.4 15.2
17 Schering Plough 4,780 1.6 3.2
18 Forest Lab 4,211 1.4 6.3
19 Eisai Corp 4,127 1.4 8.6
20 Mylan Labs, Inc. 3,747 1.3 21.0
Top 20 214,078 73.4 0.7
MAT Jun 2009
Source: IMS Health, National Sales Perspectives, Jun 2009
•33
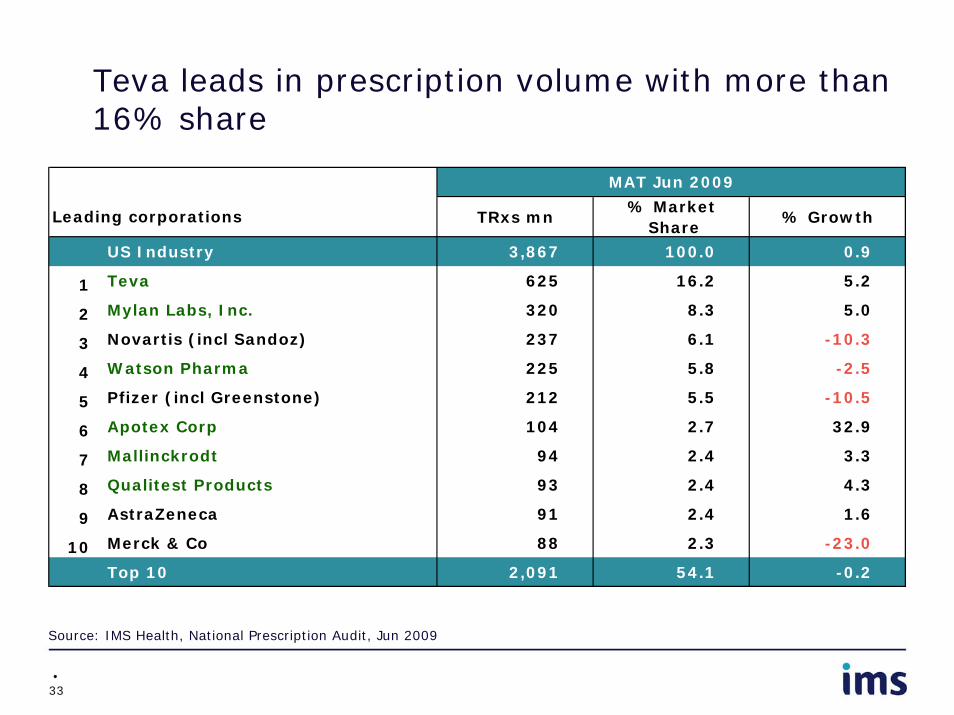
Teva leads in prescription volume with more than 16% share
TRxs mn% Market
Share% Growth
US Industry 3,867 100.0 0.9
1 Teva 625 16.2 5.2
2 Mylan Labs, Inc. 320 8.3 5.0
3 Novartis (incl Sandoz) 237 6.1 -10.3
4 Watson Pharma 225 5.8 -2.5
5 Pfizer (incl Greenstone) 212 5.5 -10.5
6 Apotex Corp 104 2.7 32.9
7 Mallinckrodt 94 2.4 3.3
8 Qualitest Products 93 2.4 4.3
9 AstraZeneca 91 2.4 1.6
10 Merck & Co 88 2.3 -23.0
Top 10 2,091 54.1 -0.2
Leading corporations
MAT Jun 2009
Source: IMS Health, National Prescription Audit, Jun 2009

•34
Prescription growth among the top 20 corporations is flat
Leading corporations TRxs mn% Market
Share% Growth
11 Lupin Pharma 80 2.1 87.0
12 GlaxoSmithKline 78 2.0 -14.5
13 Actavis US 74 1.9 -13.2
14 Boehringer Ingelheim 70 1.8 3.5
15 Dr Reddy Inc 62 1.6 39.8
16 Abbott 62 1.6 -11.2
17 Johnson & Johnson 51 1.3 -21.4
18 Amneal Inc 50 1.3 114.7
19 Lilly 50 1.3 0.9
20 Par Pharma 48 1.2 -20.3
Top 20 2,717 70.3 0.8
MAT Jun 2009
Source: IMS Health, National Prescription Audit, Jun 2009

50%
-16%
24%
26%
27%90%
-40%
-20%
0%
20%
40%
60%
80%
100%
120%
140%
% Market share US$ % Absolute change US$
All
others
Top
11-20
Top
10
Source: IMS Health, National Sales Perspectives, Jun 2009
MAT Jun 2009
Majority of US growth is coming from companies outside the top 20

•36
Absolute growth – top 10 corporations
Dollars AC US$BN TRx AC TRx mn
Teva 2.3 Lupin Pharma 37.4
AstraZeneca 1.6 Teva 30.9
Lilly 1.2 Amneal Inc 26.9
Purdue Pharma 1.1 Apotex Corp 25.7
Bristol-Myers Squibb 1 Dr Reddy Inc 17.7
Boehringer Ingelheim 0.9 Mylan Labs, Inc. 15.2
Otsuka America Ph 0.9 Cadista Inc 14.4
Roche (incl Genentech) 0.8 Wockhardt America 12.2
Sanofi Aventis 0.8 Aurobindo Pharma 12.1
Mylan Labs, Inc. 0.7 Glenmark Pharma 6.8
Source: IMS Health, National Sales Perspectives, Jun 2009, National Prescription Audit, Jun 2009

•37
Relative growth – top 10 corporations
Dollars%
GrowthTRx
% Growth
Wockhardt America 205 Cadista Inc 512
Hi-Tech Pharma Inc 82 Kvk-Tech 462
Purdue Pharma 68 Wockhardt America 161
Reckitt Benckiser 61 Anchen Pharma 120
Global Pharma Corp 51 Sun Pharma Ceutical 109
Ista Pharma 46 Lupin Pharma 87
Paddock Labs Inc 42 Purdue Pharma 85
Mallinckrodt 39 Boca Pharma Ceutica 71
Grifols USA 38 Xttrium 69
Prometheus Product 38 Corepharma 61
Source: IMS Health, National Sales Perspectives, Jun 2009, National Prescription Audit, Jun 2009

•38
USC Performance

•39
Analogs of human insulin enter the top 10 with growth approaching 30%
US$mn% Market
Share % Growth
US Industry 291,804 100.0 3.2
1 Lipid regulators 16,811 5.8 -3.2
2 Antipsychotics,oth 14,222 4.9 3.3
3 Proton pump inhib 13,891 4.8 -0.9
4 Anti-depressants 11,420 3.9 -1.9
5 Angiotensin II antagonists 7,946 2.7 12.9
6 Seizure disorders 7,773 2.7 -18.1
7 Antineo monoclonal antib 7,670 2.6 9.3
8 Erythropoietins 6,450 2.2 -12.9
9 Antiarth,biol resp mod 5,938 2.0 13.6
10 Analogs of human insulin 5,699 2.0 28.8
Top 10 97,819 33.5 0.4
MAT Jun 2009
Leading classes
Source: IMS Health, National Sales Perspectives, Jun 2009
•40
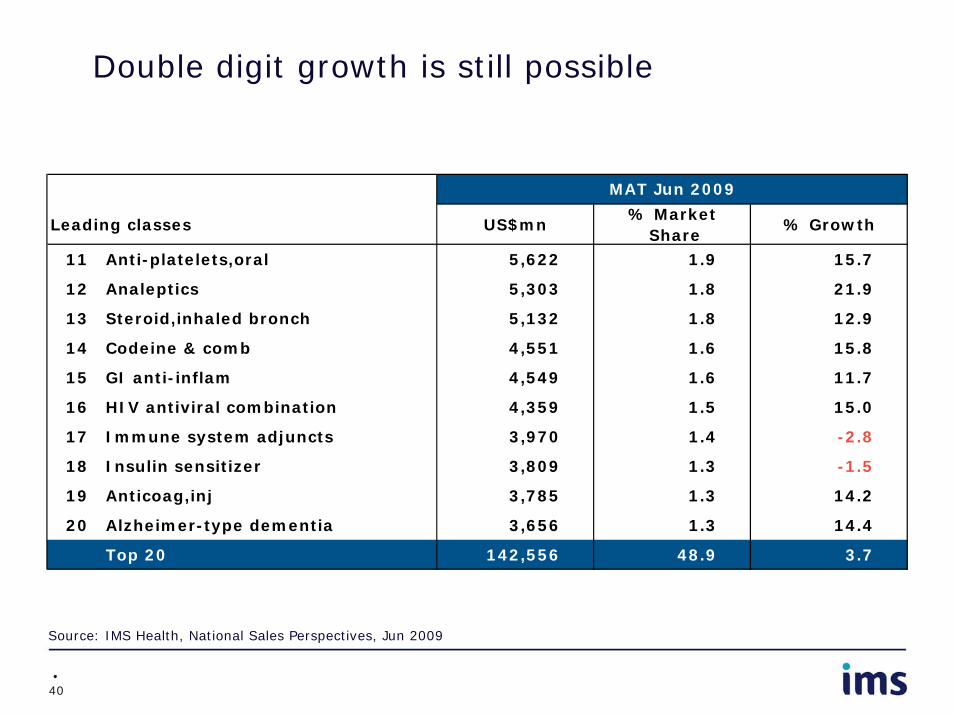
Double digit growth is still possible
Source: IMS Health, National Sales Perspectives, Jun 2009
Leading classes US$mn% Market
Share% Growth
11 Anti-platelets,oral 5,622 1.9 15.7
12 Analeptics 5,303 1.8 21.9
13 Steroid,inhaled bronch 5,132 1.8 12.9
14 Codeine & comb 4,551 1.6 15.8
15 GI anti-inflam 4,549 1.6 11.7
16 HIV antiviral combination 4,359 1.5 15.0
17 Immune system adjuncts 3,970 1.4 -2.8
18 Insulin sensitizer 3,809 1.3 -1.5
19 Anticoag,inj 3,785 1.3 14.2
20 Alzheimer-type dementia 3,656 1.3 14.4
Top 20 142,556 48.9 3.7
MAT Jun 2009

•41
Insulins exceed $1 billion in incremental growth
Leading classes by absolute growth US$mnIncr sales growth
$mn
US Industry 291,804 9,069
1 Analogs of human insulin 5,699 1,276
2 Analeptics 5,303 952
3 Angiotensin II antagonists 7,946 908
4 Anti-platelets,oral 5,622 761
5 Antiarth,biol resp mod 5,938 713
6 Antineo monoclonal antib 7,670 653
7 Codeine & comb 4,551 621
8 Steroid,inhaled bronch 5,132 585
9 HIV antiviral combination 4,359 569
10 UT benign prostate 2,807 520
MAT Jun 2009
Source: IMS Health, National Sales Perspectives, Jun 2009

•42
Lipid lowering agents now rank second in Rx volume
Leading therapy classes TRxs mn% Market
Share% Growth
US Industry 3,867 100.0 0.9
1 Anti-depressants 238 6.2 2.0
2 Lipid regulators 233 6.0 3.6
3 Codeine & comb 198 5.1 4.2
4 Ace inhibitors 161 4.2 1.1
5 Beta blockers 130 3.4 -2.0
6 Proton pump inhib 117 3.0 6.0
7 Thyroid hormone,synth 102 2.6 1.7
8 Seizure disorders 101 2.6 6.0
9 Calcium blockers 90 2.3 2.2
10 Benzodiazepines 87 2.2 3.2
Top 10 1,458 37.7 2.7
MAT Jun 2009
Source: IMS Health, National Prescription Audit, Jun 2009

•43
Rx growth in the top 20 classes is 2.2%
TRxs mn% Market
Share% Growth
11 Angiotensin II antagonists 84 2.2 -0.2
12 O/C estrogen/progestogen 81 2.1 -0.6
13 Antiarth,plain 77 2.0 3.1
14 Macrolides & related 65 1.7 -1.1
15 Penicillins 61 1.6 -2.5
16 Beta agonists 59 1.5 1.3
17 Non-barb,oth 58 1.5 6.0
18 Biguanides 52 1.3 3.7
19 Diuretics,thiazide & rel 52 1.3 -1.0
20 Antipsychotics,oth 51 1.3 5.1
Top 20 2,098 54.2 2.2
Leading therapy classes
MAT Jun 2009
Source: IMS Health, National Prescription Audit, Jun 2009

•44
Absolute growth – top 10 therapies
DollarsAC
US$mn Total Rx dispensed
ACTRxs mn
Analogs of human insulin 1275.6 Lipid regulators 8.0
Analeptics 952.2 Codeine & comb 8.0
Angiotensin II antagonists 907.8 Proton pump inhib 6.7
Anti-platelets,oral 761.0 Seizure disorders 5.7
Antiarth,biol resp mod 712.6 Vitamin D 4.8
Antineo monoclonal antib 652.9 Anti-depressants 4.7
Codeine & comb 620.7 Analeptics 3.4
Steroid,inhaled bronch 585.0 Analogs of human insulin 3.3
HIV antiviral combination 569.2 Non-barb,oth 3.3
UT benign prostate 519.8 Benzodiazepines 2.7
Source: IMS Health, National Sales Perspectives, Jun 2009, National Prescription Audit, Jun 2009

•45
Bottom 10 therapies by absolute TRx growth
Therapeutic classes: Ten largest negative absolute growth
Absolute changeTRx mn
% Growth TRx
Penicillins -1.6 -2.5
Hormones,estrogens -1.7 -5.5
Leukotriene agents -2.0 -6.3
Diuretics,comb -2.0 -8.6
Insulin sensitizer -2.2 -11.4
Anthst/decn -2.4 -21.3
Synth narc,analg -2.5 -8.6
Beta blockers -2.7 -2.0
Quinolones, systemic -2.7 -6.6
Antihistamines alone -13.9 -33.0Source: IMS Health, National Prescription Audit, Jun 2009

•46
Relative growth – top 10 therapies
Dollars%
GrowthTotal Rx dispensed
%Growth
DPP-4 Inhibitor 51 Vitamin D 79
Antineoplastics,misc,oth 46 DPP-4 Inhibitor 35
Tetracyclines 43 Specific antagonists 28
Antineo folic acid analo 33 Antihyperlipidemic agt 23
Antihyperlipidemic agt 33 Pre-Xray evacuants 18
Neurological disorders 33 Alpha-beta blocker 14
Analogs of human insulin 29 Anti-obesity,systemic 13
Specific antagonists 28 Analogs of human insulin 12
Diabetes,non-insulin com 25 Analeptics 9
Hormones,androgens 25 UT benign prostate 8
Source: IMS Health, National Sales Perspectives, Jun 2009, National Prescription Audit, Jun 2009

•47
Product Performance

•48
Abilify and Plavix achieve double digit growth in MAT June 2009
Products Company US$mn% Market
Share% Growth
US Industry 291,804 100.0 3.2
1 Lipitor® Pfizer 7,668 2.6 -2.9
2 Nexium® AstraZeneca 6,111 2.1 7.2
3 Plavix® BMS 5,212 1.8 15.8
4 Advair Diskus® GlaxoSmithKline 4,540 1.6 6.1
5 Seroquel® AstraZeneca 3,965 1.4 9.2
6 Singulair® Merck & Co 3,548 1.2 2.5
7 Abilify® Otsuka America Ph 3,525 1.2 35.7
8 Actos® Takeda 3,245 1.1 5.8
9 Enbrel® Amgen 3,164 1.1 0.1
10 Remicade® Johnson & Johnson 3,099 1.1 7.9
Top 10 44,076 15.1 7.1
MAT Jun 2009
Source: IMS Health, National Sales Perspectives, Jun 2009

•49
Double digit growth from Avastin, Cymbalta and Oxycontin
Products Company US$mn% Market
Share% Growth
11 Epogen® Amgen 3,074 1.1 2.1
12 Prevacid® Takeda 2,971 1.0 -7.7
13 Neulasta® Amgen 2,965 1.0 -2.4
14 Effexor XR® Wyeth 2,926 1.0 -1.2
15 Avastin® Genentech,Inc. 2,789 1.0 18.7
16 Lexapro® Forest Lab 2,734 0.9 1.5
17 Lovenox® Sanofi Aventis 2,662 0.9 7.5
18 Cymbalta® Lilly 2,650 0.9 19.8
19 Oxycontin Purdue Pharma 2,644 0.9 70.6
20 Zyprexa® Lilly 2,564 0.9 7.4
Top 20 72,056 24.7 7.5
MAT Jun 2009
Source: IMS Health, National Sales Perspectives, Jun 2009

•50
Watson’s hydrocodone with APAP replaces Lipitor as the most prescribed product
Leading Products Company TRxs mn% Market
Share% Growth
US Industry 3,867 100.0 0.9
1 hycd/apap Watson Pharma 59 1.5 5.8
2 Lipitor® Pfizer 55 1.4 -9.7
3 hycd/apap Mallinckrodt 53 1.4 -1.7
4 levothyroxine Mylan Labs, Inc. 38 1.0 6.9
5 amoxicillin Teva 36 0.9 2.7
6 lisinopril Lupin Pharma 34 0.9 32.7
7 Nexium® AstraZeneca 31 0.8 1.0
8 Plavix® BMS 29 0.8 4.1
9 Lexapro® Forest Lab 29 0.8 -5.7
10 Singulair® Merck & Co 28 0.7 -6.2
Top 10 394 10.2 1.6
MAT Jun 2009
Source: IMS Health, National Prescription Audit, Jun 2009
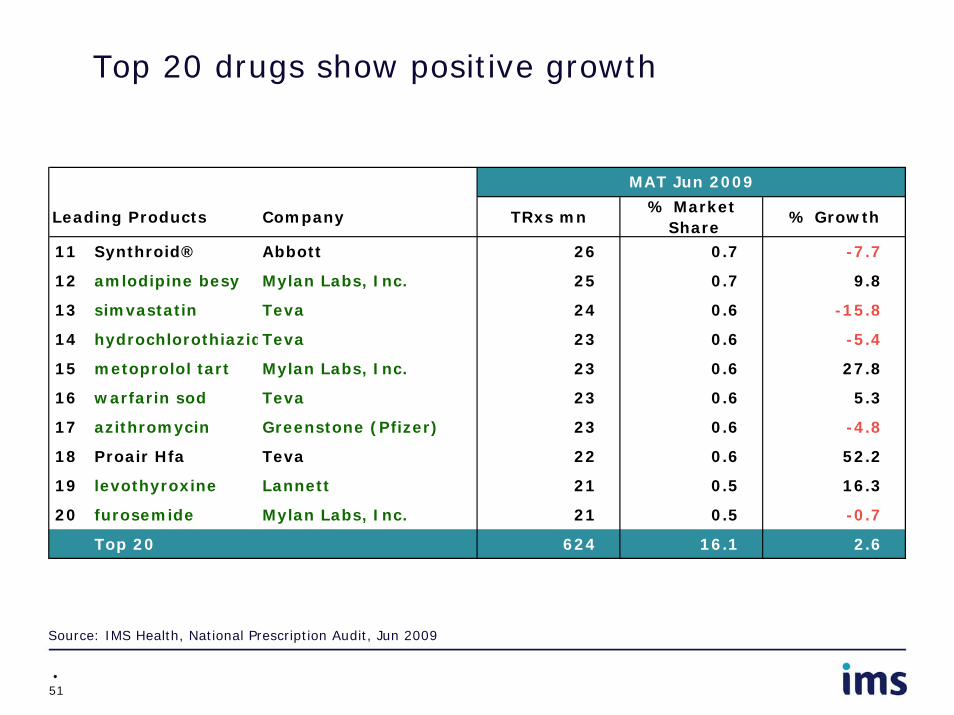
•51
Top 20 drugs show positive growth
Leading Products Company TRxs mn% Market
Share% Growth
11 Synthroid® Abbott 26 0.7 -7.7
12 amlodipine besy Mylan Labs, Inc. 25 0.7 9.8
13 simvastatin Teva 24 0.6 -15.8
14 hydrochlorothiazidTeva 23 0.6 -5.4
15 metoprolol tart Mylan Labs, Inc. 23 0.6 27.8
16 warfarin sod Teva 23 0.6 5.3
17 azithromycin Greenstone (Pfizer) 23 0.6 -4.8
18 Proair Hfa Teva 22 0.6 52.2
19 levothyroxine Lannett 21 0.5 16.3
20 furosemide Mylan Labs, Inc. 21 0.5 -0.7
Top 20 624 16.1 2.6
MAT Jun 2009
Source: IMS Health, National Prescription Audit, Jun 2009

•52
Absolute growth – top 10 products
DollarsAC
US$mnOxycontin Purdue Pharma 1,094
Abilify Otsuka America Ph 928
lamotrigine Teva 745
Plavix BMS Sanofi 712
Crestor Astrazeneca 699
Humira bott Pharma Prods 561
pantoprazole sod Wyeth-Ayerst 522
Januvia Merck 465
Avastin Genentech 439
Cymbalta Lilly 439
Total Rx dispensedAC
TRxs mnsimvastatin Lupin Pharma 14.8
alendronate sod Teva 10.1
azithromycin Wockhardt America 8.8
lisinopril Lupin Pharma 8.5
ibuprofen (rx) Amneal Pharma 7.6
Proair Hfa Teva Respiratory 7.4
Ocella Teva 6.9
pantoprazole sod Wyeth-Ayerst 6.8
lamotrigine Teva 6.2
fluticasone prop Apotex 5.8
Source: IMS Health, National Sales Perspectives, Jun 2009, National Prescription Audit, Jun 2009

•53
Relative growth – top 10 products
Dollars%
Growthlamotrigine Teva >999
Novoseven Rt Novo Nordisk >999
risperidone Teva >999
Ocella Teva >999
risperidone Patriot Pharma >999
amphetamin salt e Teva >999
oxycodone hcl er Mallinckrodt >999
sumatriptan succin Dr Reddy's >999
Isentress Merck 237
pantoprazole sod Wyeth-Ayerst 197
Total Rx dispensed%
Growthazithromycin Wockhardt America >999
Ocella Teva >999
lamotrigine Teva >999
cyclobenzaprin hcl Cadista Pharma >999
risperidone Teva >999
citalopram hbr Torrent Pharma 621
simvastatin Lupin Pharma 505
fluticasone prop Apotex 458
methylprednisolon Cadista Pharma 438
lorazepam Actavis 375
Source: IMS Health, National Sales Perspectives, Jun 2009, National Prescription Audit, Jun 2009

•54
OTC Trends from IRI

•55
OTC dollar sales showing sustained growth over time. Highest growth of 4.9% achieved in 2007
$5$7$9
$11$13$15$17$19$21$23$25
2004
2005
2006
2007
2008
Lat 5
2 Wks
SA
LES
US
$B
N
-5
0
5
10
15
% G
RO
WT
H U
S$
Source: IRI Infoscan Total US FDMx Latest 52 weeks ending July 12, 2009

•56
Drug accounts for almost 60% of OTC sales volume and grew at 3.9% in Latest 52 weeks period
Channels Sales US$BN% Market
Share% Growth
FDMx $21.6 100.0 2.4
Drug $12.6 58.3 3.9
Food $6.7 31.2 (0.4)
Massx $2.3 10.5 2.7
Lat 52 Wks
Source: IRI Infoscan Total US FDMx Latest 52 weeks ending July 12, 2009

•57
Cold/Allergy/Sinus Tablets are significantly larger than other OTC categories while grew in the Latest 52 weeks period.
US$mn% Market
Share % Growth
Total OTC $21,560 100.0 2.4
1 COLD/ALLERGY/SINUS TABLETS/PAC $2,614 12.1 3.8
2 INTERNAL ANALGESIC TABLETS $2,098 9.7 0.6
3 MINERAL SUPPLEMENTS $1,514 7.0 7.7
4 ANTACID TABLETS $1,111 5.2 0.9
5 EYE/LENS CARE SOLUTIONS $932 4.3 - 0.6
6 WEIGHT CONTROL/NUTRITIONALS LIQ $896 4.2 5.8
7 FACIAL ANTI-AGING $769 3.6 16.1
8 MULTI-VITAMINS $739 3.4 2.6
9 ADULT INCONTINENCE PRODUCTS $685 3.2 6.7
10 COLD/ALLERGY/SINUS LIQUID/POWD $610 2.8 - 0.2
Top 10 $11,970 55.5 3.8
Lat 52 Wks
Leading classes
Source: IRI Infoscan Total US FDMx Latest 52 weeks ending July 12, 2009

•58
1&2 Letter Vitamins and Laxative Stimulants have posted strong growth in the Latest 52 weeks period.
Leading classes US$mn% Market
Share% Growth
11 FIRST AID - TAPE/BANDAGE/GAUZE/CO $523 2.4 (0.9)
12 NASAL SPRAY/DROPS/INHALER $517 2.4 3.8
13 LAXATIVE TABLETS $484 2.2 3.7
14 FIRST AID OINTMENTS/ANTISEPTICS $457 2.1 1.4
15 FOOT CARE DEVICES $422 2.0 6.5
16 1 & 2 LETTER VITAMINS $400 1.9 17.0
17 COUGH/SORE THROAT DROP $399 1.9 (3.9)
18 LIP BALM/COLD SORE MEDICATION $399 1.9 (0.4)
19 ACNE TREATMENTS $370 1.7 1.1
20 LAXATIVE/STIMULANT LIQ/PWDR/OIL $325 1.5 9.5
Top 20 16,266 75.4 3.6
Lat 52 Wks
Source: IRI Infoscan Total US FDMx Latest 52 weeks ending July 12, 2009

•59
Mineral Supplements has the highest sales growth in the Latest 52 weeks period.
Leading classes by absolute growth US$mnAbsolute sales
growth $mn
Total OTC $21,560 $511
1 MINERAL SUPPLEMENTS $1,514 $108
2 FACIAL ANTI-AGING $769 $107
3 COLD/ALLERGY/SINUS TABLETS/PACKETS $2,614 $96
4 1 & 2 LETTER VITAMINS $400 $58
5 WEIGHT CONTROL/NUTRITIONALS LIQ/PWD $896 $49
6 ADULT INCONTINENCE PRODUCTS $685 $43
7 PERSONAL LUBRICANTS $154 $31
8 LIQUID VITAMINS/MINERALS $150 $31
9 LAXATIVE/STIMULANT LIQ/PWDR/OIL $325 $28
10 FOOT CARE DEVICES $422 $26
Lat 52 Wks
Source: IRI Infoscan Total US FDMx Latest 52 weeks ending July 12, 2009

•60
Nasal Spray Drops have posted stronger growth than some larger categories in the Latest 52 week period
Leading classes by absolute growth US$mnAbsolute sales
growth $mn
11 NASAL SPRAY/DROPS/INHALER $517 $19
12 MULTI-VITAMINS $739 $18
13 LAXATIVE TABLETS $484 $17
14 COUGH SYRUP $297 $17
15 INTERNAL ANALGESIC TABLETS $2,098 $12
16 MUSCLE/BODY SUPPORT DEVICES $313 $11
17 ANTACID TABLETS $1,111 $10
18 STOMACH REMEDY TABLETS $48 $9
19 ANTI SMOKING PATCH $115 $7
20 FIRST AID OINTMENTS/ANTISEPTICS $457 $6
Lat 52 Wks
Source: IRI Infoscan Total US FDMx Lat 52 weeks ending July 12, 2009

•61
Products Company US$mn% Total OTC
Share% Growth
US Industry 21,560 100.0 2.4
1 Private Label Private Label 4,852 22.5 10.9
2 Tylenol J&J 755 3.5 - 3.1
3 Mucinex Reckitt Benckiser 384 1.8 7.3
4 Advil Wyeth 383 1.8 - 0.3
5 Nature Made Pharmavite Corp 374 1.7 15.5
6 Claritin Schering Plough 333 1.5 - 7.1
7 Zyrtec J&J 311 1.4 68.8
8 Natures Bounty US Nutrition 289 1.3 18.7
9 Alcon Nestle 266 1.2 - 0.1
10 Ensure Abbott 239 1.1 5.1
Top 10 8,186 38.0 5.5
Lat 52 Wks
Strongest growth from Zyrtec, Natures Bounty, Nature Made and Private Label. Private Label share is significantly larger than other brands.
Source: IRI Infoscan Total US FDMx, Latest 52 weeks ending July 12, 2009

•62
Private Label and Zyrtec had the strongest absolute growth
DollarsAC
US$mnPrivate Label Private Label 476
Zyrtec J&J 127
Nature Made Pharmavite 50
Natures Bounty US Nutrition 45
Miralax Schering-Plough 35
Mucinex Reckitt Benckiser 26
Poise Kimberly Clark 12
Ensure Abbott 12
Depend Kimberly Clark 10
Bayer Bayer 5
Source: IRI Infoscan Total US FDMx, Latest 52 weeks ending July 12, 2009
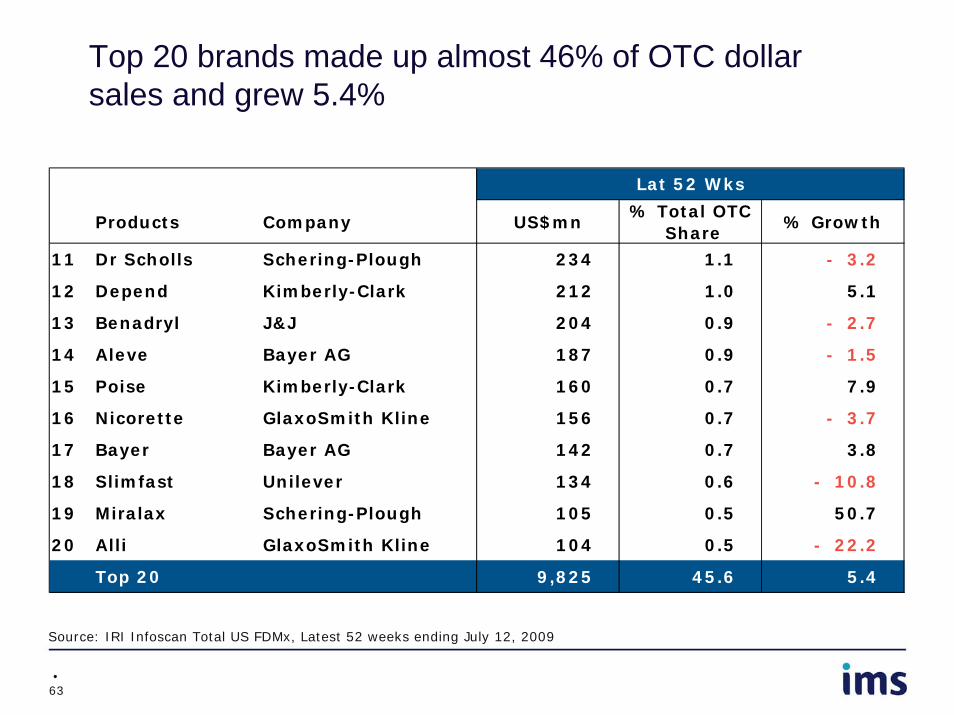
•63
Top 20 brands made up almost 46% of OTC dollar sales and grew 5.4%
Products Company US$mn% Total OTC
Share% Growth
11 Dr Scholls Schering-Plough 234 1.1 - 3.2
12 Depend Kimberly-Clark 212 1.0 5.1
13 Benadryl J&J 204 0.9 - 2.7
14 Aleve Bayer AG 187 0.9 - 1.5
15 Poise Kimberly-Clark 160 0.7 7.9
16 Nicorette GlaxoSmith Kline 156 0.7 - 3.7
17 Bayer Bayer AG 142 0.7 3.8
18 Slimfast Unilever 134 0.6 - 10.8
19 Miralax Schering-Plough 105 0.5 50.7
20 Alli GlaxoSmith Kline 104 0.5 - 22.2
Top 20 9,825 45.6 5.4
Lat 52 Wks
Source: IRI Infoscan Total US FDMx, Latest 52 weeks ending July 12, 2009

•64
Johnson & Johnson and Private Label brands contributed more than 30% of Total OTC sales
Leading corporationsUS$mn
% Total OTC Share
% Growth
US Industry 21,560 100.0 1.6
1 Private Label 4,852 22.5 10.9
2 Johnson & Johnson * 1,705 7.9 - 3.8
3 Procter & Gamble 1,165 5.4 - 5.1
4 Wyeth 1,079 5.0 - 3.0
5 GlaxoSmithKline 902 4.2 - 6.7
6 Schering Plough 899 4.2 - 2.0
7 Bayer AG 793 3.7 0.8
8 Novartis 631 2.9 - 3.0
9 Reckitt Benckiser 496 2.3 5.2
10 Abbott 381 1.8 1.9
Top 10 12,902 59.8 6.4
Lat 52 Wks
* Includes Pfizer OTC, Neutrogena, McNeil
Source: IRI Infoscan Total US FDMx, Latest 52 weeks ending July 12, 2009
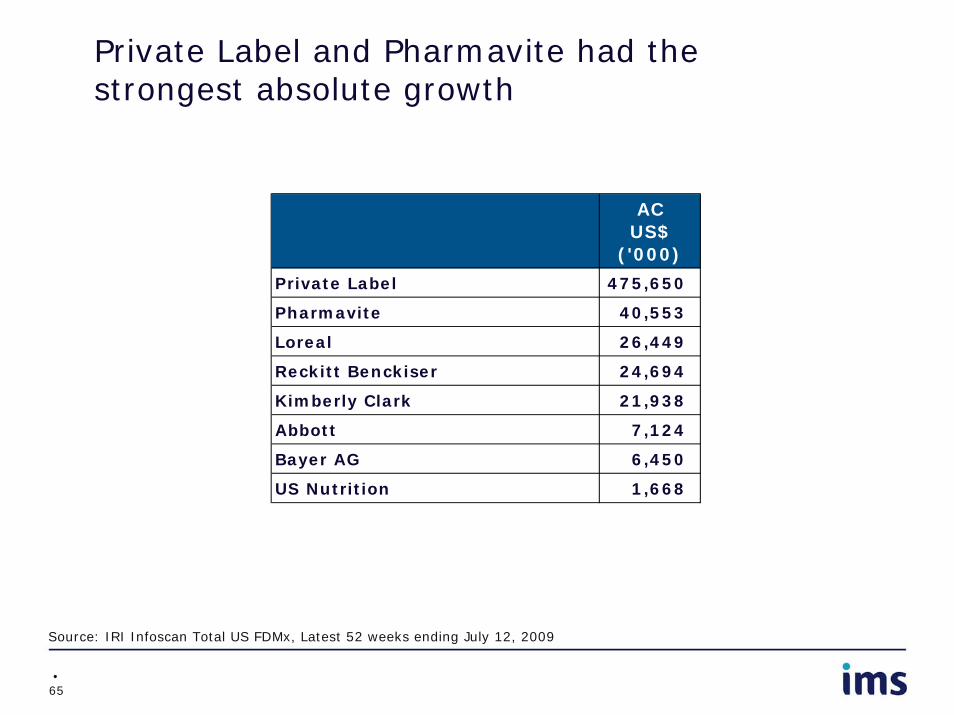
•65
Private Label and Pharmavite had the strongest absolute growth
ACUS$
('000)
Private Label 475,650
Pharmavite 40,553
Loreal 26,449
Reckitt Benckiser 24,694
Kimberly Clark 21,938
Abbott 7,124
Bayer AG 6,450
US Nutrition 1,668
Source: IRI Infoscan Total US FDMx, Latest 52 weeks ending July 12, 2009

•66
Products from the Top 20 Vendors made up almost 70% of Total OTC sales.
Leading corporationsUS$mn
% Market Share
% Growth
11 Pharmavite 379 1.8 12.0
12 Kimberly Clark 372 1.7 6.3
13 Chattem 236 1.1 (3.1)
14 Bausch and Lomb 234 1.1 (3.8)
15 Cadbury 170 0.8 (0.6)
16 Boehringer Ingelheim 160 0.7 (4.7)
17 Loreal 156 0.7 20.5
18 3M 153 0.7 (0.7)
19 Nestle 93 0.4 (2.0)
20 US Nutrition 9 0.0 23.9
Top 20 14,864 68.9 6.0
Lat 52 Wks
Source: IRI Infoscan Total US FDMx, Latest 52 weeks ending July 12, 2009

•67
OTC Categories
1 & 2 LETTER VITAMINS DIURETIC TABLETS LIQUID VITAMINS/MINERALSACNE TREATMENTS DOUCHES MINERAL SUPPLEMENTSADULT INCONTINENCE PRODUCTS DRINKING WATER GERMICIDAL TABLETS MOTION SICKNESS TABLETSALL OTHER FEM. HYGIENE/MED. TREATMENTS EAR CARE PRODUCTS MOTION SICKNESS/EMETIC/ANTI-EMETICANTACID LIQUID/POWDER EAR DROPS/TREATMENTS MULTI-VITAMINSANTACID TABLETS EPSOM SALTS MUSCLE/BODY SUPPORT DEVICESANTACID/ANALGESIC COMBO EXTERNAL ANALGESICS RUBS NASAL ASPIRATORSANTI ITCH TREATMENTS (INC CALAMINE) EYE/LENS CARE SOLUTIONS NASAL SPRAY/DROPS/INHALERANTI SMOKING ALL OTHER FORMS EYE/LENS CARE TABLETS/ACCESSORIES NASAL STRIPSANTI SMOKING FILTERS FACIAL ANTI-AGING ORAL PAIN RELIEFANTI SMOKING GUM FEMININE PAIN RELIEVERS OVULATION PREDICTION KITSANTI SMOKING MOUTH SPRAY FIRST AID - TAPE/BANDAGE/GAUZE/COTTON PERSONAL LUBRICANTSANTI SMOKING PATCH FIRST AID KITS PREGNANCY TEST KITSANTI SMOKING TABLETS FIRST AID OINTMENTS/ANTISEPTICS RFG WEIGHT CONTROL/NUTRITIONAL LIQ/PWDBEDWETTING REMEDIES FOOT CARE DEVICES SALT TABLETSBODY ANTI-AGING FOOT CARE/ATHLETES FOOT MEDICATION SLEEPING AID LIQUIDSBORIC ACID HAIR GROWTH PRODUCTS SLEEPING AID TABLETSCAFFEINE TABLETS/LIQUIDS HEAT/ICE PACKS SMELLING SALTSCHEST RUBS HEMORRHOIDAL CREAM/OINTMENT/SPRAY SORE THROAT REMEDY LIQUIDSCOLD/ALLERGY/SINUS LIQUID/POWDER HEMORRHOIDAL REMEDIES STOMACH REMEDY LIQUID/POWDERCOLD/ALLERGY/SINUS TABLETS/PACKETS INSECT FIRST AID PRODUCTS STOMACH REMEDY TABLETSCOUGH SYRUP INTERNAL ANALGESIC LIQUIDS THUMB SUCKING REMEDIESCOUGH/SORE THROAT DROP INTERNAL ANALGESIC TABLETS VAGINAL TREATMENTSDEODORANT TABLETS LAXATIVE TABLETS WEIGHT CONTROL CANDY/TABLETSDIARRHEA MEDICINE LIQUID/POWDER LAXATIVE/STIMULANT LIQ/PWDR/OIL WEIGHT CONTROL/NUTRITIONALS LIQ/PWDDIARRHEA TABLETS LICE TREATMENTS WART REMOVERSDIURETIC LIQUIDS/POWDERS LIP BALM/COLD SORE MEDICATION SUNSCREEN/INSECT REPELLENT

•68
Thank you
Visit www.imshealth.com for more information on IMS’ Viewpoint
Doug Long [email protected]


