flow is pure Ar, deteriorates the detection limits of all elements. The present study confirms and extends two ear- lier36, 37 conclusions regarding the use of N2 in the outer flow. First, outer gas flows containing 5 to 15% N2 provide the highest net line emission, at all forward power and observation heights investigated. Unfortunately, these higher line intensities are not translated into improved powers of detection because of the higher background of these plasmas. Second, the optimum conditions for these Ar-N2 plasmas, except for the observation height, are identical to those of a conventional Ar plasma. ACKNOWLEDGMENTS The authors express their sincere appreciation to M. Floyd who helped them in the use of a computerized graphics facility for the production of some of the figures. Thanks are also given to B. Bear, F. Grabau, and R. Winge for their advice and assistance in various parts of this work. 1. V. A. Fassel, Science 202, 183 (1978). 2. R. M. Barnes, Crit. Rev. Anal. Chem. 7, 203 (1978). 3. T. B. Reed, J. Appl. Phys. 32, 821 (1961). 4. T. B. Reed, J. Appl. Phys. 32, 2534 (1961). 5. T. B. Reed, Int. Sci. Technol. June 1962, pp. 42-48. 6. S. Greenfield, Proc. Soc. Anal. Chem. 2, 111 (1965). 7. S. Greenfield, P. B. Smith, A. E. Breeze, and N. M. D. Chilton, Anal. Chim. Acta 41, 385 (1968). 8. S. Greenfield and P. B. Smith, Anal. Chim. Acta 57,209 (1971). 9. S. Greenfield, Metron 3, 224 (1971). 10. R. M. Dagnal], D. J. Smith, T. S. West, and S. Greenfield, Anal. Chim. Acta 54, 397 (1971). 11. S. Greenfield and P. B. Smith, Anal. Chim. Acta 59, 341 (1972). 12. S. Greenfield, H. M. McGeachin, and P. B. Smith, Talanta 23, 1 (1976). 13. S. Greenfield, I. L. Jones, H. M. McGeachin, and P. B. Smith, Anal. Chim. Acta 74, 225 (1975). 14. S. Greenfield, Proc. Anal. Div. Chem. Soc. 13(8), 223 (1976). 15. S. Greenfield and H. M. McGeachin, Anal. Chim. Acta 100, 101 (1978). 16. S. Greenfield and D. T. Burns, Anal. Chim. Acta 113, 205 (1980). 17. M. Capitelli, F. Cramarossa, L. Triolo, and M. Molinari, Combust. Flame 15, 23 (1970). 18. M. Capitelli, Ing. Chim. Ital. 6, 94 (1970). 19. D. Truitt and J. W. Robinson, Anal. Chim. Acta 49, 401 (1970). 20. D. Trnitt and J. W. Robinson, Anal. Chim. Acta 50, 61 (1970). 21. J. F. Alder and J. M. Melrmet, Spectrochim. Acta 28B, 421 (1973). 22. M. H. Abdallah and J. M. Mermet, J. Quant. Spectrosc. Radiat. Transfer 19, 83 (1978). 23. M. L. Thorpe, NASA Contractors Report CR-1143 (1968). 24. P. B. Zeeman, S. P. Terblance, K. Visser, and F. H. Mann, Appl. Spectrosc. 32, 572 (1978). 25. R. M. Barnes and S. Nikdel, J. Appl. Phys. 47, 3929 (1976). 26. R. M. Barnes and S. Nikdel, Appl. Spectrosc. 30, 310 (1976). 27. M. Thompson, B. Pahlavanpour, and S. J. Walton, Analyst 103, 568 (1978). 28. G. F. Kirkbright and R. D. Snook, Anal. Chem. 51, 1938 (1979). 29. P. A. Arsen'ev and E. F. Kustov, Teplofiz. Vys. Temp. 6, 44 (1968). 30. B. Bogdain, Kontron ICP-Berichet, Ausgabe 2, February 1978. 31. D. Sommer and K. Ohls, Fresenius Z. Anal. Chem. 295, 337 (1979). 32. K. Ohis and D. Sommer, Fresenius Z. Anal. Chem. 296, 241 (1979). 33. K. Ohls and D. Sommer, ICP Inf. Newlett. 4, 532 (1979). 34. A. Montaser, paper No. 82, presented at the Vth FACSS Meeting, Boston, October 1978. 35. A. Montaser, paper No. 109, presented at tl~e 178th ACS National Meeting, Washington, DC, September 1979. 36. A. Montaser and J. Mortazavi, Anal. Chem. 52, 225 (1980). 37. J. Zalewski, Dissertation Department of Chemistry, Iowa State University, Ames, 1978. 38. G. Russell and A. Watson, ICP Inf. Newslett. 5, 548 (1980). 39. A. Watson, ICP Inf. Newslett. 5, 553 (1980). 40. L. Ebdon, D. Mowthorpe, and M. Cave, Anal. Chim. Acta 115, 171 (1980). 41. L. Ebdon, M. Cave, and D. Mowthorpe, Anal. Chim. Acta 115, 179 (1980). 42. R. Barnes and G. Meyer, Anal. Chem. 52, 1523 (1980). 43. A. P. D'Silva, G. Rice, and V. A. Fassel, Appl. Spectrosc. 34, 578 (1980). 44. R. K. Winge, V. A. Fassel, R. N. Kniseley, E. DeKalb, and W. J. Haas, Jr., Spectrochim. Acta 32B, 327 (1977). 45. K. W. Olson, W. J. Haas, and V. A. Fassel, Anal. Chem. 49, 632 (1977). 46. A. Montaser and V. A. Fassel, Anal. Chem. 48, 1490 (1976). 47. O. Davies, The Design and Analysis of Experiments, 2nd ed. (Oliver and Boyd, London, 1956). 48. M. Box, D. Davies, and W. Swann, Non-linear Optimization Techniques (Oliver and Boyd, London, 1969). 49. G. Larson, V. A. Fassel, R. Scott, and R. N. Kniseley, Anal. Chem. 47, 238 (1975). 50. R. K. Winge, V. J. Peterson, and V. A. Fassel, Appl. Spectrosc. 33, 206, (1979). 51. P. W. J. M. Boumans and F. J. DeBoer, Spectrochim. Acta 32B, 365 (1977). 52. T. E. Edmonds and G. Horlick, Appl. Spectrosc. 31, 536 (1977). 53. R. H. Scott, A. Strasheim, and M. L. Kokot, Anal. Chim. Acta 82, 67 (1976). 54. B. V. L'vov and L. A. Pelieva, Zh. Anal. Khim. 33, 1695 (1978). 55. D. Kalnicky, V. Fassel, and R. Kniseley, Appl. Spectrosc. 31, 137 (1977). 56. J. M. Mermet, C. R. Acad. Sci. Paris 281B, 275 (1975). 57. H. U. Eckert, paper No. 3, presented at the International Winter Conference on Developments in Atomic Plasma Spectrochemical Analysis, San Juan, Puerto Rico, January 1980. 58. J. F. Alder, R. M. Bombelka, and G. F. Kirkbright, Spectrochim. Acta 35B, 163 (1980). 59. R. J. Lovett, paper No. 52, presented at the VIth FACSS Meeting, Philadel- phia, 1979. 60. E. S. Fishburne, J. Chem. Phys. 47, 58 (1967). 61. B. Brocklehurst, Light Emission from Gases Irradiated with X-rays (United Kingdom Atomic Energy Establishment, Harwen, Berkshire, 1963), report number AERE-C/R 2669. 62. S. Goldstein, A. D'Silva, and V. Fassel, Radiat. Res. 59, 522 (1974). 63. A. N. Wright and C. A. Winkler, Active Nitrogen (Academic Press, New York, 1968), pp. 15, 37. The Use of a High Temperature Hollow Cathode Lamp for the Determination of Trace Elements in Steels, Nickel-Base Alloys, and Ferroalloys by Emission Spectrometry BO THELIN Swedish Institute for Metals Research, Drottning Kristinas vfig 48, 114 28 Stockholm, Sweden A high temperature hollow cathode lamp from Applied Re- search Laboratories, Luton, was used for multielement deter- Received 7 June 1980; revision received 25 November 1980. ruination of trace elements in steels, nickel-base alloys and ferroalloys. A 10-mg sample (chips) was placed inside a hollow graphite electrode in the lamp, which was filled with helium. It was possible to raise the power through the lamp Hnearly and 302 Volume 35, Number 3, 1981 APPLIED SPECTROSCOPY
Transcript
flow is pure Ar, deteriorates the detection limits of all elements.
The present study confirms and extends two ear- lier36, 37 conclusions regarding the use of N2 in the outer flow. First, outer gas flows containing 5 to 15% N2 provide the highest net line emission, at all forward power and observation heights investigated. Unfortunately, these higher line intensities are not translated into improved powers of detection because of the higher background of these plasmas. Second, the optimum conditions for these Ar-N2 plasmas, except for the observation height, are identical to those of a conventional Ar plasma.
ACKNOWLEDGMENTS
The authors express their sincere appreciation to M. Floyd who helped them in the use of a computerized graphics facility for the production of some of the figures. Thanks are also given to B. Bear, F. Grabau, and R. Winge for their advice and assistance in various parts of this work.
1. V. A. Fassel, Science 202, 183 (1978). 2. R. M. Barnes, Crit. Rev. Anal. Chem. 7, 203 (1978). 3. T. B. Reed, J. Appl. Phys. 32, 821 (1961). 4. T. B. Reed, J. Appl. Phys. 32, 2534 (1961). 5. T. B. Reed, Int. Sci. Technol. June 1962, pp. 42-48. 6. S. Greenfield, Proc. Soc. Anal. Chem. 2, 111 (1965). 7. S. Greenfield, P. B. Smith, A. E. Breeze, and N. M. D. Chilton, Anal. Chim.
Acta 41, 385 (1968). 8. S. Greenfield and P. B. Smith, Anal. Chim. Acta 57,209 (1971). 9. S. Greenfield, Metron 3, 224 (1971).
10. R. M. Dagnal], D. J. Smith, T. S. West, and S. Greenfield, Anal. Chim. Acta 54, 397 (1971).
11. S. Greenfield and P. B. Smith, Anal. Chim. Acta 59, 341 (1972). 12. S. Greenfield, H. M. McGeachin, and P. B. Smith, Talanta 23, 1 (1976). 13. S. Greenfield, I. L. Jones, H. M. McGeachin, and P. B. Smith, Anal. Chim.
Acta 74, 225 (1975). 14. S. Greenfield, Proc. Anal. Div. Chem. Soc. 13(8), 223 (1976). 15. S. Greenfield and H. M. McGeachin, Anal. Chim. Acta 100, 101 (1978). 16. S. Greenfield and D. T. Burns, Anal. Chim. Acta 113, 205 (1980). 17. M. Capitelli, F. Cramarossa, L. Triolo, and M. Molinari, Combust. Flame 15,
23 (1970). 18. M. Capitelli, Ing. Chim. Ital. 6, 94 (1970). 19. D. Trui t t and J. W. Robinson, Anal. Chim. Acta 49, 401 (1970). 20. D. Trnit t and J. W. Robinson, Anal. Chim. Acta 50, 61 (1970). 21. J. F. Alder and J. M. Melrmet, Spectrochim. Acta 28B, 421 (1973). 22. M. H. Abdallah and J. M. Mermet, J. Quant. Spectrosc. Radiat. Transfer 19,
83 (1978). 23. M. L. Thorpe, NASA Contractors Report CR-1143 (1968). 24. P. B. Zeeman, S. P. Terblance, K. Visser, and F. H. Mann, Appl. Spectrosc.
32, 572 (1978). 25. R. M. Barnes and S. Nikdel, J. Appl. Phys. 47, 3929 (1976). 26. R. M. Barnes and S. Nikdel, Appl. Spectrosc. 30, 310 (1976). 27. M. Thompson, B. Pahlavanpour, and S. J. Walton, Analyst 103, 568 (1978). 28. G. F. Kirkbright and R. D. Snook, Anal. Chem. 51, 1938 (1979). 29. P. A. Arsen'ev and E. F. Kustov, Teplofiz. Vys. Temp. 6, 44 (1968). 30. B. Bogdain, Kontron ICP-Berichet, Ausgabe 2, February 1978. 31. D. Sommer and K. Ohls, Fresenius Z. Anal. Chem. 295, 337 (1979). 32. K. Ohis and D. Sommer, Fresenius Z. Anal. Chem. 296, 241 (1979). 33. K. Ohls and D. Sommer, ICP Inf. Newlett. 4, 532 (1979). 34. A. Montaser, paper No. 82, presented at the Vth FACSS Meeting, Boston,
October 1978. 35. A. Montaser, paper No. 109, presented at tl~e 178th ACS National Meeting,
Washington, DC, September 1979. 36. A. Montaser and J. Mortazavi, Anal. Chem. 52, 225 (1980). 37. J. Zalewski, Dissertation Department of Chemistry, Iowa State University,
Ames, 1978. 38. G. Russell and A. Watson, ICP Inf. Newslett. 5, 548 (1980). 39. A. Watson, ICP Inf. Newslett. 5, 553 (1980). 40. L. Ebdon, D. Mowthorpe, and M. Cave, Anal. Chim. Acta 115, 171 (1980). 41. L. Ebdon, M. Cave, and D. Mowthorpe, Anal. Chim. Acta 115, 179 (1980). 42. R. Barnes and G. Meyer, Anal. Chem. 52, 1523 (1980). 43. A. P. D'Silva, G. Rice, and V. A. Fassel, Appl. Spectrosc. 34, 578 (1980). 44. R. K. Winge, V. A. Fassel, R. N. Kniseley, E. DeKalb, and W. J. Haas, Jr.,
Spectrochim. Acta 32B, 327 (1977). 45. K. W. Olson, W. J. Haas, and V. A. Fassel, Anal. Chem. 49, 632 (1977). 46. A. Montaser and V. A. Fassel, Anal. Chem. 48, 1490 (1976). 47. O. Davies, The Design and Analysis of Experiments, 2nd ed. (Oliver and
Boyd, London, 1956). 48. M. Box, D. Davies, and W. Swann, Non-linear Optimization Techniques
(Oliver and Boyd, London, 1969). 49. G. Larson, V. A. Fassel, R. Scott, and R. N. Kniseley, Anal. Chem. 47, 238
(1975). 50. R. K. Winge, V. J. Peterson, and V. A. Fassel, Appl. Spectrosc. 33, 206, (1979). 51. P. W. J. M. Boumans and F. J. DeBoer, Spectrochim. Acta 32B, 365 (1977). 52. T. E. Edmonds and G. Horlick, Appl. Spectrosc. 31, 536 (1977). 53. R. H. Scott, A. Strasheim, and M. L. Kokot, Anal. Chim. Acta 82, 67 (1976). 54. B. V. L'vov and L. A. Pelieva, Zh. Anal. Khim. 33, 1695 (1978). 55. D. Kalnicky, V. Fassel, and R. Kniseley, Appl. Spectrosc. 31, 137 (1977). 56. J. M. Mermet, C. R. Acad. Sci. Paris 281B, 275 (1975). 57. H. U. Eckert, paper No. 3, presented at the International Winter Conference
on Developments in Atomic Plasma Spectrochemical Analysis, San Juan, Puerto Rico, January 1980.
58. J. F. Alder, R. M. Bombelka, and G. F. Kirkbright, Spectrochim. Acta 35B, 163 (1980).
59. R. J. Lovett, paper No. 52, presented at the VIth FACSS Meeting, Philadel- phia, 1979.
60. E. S. Fishburne, J. Chem. Phys. 47, 58 (1967). 61. B. Brocklehurst, Light Emission from Gases Irradiated with X-rays (United
Kingdom Atomic Energy Establishment, Harwen, Berkshire, 1963), report number AERE-C/R 2669.
62. S. Goldstein, A. D'Silva, and V. Fassel, Radiat. Res. 59, 522 (1974). 63. A. N. Wright and C. A. Winkler, Active Nitrogen (Academic Press, New
York, 1968), pp. 15, 37.
The Use of a High Temperature Hollow Cathode Lamp for the Determination of Trace Elements in Steels, Nickel-Base Alloys, and Ferroalloys by Emission Spectrometry
B O T H E L I N Swedish Institute for Metals Research, Drottning Kristinas vfig 48, 114 28 Stockholm, Sweden
A high temperature hollow cathode lamp from Applied Re- search Laboratories, Luton, was used for multielement deter-
R e c e i v e d 7 J u n e 1980; r e v i s i o n r e c e i v e d 25 N o v e m b e r 1980.
ruination of trace e l ements in steels , n icke l -base a l loys and f e r r o a l l o y s . A 10-mg sample (chips) w a s p laced i n s i d e a h o l l o w g r a p h i t e e l e c t r o d e in the lamp, w h i c h w a s f i l l e d w i t h h e l i u m . I t w a s poss ible to raise the p o w e r through the lamp Hnearly and
302 Volume 35, Number 3, 1981 APPLIED SPECTROSCOPY
automatical ly , so that the combined thermal and sputter ing effect in the lamp atomized the different e lements one after another according to their boi l ing points. This select ive volatil- izat ion improved the precis ion and the l imits of detect ion for the e lements determined. Ana lys i s results for Ph, Bi, Zn, Ag, Sb, and Ca in the concentrat ion range 0.05 to 100 pg g=l are dis- cussed. Because of the effective atomizat ion in the lamp, no matr ix effects were observed for these e lements . One of the main purposes of this invest igat ion w a s to s tudy the t ime de- pendence of the intens i ty for the different e lements during the volat i l izat ion phase. This procedure gave very c lean spectra. In this invest igat ion a n e w computer ized image dissector echel le spectrometer, w a s used as the registration system.
Index Headings: Emiss ion spectroscopy; Hol low cathode excita- tion; Trace analys is .
I N T R O D U C T I O N
I t is well known to metal lurgists tha t small concentra- tions of certain t race e lements such as Pb, Bi and Zn will reduce the hot ductility, creep strength, and weldabil i ty of steels and other alloys; high-aUoy steels and superal- loys are part icular ly susceptible. Many of the t race ele- ments studied in this work are character ized by a much higher volati l i ty at e levated t empera tu res than the main components of a steel or nickel-base alloy (Table I).
In the high t empera tu re hollow cathode lamp, which is a hot type of hollow cathode, the rma l vaporizat ion appears to be the chief mechan i sm for ent ry of sample into the discharge. A graphite electrode is used as the hot cathode. Graphi te is a highly favored ca thode mate - rial because it is stable at very high tempera tures . I t also produces a simple emission background, and contr ibutes little to the total sput ter ing effect. Under the effect of ion bombardmen t , the electrode is hea ted to high tem- pera tures (2000 to 2500 ° C), which also heats the adjacent sample layer. In hot cathodes, high current densities (250 m A / c m 2) appear, which excite the volatilized e lements in the electrode effectively. These effects make this type of hollow cathode very useful for de terminat ion of vola- tile t race components in a nonvolati le base and also produce a very clean spectrum.
Few repor ts have appeared concerning the use of this type of hot hollow cathode lamp for the analysis of nonrefrac tory alloys such as steels, nickel-base alloys, and ferroalloys. A paper referring to the de te rmina t ion of trace e lements in steels, high t empera tu re alloys, and related mater ia ls has been published by Thornton . 1 In another investigation, Mitchell and Harr is 2 have deter- mined a l imited num ber of e lements in copper and nickel samples. Some Russian papers have been published on the use of hot type hollow cathode lamps for determi-
TABLE I. Boi l ing points of different e lements in steel.
Element °C Ele- °C Ele- °C ment ment
P 280 Bi 1560 Ni 2732 As 613 (sub1) Pb 1740 Fe 2750 Se 685 Sb 1750 Co 2870 Cd 765 Mn 1962 Ti 3287 Zn 907 Ag 2212 Mo 4612 Te 990 Sn 2270 Nb 4742 Mg 1090 Si 2355 Ta 5420 T1 1460 Cu 2567 W 5660 Ca 1484 Cr 2672
J i
FIG. 1. The high temperature hollow cathode lamp.
T A B L E I I . E x p e r i m e n t a l p a r a m e t e r s .
Flush time 30 s Preburn time 30 s Integration time 240 s Integration time per line 10 s Measure time per measure point 0.1 s Preburn power 50 W Integration power start 50 W Integration power end 420 W Helium pressure 800 Pa Sample weigh 10 mg Electrode Ringsdorff RW 0232 Internal length of electrode 25 mm Internal diameter of electrode 4 mm Spectrometer IDES Slit width 35 gm Wavelength range 200-800 nm
nat ion of meta ls in refractory materials . 3-7 These workers have used high current discharges (1 A) and have in this way achieved selective volatil ization of the analyzed ele- ments f rom the host matrix, thus avoiding complex spec- tra.
T h e purpose of the present s tudy of a high t empera tu re hollow cathode lamp was to improve the me thod for s imul taneous de terminat ion of a number of t race ele- ments in steels, nickel-base alloys, and ferroalloys. An- other a im was to s tudy the volatilization proper t ies of volatile e lements in these types of alloys. For these studies, a new kind of computer ized echelle spec t romete r ( IDES) was used. s A fur ther a im was to improve the limits of detect ion for the e lements de te rmined by using the photon counting sys tem of this spect rometer .
I. E X P E R I M E N T A L
The high t empe ra tu r e hollow cathode in this repor t is based on the model of Tho rn ton I and is manufac tu red by Applied Research Laboratories . The lamp consists of a tube of stainless steel, which is evacuated and flushed with hel ium gas (Fig. 1). T h e mant le const i tutes the anode, and a graphite electrode with the sample forms the cathode. The discharge chamber is flushed with hel ium through the inlet (A) and outlet (B). T h e light f rom the discharge passes th rough a quartz window (C) to the spect rometer . The re is a window (D) of glass for observat ion of the discharge. T h e graphi te electrode (E)
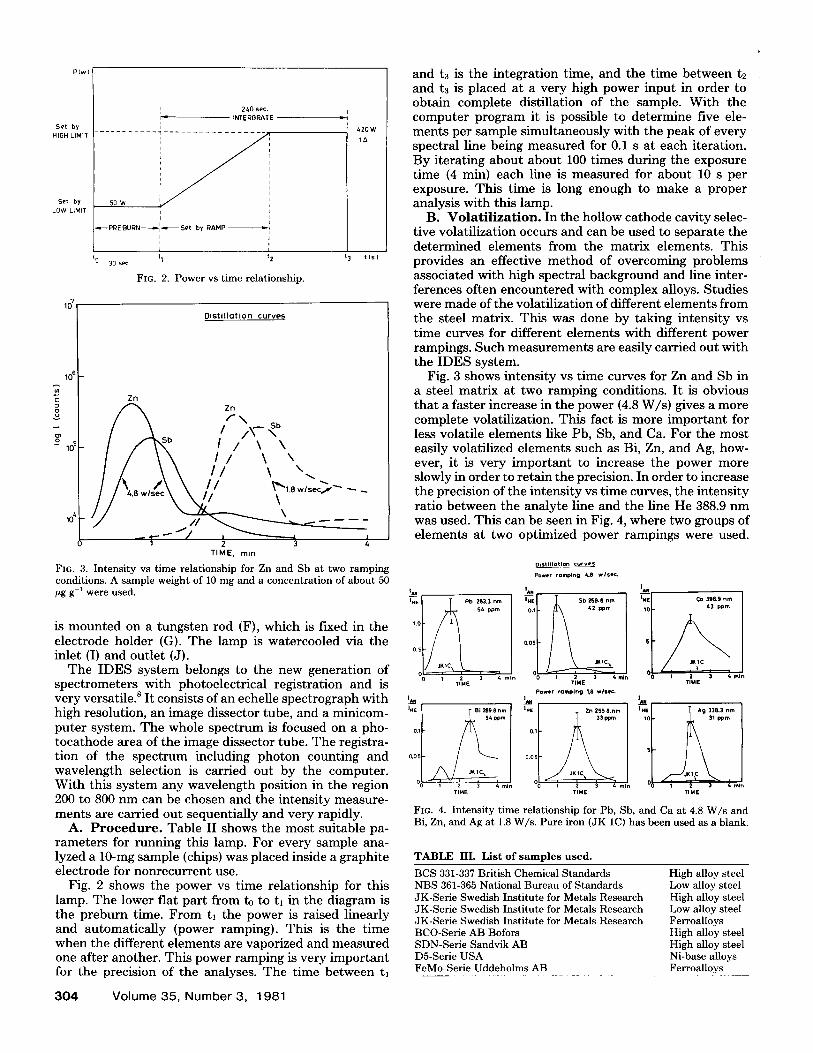
FIG. 3. Intensity vs time relationship for Zn and Sb at two ramping conditions. A sample weight of 10 mg and a concentration of about 50 ~g g-1 were used.
is moun ted on a tungsten rod (F), which is fixed in the electrode holder (G). The lamp is watercooled via the inlet (I) and out le t (J).
T h e I D E S sys tem belongs to the new generat ion of spec t rometers with photoelectr ical registrat ion and is very versatile, s I t consists of an echelle spec t rograph with high resolution, an image dissector tube, and a minicom- puter system. T h e whole spec t rum is focused on a pho- toca thode area of the image dissector tube. T h e registra- t ion of the spec t rum including photon counting and wavelength selection is carried out by the computer . With this sys tem any wavelength posit ion in the region 200 to 800 nm can be chosen and the intensi ty measure- men t s are carried out sequential ly and very rapidly.
A. P r o c e d u r e . Tab le I I shows the mos t suitable pa- r amete r s for running this lamp. For every sample ana- lyzed a 10-mg sample (chips) was placed inside a graphi te electrode for nonrecur ren t use.
Fig. 2 shows the power vs t ime relat ionship for this lamp. T h e lower flat pa r t f rom to to tl in the d iagram is the p reburn t ime. F rom h the power is raised l inearly and automat ica l ly (power ramping). This is the t ime when the different e lements are vaporized and measured one af ter another . This power ramping is very impor tan t for the precision of the analyses. The t ime be tween tl
3 0 4 Vo lume 35, N u m b e r 3, 1981
and t3 is the integrat ion time, and the t ime be tween t2 and to is placed a t a very high power input in order to obta in complete distillation of the sample. With the compute r p rogram it is possible to de te rmine five ele- men t s per sample s imul taneously with the peak of every spectral line being measured for 0.1 s at each iteration. By i terating abou t about 100 t imes during the exposure t ime (4 min) each line is measured for about 10 s per exposure. Th is t ime is long enough to make a proper analysis with this lamp.
B. V o l a t i l i z a t i o n . In the hollow ca thode cavi ty selec- t ive volatil ization occurs and can be used to separa te the de te rmined e lements f rom the mat r ix elements. Th is provides an effective me thod of overcoming prob lems associated with high spectral background and line inter- ferences often encountered with complex alloys. Studies were made of the volati l ization of different e lements f rom the steel matrix. This was done by taking intensi ty vs t ime curves for different e lements with different power rampings. Such measu remen t s are easily carried out with the I D E S system.
Fig. 3 shows intensi ty vs t ime curves for Zn and Sb in a steel mat r ix at two ramping conditions. I t is obvious tha t a faster increase in the power (4.8 W/s) gives a more complete volatilization. This fact is more impor t an t for less volatile e lements like Pb, Sb, and Ca. For the mos t easily volatilized e lements such as Bi, Zn, and Ag, how- ever, it is very impor tan t to increase the power more slowly in order to re ta in the precision. In order to increase the precision of the intensi ty vs t ime curves, the intensi ty rat io be tween the analyte line and the line He 388.9 n m was used. This can be seen in Fig. 4, where two groups of e lements a t two optimized power rampings were used.
Oist illotiofl__ curves
Power romoln9 4.8 wlsec.
I ~ IAN law
~-E Pb 283.3 nm ~ Iwg 54 ppm 0,1 42 pprn 43 ppm
1.0
O.05 0.5
JKlC JglC
0 T2E~M 3 4 min 0 1 TIME2 3 4 hen e0 1 T2EIM 3 4 rain 0 1
Power rampin 9 1,8 wliec.
I~E Zn 255 8.nm 54 ppm 33 pprn
0.1 0,1
0.05 0.05
min O0 1 2 3 4 m~n 1 2 3 4 TIME TIME
rain
Fro. 4. Intensity time relationship for Pb, Sb, and Ca at 4.8 W/s and Bi, Zn, and Ag at 1.8 W/s. Pure iron (JK 1C) has been used as a blank.
TABLE III. List of samples used.
BCS 331-337 British Chemical Standards NBS 361-365 National Bureau of Standards JK-Serie Swedish Institute for Metals Research JK-Serie Swedish Institute for Metals Research JK-Serie Swedish Institute for Metals Research BCO-Serie AB Bofors SDN-Serie Sandvik AB D5-Serie USA FeMo-Serie Uddeholms AB
High alloy steel Low alloy steel High alloy steel Low alloy steel Ferroalloys High alloy steel High alloy steel Ni-base alloys Ferroalloys
For each curve, a pure iron sample (JK 1C) was run as a REL,NT. l/IHe • V O / V i
blank. • ,6'
II. R E S U L T S
The analyzed samples, shown in Table III, were high and low alloyed steels, nickel-base alloys and ferroalloys. 9 In Figs. 5 tc 9 analytical curves for Pb, Bi, Zn, Ag, and Ca in these materials are shown.
IAN/IHE × Vo/Vi was calculated for each concentration, where/AN is the integrated intensity of the analyte line and IHE is the integrated intensity of the helium line. Th e helium line is a reference line, which compensates for variations in the plasma. The weight ratio Vo/Vi is used for compensation of variations in the sample weights. In this ratio V0 is the weight used for calibration (generally 10 mg) and Vi is the actual sample weight. As can be seen Figs. 5 to 9 the analytical curves for both high and low alloyed steel samples are all linear, illustrating the very small matr ix effects in the lamp.
FIG. 6. Calibration graphs for various types of alloys: 0, 20Cr/10Ni; m, 12Cr/7ONi/9Co.
100 Ca 396.9 rim
15 5b lb0 CALCIUM CONCENTRATION pgg'~
FIG. 9. Calibration graphs for various types of alloys: O, 20Cr/24Ni/ 4Mo; m, 20Cr/10Ni.
Analytical results for Bi, Zn, Ag, Pb, Sb, and Ca in steel samples, nickel-base alloys and ferroalloys can be seen in Tables IV to IX. A power increase of 1.8 W/s was used for the most easily vaporized elements Bi, Zn, and Ag and a power increase of 4.8 W /s for Pb, Sb, and Ca in order to achieve complete volatilization. The precision
APPLIED S P E C T R O S C O P Y 3 0 5
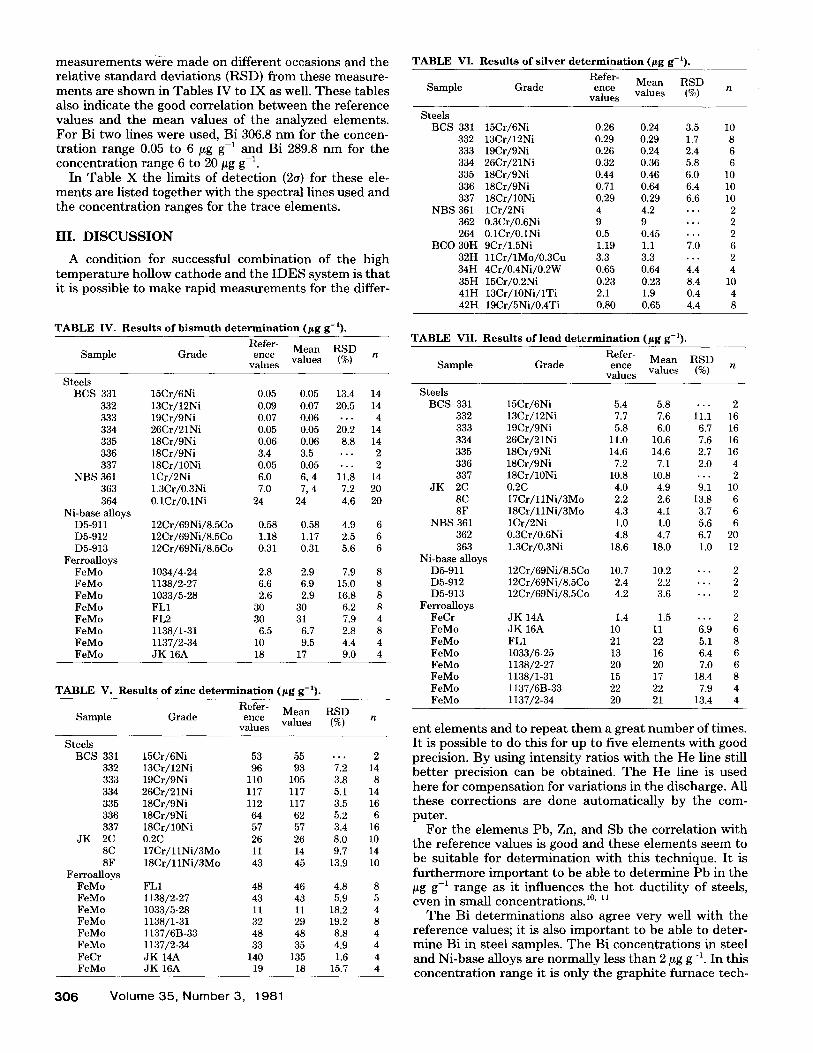
measurements were made on different occasions and the relative standard deviations (RSD) from these measure- ments are shown in Tables IV to IX as well. These tables also indicate the good correlation between the reference values and the mean values of the analyzed elements. For Bi two lines were used, Bi 306.8 nm for the concen- tration range 0.05 to 6 ~g g-~ and Bi 289.8 nm for the concentration range 6 to 20 ftg g-1.
In Table X the limits of detection (2o) for these ele- ments are listed together with the spectral lines used and the concentration ranges for the trace elements.
III. D I S C U S S I O N
A condition for successful combination of the high temperature hol low cathode and the IDES system is that it is possible to make rapid measurements for the differ-
TABLE IV. Results of bismuth determination (pg g-~).
ent e l e m e n t s and to repeat t h e m a great n u m b e r of t imes . It is poss ib le to do th is for up to f ive e l e m e n t s w i t h good precision. By using intensity ratios with the He line still better precision can be obtained. The He line is used here for compensat ion for variations in the discharge. All these corrections are done automatical ly by the com- puter.
For the elements Pb, Zn, and Sb the correlation with the reference values is good and these elements seem to be suitable for determination with this technique. It is furthermore important to be able to determine Pb in the ~g g-1 range as it influences the hot ductility of steels, even in small concentrations. 1°' ~1
The Bi determinations also agree very well with the reference values; it is also important to be able to deter- mine Bi in steel samples. The Bi concentrations in steel and Ni-base alloys are normally less than 2/zg g-1. In this c o n c e n t r a t i o n range it is o n l y the graphite furnace tech-
, nique in atomic absorption spectroscopy 12' 13 which is comparable from the point of view of sensitivity, preci- sion, and simplicity with the high temperature hollow cathode technique.
The most favorable element for analysis with this technique is Ag. This element has a very low limit of detection and can be determined down to about 10 -2/zg g-~ with a RSD of about 5%, which is satisfactory.
The correlation with the reference values for Ca are mostly very good. Determining Ca in the concentration range less than 10/~g g-~, which is an ordinary content in steel, is usually difficult due to contamination problems.
If you consider the steel analyses in the concentration range 0.1 to 120 gg g-~ for these elements, the mean values of the RSD of different analyses are in the order of 4 to 7%. These results are good enough for practical analytical work in the trace concentration range.
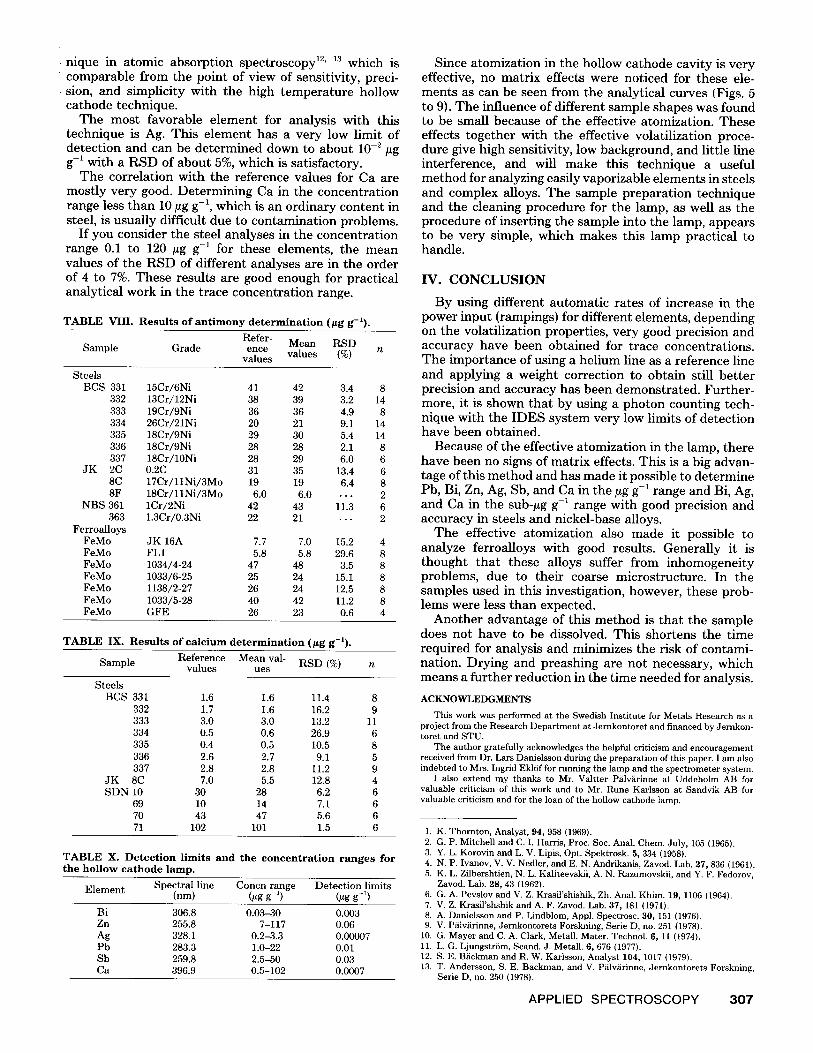
T A B L E VIII. Resu l t s o f a n t i m o n y de terminat ion (#g g- l ) .
TABLE X. Detec t ion Hmits and the concentra t ion ranges for the h o l l o w cathode lamp.
Spectra l line Concn range Detec t ion l imits E lemen t (nm) (/~g g-i) (gg g-i)
Bi 306.8 0.03-30 0.003 Zn 255.8 7-117 0.06 Ag 328.1 0.2-3.3 0.00007 Pb 283.3 1.0-22 0.01 Sb 259.8 2.5-50 0.03 Ca 396.9 0.5-102 0.0007
Since atomization in the hollow cathode cavity is very effective, no matrix effects were noticed for these ele- ments as can be seen from the analytical curves {Figs. 5 to 9). The influence of different sample shapes was found to be small because of the effective atomization. These effects together with the effective volatilization proce- dure give high sensitivity, low background, and little line interference, and will make this technique a useful method for analyzing easily vaporizable elements in steels and complex alloys. The sample preparation technique and the cleaning procedure for the lamp, as well as the procedure of inserting the sample into the lamp, appears to be very simple, which makes this lamp practical to handle.
IV. CONCLUSION
By using different automatic rates of increase in the power input (rampings) for different elements, depending on the volatilization properties, very good precision and accuracy have been obtained for trace concentrations. The importance of using a helium line as a reference line and applying a weight correction to obtain still better precision and accuracy has been demonstrated. Further- more, it is shown that by using a photon counting tech- nique with the IDES system very low limits of detection have been obtained.
Because of the effective atomization in the lamp, there have been no signs of matrix effects. This is a big advan- tage of this method and has made it possible to determine Pb, Bi, Zn, Ag, Sb, and Ca in the ~g g-1 range and Bi, Ag, and Ca in the sub-#g g-1 range with good precision and accuracy in steels and nickel-base alloys.
The effective atomization also made it possible to analyze ferroalloys with good results. Generally it is thought that these alloys suffer from inhomogeneity problems, due to their coarse microstructure. In the samples used in this investigation, however, these prob- lems were less than expected.
Another advantage of this method is that the sample does not have to be dissolved. This shortens the time required for analysis and minimizes the risk of contami- nation. Drying and preashing are not necessary, which means a further reduction in the time needed for analysis.
ACKNOWLEDGMENTS
This work was performed at the Swedish Institute for Metals Research as a project from the Research Department at Jernkontoret and financed by Jernkon- toret and STU.
The author gratefully acknowledges the helpful criticism and encouragement received from Dr. Lars Danielsson during the preparation of this paper. I am also indebted to Mrs. Ingrid EklSf for running the lamp and the spectrometer system.
I also extend my thanks to Mr. Valtter Pfilv~irinne at Uddeholm AB for valuable criticism of this work and to Mr. Rune Karlsson at Sandvik AB for valuable criticism and for the loan of the hollow cathode lamp.
1. K. Thornton, Analyst, 94, 958 (1969). 2. G. P. Mitchell and C. I. Harris, Proc. Soc. Anal. Chem. July, 105 (1965). 3. Y. L. Korovin and L. V. Lipis, Opt. Spektrosk. 5, 334 (1958). 4. N. P. Ivanov, V. V. Nedler, and E. N. Andrikanis, Zavod. Lab. 27,836 (1961). 5. K. L. Zflbershtien, N. L. Kaliteevskii, A. N. Razumovskii, and Y. F. Fedorov,
Zavod. Lab. 28, 43 (1962). 6. G. A. Pevslov and V. Z. Krasil'shishik, Zh. Anal. Khim. 19, 1106 (1964). 7. V. Z. Krasil'shshik and A. F. Zavod. Lab. 37, 181 (1971). 8. A. Danielsson and P. Lindblom, Appl. Spectrosc. 30, 151 (1976). 9. V. P~ilv~irinne, Jernkontorets Forskning, Serie D, no. 251 {1978).
10. G. Mayer and C. A. Clark, Metall. Mater. Technol. 6, 11 (1974). 11. L. G. LjungstrSm, Scand. J. Metall. 6, 676 (1977}. 12. S. E. B~ickman and R. W. Karlsson, Analyst 104, 1017 (1979). 13. T. Andersson, S. E. B~ickman, and V. P~itv~irinne, Jernkontorets Forskning,