Page 1
i
The use of bimetallic heterogeneous oxide catalysts for the Fenton
reaction.
Dissertation submitted in fulfillment of the requirements for the Degree of Magister
Technologiae in the Department of Chemistry, Faculty of Applied and Computer
Sciences, Vaal University of Technology:
By
Mgedle Nande
Under the supervision of:
Supervisor: Dr. E. L. Viljoen
Co-supervisors: Prof. A. E. Ofomaja
&
Prof. M. Scurrell (UNISA)
2019
Page 2
ii
Declaration
I, Mgedle Nande, declare that this dissertation was composed by myself, that the work
contained herein is my own. All sources of cited are indicated and acknowledged by
means of comprehensive reference list. I further declare that this work has not been
previously submitted for any degree or professional qualification or organisation outside
Vaal University of Technology.
…………………………………….
(Candidate signature)
………day of……2019
Page 3
iii
Dedication
I dedicate this work to my Lord and saviour Jesus Christ, the late grandfather Ngqonyela
Mgedle, the late grand Mother Nongezile Sityata, my papa Vukile Mgedle, my mother
Nolufefe Mgedle and my aunt Lungiswa Mgedle.
Page 4
iv
Acknowledgement
I would first like to thank my promoter Dr. Elvera Viljoen of the Department of Chemistry,
Faculty of Applied and Computer Sciences at Vaal University of Technology. The door to
Dr. Viljoen’s office was always open whenever I ran into a trouble spot or had a question
about my research or writing. She consistently gave me full support and steered me in
the right direction whenever she thought I needed it. I also dedicate my thanks to my co-
supervisors, Prof. Augustine Ofomaja and Prof. Mike Scurrell (University of South Africa)
for their support and input to this work.
I would also like to thank the Nanotechnology Catalysis Adsorption and Phytochemicals
(NCAP) group of the Vaal University of Technology led by Prof. Justice Moloto for their
expert guidance and support throughout this period of study.
I would also like to thank my friends Wanda Bout, Ntandokazi Mabungela, Oyandi Sentse,
Andza Makamu. Without their passionate support and input, this study could not have
been successfully conducted. I would also like to express my gratitude to my fellow BTech
students, Theo Moundzounga, Arinafhungo Tshikovhi, Thabelo Mudau, Elizabeth
Makonko, Lethabo Mooketsi and Vuyo Mollo.
Finally, I must express my very profound gratitude to my parents, aunt Lungiswa Mgedle,
brother Siyambonga and my sisters Iviwe, Feziwe, Mihle and Lisakhanya Mgedle for
providing me with unfailing support and continuous encouragement throughout my years
of study and through the process of researching and writing this thesis. This
accomplishment would not have been possible without them. Thank you.
Page 5
v
Research output
This work has been presented in six different conferences in South Africa:
MGEDLE, N., VILJOEN, E., OFOMAJA, A. E. & SCURREL, M. The use of bimetallic oxide
heterogeneous catalyst for the Fenton reaction. Vaal University of Technology 2nd
interdisciplinary conference. 2017. 09 November, Vaal University of Technology Science
park, Gauteng, Vanderbijlpark, South Africa, Oral presentation.
MGEDLE, N., VILJOEN, E., OFOMAJA, A. E. & SCURREL, M. The use of bimetallic oxide
heterogeneous catalyst for the Fenton reaction. The 28th annual conference of the
Catalysis Society of South Africa (CATSA). 2017. 19-22 November. 19-22, Kwa Maritane
Bush Lodge, Pilanesberg, North-West, South Africa, Poser presentation.
MGEDLE, N., VILJOEN, E., OFOMAJA, A. E. & SCURREL, M. The use of bimetallic oxide
heterogeneous catalyst for the Fenton reaction. South African Chemical Institute (SACI)
Young Chemists’ Symposium. 2017. 30 November, University of Johannesburg,
Gauteng, South Africa, Oral presentation.
MGEDLE, N., VILJOEN, E., OFOMAJA, A. E. & SCURREL, M. The effect of Fe/Mn mass
ratio on a bimetallic oxide heterogeneous catalyst supported on silica for the degradation
of methylene blue. Vaal University of Technology 3nd interdisciplinary conference. 2018.
17 August, Vaal University of Technology Quest Conference Center, Vanderbijlpark,
South Africa, Oral presentation.
MGEDLE, N., VILJOEN, E., OFOMAJA, A. E. & SCURREL, M. Preparation of bimetallic
catalyst calcined by microwave and conventional methods (oven) for the Fenton reaction.
South African Nanotechnology Initiative (SANI). 2018. 16 November, Vaal University of
Technology Quest Conference Center, Vanderbijlpark, South Africa, Oral presentation.
Received second best presenter award.
MGEDLE, N., VILJOEN, E., OFOMAJA, A. E. & SCURREL, M. The effect of Fe/Mn mass
ratio on a bimetallic oxide heterogeneous catalyst supported on silica for the degradation
of methylene blue. The 43rd SACI National Convention. 2018. 02-06 December, CISR –
ICC, Pretoria, South Africa, Oral presentation.
Page 6
vi
Abstract
Water contaminated with non-biodegradable organics is becoming increasing
problematic as it has a hazardous effect on human health and the aquatic environment.
Therefore, the removal of organic contaminants is of importance and an active
heterogeneous Fenton catalyst is thus required. The literature indicates that a bimetallic
oxide Fenton catalyst is more active than an iron oxide catalyst. This study focused on
increasing the activity of iron-based Fenton catalysts with the addition of transition metals
such as manganese, cobalt and copper and optimizing the preparation method.
In this study, bimetallic oxide (Fe-Cu, Fe-Mn, Fe-Co) and monometallic oxide (Fe, Cu,
Mn,Co) catalysts supported on silica SiO2 where prepared by incipient wetness
impregnation. The total metal oxide contents were kept constant. The catalysts where
calcined in two different ways, in a conventional oven and in a microwave. These catalysts
were characterized with XRD, XPS and CV and were tested for the degradation of
methylene blue dye at 27°C.
The catalysts calcined in a microwave oven had a higher catalytic activity than those
prepared in a conventional oven. The bimetallic oxide catalysts outperformed the mono-
metallic oxide catalysts in the degradation of methylene blue. The Fe2MnOx prepared by
microwave energy were the most active catalyst yielding the highest percentage of
degradation of methylene blue dye (89.6%) after 60 minutes.
The relative amounts of manganese and iron oxide were varied while keeping the total
metal content in the catalyst the same. The optimum ratio of Fe to Mn was 1:7.5 since it
yielded the most active catalyst. A 96.6 % removal of methylene blue was achieved after
1 hour of degradation.
Lastly this ratio 1Fe:7.5Mn was prepared by varying different microwave power (600, 700
and 800 W) and irradiation time (10, 20 and 30 min). The optimum microwave power and
irradiation time was 800W and 10 min with the methylene blue percentage removal of
96.6 % after 1 hour of degradation.
Page 7
vii
Thesis outline
This thesis is divided into 8 chapters
Chapter 1: Introduction (background), aim and objectives.
Chapter 2: Literature review.
Chapter 3: Chemicals and methodology.
Chapter 4: Results, discussion and conclusions for the preparation of monometallic oxide
heterogeneous oxide catalyst and Fe-M (M is Mn, Cu and Co) bimetallic oxide
heterogeneous catalyst calcined by microwave and conventional methods (oven) for the
Fenton reaction.
Chapter 5: Results, discussion and conclusions for the different Fe/Mn mass ratios.
Chapter 6: Results, discussion and conclusions for optimizing the microwave calcination
method.
Chapter 7: Overall conclusions.
Chapter 8: References.
Appendix A: Catalyst preparation.
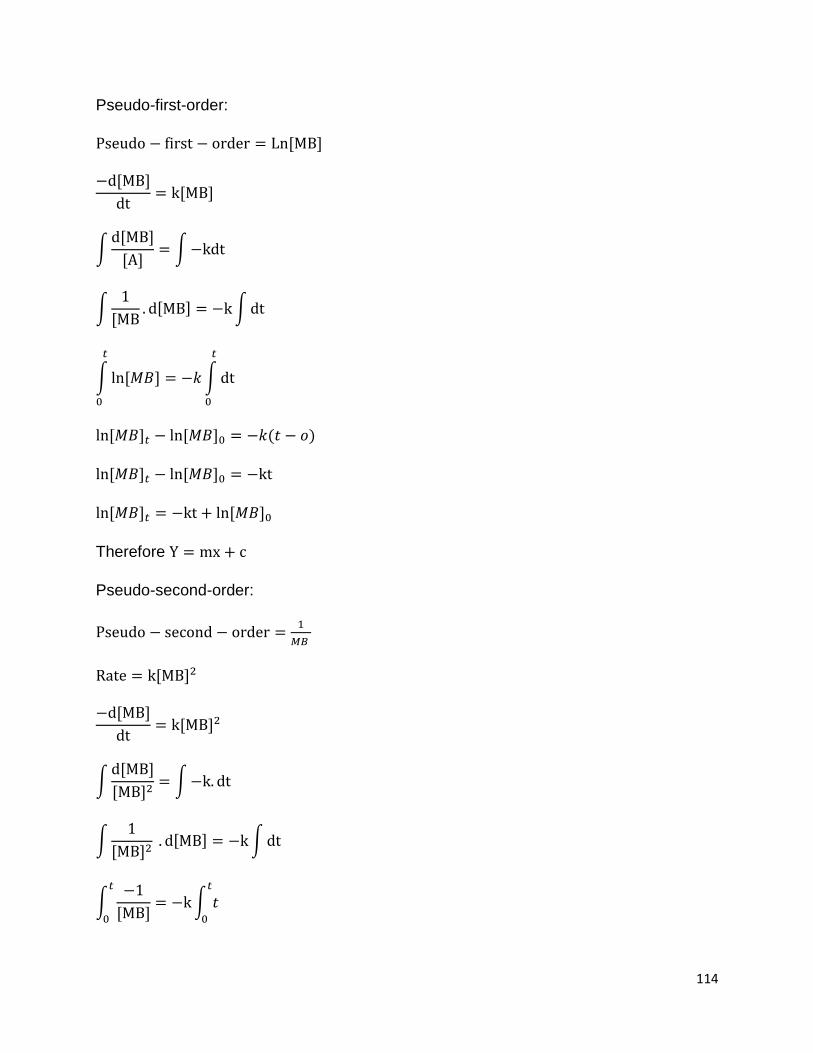
Appendix B: Dilution factor, % removal, integrated-first order and integrated-second
order reaction.
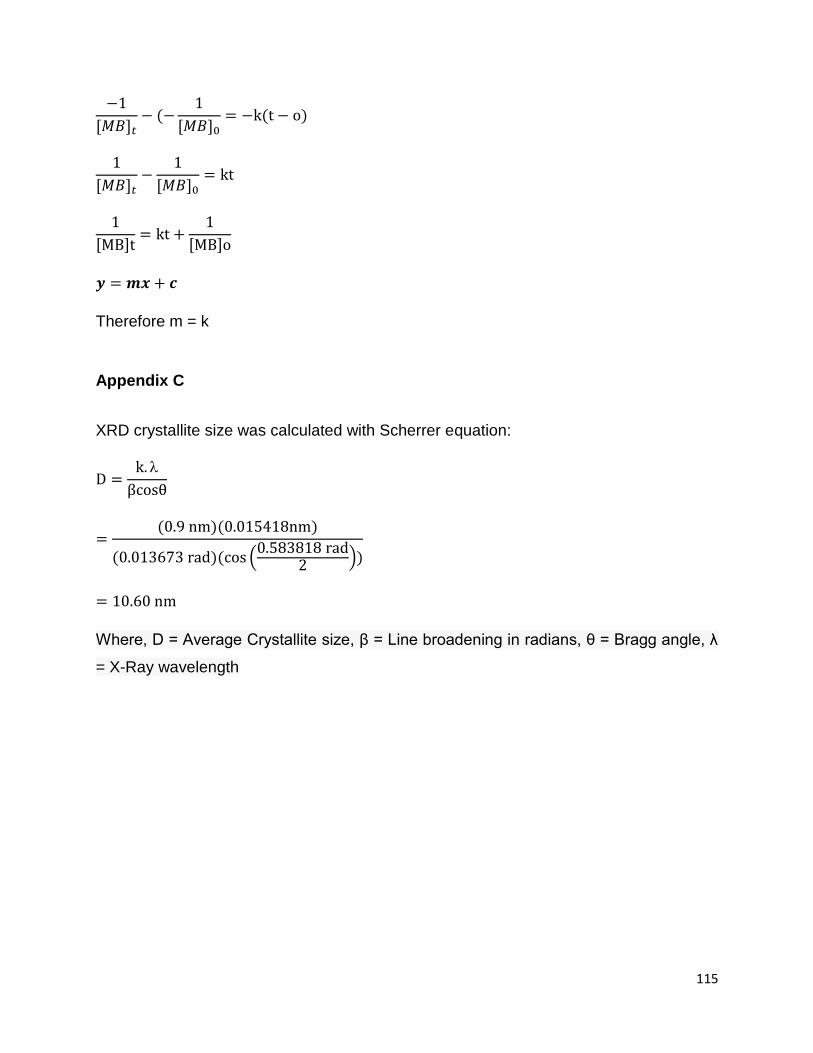
Appendix C: XRD crystallite size was calculated with Scherrer equation.
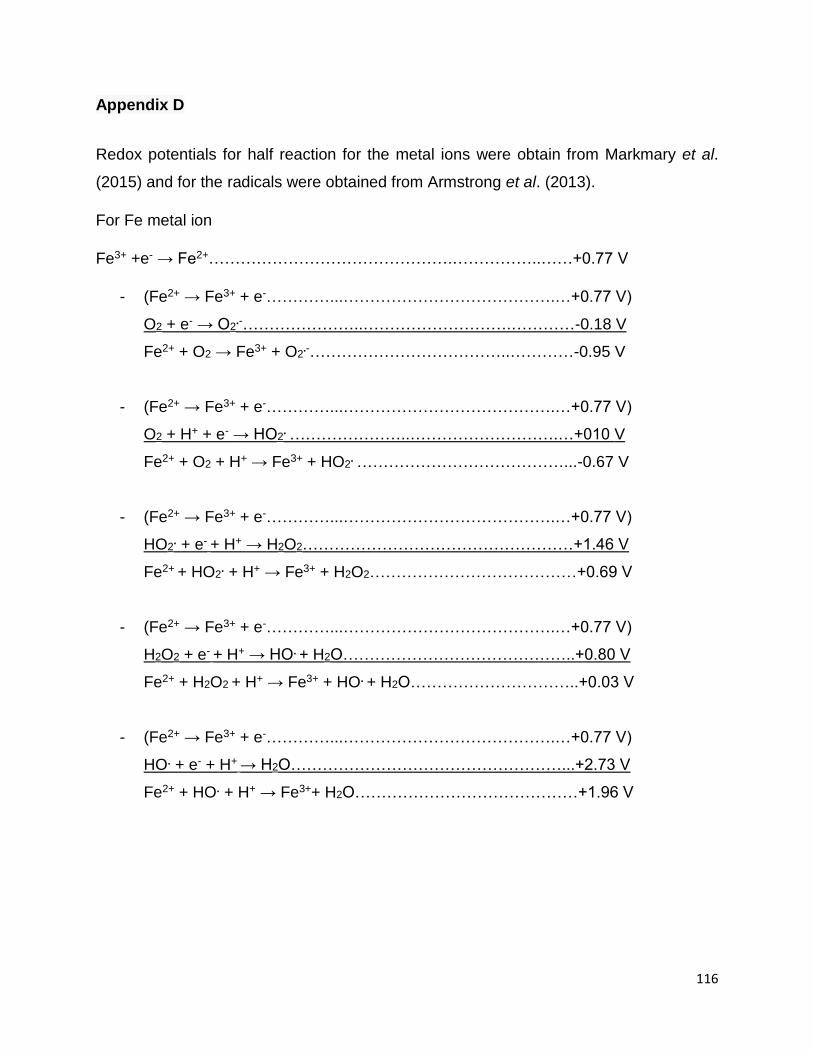
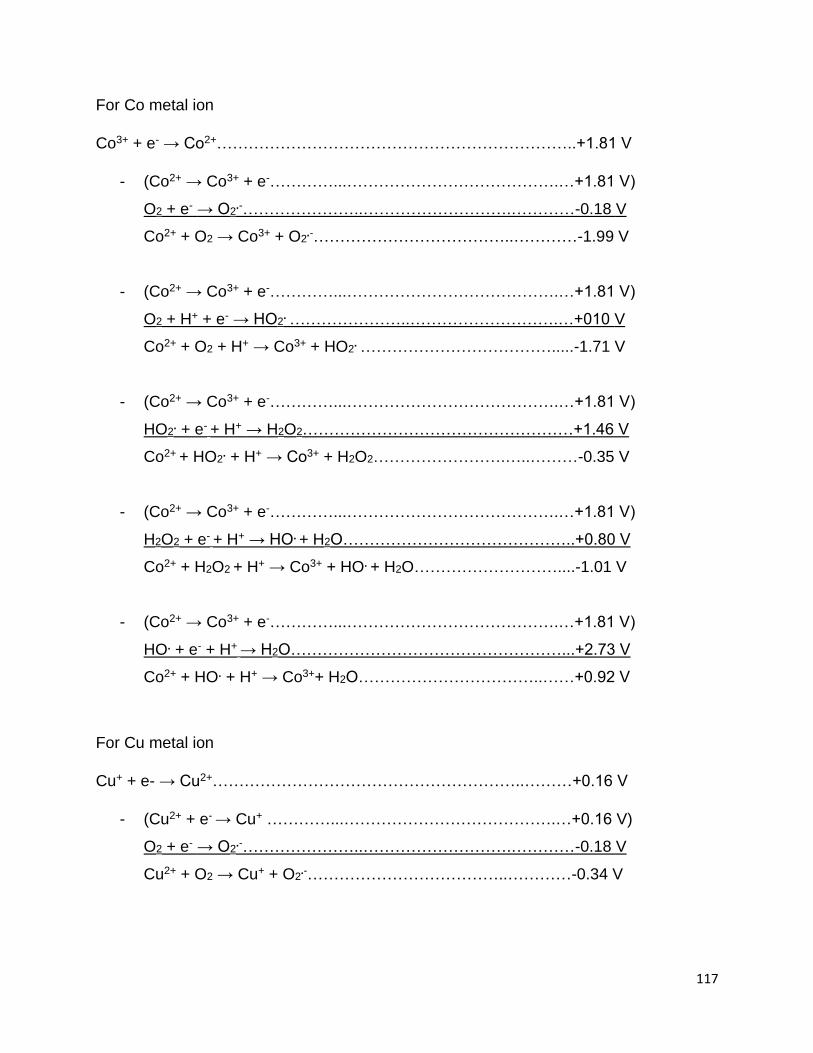
Appendix D: Redox potentials for half reaction for the metal ions and for the radicals.
Page 8
viii
List of abbreviations and acronyms
AOP’s – Advanced Oxidation Processes
AAS – Atomic Absorption Spectroscopy
Conv – Conventional oven
CV- Cyclic Voltammetry
Epa – Anodic Peak Potential
Epc – Cathodic Peak Potential
Ipc – Current at the Cathode
Ipa – Current at the Anode
MB – Methylene Blue
MW – Microwave
ORP –Oxidation Reduction Potential
TOC- Total Organic Compounds
WHO- World Health Organisation
XPS-X-ray photoelectron spectroscopy
XRD- X-ray powder diffraction
Page 9
ix
Table of Contents
Declaration .......................................................................................................................ii
Dedication ....................................................................................................................... iii
Acknowledgement ...........................................................................................................iv
Research output .............................................................................................................. v
Abstract ...........................................................................................................................vi
Thesis outline ................................................................................................................. vii
List of abbreviations and acronyms ............................................................................... viii
List of Figures ................................................................................................................. xii
List of Tables ..................................................................................................................xv
Chapter 1: Introduction .................................................................................................... 1
1.1. Background ........................................................................................................ 1
Problem statement ....................................................................................................... 2
Hypothesis ................................................................................................................... 2
Aim 2
Objectives .................................................................................................................... 3
Chapter 2: Literature review ............................................................................................ 4
2.1 Water pollution ...................................................................................................... 4
2.2 Methylene as model organic pollutant ................................................................ 4
2.3 Fenton reaction .................................................................................................. 7
2.4 The choice of calcination method during the catalyst’s preparation ................. 10
2.5 Bi-metallic oxide Fenton catalysts ........................................................................ 12
Chapter 3: Methodology ................................................................................................ 19
3.1 Materials .............................................................................................................. 19
3.2 Catalyst preparation ............................................................................................. 19
3.2.1 Preparation of heterogeneous oxide catalyst using different metals .............. 20
3.2 Characterization of the catalysts .......................................................................... 24
3.2.1 XRD ............................................................................................................... 24
3.2.2 X-ray photoluminescence (XPS) .................................................................... 24
3.2.3 Cyclic voltammetry (CV) ................................................................................ 25
3.3 Fenton reaction .................................................................................................... 25
3.4 UV-Vis spectroscopy ............................................................................................ 26
Page 10
x
3.5 Quantification of Fe, Co, Cu and Mn (Leaching test) using AAS .......................... 26
3.5.1 Leaching test after Fenton reaction ............................................................... 27
3.5.2 Leaching test under the same conditions ...................................................... 27
3.6 ORP ..................................................................................................................... 27
3.7 Mass loss studies ................................................................................................. 28
3.8 Hydroxyl radical determination ............................................................................. 28
Chapter 4: The effect of the catalysts’ composition and calcination method. ................ 30
4.1 Preparation of monometallic oxide heterogeneous oxide catalyst and Fe-M (M is Mn, Cu and Co) bimetallic oxide heterogeneous catalyst calcined by microwave and conventional methods (oven) for the Fenton reaction. ............................................... 30
4.1.1 Characterization of heterogeneous oxide catalyst with XRD ......................... 30
4.1.2 X-ray photoluminescence (XPS) .................................................................... 34
4.1.3 Cyclic voltammetry ......................................................................................... 37
4.1.4 Oxidation Reduction potential (ORP) ............................................................. 39
4.1.5 Decomposition of hydrogen peroxide to oxygen (Mass loss) ......................... 41
4.1.6 Leaching ........................................................................................................ 45
4.1.7 Radical determination .................................................................................... 51
4.1.8 Fenton and Fenton-like reaction .................................................................... 53
4.1.9 Activation energy ........................................................................................... 60
4.1.10 Discussion on the correlation between the crystallite size, ORP, H2O2
decomposition, radical formation and the rate constant. ......................................... 62
4.1.11. Conclusions ................................................................................................ 69
Chapter 5: The effect of the Fe/Mn mass ratio on the catalytic activity of a Fenton
reaction. ........................................................................................................................ 71
5.1.1 Catalyst characterization using XRD. ............................................................ 71
5.1.2 Electrochemical characterization of Fe, Mn and 0.35Fe2.65Mn catalysts ..... 74
5.2 ORP results .......................................................................................................... 76
5.2.1 Repeatability using the 0.35Fe2.65Mn catalyst ............................................. 76
5.2.2. The measurement of ORP using different catalyst. ...................................... 76
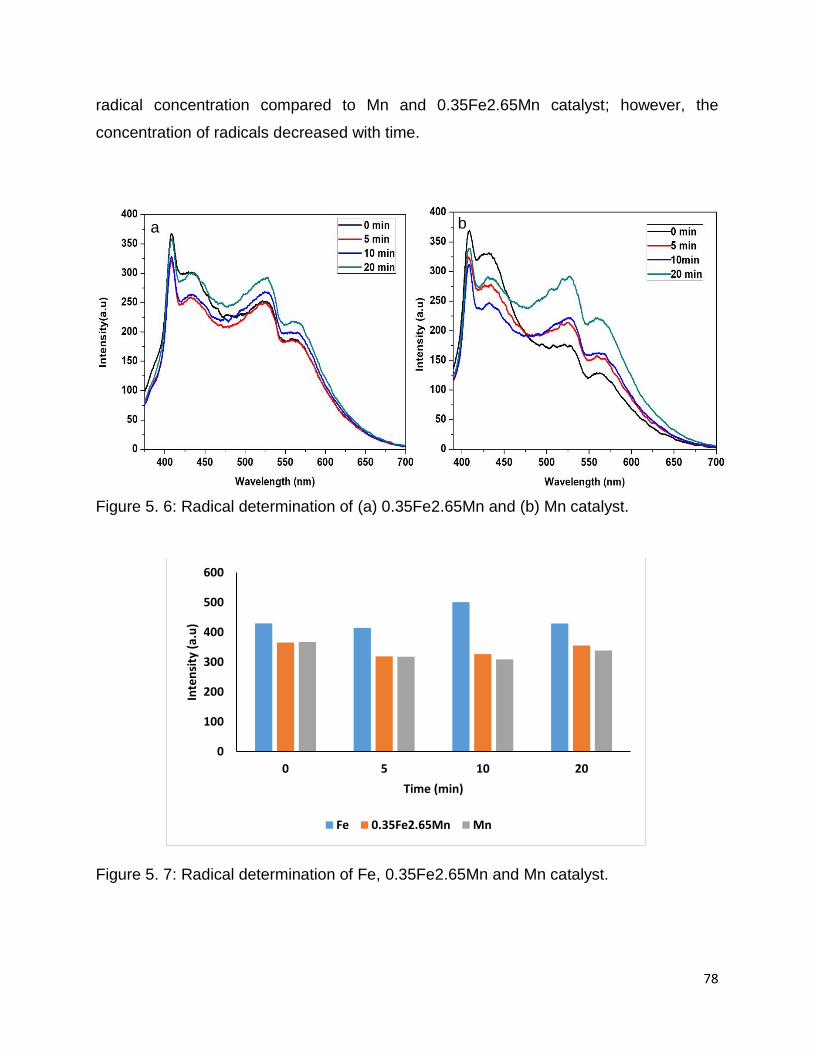
5.3 Radical determination .......................................................................................... 77
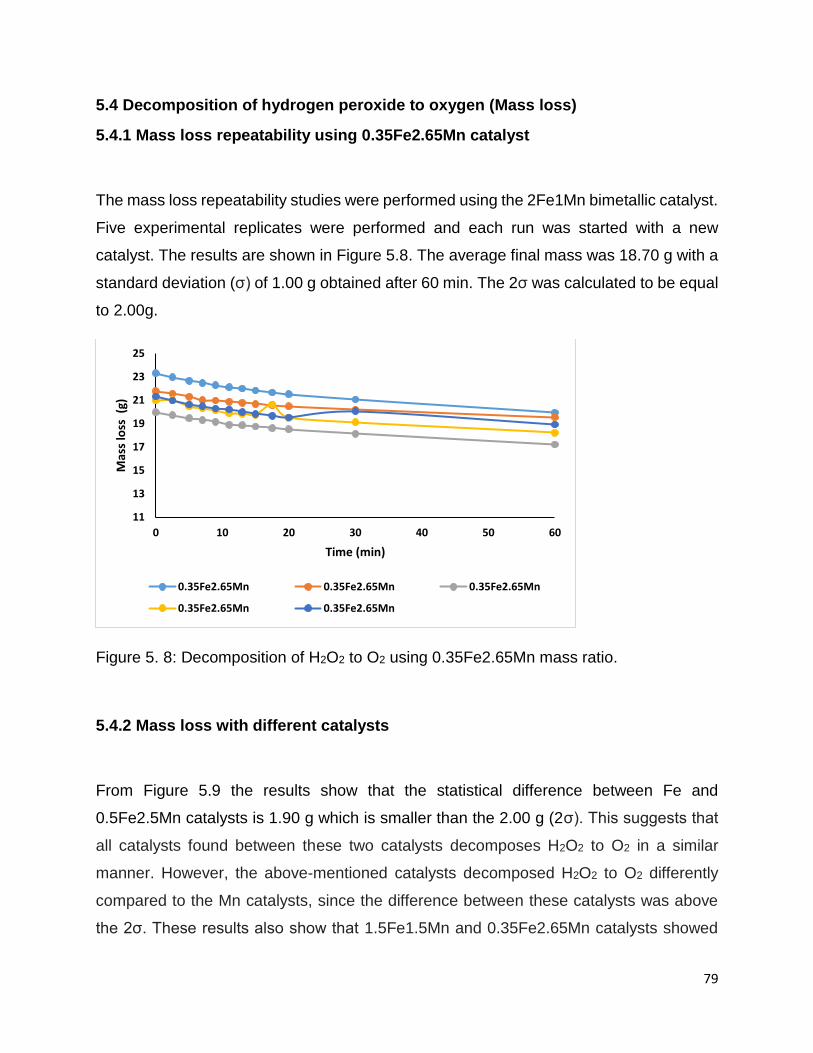
5.4 Decomposition of hydrogen peroxide to oxygen (Mass loss) ............................... 79
5.4.1 Mass los repeatability using 0.35Fe2.65Mn catalyst ...................................... 79
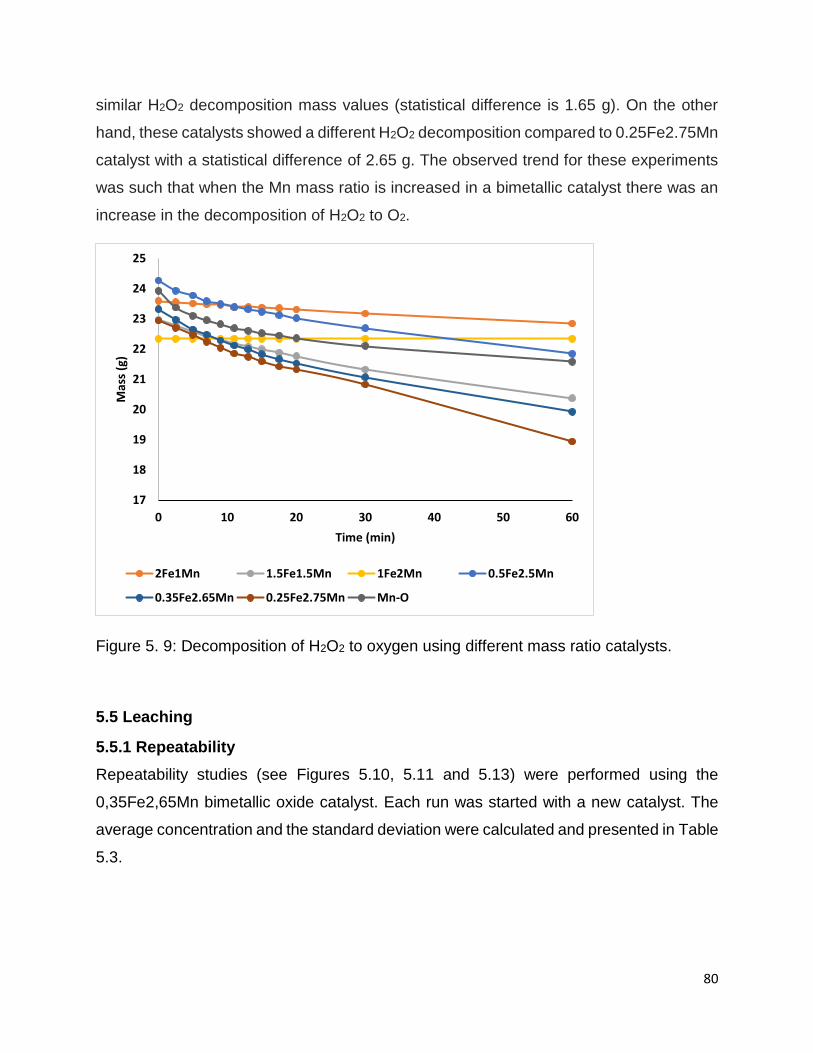
5.4.2 Mass loss with different catalysts ................................................................... 79
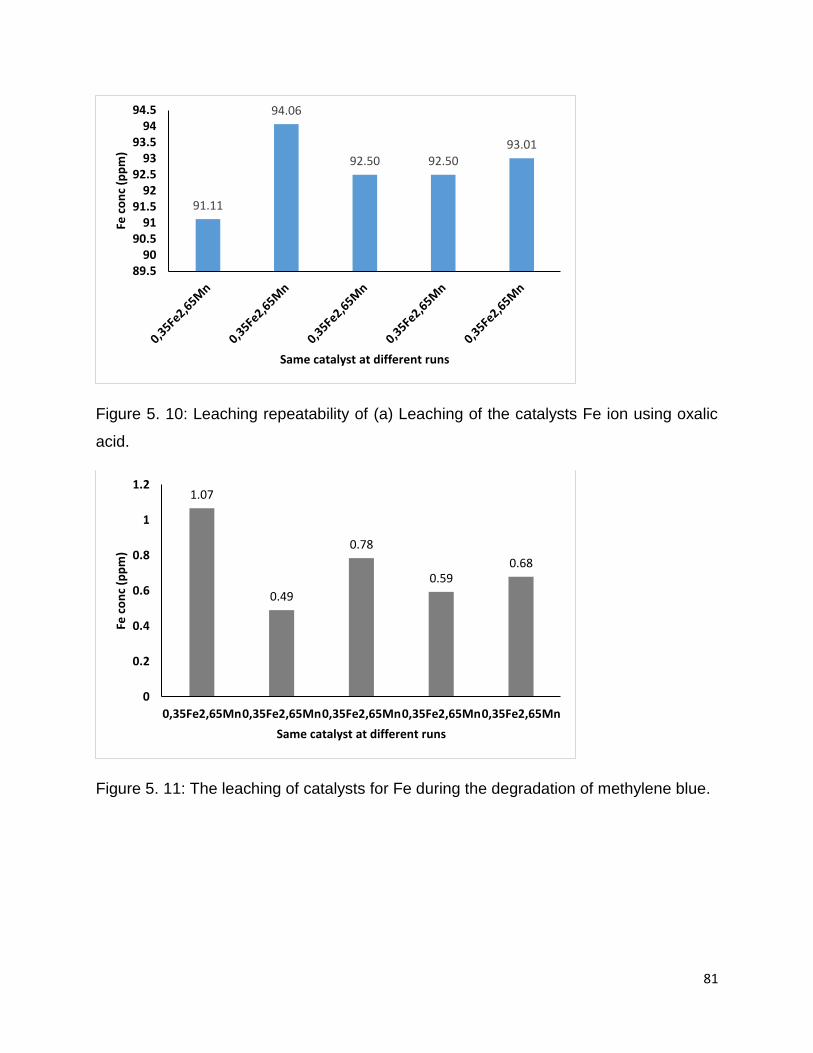
5.5 Leaching .............................................................................................................. 80
Page 11
xi
5.5.1 Repeatability .................................................................................................. 80
5.5.2 Leaching test from different mass ratios ........................................................ 83
5.6 Degradation of MB ............................................................................................... 85
5.6.1 Degradation repeatability using 0,35Fe2,65Mn. ............................................ 85
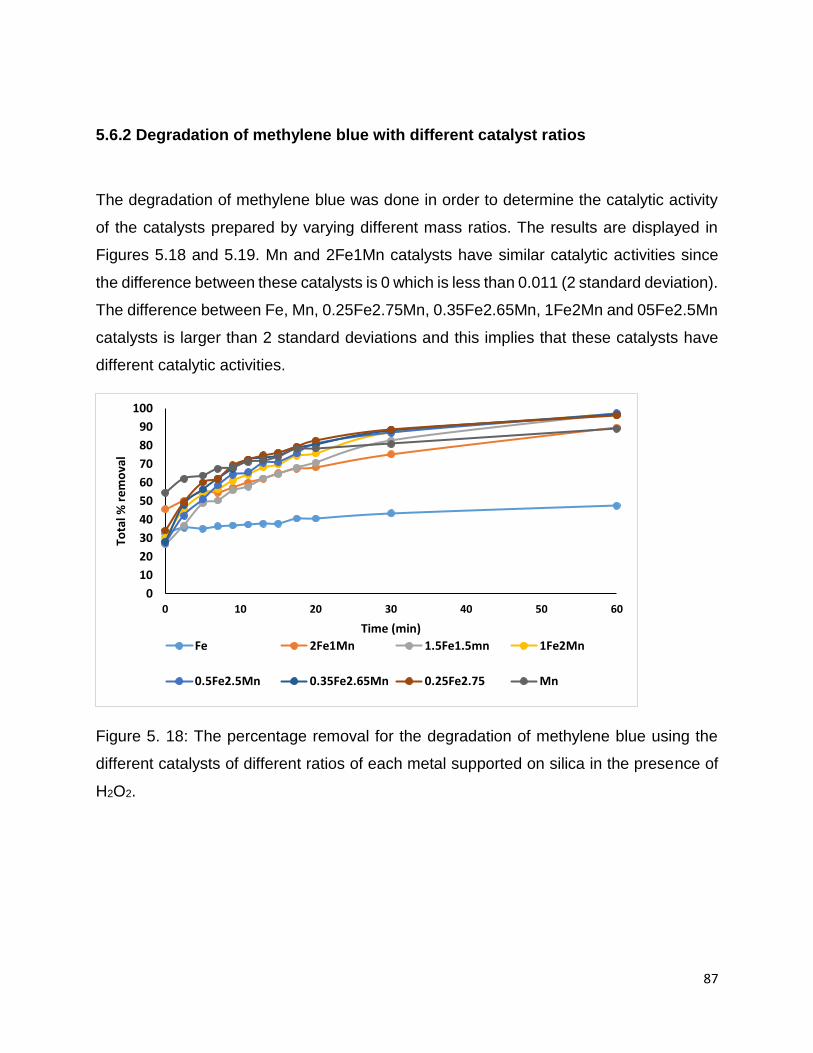
5.6.2 Degradation of methylene blue with different catalyst ratios .......................... 87
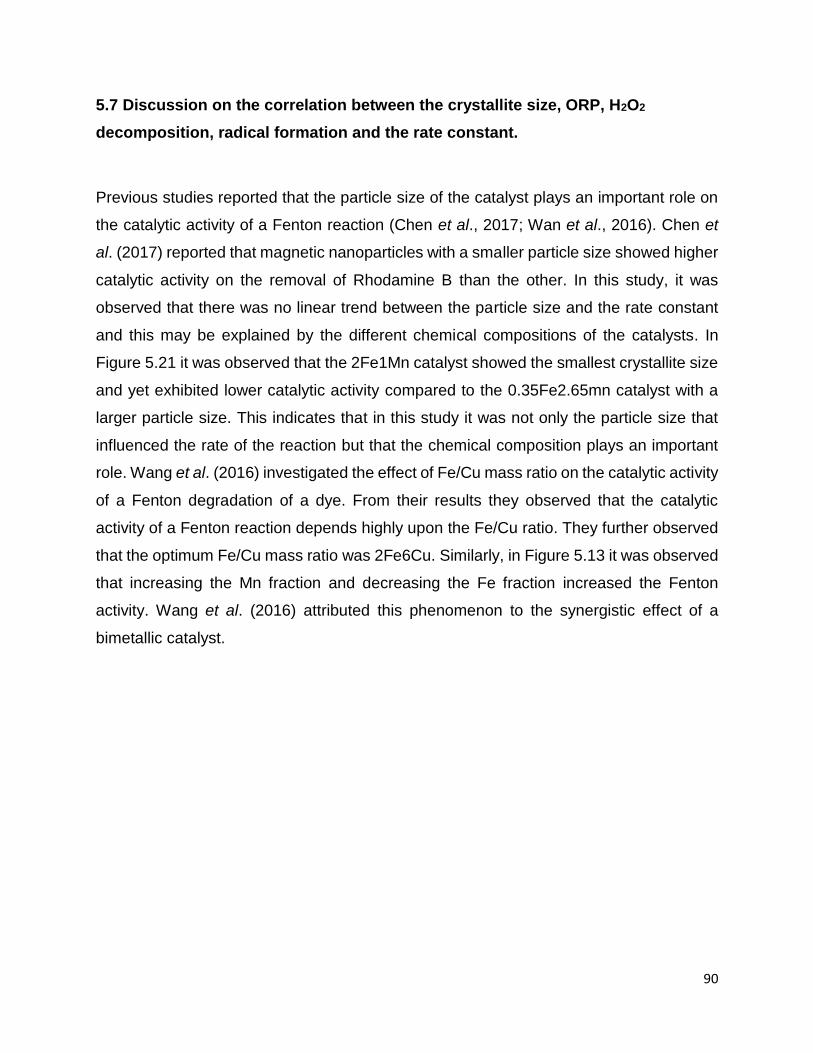
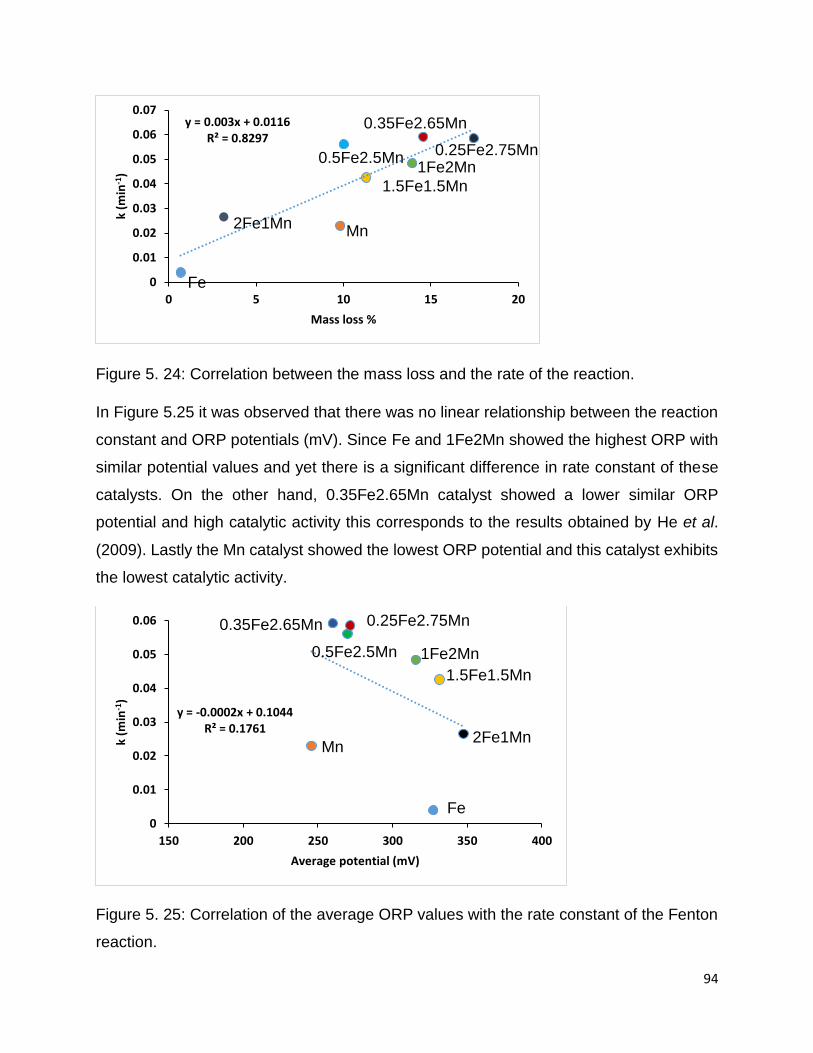
5.7 Discussion on the correlation between the crystallite size, ORP, H2O2 decomposition, radical formation and the rate constant. ............................................ 90
5.8 Conclusions ......................................................................................................... 95
Chapter 6: The effect of microwave irradiation time and power. ................................... 96
6.1 XRD ..................................................................................................................... 96
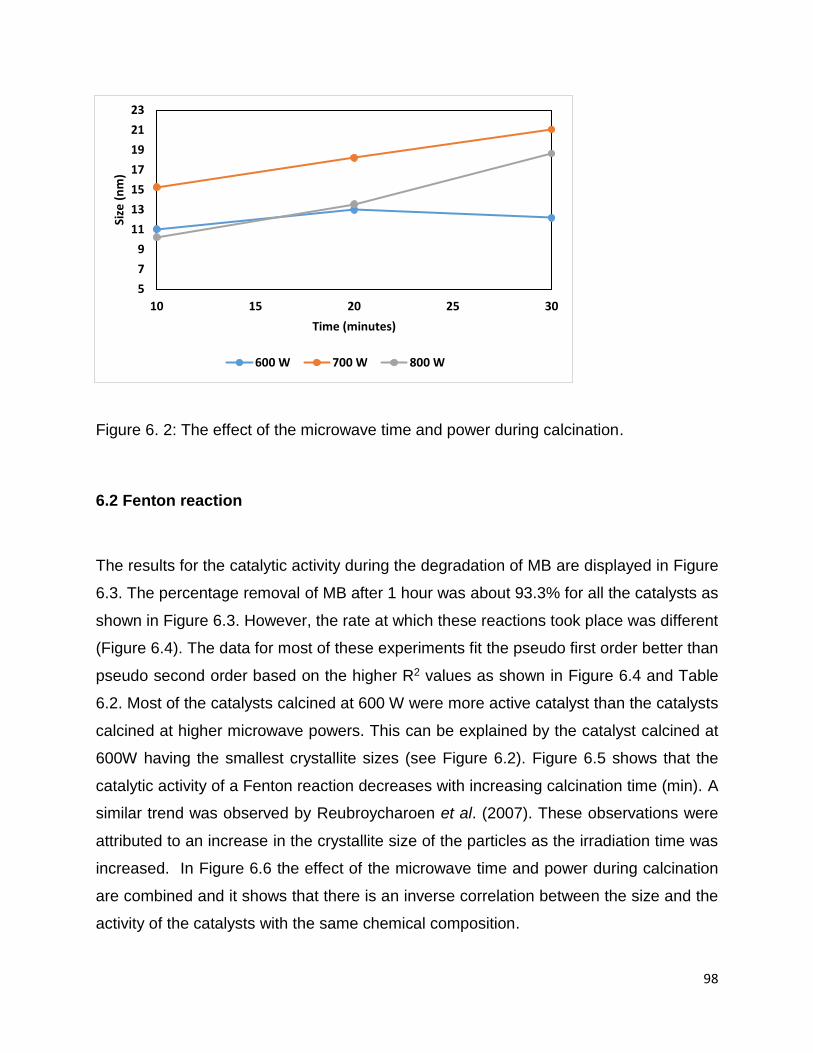
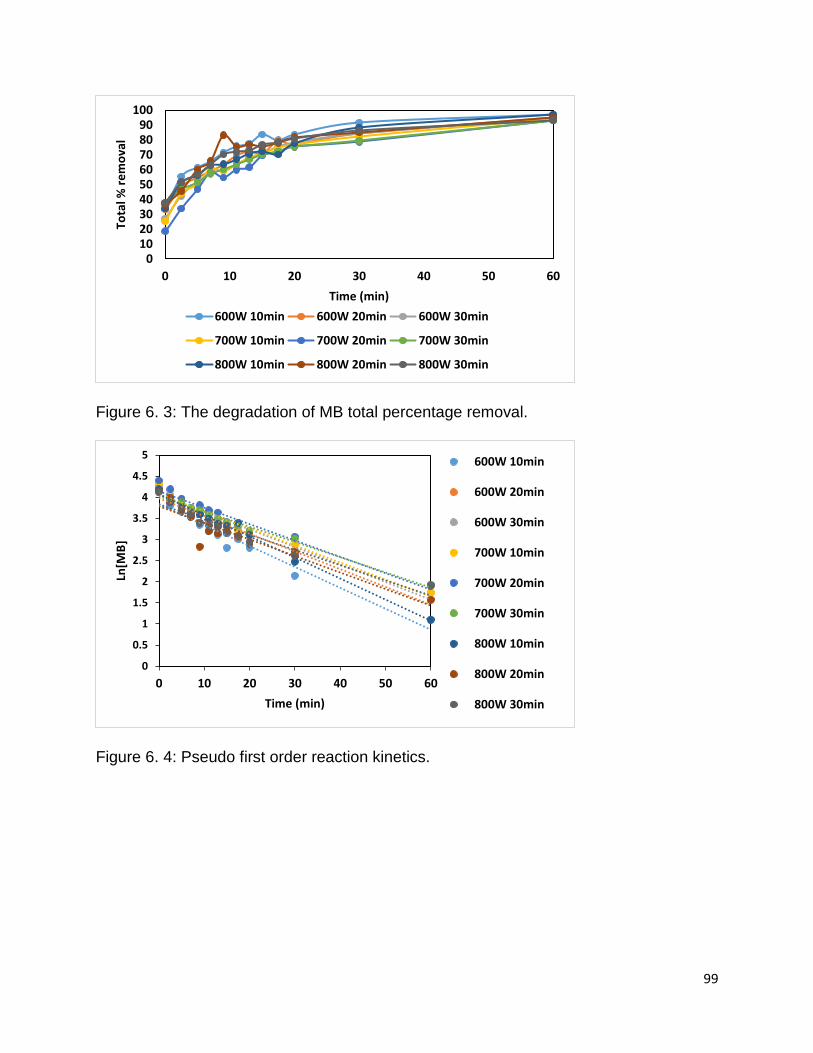
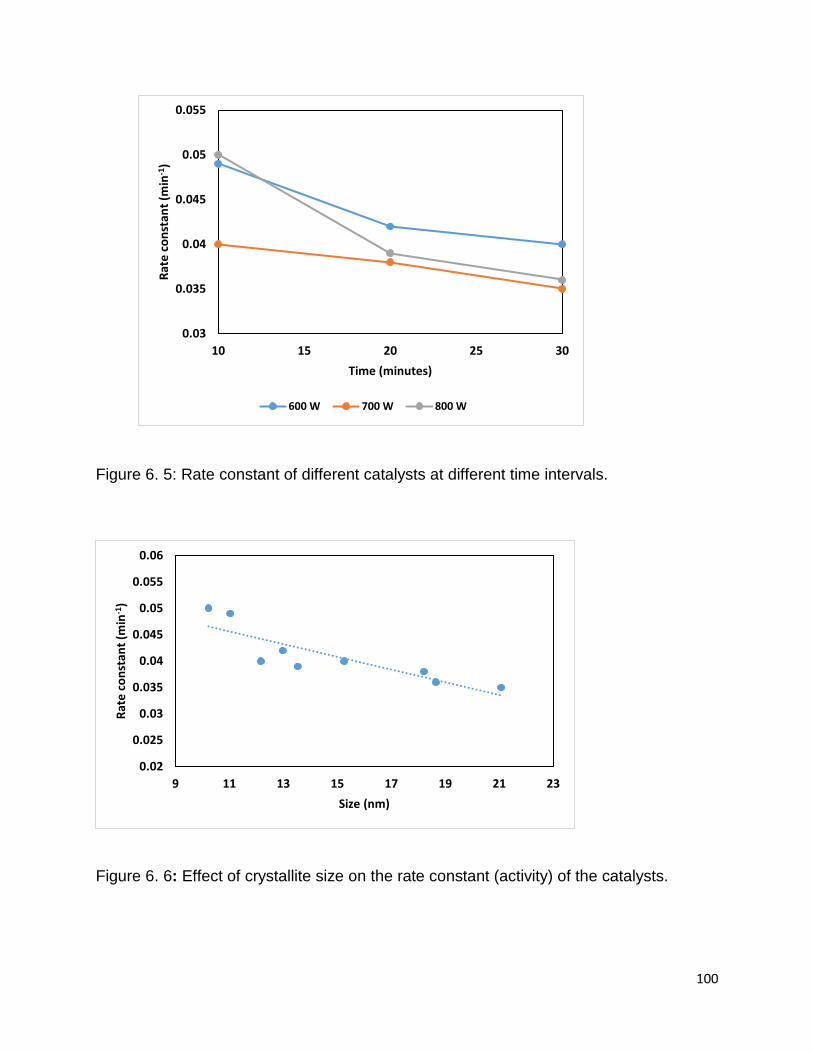
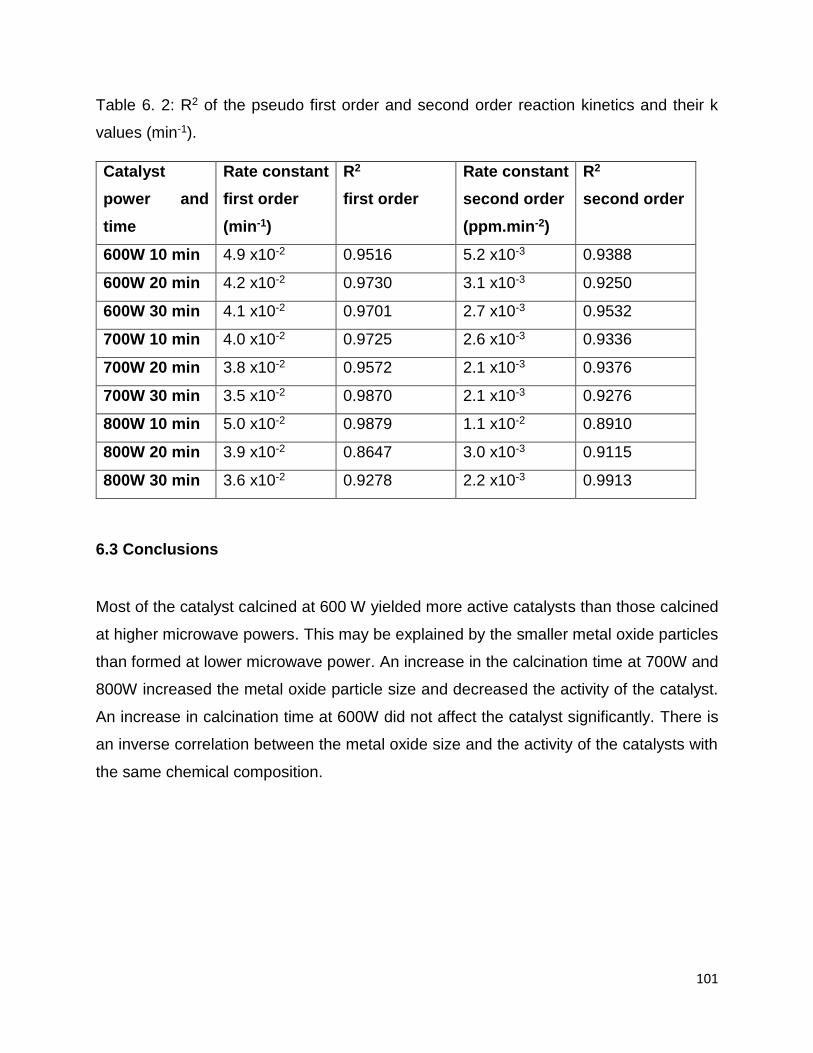
6.2 Fenton reaction .................................................................................................... 98
6.3 Conclusions ....................................................................................................... 101
Chapter 7: Conclusions and Recommendations ......................................................... 102
7.1 Conclusions ....................................................................................................... 102
7.2 Recommendations ............................................................................................. 103
References .................................................................................................................. 104
Appendix A .................................................................................................................. 111
Appendix B .................................................................................................................. 113
Appendix C .................................................................................................................. 115
Appendix D .................................................................................................................. 116
Page 12
xii
List of Figures
Figure 2. 1: Methylene blue structure (Hegyesi et al., 2017). .......................................... 4
Figure 2. 2: Degradation pathway of methylene blue (Ammar et al., 2001, Liotta et al.,
2009) ............................................................................................................................... 6
Figure 2. 1: Proposed synergistic effect of bimetallic metal oxides with redox interplay between the iron and additional metal (like Cu, Co and Mn) oxide (adapted from (Magalhães et al. 2007)). 13
Figure 2. 2: Synergism between copper oxide and iron oxide. Figure constructed from data of Wang et al. (2016). ............................................................................................ 14 Figure 3. 1: Schematic diagram for the research plan (marked red are the best catalyst) 20
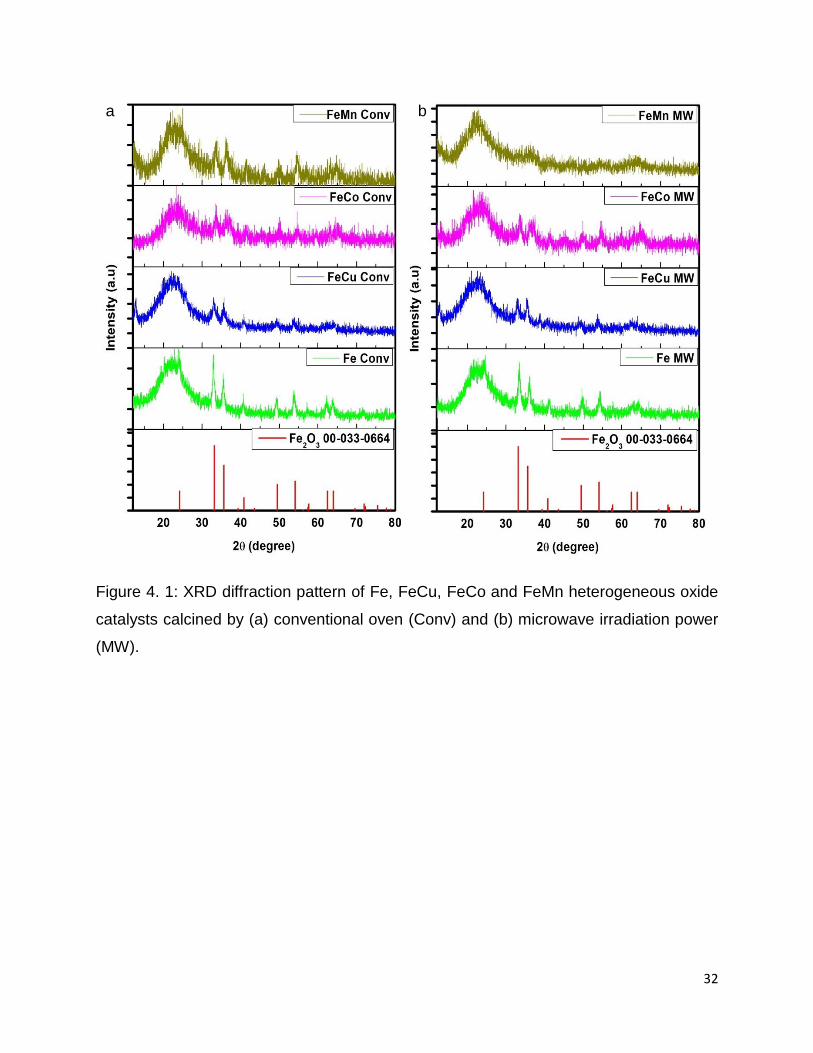
Figure 4. 1: XRD diffraction pattern of Fe, FeCu, FeCo and FeMn heterogeneous oxide
catalysts catalysts calcined by (a) Conventional oven and (b) microwave irradiation
power. ........................................................................................................................... 32
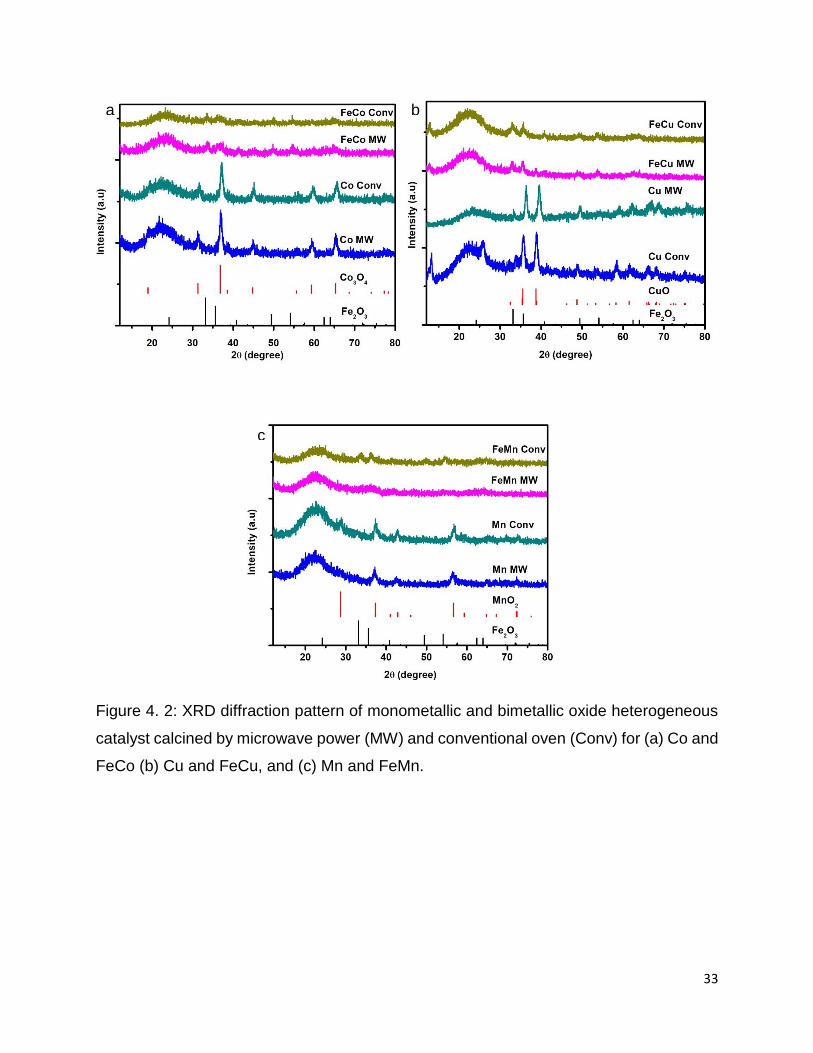
Figure 4. 2: XRD diffraction pattern of monometallic and bimetallic oxide heterogeneous
catalyst calcined by microwave power and conventional oven for (a) Co and FeCo (b)
Cu and FeCu, and (c) Mn and FeMn. ............................................................................ 33
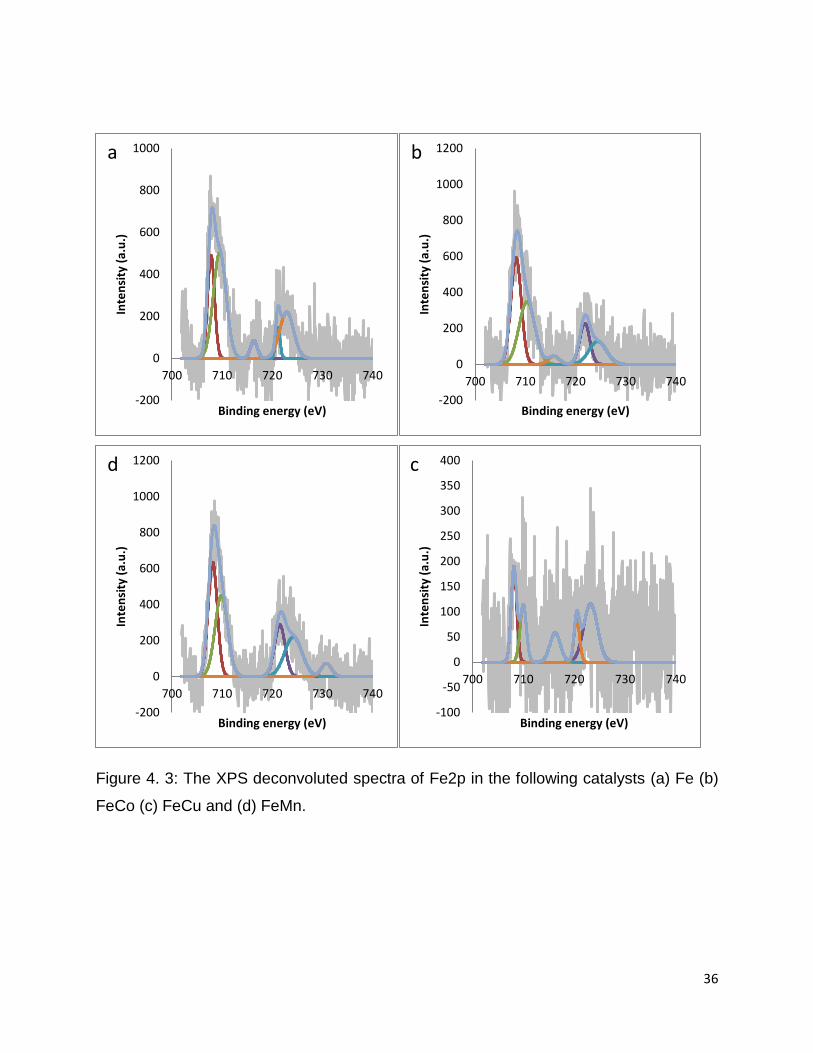
Figure 4. 3: The XPS deconvoluted spectra of Fe2p in the following catalysts (a) Fe (b)
FeCo (c) FeCu and (d) FeMn. ....................................................................................... 36
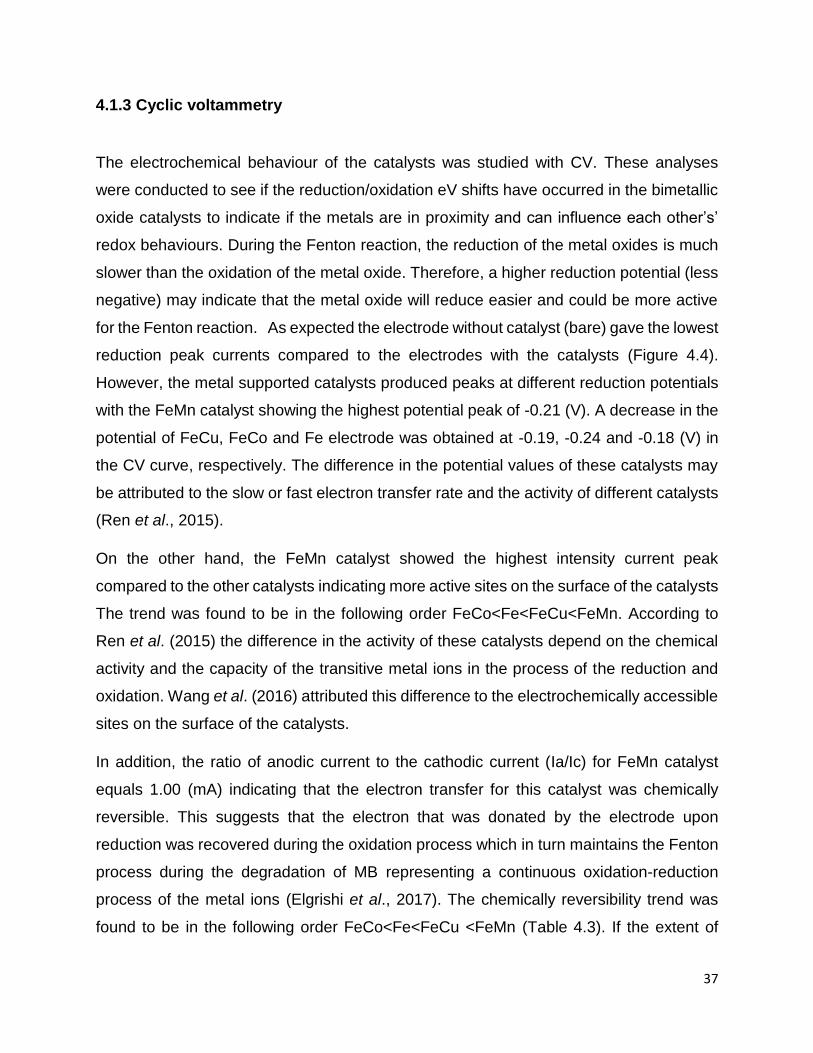
Figure 4. 4: Cyclic Voltammograms of Fe, FeCu, FeMn and FeCo. .............................. 39
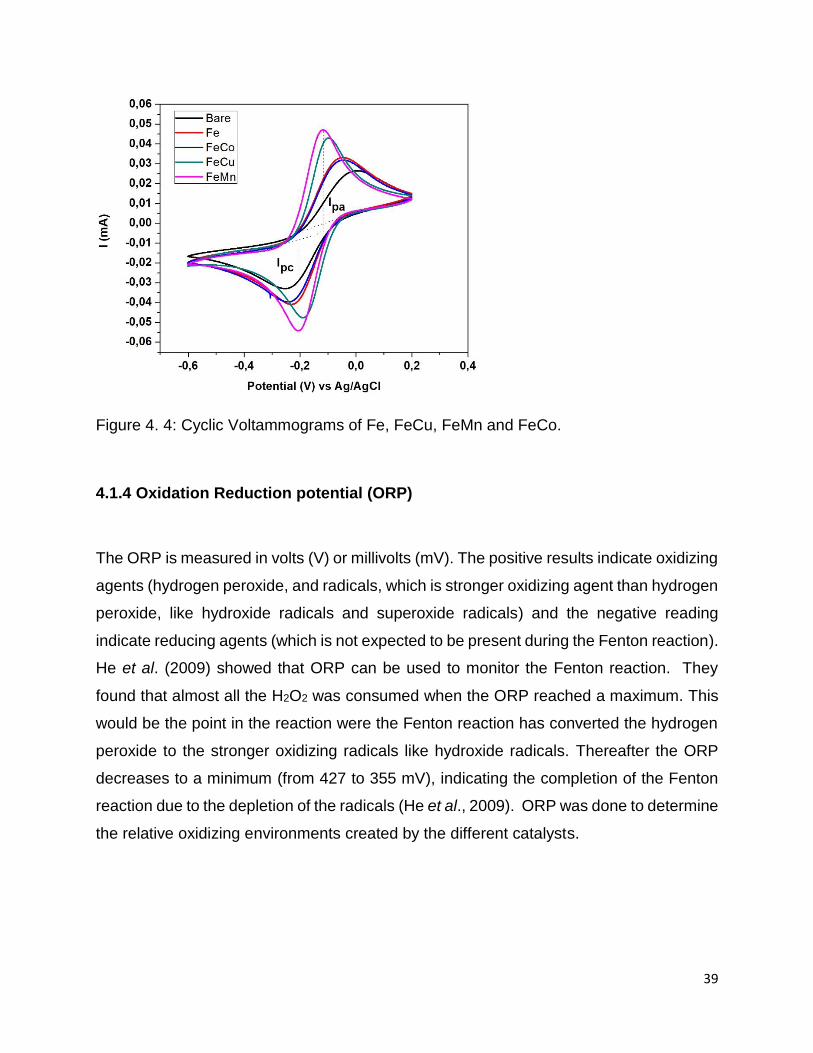
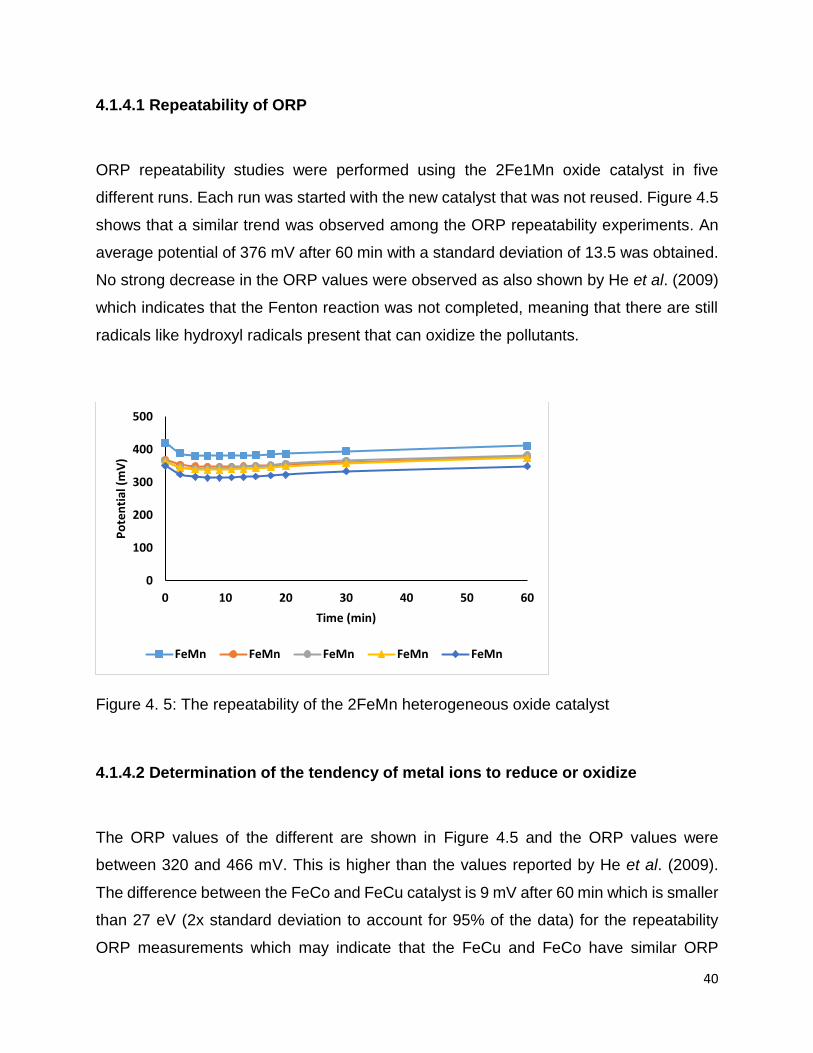
Figure 4. 5: The repeatability of the 2FeMn heterogeneous oxide catalyst ................... 40
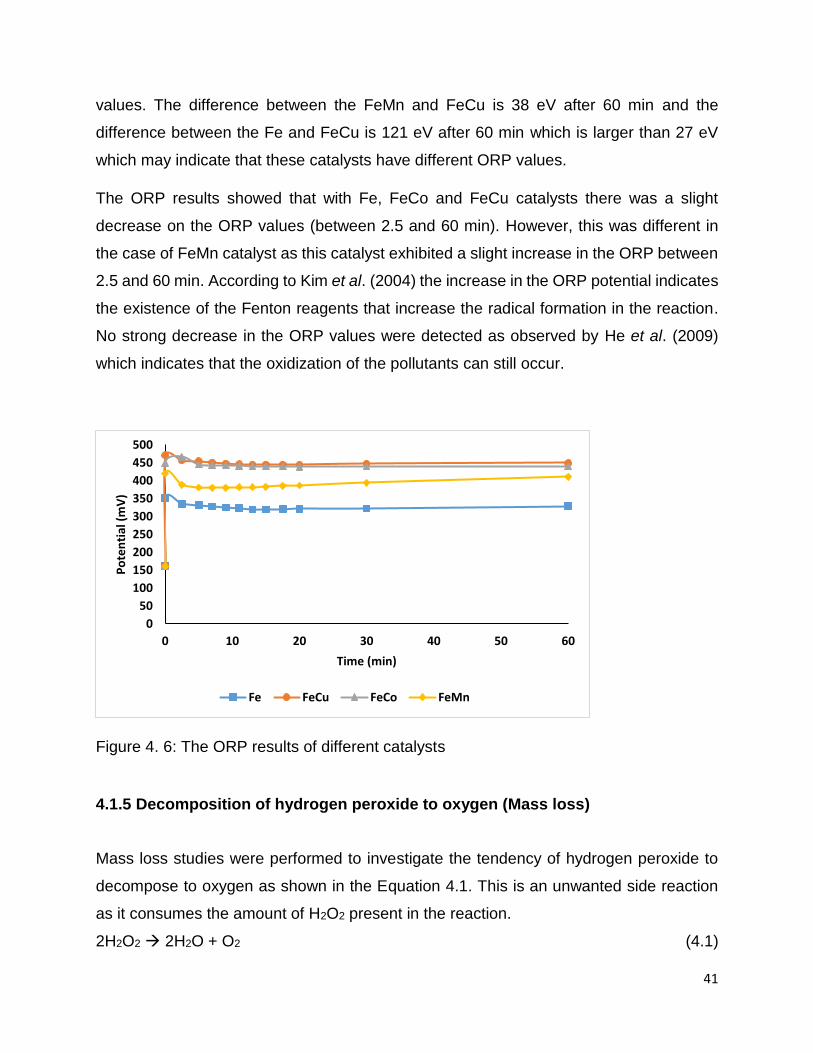
Figure 4. 6: The ORP results of different catalysts ........................................................ 41
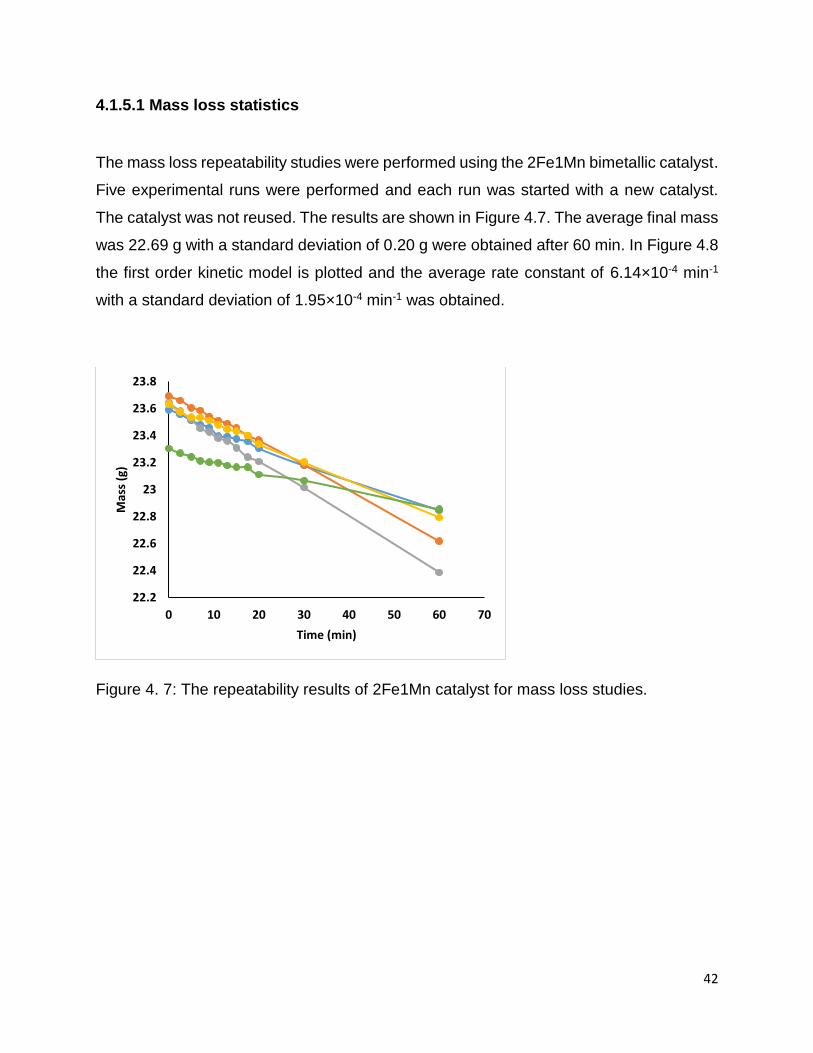
Figure 4. 7: The repeatability results of 2Fe1Mn catalyst for mass loss studies. ........... 42
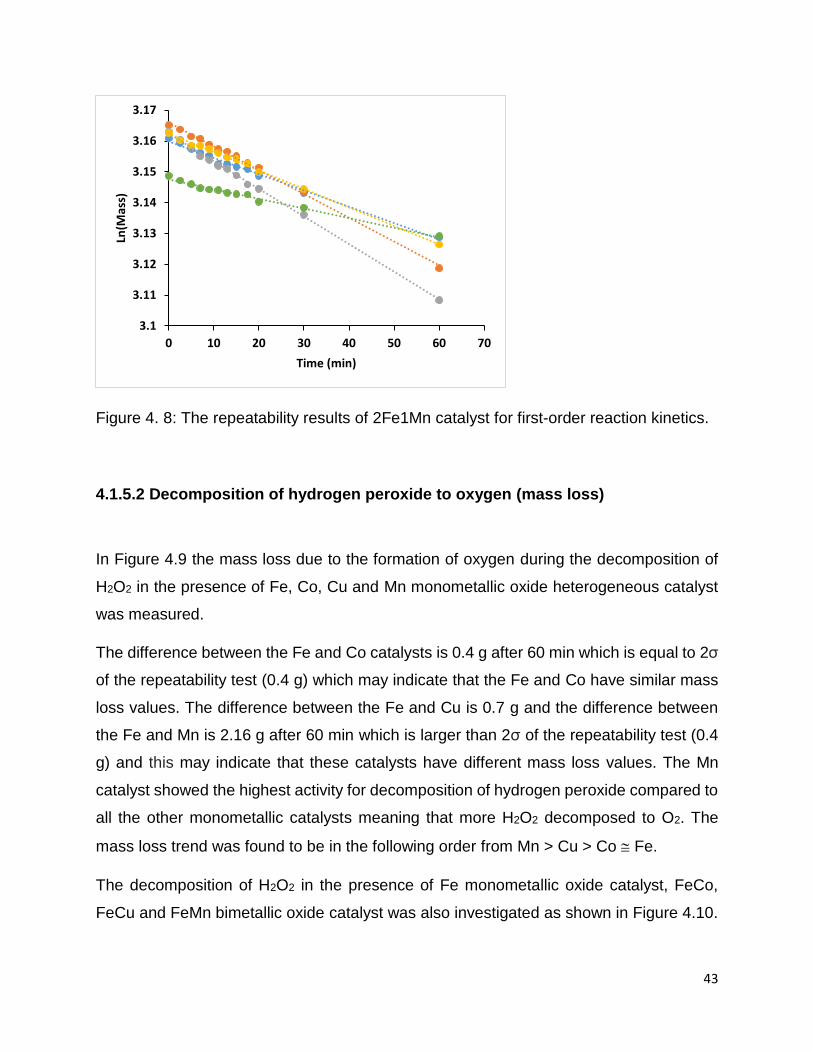
Figure 4. 8: The repeatability results of 2Fe1Mn catalyst for first-order reaction kinetics.
...................................................................................................................................... 43
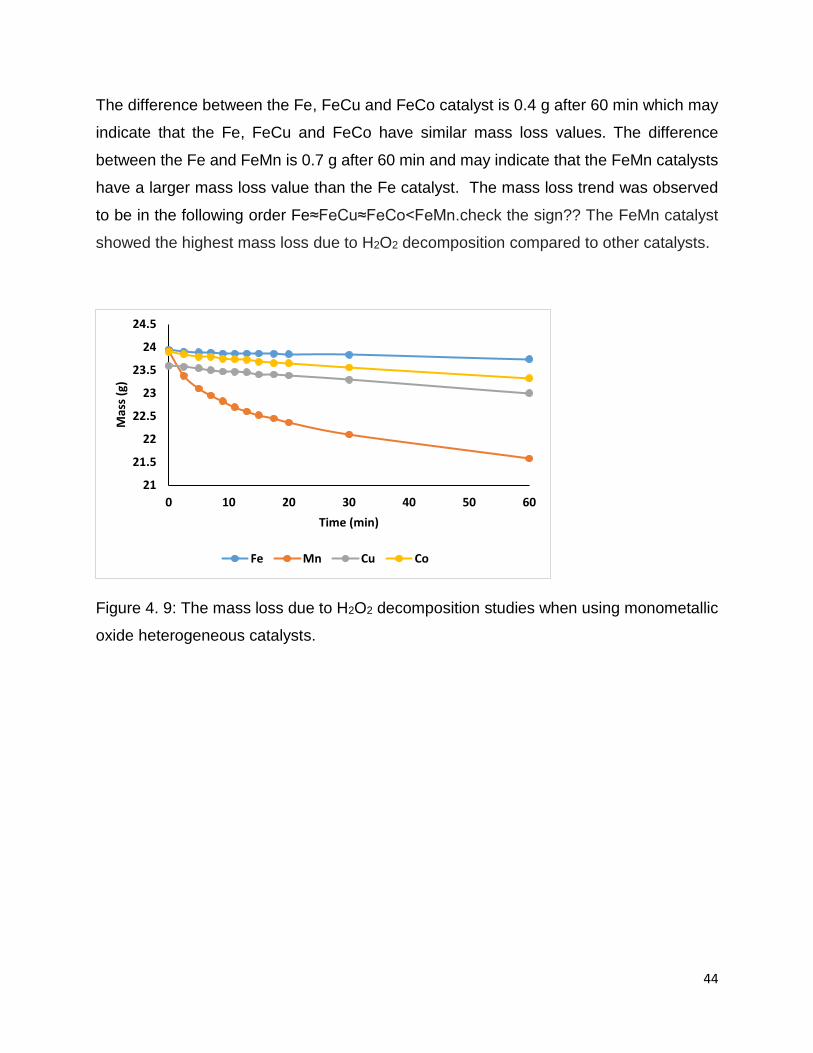
Figure 4. 9: The mass loss due to H2O2 decomposition studies when using
monometallic oxide heterogeneous catalysts. ............................................................... 44
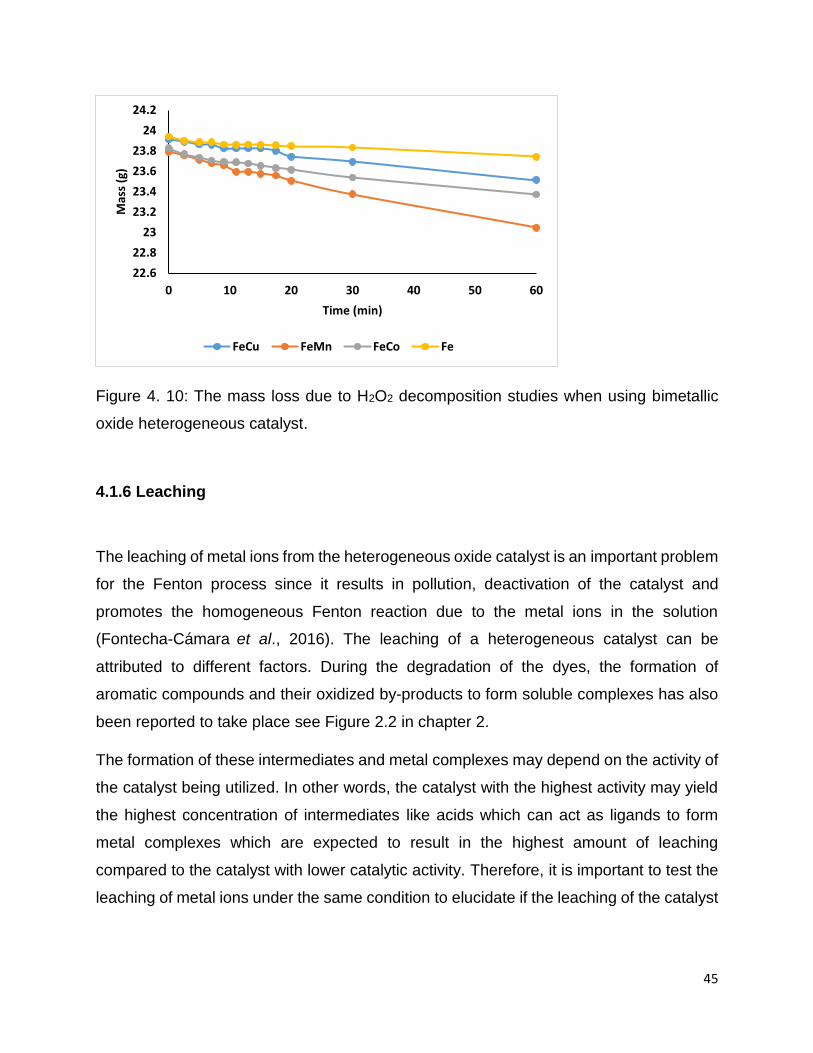
Figure 4. 10: The mass loss due to H2O2 decomposition studies when using bimetallic
oxide heterogeneous catalysts. ..................................................................................... 45
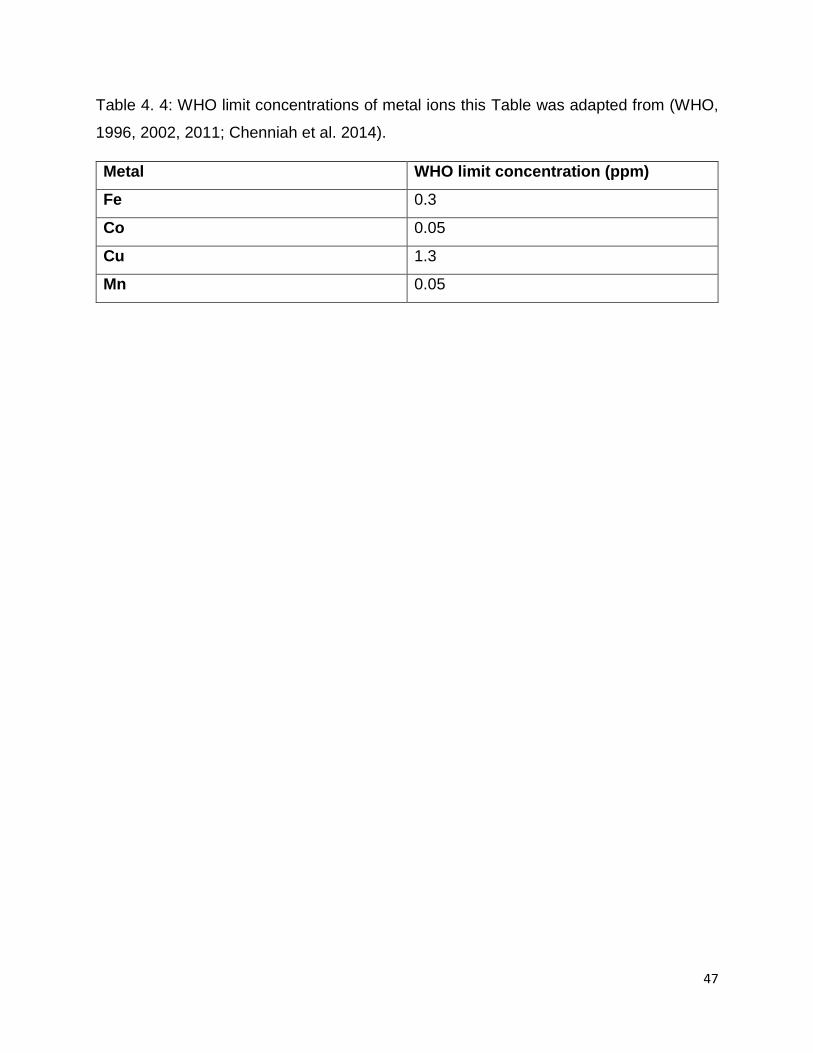
Figure 4. 11: Repeatability concentration of (a) the Fe ions in 2Fe1Mn in oxalic acid (b)
the Fe ions in 2Fe1Mn during degradation. ................................................................... 48
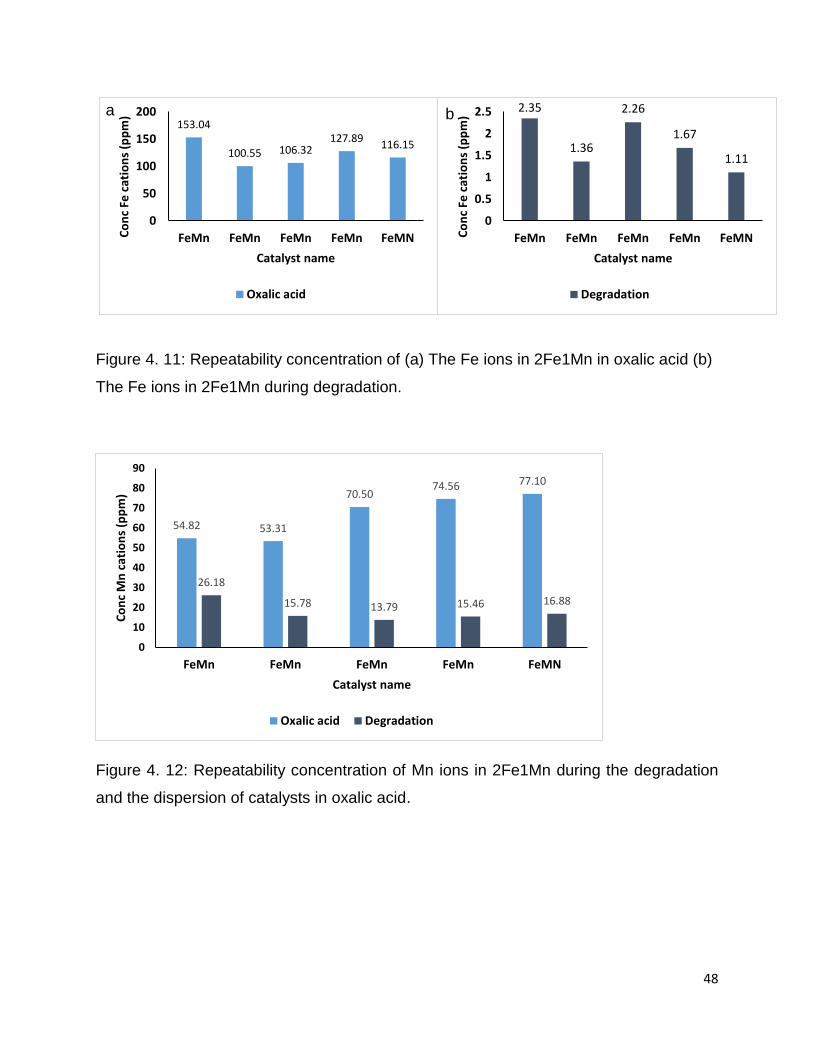
Figure 4. 12: Repeatability concentration of Mn ions in 2Fe1Mn during the degradation
and the dispersion of catalysts in oxalic acid. ................................................................ 48
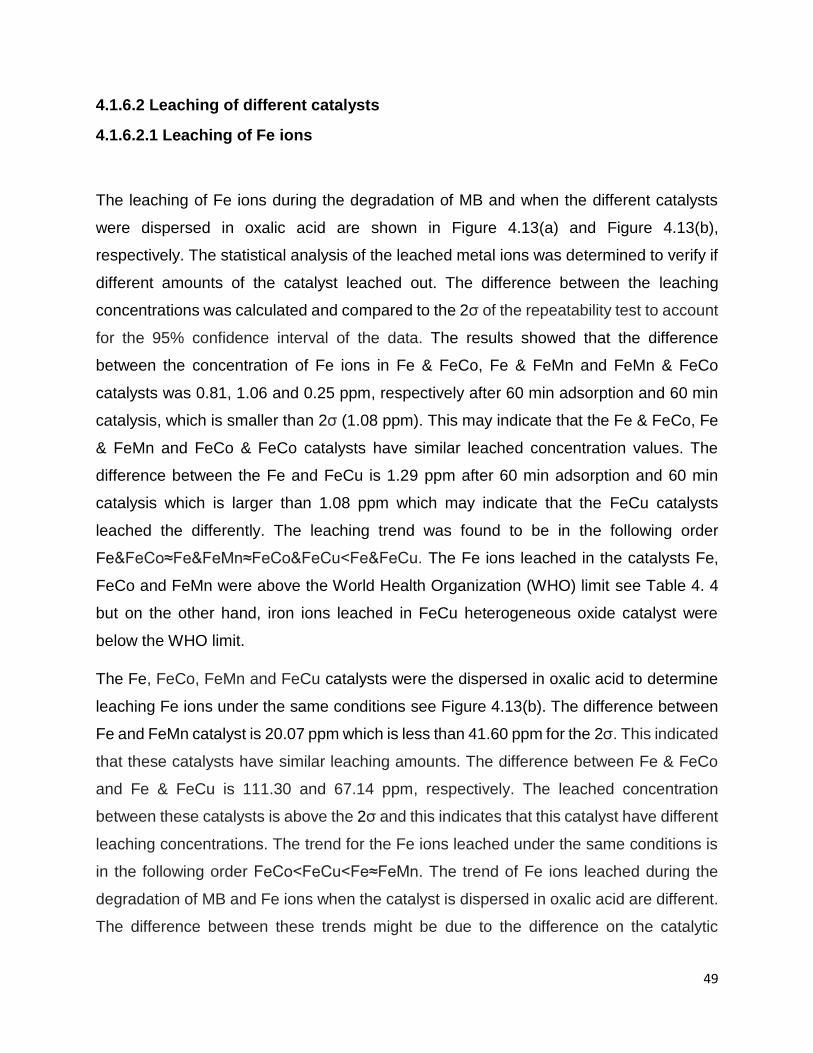
Figure 4. 13: The leaching metal ions (a) during degradation of MB for Fe metal ions (b)
catalyst dispersed in oxalic for Fe ions. ......................................................................... 51
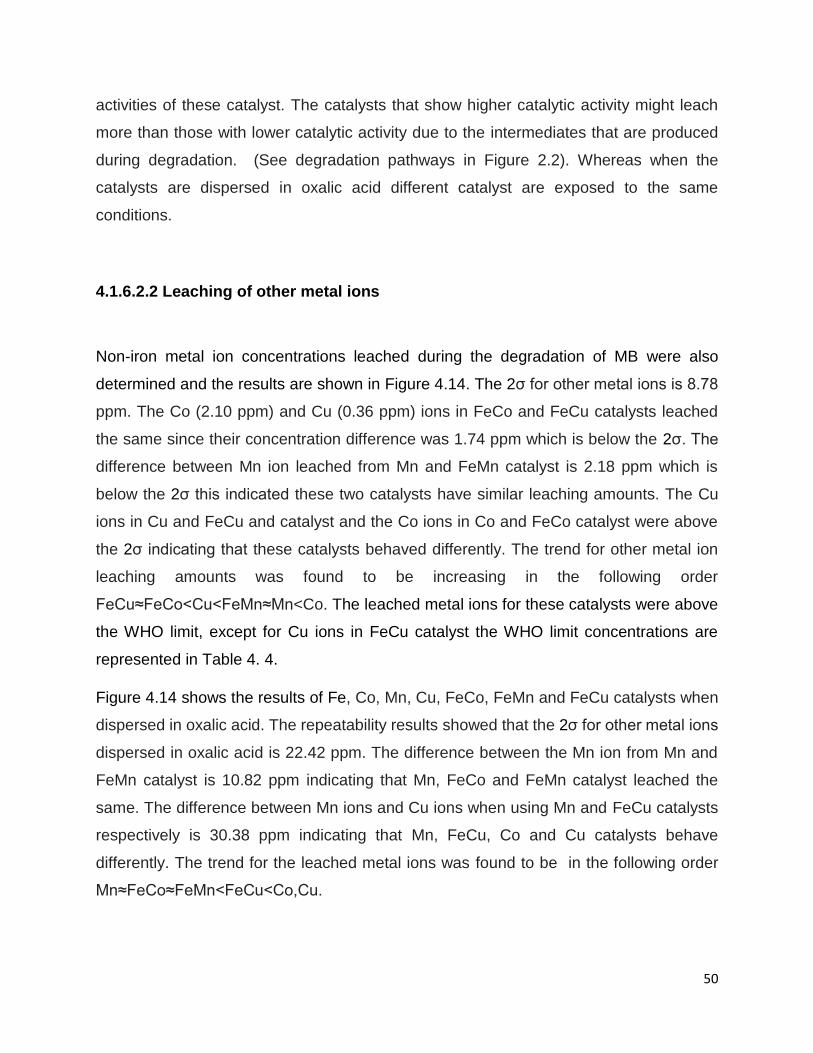
Figure 4. 14: Leached metal ions during degradation and catalyst dispersed in oxalic
acid for Co, Cu and Mn metal ions. ............................................................................... 51
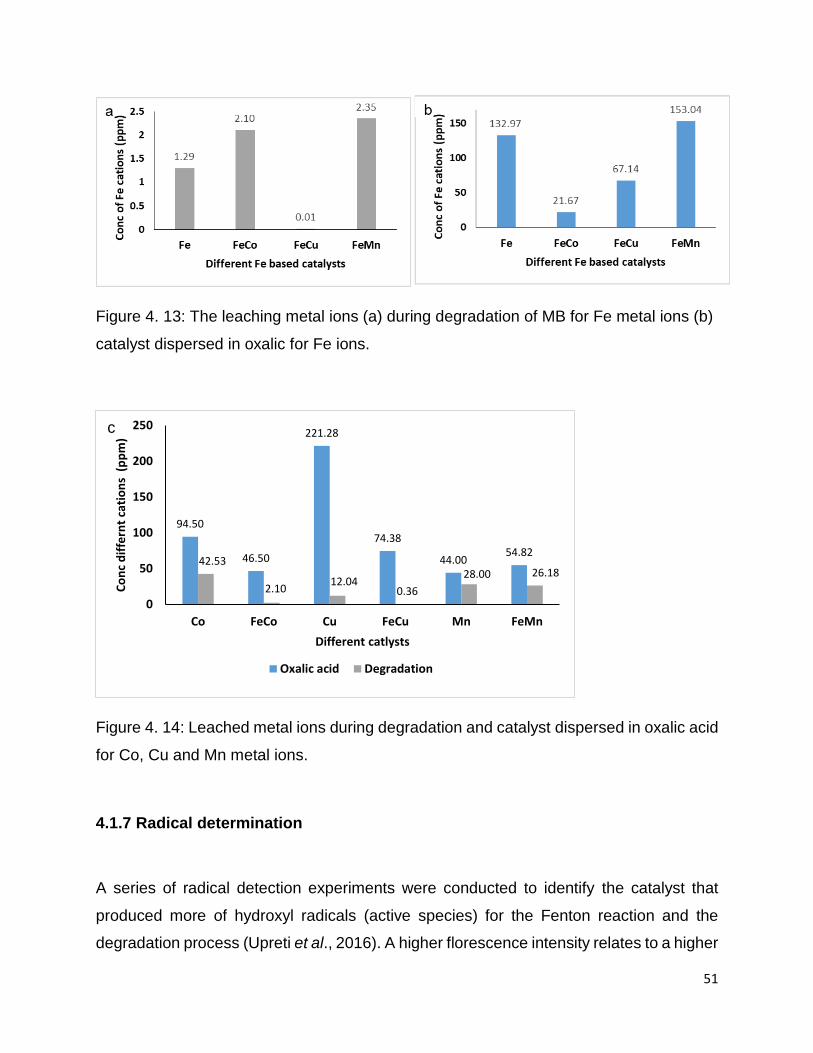
Figure 4. 15: Radical determination of (a) Fe, (b) FeCo, (c) FeCu and (d) FeMn
catalysts ........................................................................................................................ 52
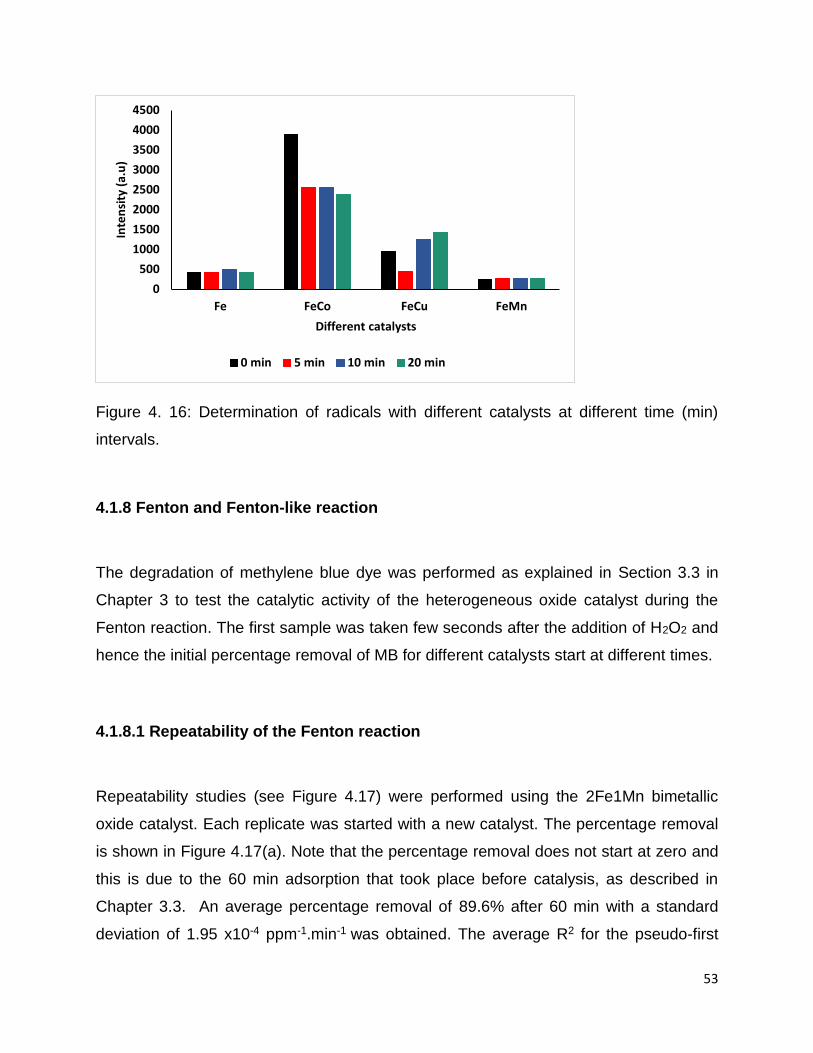
Figure 4. 16: Determination of radicals with different catalysts at different time (min)
intervals. ........................................................................................................................ 53
Page 13
xiii
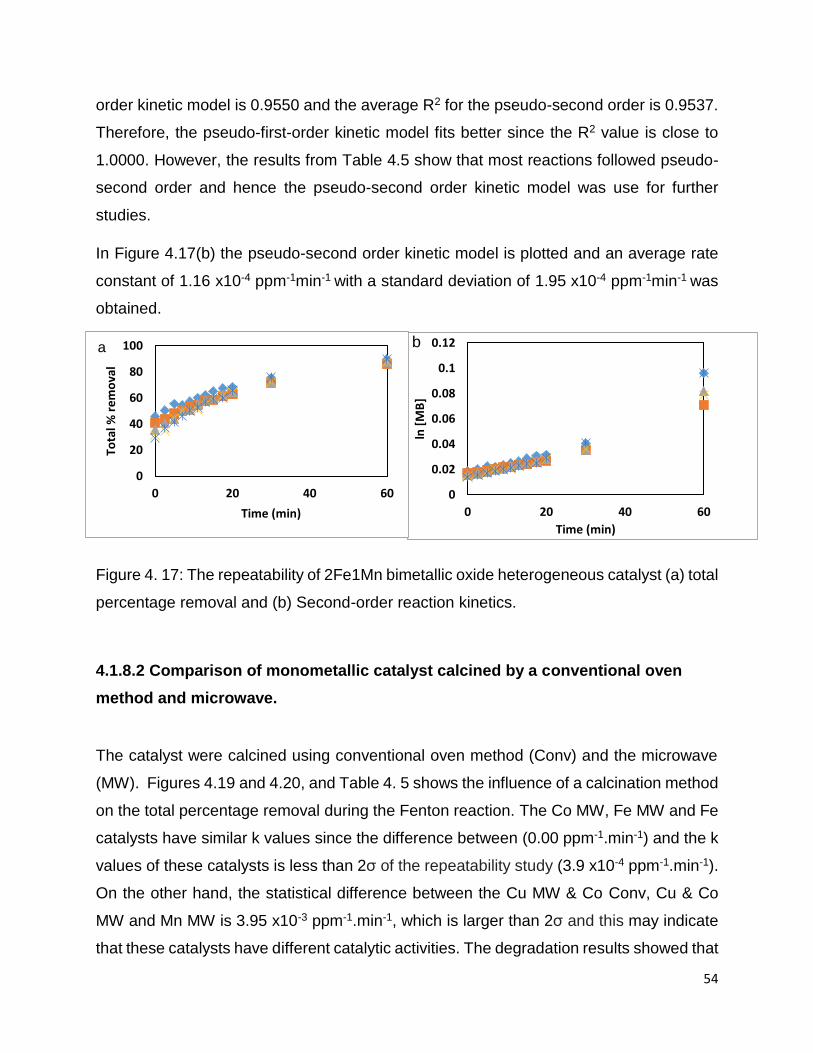
Figure 4. 17: The repeatability of 2Fe1Mn bimetallic oxide heterogeneous catalyst (a)
total percentage removal and (b) second-order reaction kinetics. ................................. 54
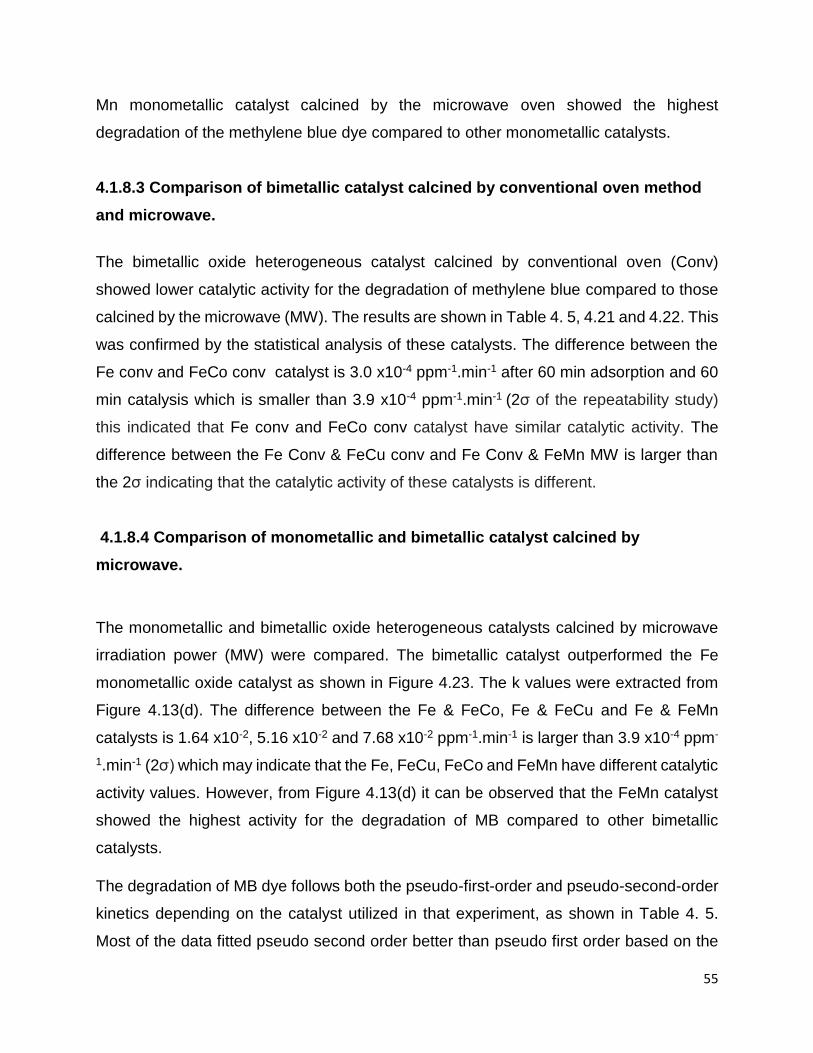
Figure 4. 18: The pseudo-second order rate constant for the degradation of MB dye of
the catalyst calcined by conventional heating and microwave irradiation. ..................... 56
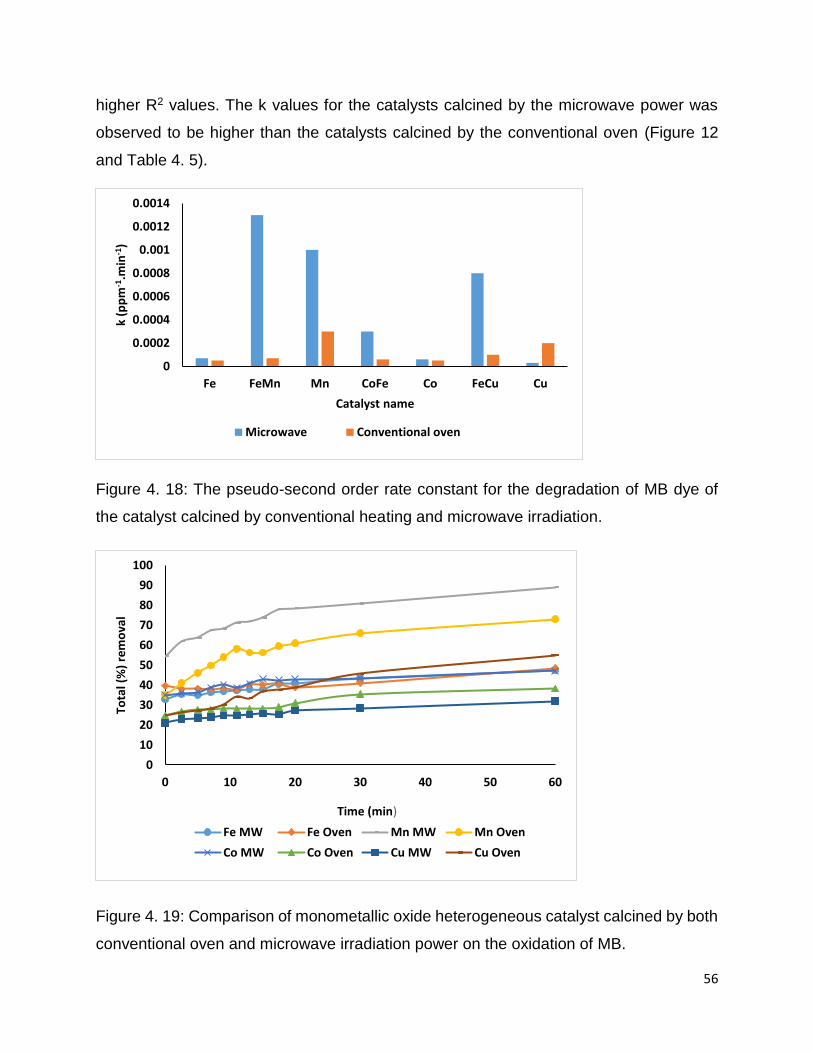
Figure 4. 19: Comparison of monometallic oxide heterogeneous catalyst calcined by
both conventional oven and microwave irradiation power on the oxidation of MB. ....... 56
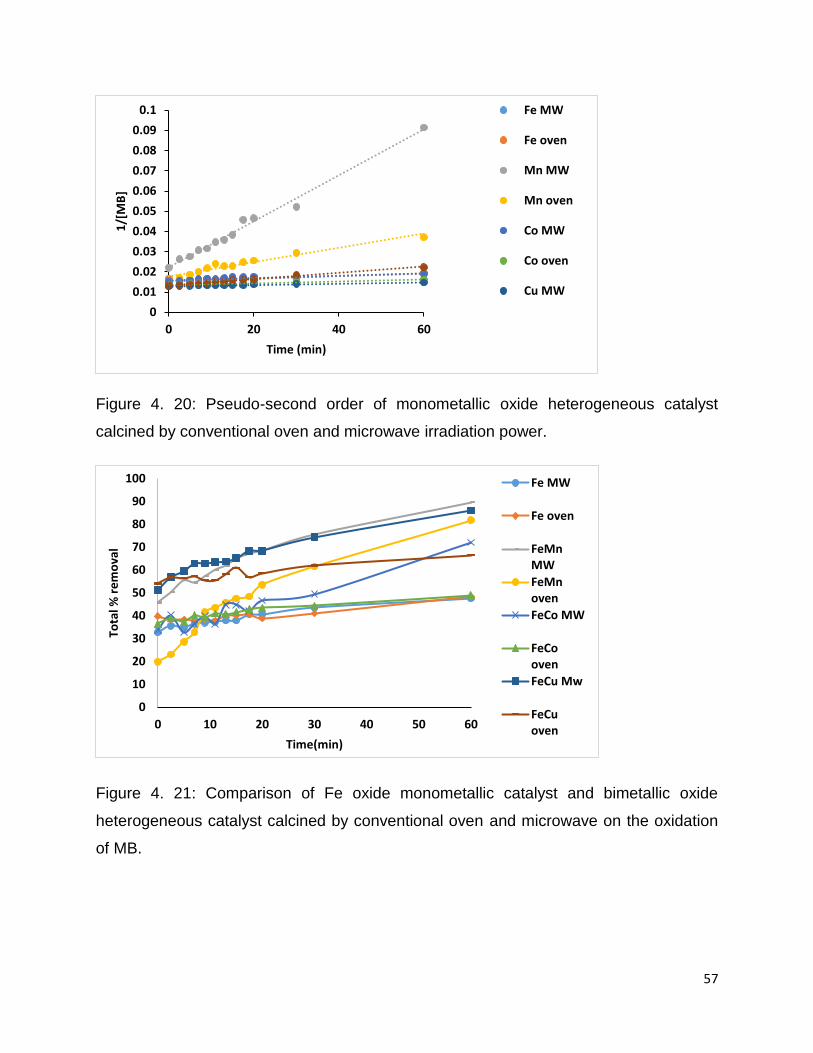
Figure 4. 20: Pseudo-second order kinetics of monometallic oxide heterogeneous
catalyst calcined by conventional oven and microwave irradiation power. .................... 57
Figure 4. 21: Comparison of Fe oxide monometallic catalyst and bimetallic oxide
heterogeneous catalyst calcined by conventional oven and microwave on the oxidation
of MB. ............................................................................................................................ 57
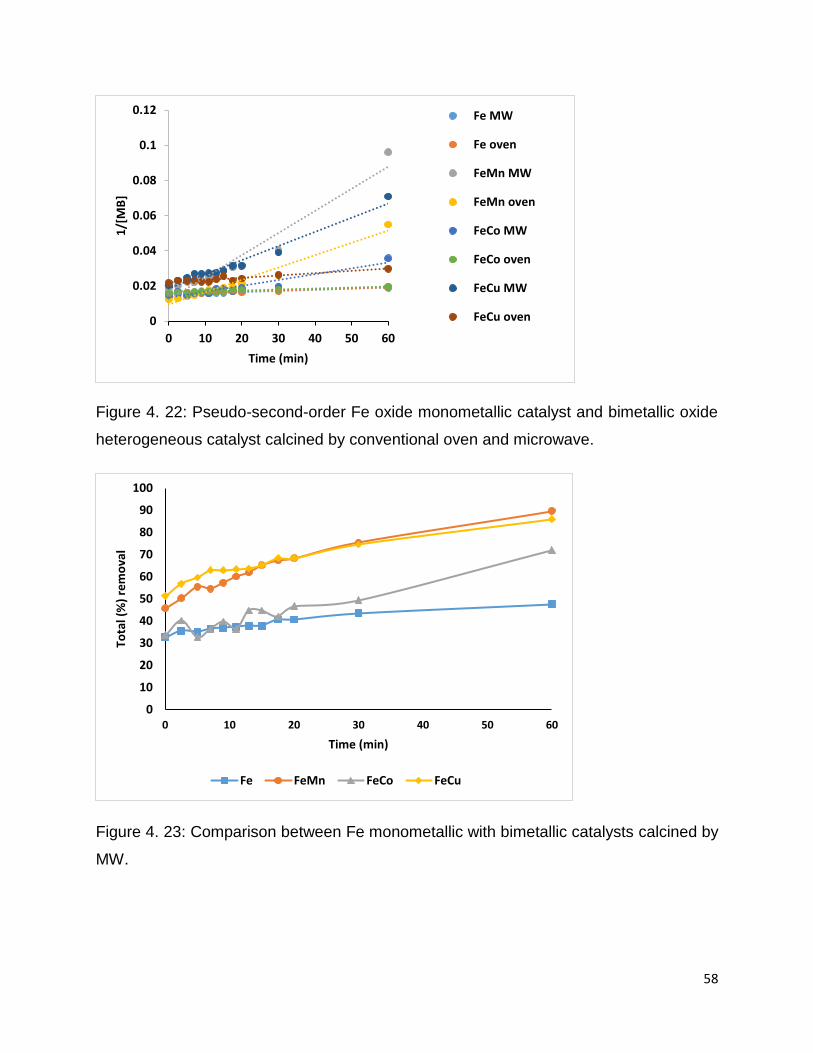
Figure 4. 22: Pseudo-second-order kinetics for Fe oxide monometallic catalyst and
bimetallic oxide heterogeneous catalyst calcined by conventional oven and microwave.
...................................................................................................................................... 58
Figure 4. 23: Comparison between Fe monometallic with bimetallic catalysts calcined by
MW. ............................................................................................................................... 58
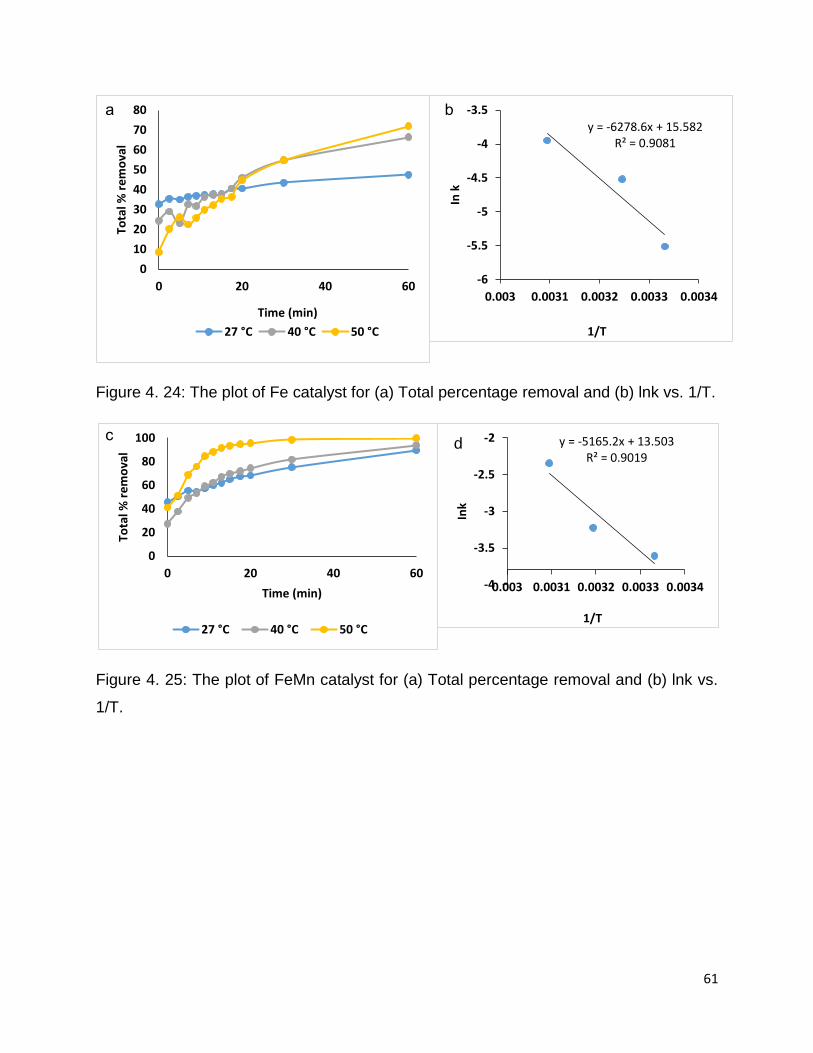
Figure 4. 24: The plot of Fe catalyst for (a) total percentage removal and (b) Ink vs. 1/T.
...................................................................................................................................... 61
Figure 4. 25: The plot of FeMn catalyst for (a) total percentage removal and (b) lnk vs.
1/T. ................................................................................................................................ 61
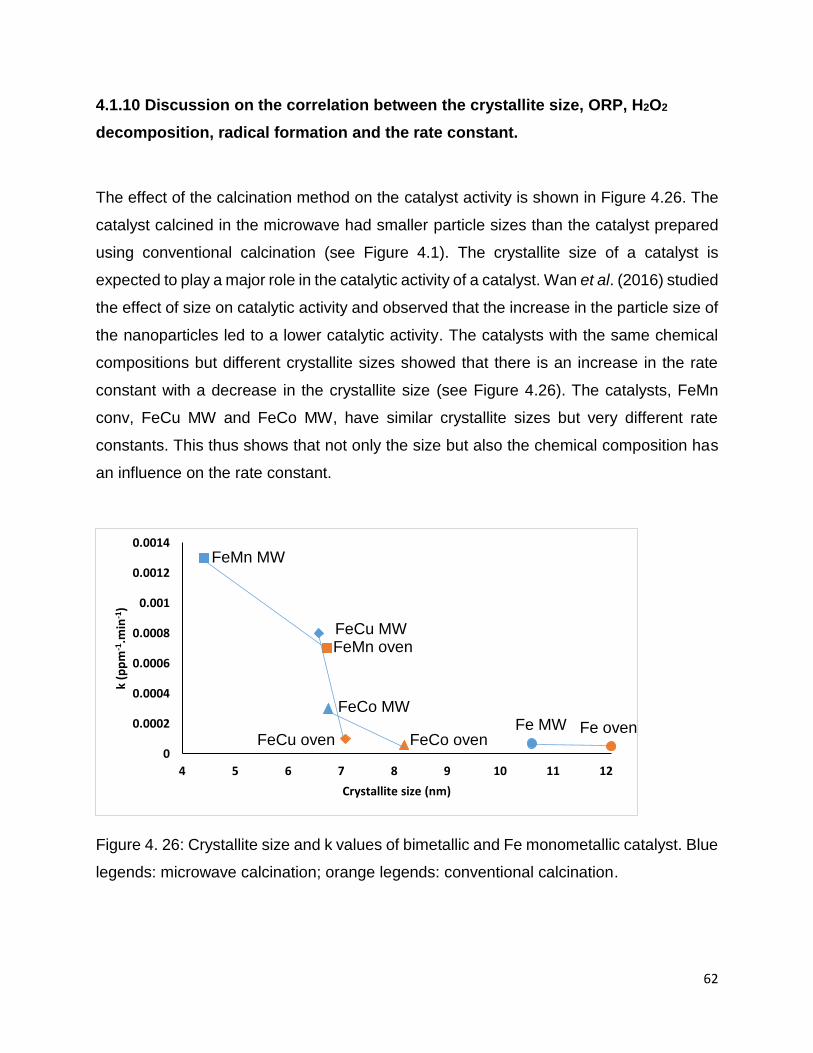
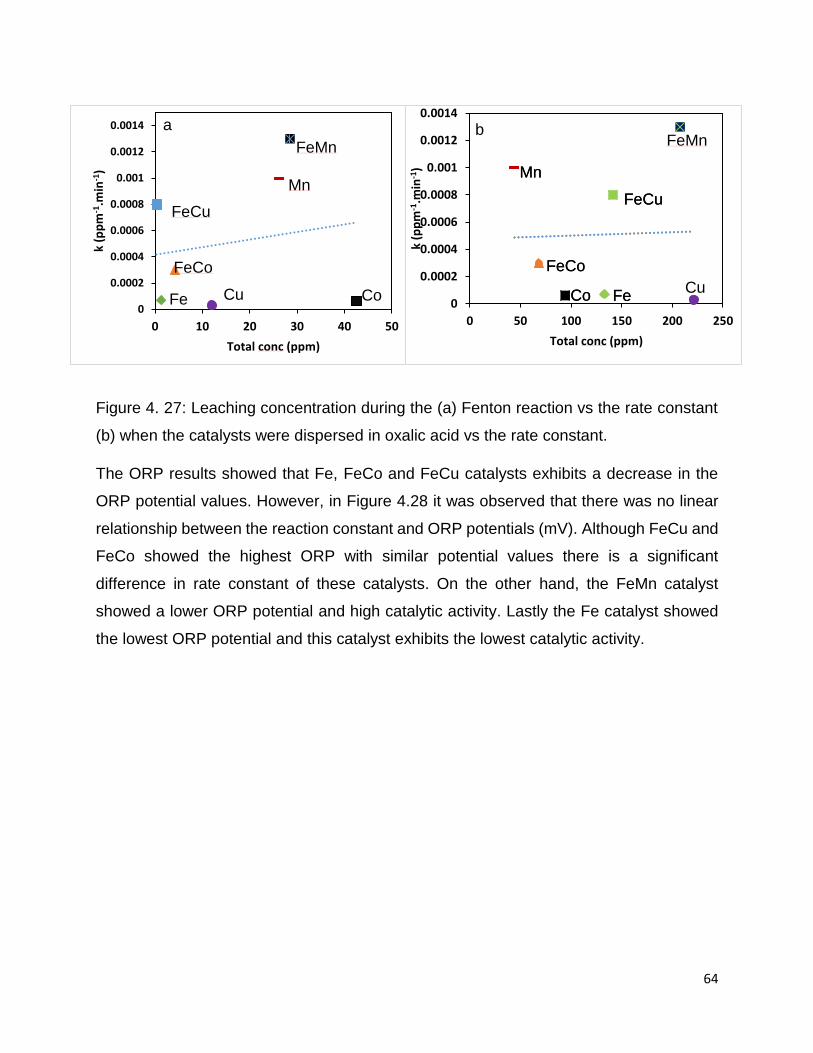
Figure 4. 26: Crystallite size and k values of bimetallic and Fe monometallic catalyst.
Blue legends: microwave calcination; orange legends: conventional calcination. ......... 62
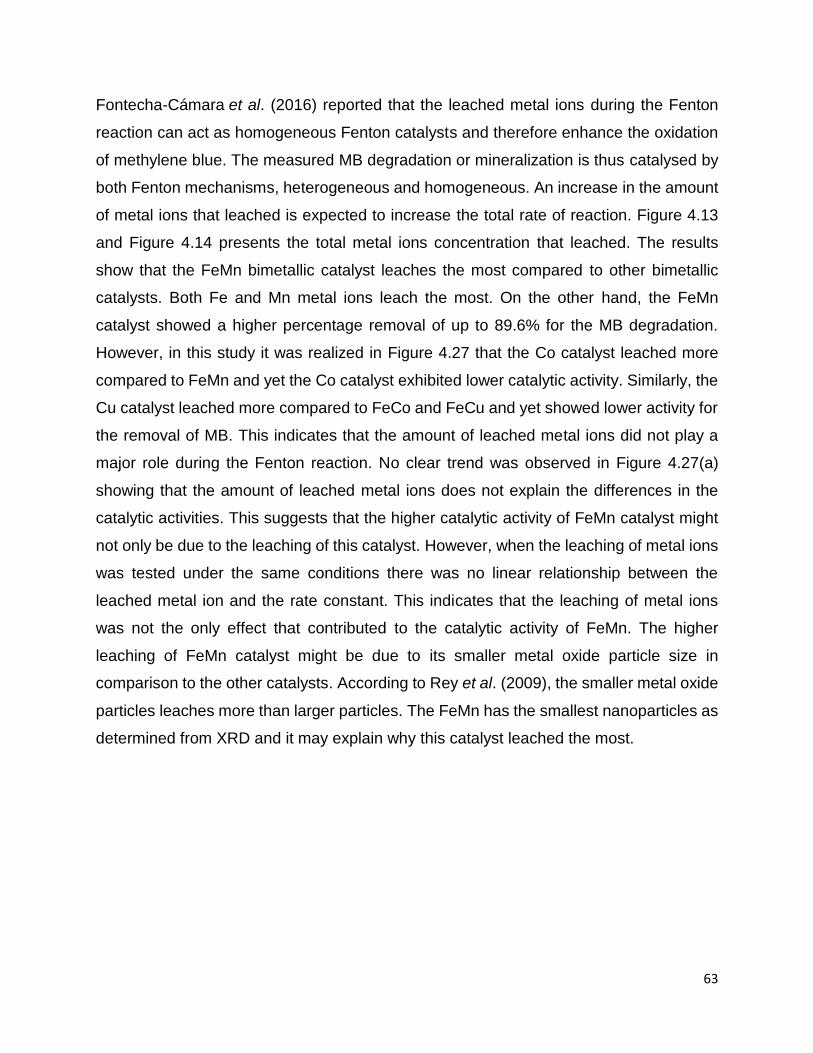
Figure 4. 27: Leaching concentration during the (a) Fenton reaction vs the rate constant
(b) when the catalysts were dispersed in oxalic acid vs the rate constant..................... 64
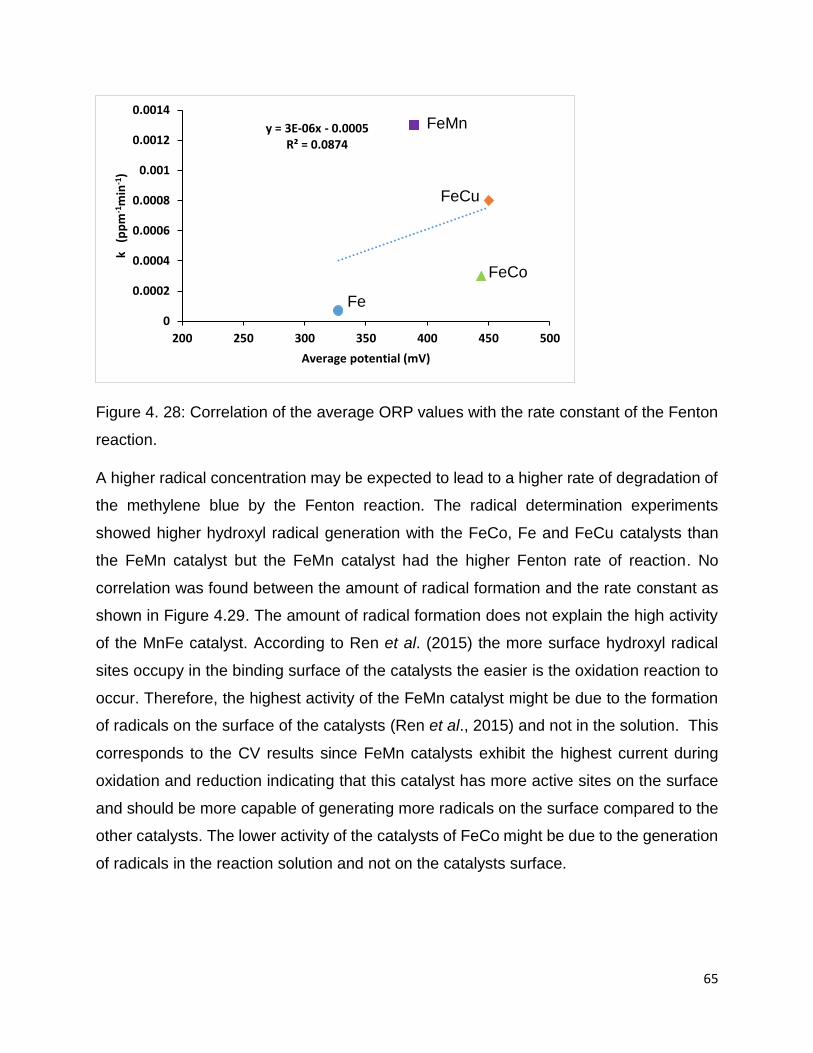
Figure 4. 28: Correlation of the average ORP values with the rate constant of the
Fenton reaction. ............................................................................................................ 65
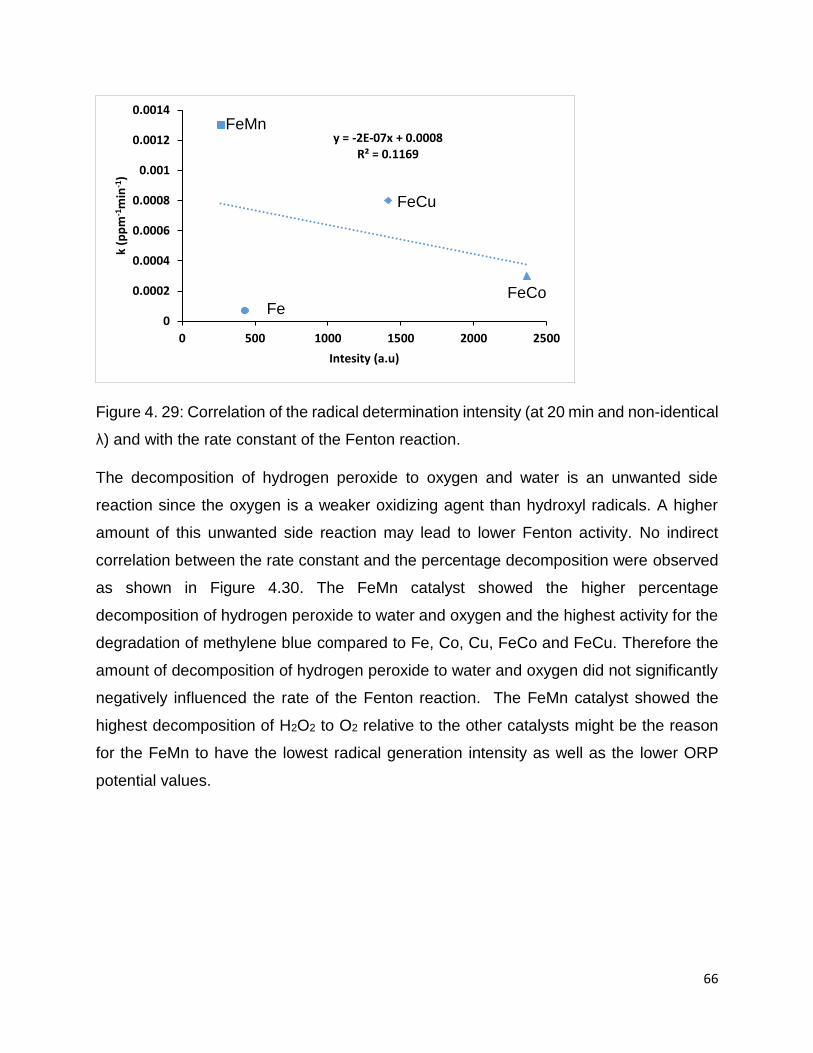
Figure 4. 29: Correlation of the radical determination intensity (at 20 min and non-
identical λ) and with the rate constant of the Fenton reaction. ...................................... 66
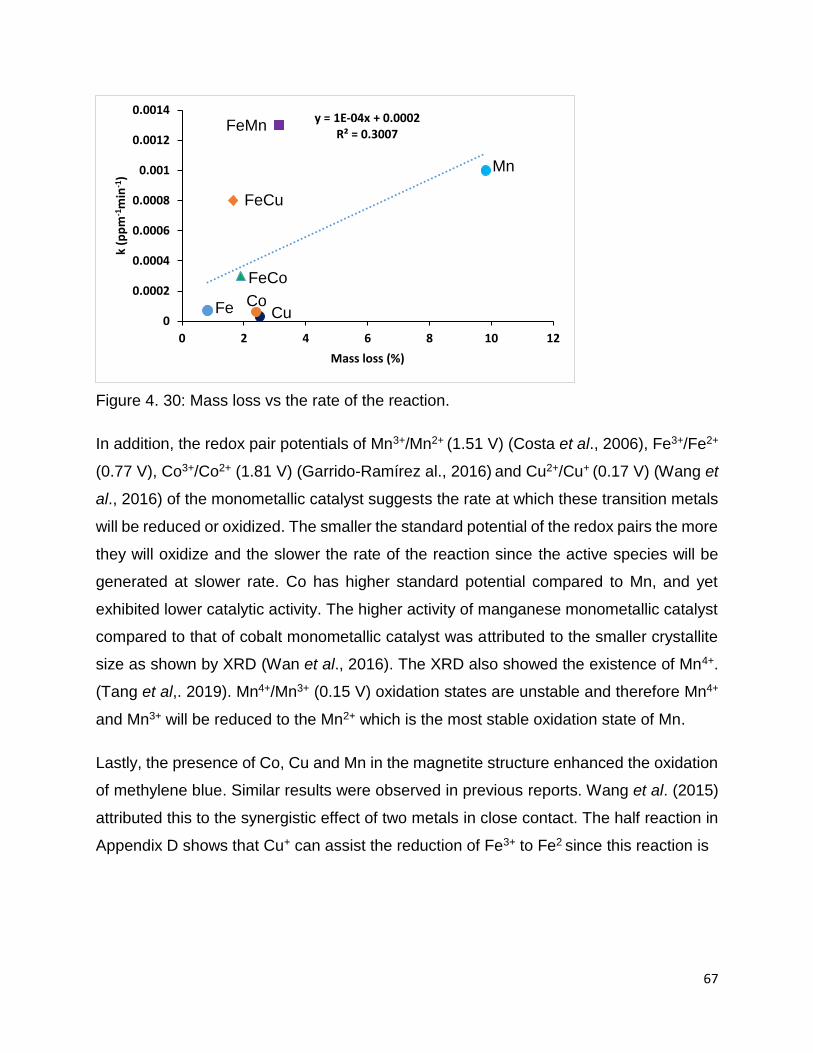
Figure 4. 30: Mass loss vs the rate of the reaction. ....................................................... 67
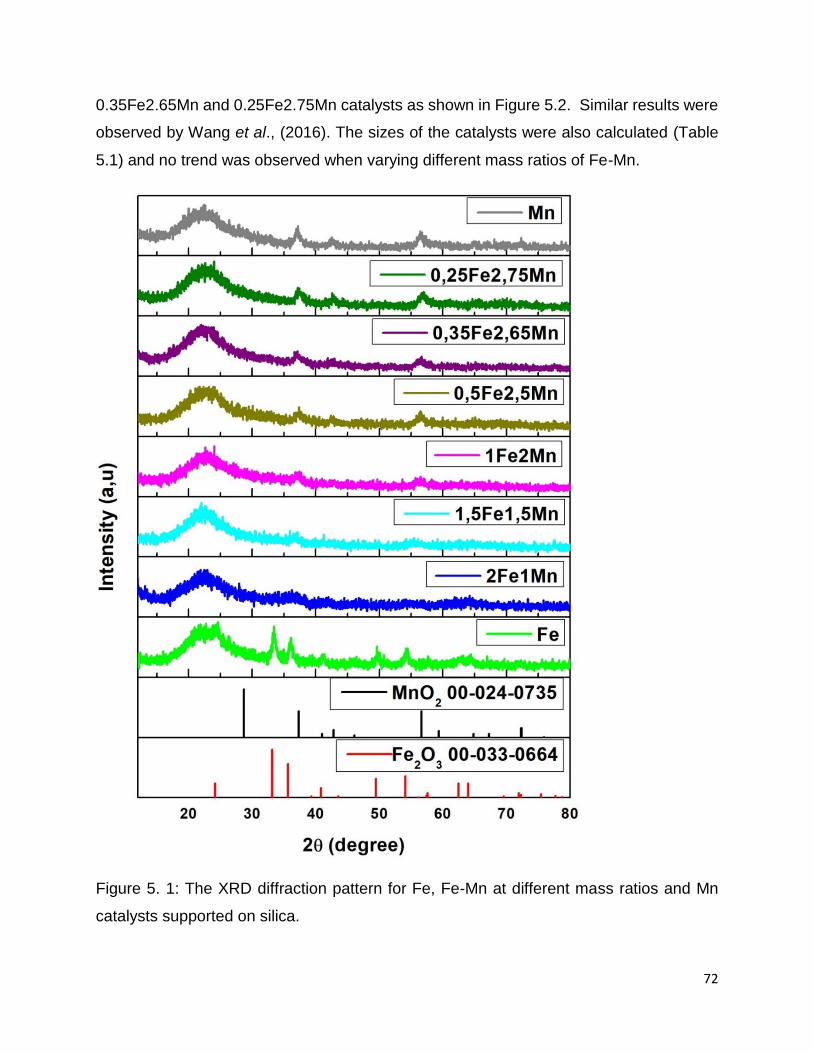
Figure 5. 1: The XRD diffraction pattern for Fe, Fe-Mn at different mass ratios and Mn
catalysts supported on silica. ........................................................................................ 72
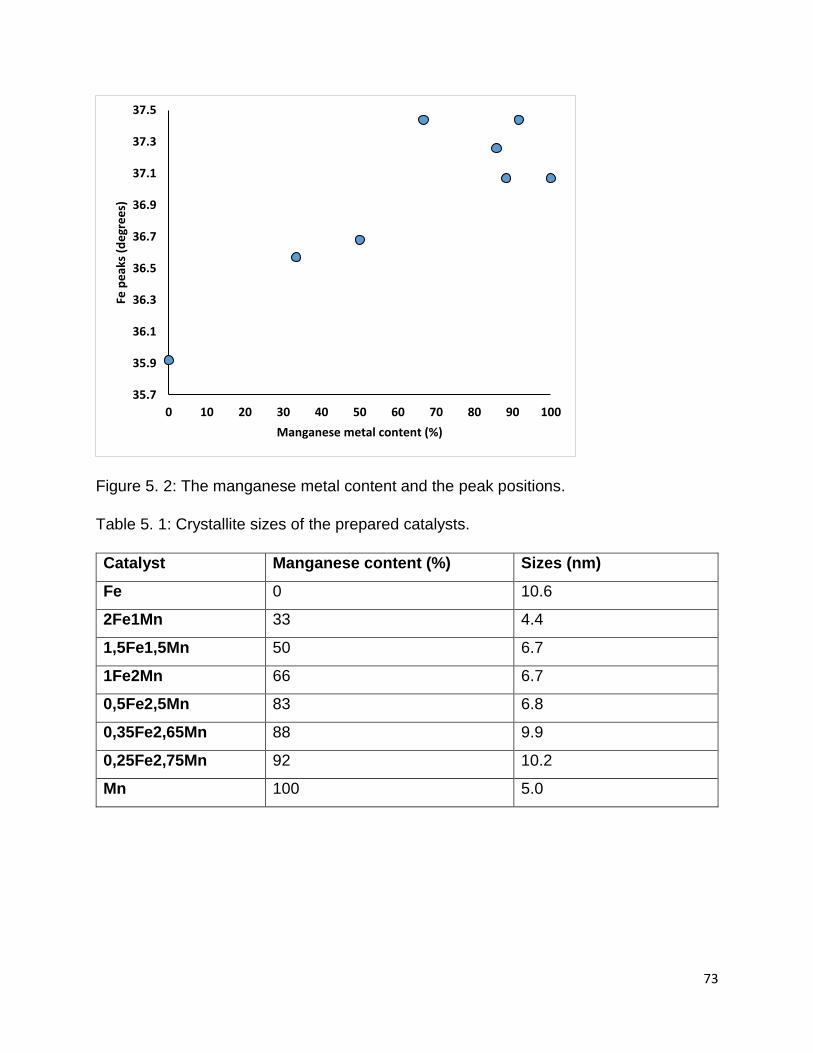
Figure 5. 2: The manganese metal content and the peak positions. ............................. 73
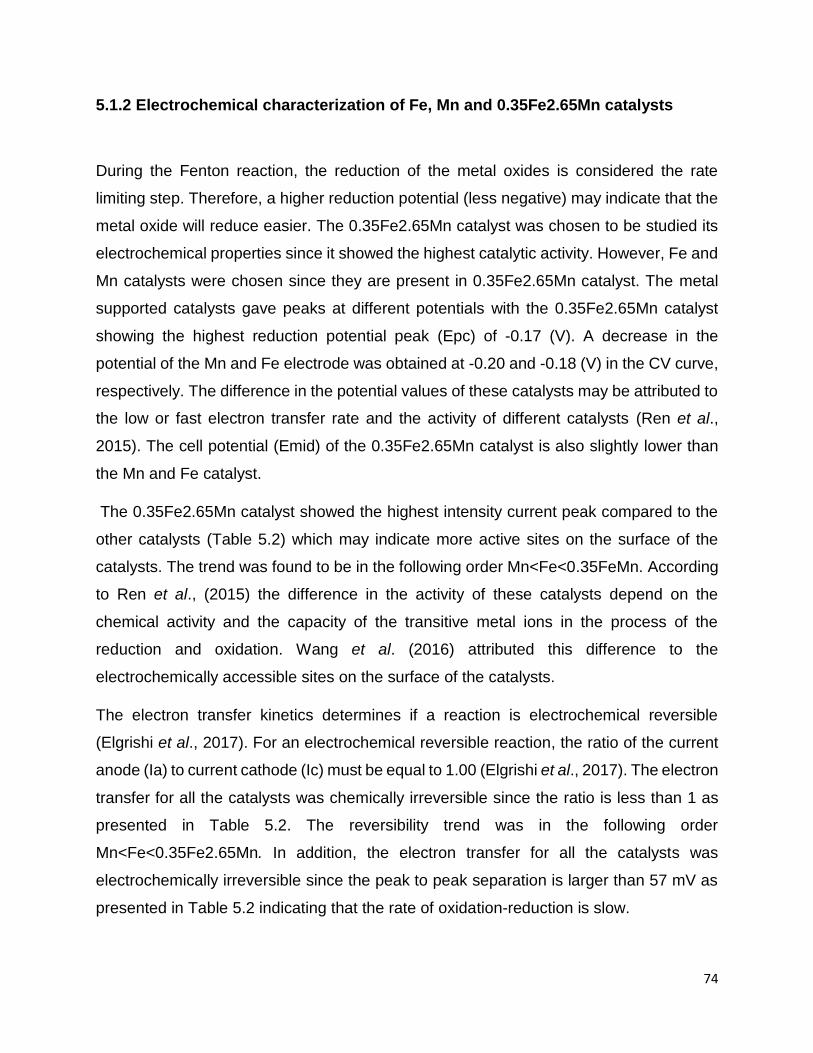
Figure 5. 3: Cyclic voltammograms of Fe, 0.35Fe2.65Mn and Mn catalysts. ................ 75
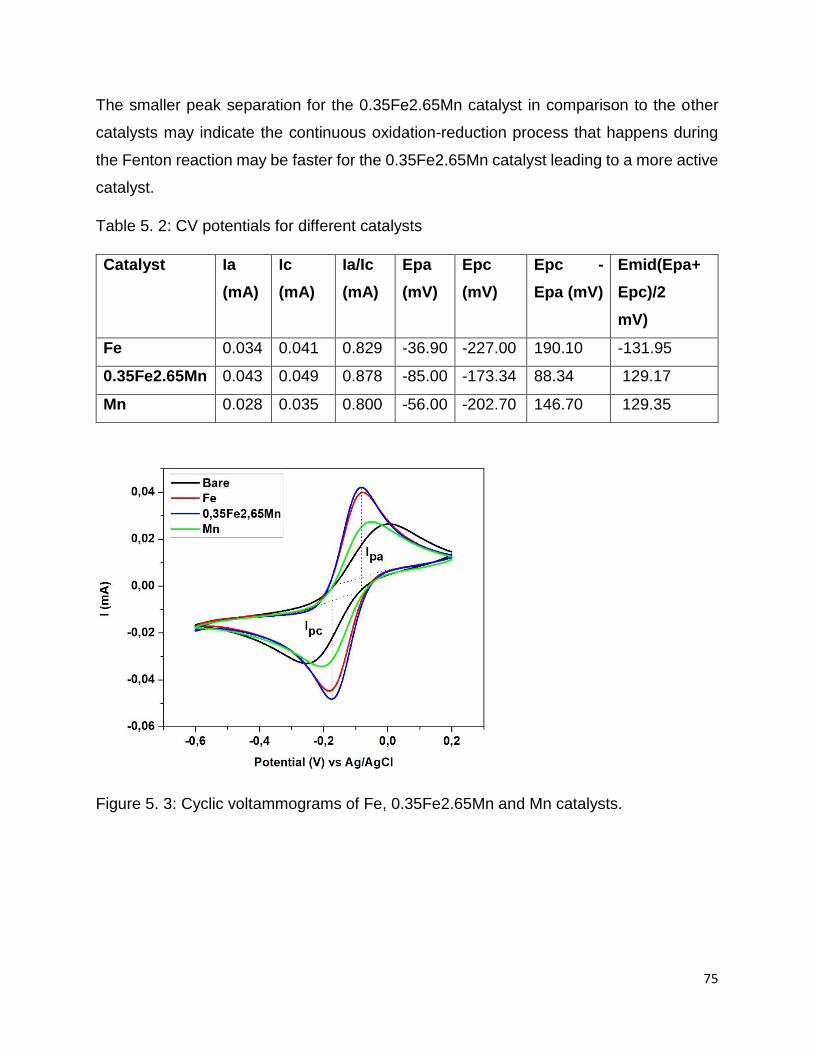
Figure 5. 4: The ORP repeatability using 0.35Fe2.65Mn catalyst. ................................ 76
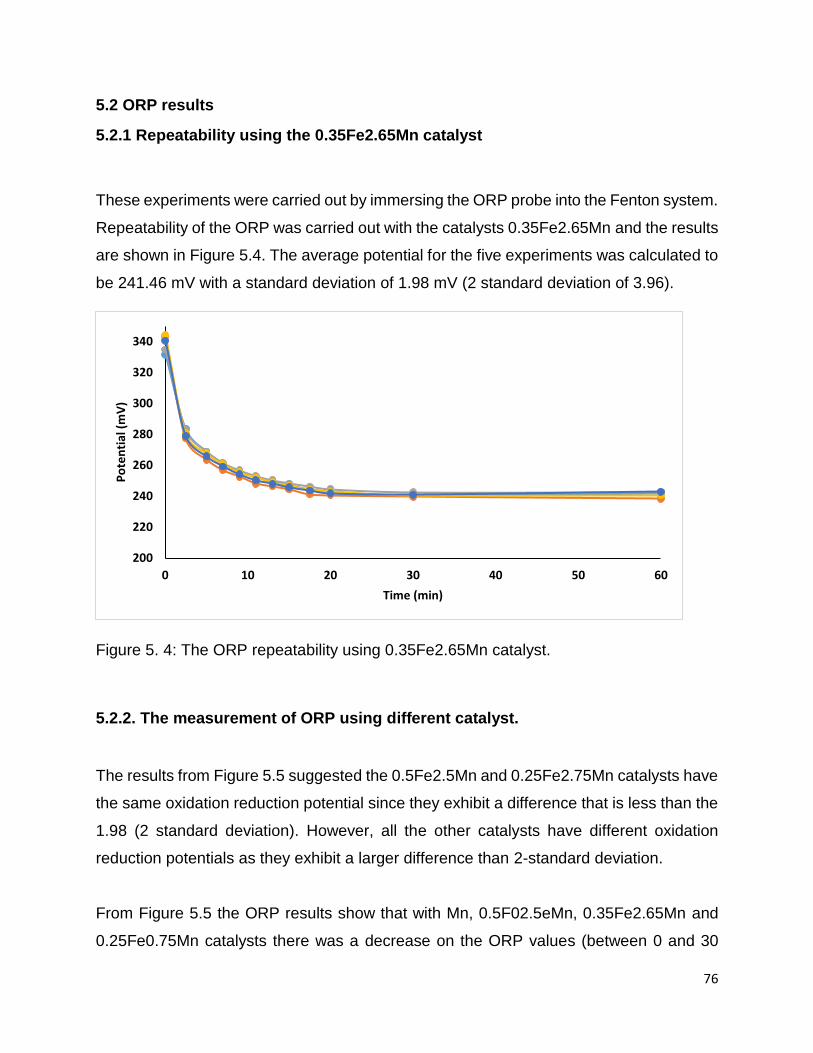
Figure 5. 5: The ORP measurements for the results. .................................................... 77
Figure 5. 6: Radical determination of (a) 0.35Fe2.65Mn and (b) Mn catalyst. ............... 78
Figure 5. 7: Radical determination of Fe, 0.35Fe2.65Mn and Mn catalyst. ................... 78
Figure 5. 8: Decomposition of H2O2 to O2 using 0.35Fe2.65Mn mass ratio. ................. 79
Figure 5. 9: Decomposition of H2O2 to oxygen using different mass ratio catalysts. ..... 80
Figure 5. 10: Leaching repeatability of (a) Leaching of the catalysts Fe ion using oxalic
acid. ............................................................................................................................... 81
Page 14
xiv
Figure 5. 11: The leaching of catalysts for Fe during the degradation of methylene blue.
...................................................................................................................................... 81
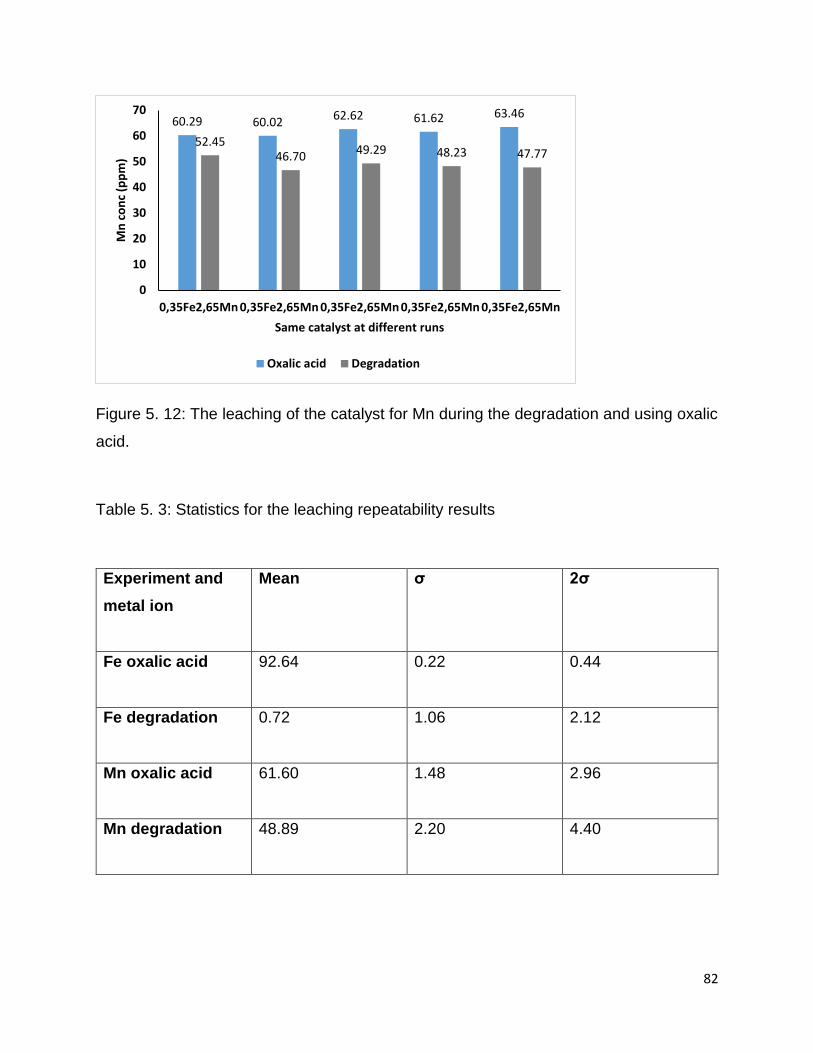
Figure 5. 12: The leaching of the catalyst for Mn during the degradation and using oxalic
acid. ............................................................................................................................... 82
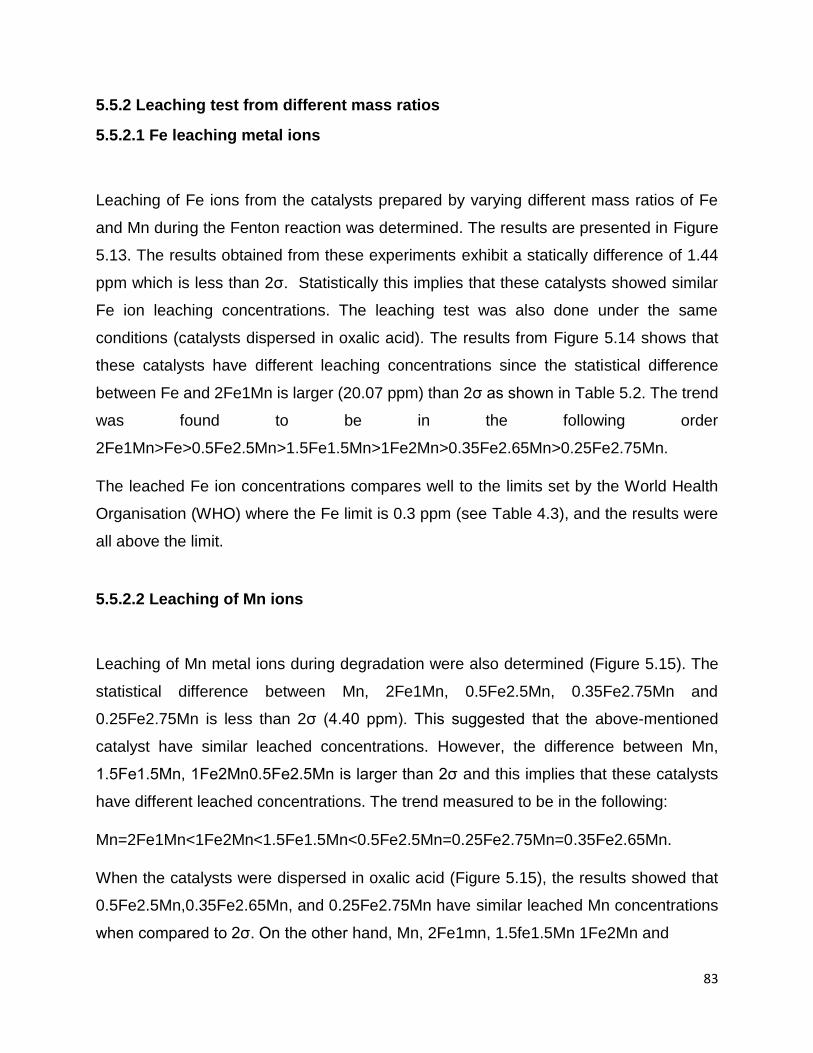
Figure 5. 13: Leaching concentrations of Fe ions during the degradation of methylene
blue. .............................................................................................................................. 84
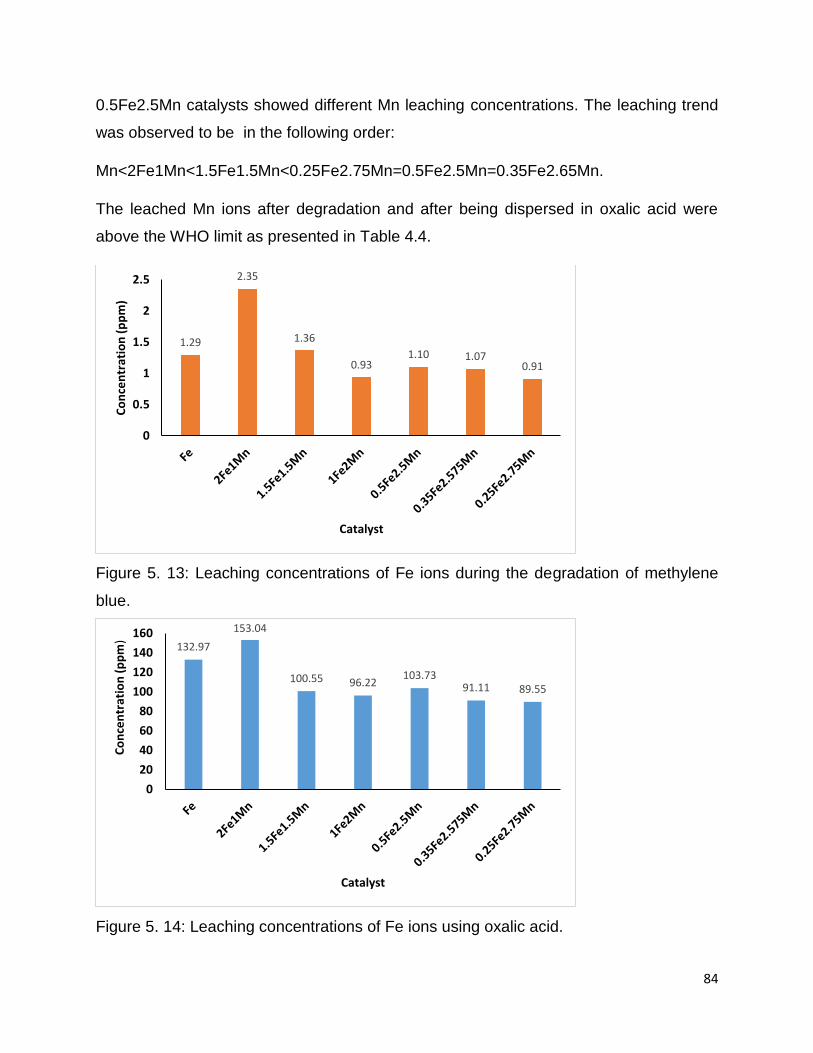
Figure 5. 14: Leaching concentrations of Fe ions using oxalic acid. ............................. 84
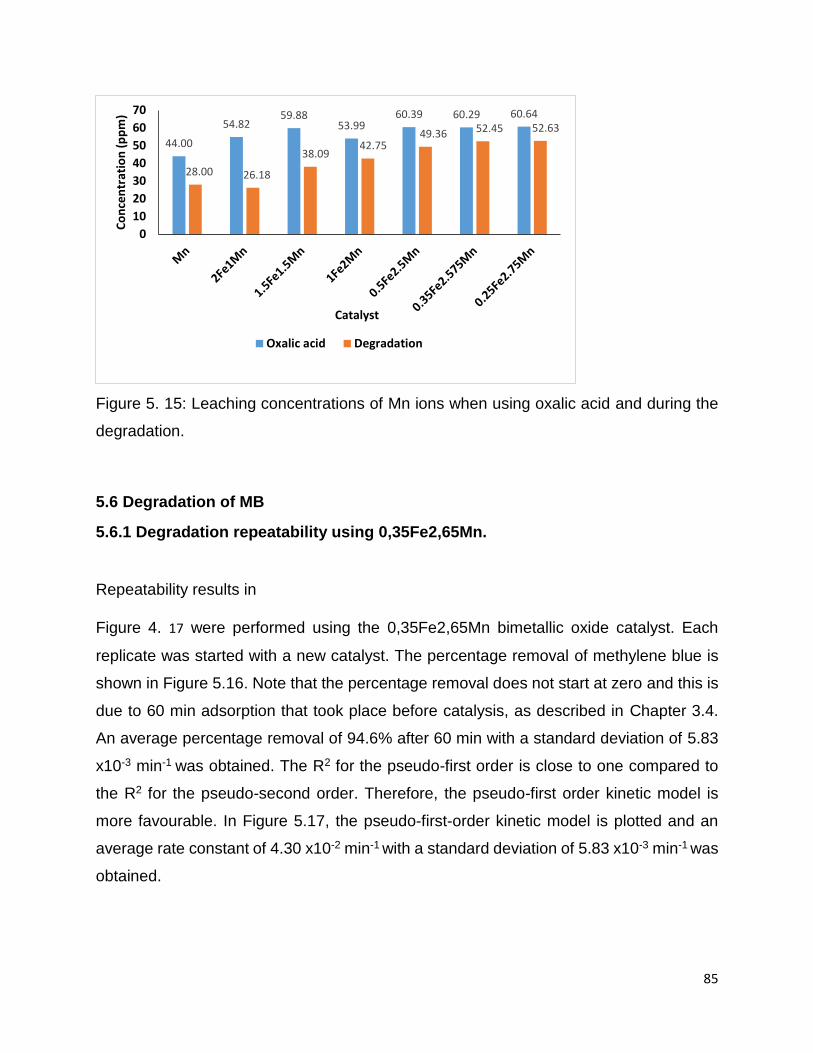
Figure 5. 15: Leaching concentrations of Mn ions when using oxalic acid and during the
degradation. .................................................................................................................. 85
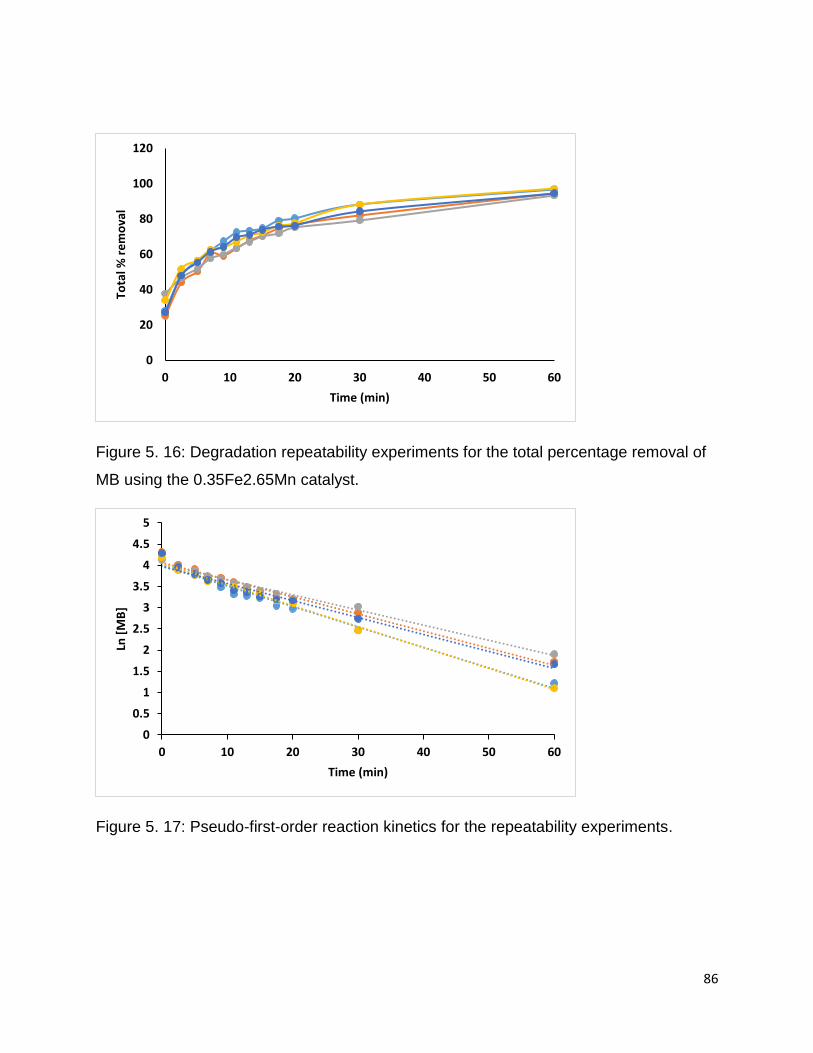
Figure 5. 16: Degradation repeatability experiments for the total percentage removal of
MB using the 0.35Fe2.65Mn catalyst. ........................................................................... 86
Figure 5. 17: Pseudo-first-order reaction kinetics for the repeatability experiments. ..... 86
Figure 5. 18: The percentage removal for the degradation of methylene blue using the
different catalysts of different ratios of each metal supported on silica in the presence of
H2O2. ............................................................................................................................. 87
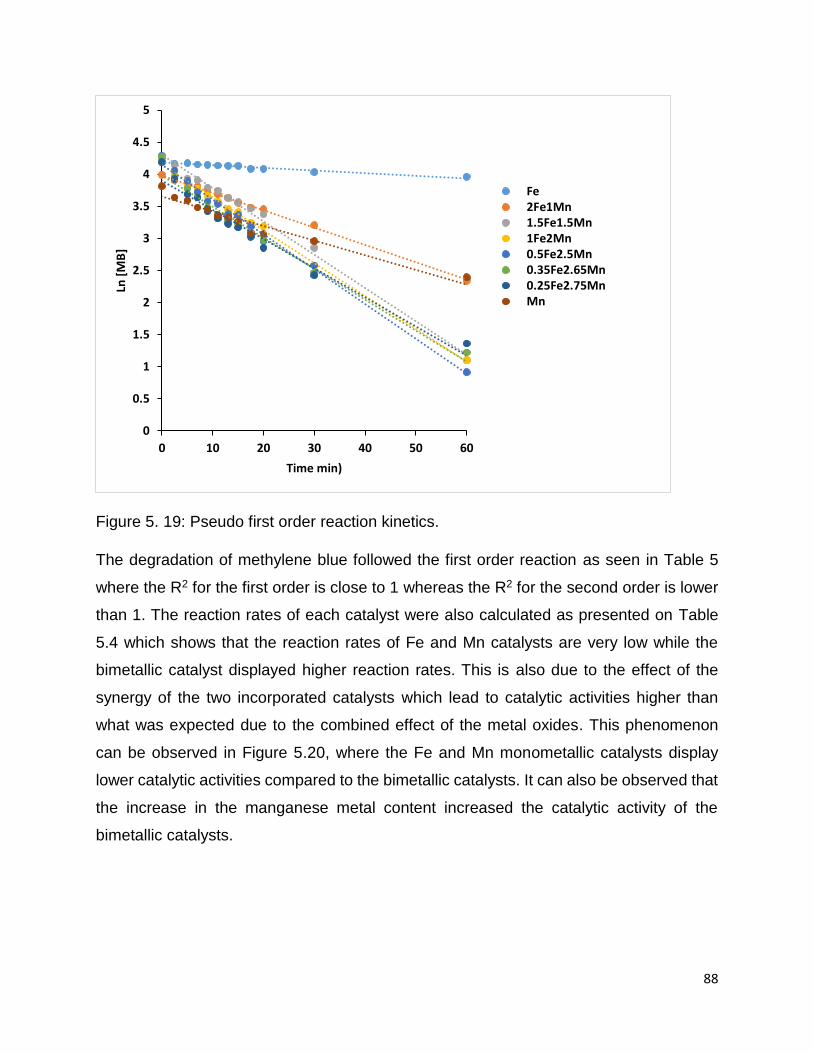
Figure 5. 19: Pseudo first order reaction kinetics. ......................................................... 88
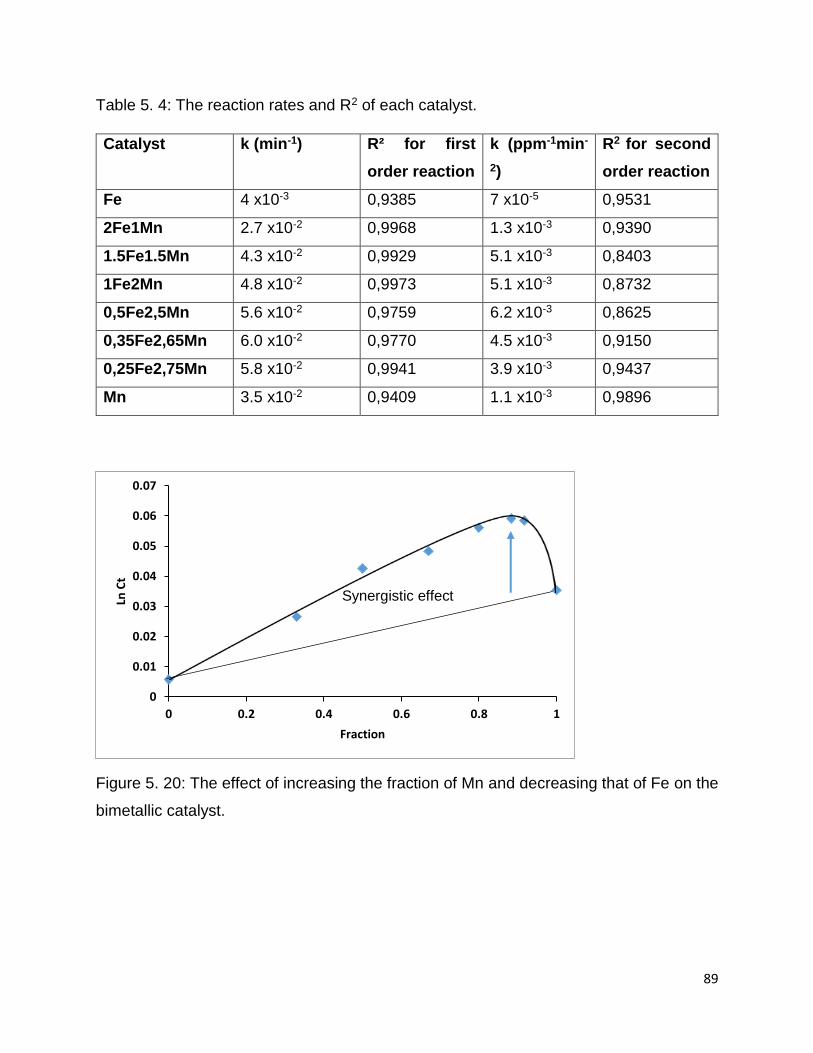
Figure 5. 20: The effect of increasing the fraction of Mn and decreasing that of Fe on the
bimetallic catalyst. ......................................................................................................... 89
Figure 5. 21: Crystallite size and k values of different Fe:Mn bimetallic catalyst at mass
ratios. ............................................................................................................................ 91
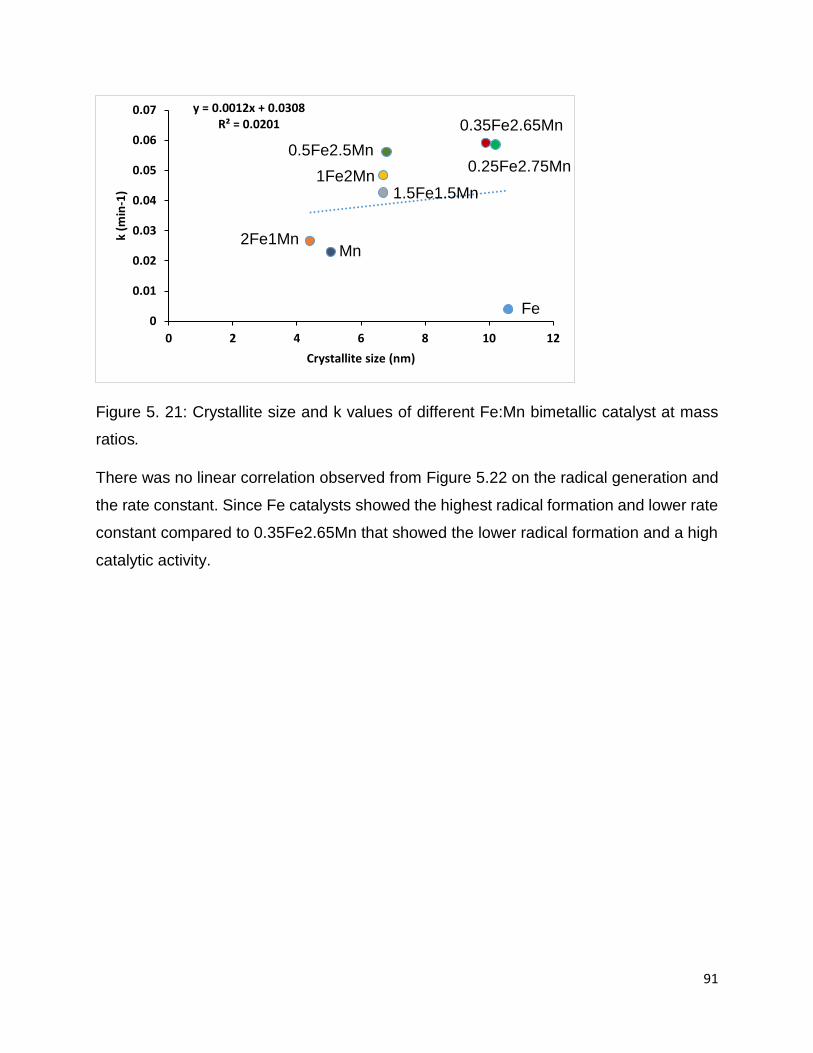
Figure 5. 22: Correlation of the radical determination intensity (at 20 min and at a
wavelength of 409.87 nm) and with the rate constant of the Fenton reaction. .............. 92
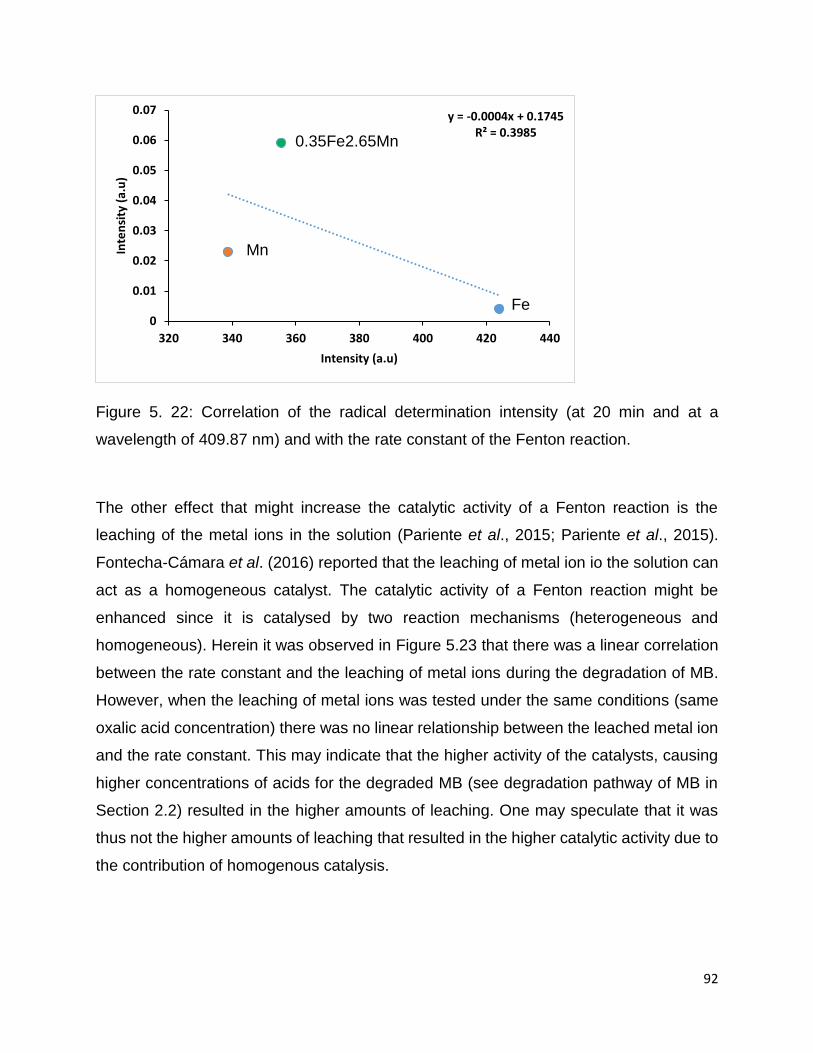
Figure 5. 23: Leaching concentration during the (a) Fenton reaction vs the rate constant
(b) when the catalysts were dispersed in oxalic acid vs the rate constant..................... 93
Figure 5. 24: Correlation between the mass loss and the rate of the reaction. .............. 94
Figure 5. 25: Correlation of the average ORP values with the rate constant of the
Fenton reaction. ............................................................................................................ 94
Page 15
xv
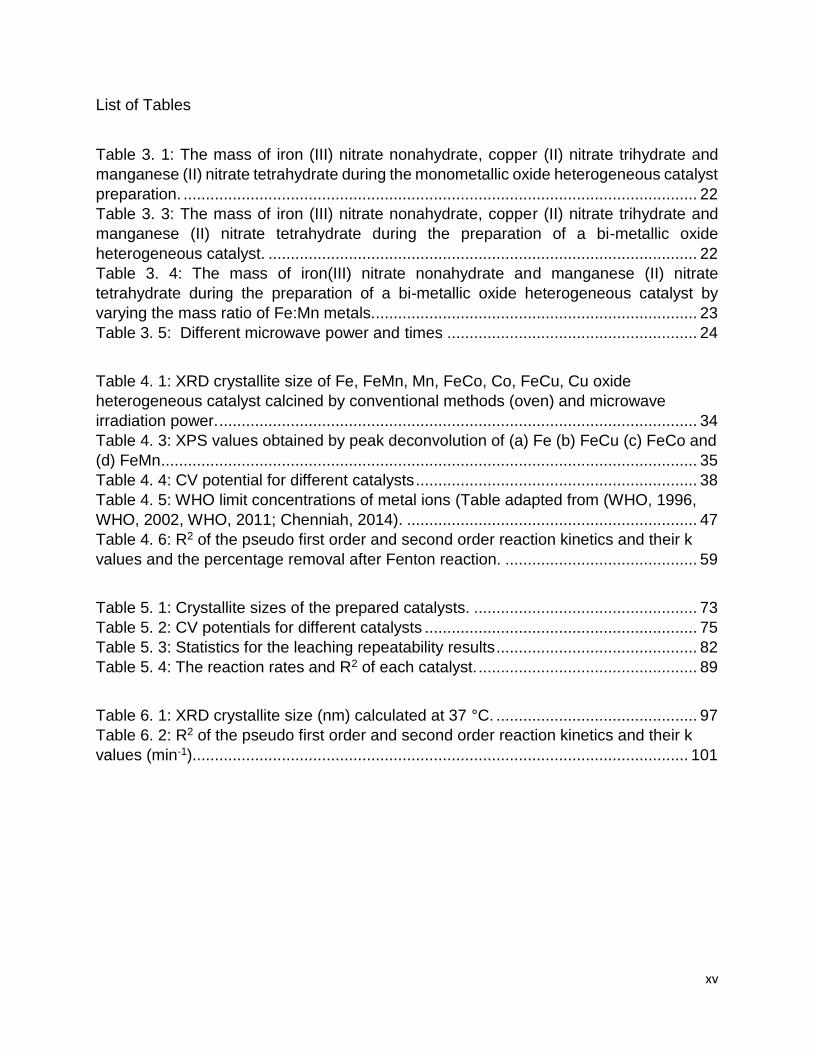
List of Tables
Table 3. 1: The mass of iron (III) nitrate nonahydrate, copper (II) nitrate trihydrate and
manganese (II) nitrate tetrahydrate during the monometallic oxide heterogeneous catalyst
preparation. ................................................................................................................... 22
Table 3. 3: The mass of iron (III) nitrate nonahydrate, copper (II) nitrate trihydrate and
manganese (II) nitrate tetrahydrate during the preparation of a bi-metallic oxide
heterogeneous catalyst. ................................................................................................ 22
Table 3. 4: The mass of iron(III) nitrate nonahydrate and manganese (II) nitrate
tetrahydrate during the preparation of a bi-metallic oxide heterogeneous catalyst by
varying the mass ratio of Fe:Mn metals. ........................................................................ 23
Table 3. 5: Different microwave power and times ........................................................ 24
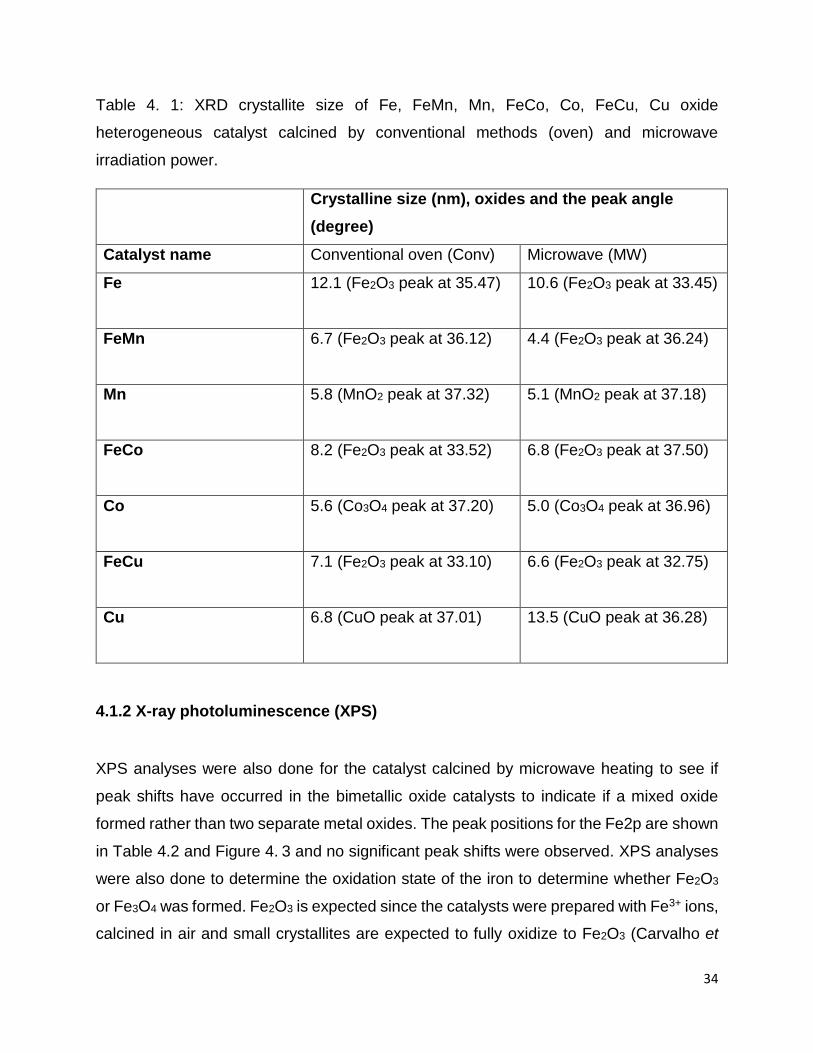
Table 4. 1: XRD crystallite size of Fe, FeMn, Mn, FeCo, Co, FeCu, Cu oxide
heterogeneous catalyst calcined by conventional methods (oven) and microwave
irradiation power. ........................................................................................................... 34
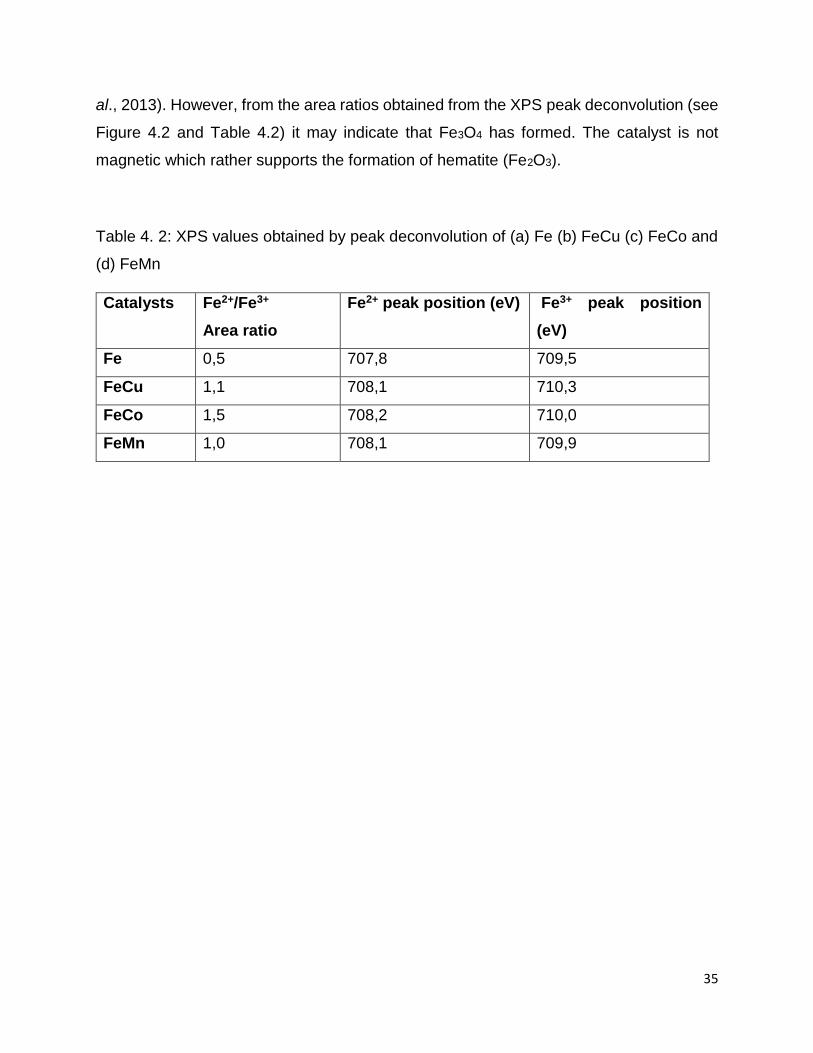
Table 4. 3: XPS values obtained by peak deconvolution of (a) Fe (b) FeCu (c) FeCo and
(d) FeMn ........................................................................................................................ 35
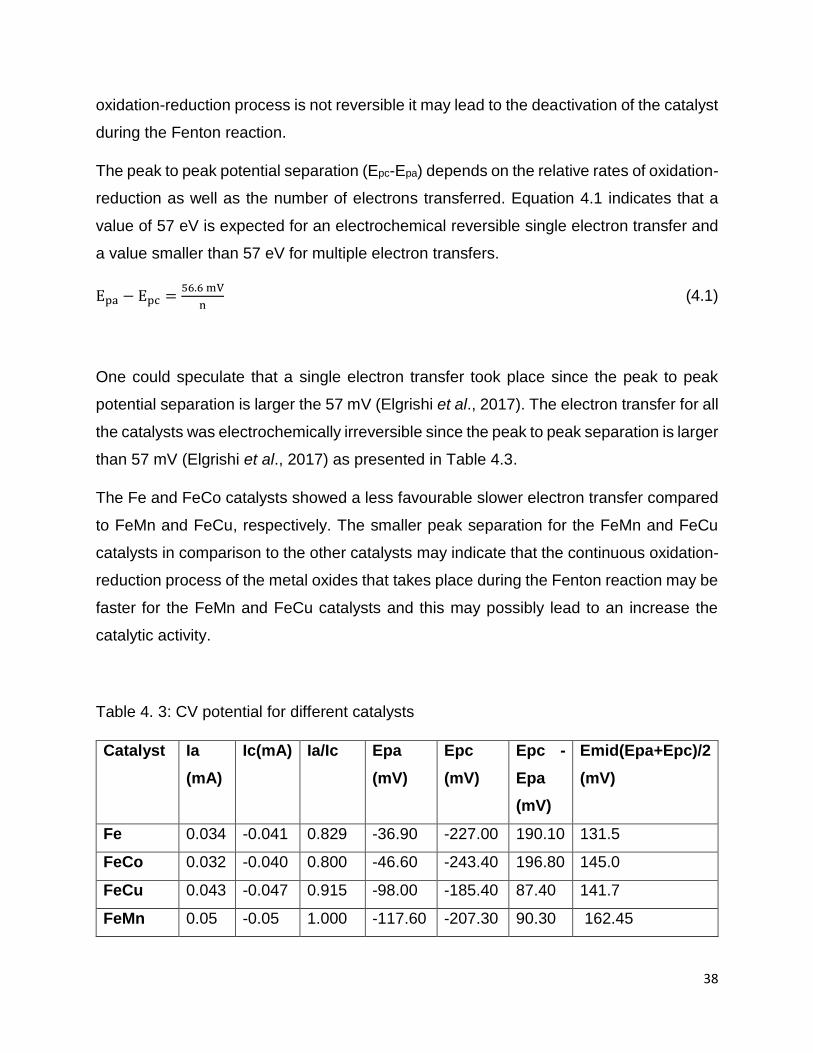
Table 4. 4: CV potential for different catalysts ............................................................... 38
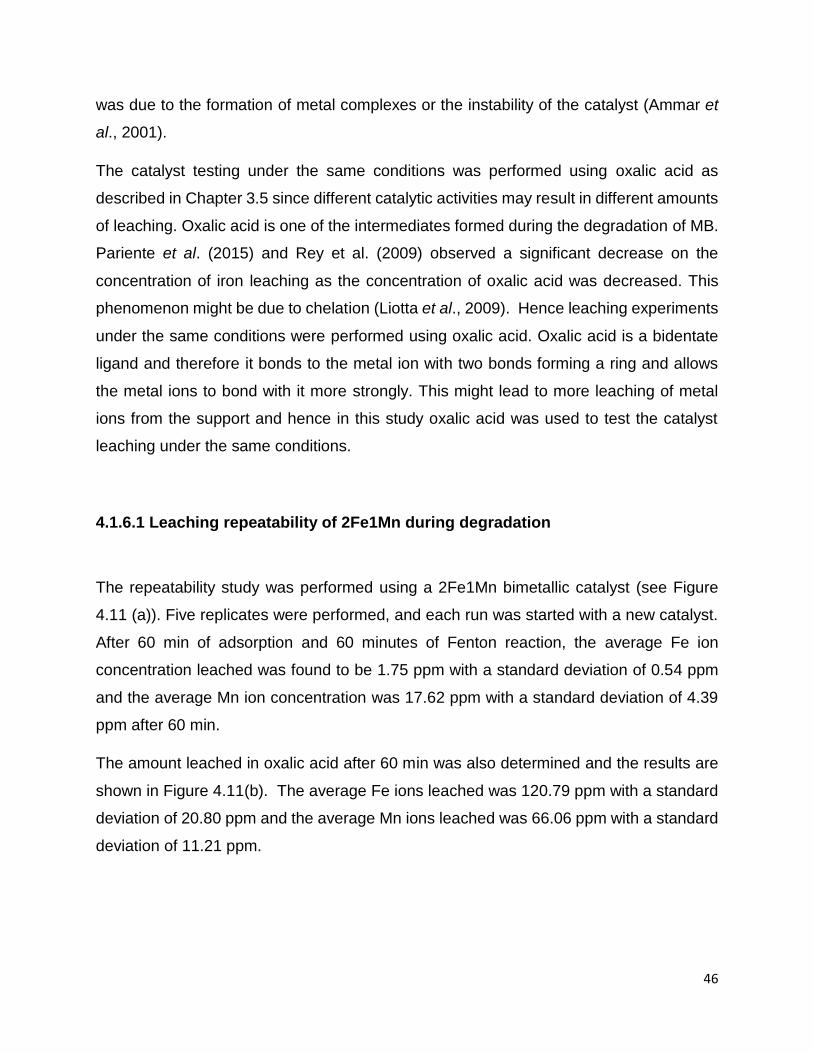
Table 4. 5: WHO limit concentrations of metal ions (Table adapted from (WHO, 1996,
WHO, 2002, WHO, 2011; Chenniah, 2014). ................................................................. 47
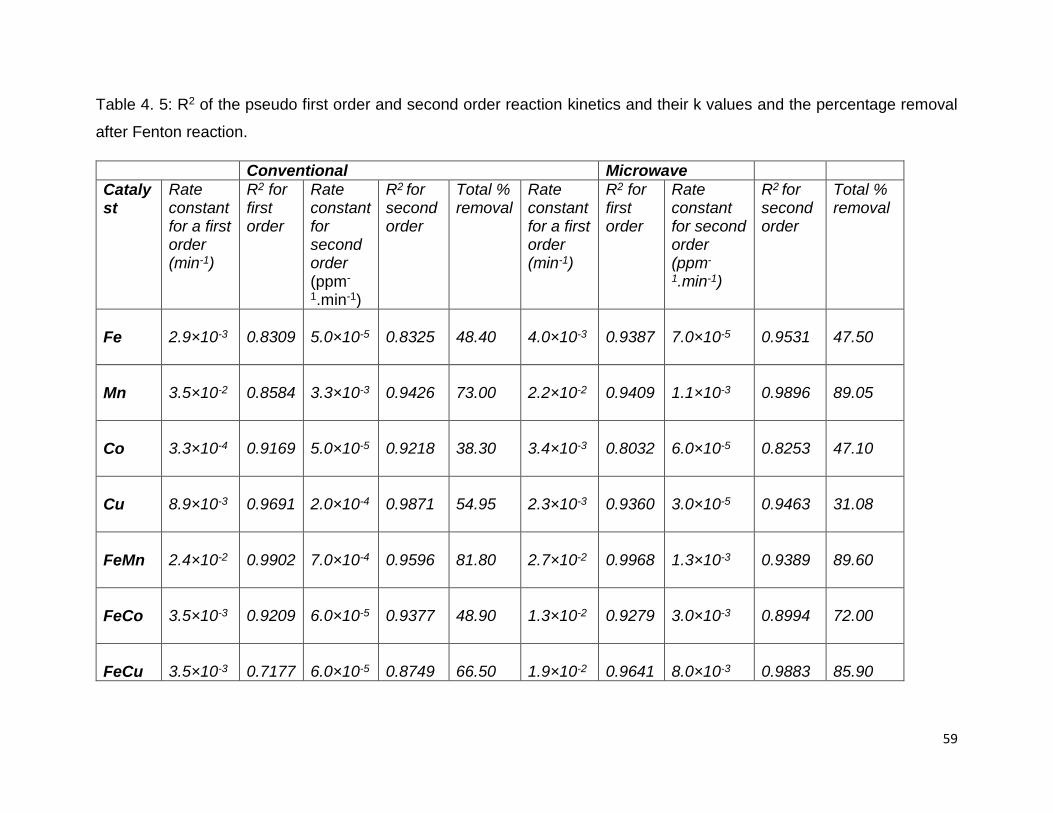
Table 4. 6: R2 of the pseudo first order and second order reaction kinetics and their k
values and the percentage removal after Fenton reaction. ........................................... 59
Table 5. 1: Crystallite sizes of the prepared catalysts. .................................................. 73
Table 5. 2: CV potentials for different catalysts ............................................................. 75
Table 5. 3: Statistics for the leaching repeatability results ............................................. 82
Table 5. 4: The reaction rates and R2 of each catalyst. ................................................. 89
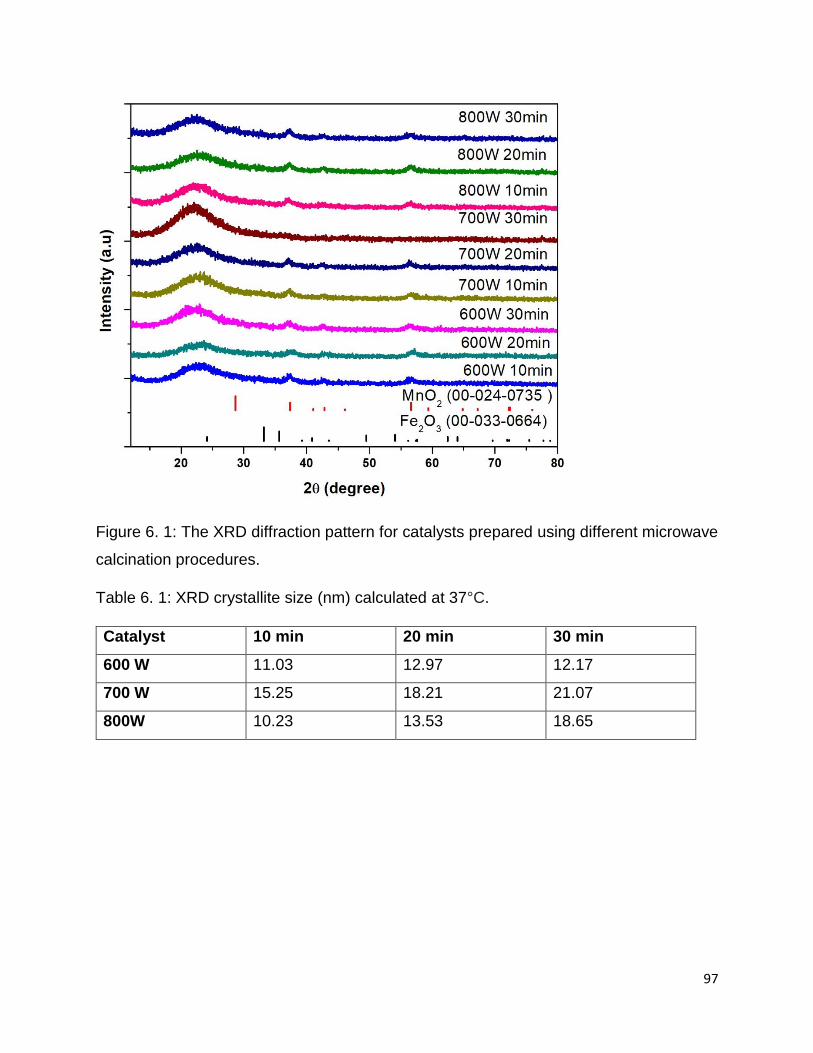
Table 6. 1: XRD crystallite size (nm) calculated at 37 °C. ............................................. 97
Table 6. 2: R2 of the pseudo first order and second order reaction kinetics and their k
values (min-1)............................................................................................................... 101
Page 16
1
Chapter 1: Introduction
1.1. Background
Water pollution is increasingly becoming a problem due to industrialization. The main
water pollutants are inorganic and organic in nature. These pollutants consist of industrial
chemicals, pesticides, dyes, pharmaceuticals and personal care products (Brillas et al.,
2009). This study focussed on the organic pollutant, methylene blue dye that is resistant
to biodegradation due to its aromatic structure. In the past, several methods such as the
advanced oxidation processes (AOPs), biological treatment and physical adsorption
processes have been developed for the removal of such pollutants from wastewater (Rad
et al., 2015). Often these organic pollutants (dyes) are recalcitrant and therefore resist
biological treatment and the physical adsorption process (Elwakeel et al., 2017). AOP’s
have been widely applied as a promising alternative to conventional technologies, such
as activated carbon adsorption and incineration (Fida et al., 2017). AOPs are
distinguished by the production of powerful, highly reactive species and non-selective
oxidants that can operate at near ambient temperatures and pressure. These oxidants
include hydroxyl radicals (∙OH) as a major oxidizing agent (Munoz et al., 2015) and (∙HO2)
as a minor oxidizing agent (Masomboom et al., 2010) may be able to completely degrade
organic pollutants (dyes) into less harmful compound such as CO2 and H2O. The most
commonly utilized AOPs include: photo degradation, heterogeneous photo catalytic
oxidation, photo degradation by simulated sunlight, simulated UV, gold nanoparticles or
rutile titanium (IV) oxide, plasmon photo catalyst, treatment with ozone, peroxide/UV
systems, Fenton and photo-Fenton reaction (ElShafei et al., 2017).
The Fenton reaction was selected as the AOP for this study. The major setback of a
heterogeneous catalyst is due to its lower catalytic activity compared to the homogeneous
Fenton reaction (Costa et al., 2006). In the literature it has been reported that the activity
of a heterogeneous catalyst could be improved by many methods such as support
Page 17
2
modification, promoting the catalyst by incorporating Fe with other transition metals and
improving the preparation methods. This study investigated two methods that could be
utilized in order to increase the catalytic activity of a heterogeneous catalyst: (i) the choice
of calcination during the catalyst’s preparation (Rad et al., 2015) and (ii) the use of a
bimetallic system (Wang et al., 2016).
Problem statement
Water contaminated with organics that resist biodegradation is becoming increasingly
problematic as it has hazardous effects on human health and aquatic environments.
Therefore, the removal of such organic contaminants is of importance. In the past the use
of a single iron oxide catalyst has been used. However, these iron oxide (monometallic)
catalysts suffer from a low catalytic activity. Therefore, an active heterogeneous Fenton
catalyst is required to increase the activity of iron oxide-based Fenton catalysts.
Hypothesis
Based on literature it can be hypothesised that the bimetallic catalyst calcined in the
microwave will yield a more active catalyst than monometallic catalysts and catalysts
prepared using a conventional oven.
Aim
The aim was to increase the Fenton activity of an iron oxide-based Fenton catalyst using
bimetallic oxide catalysts and optimizing the calcination procedure during the catalyst
preparation.
Page 18
3
Objectives
To prepare mono metallic oxide and bimetallic heterogeneous oxide catalysts
To prepare mono metallic oxide heterogeneous catalysts composed of Fe, Co, Cu
and Mn and bimetallic heterogeneous oxide catalysts Fe:M (where M can be Co,
Cu and Mn) supported on silica, calcined by the microwave and conventional
method (oven).
To characterize the catalysts with XRD, Cyclic Voltammetry and XPS.
To determine the effect of monometallic and bimetallic heterogeneous catalysts on
the activity during the Fenton reaction.
To determine the amount of leaching during the degradation of methylene blue
dye.
To determine the amount of hydroxyl radicals formed during degradation studies.
To measure the dominating redox reaction with Oxidation Reduction Potential.
To study the influence of temperature on the activation.
To select the best bimetallic oxide heterogeneous catalyst and vary the Fe to M
content.
To characterize catalysts with XRD and CV.
To determine the effect of Fe to Mn ratio of a bimetallic oxide heterogeneous
catalyst on the activity during the Fenton reaction.
To determine the amount of leaching during the degradation of methylene blue
dye.
To determine the amount of hydroxyl radicals formed during degradation studies.
To measure the dominating redox reaction with Oxidation Reduction Potential.
To prepare the best bimetallic oxide ratio at different microwave power and time.
To characterize catalysts with XRD.
To determine the effect of microwave power and time on the activity during the
Fenton reaction.
Page 19
4
Chapter 2: Literature review
2.1 Water pollution
Water pollution remains a serious problem due to the large amounts of toxic contaminants
that are detected in surface waters including rivers, drinking water and ground water
(Arora et al., 2019). These pollutants consist of industrial chemicals, pesticides, dyes,
pharmaceuticals and personal care products (Brillas et al., 2009). The removal of such
contaminants from surface and ground water is of importance since they have hazardous
effects on human health and the aquatic environment (Arora et al., 2019).
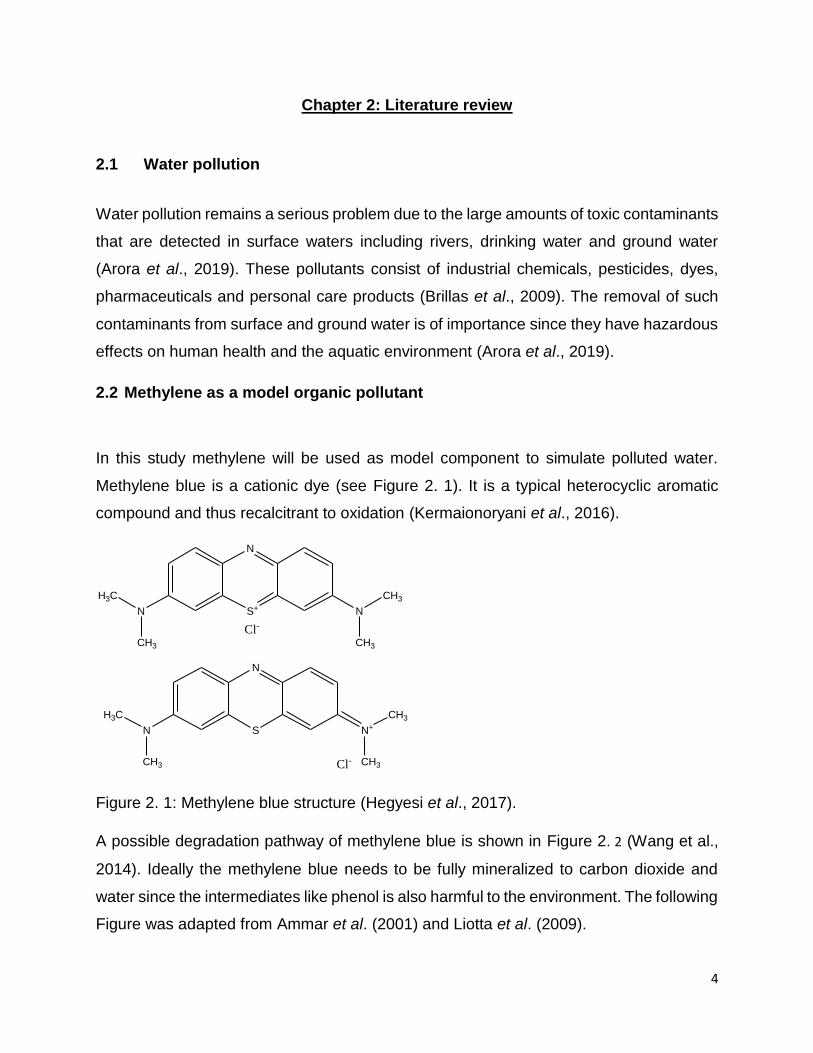
2.2 Methylene as a model organic pollutant
In this study methylene will be used as model component to simulate polluted water.
Methylene blue is a cationic dye (see Figure 2. 1). It is a typical heterocyclic aromatic
compound and thus recalcitrant to oxidation (Kermaionoryani et al., 2016).
S+
N
Cl-
S
N
N+
CH3
CH3
N
CH3
H3C
NN
CH3
H3C
CH3
CH3
Cl-
Figure 2. 1: Methylene blue structure (Hegyesi et al., 2017).
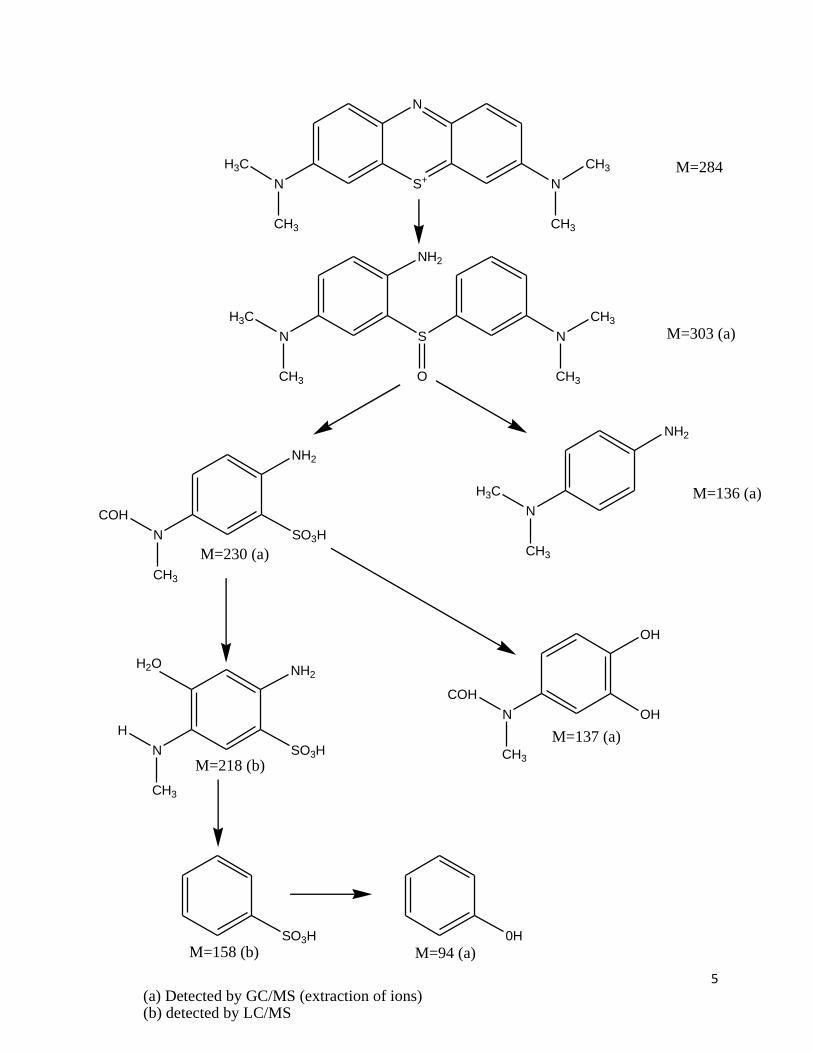
A possible degradation pathway of methylene blue is shown in Figure 2. 2 (Wang et al.,
2014). Ideally the methylene blue needs to be fully mineralized to carbon dioxide and
water since the intermediates like phenol is also harmful to the environment. The following
Figure was adapted from Ammar et al. (2001) and Liotta et al. (2009).
Page 20
5
S+
N
N
CH3
H3C
N
CH3
CH3
S
NH2
N
CH3
CH3
N
CH3
H3C
O
M=303 (a)
N
H3C
CH3
NH2
NH2
SO3HN
COH
CH3
M=136 (a)
M=230 (a)
NH2
SO3HN
N
CH3
OH
OH
COH
CH3
H
M=284
M=218 (b)
M=137 (a)
SO3H 0H
M=94 (a)M=158 (b)
(a) Detected by GC/MS (extraction of ions)(b) detected by LC/MS
H2O
Page 21
6
O
O
O O
O
O
O
O
O
O
O COOH
COOH
O
O
O
O
COOH
COOH
COOH
HOOC COOH
COOH
HOOC-COOH
HCOOH
CO2 + H2O
hydroquinone
phenolcatechol
p-benzoquinone
o-benzoquinone
maleic acid2,5-dioxo-3-hexenedioc acidmuconic acid
oxalic acid acrylic acid
malonic acid
Acetic acid
Figure 2. 2: Degradation pathway of methylene blue (Ammar et al., 2001; Liotta et al.,
2009).
Page 22
7
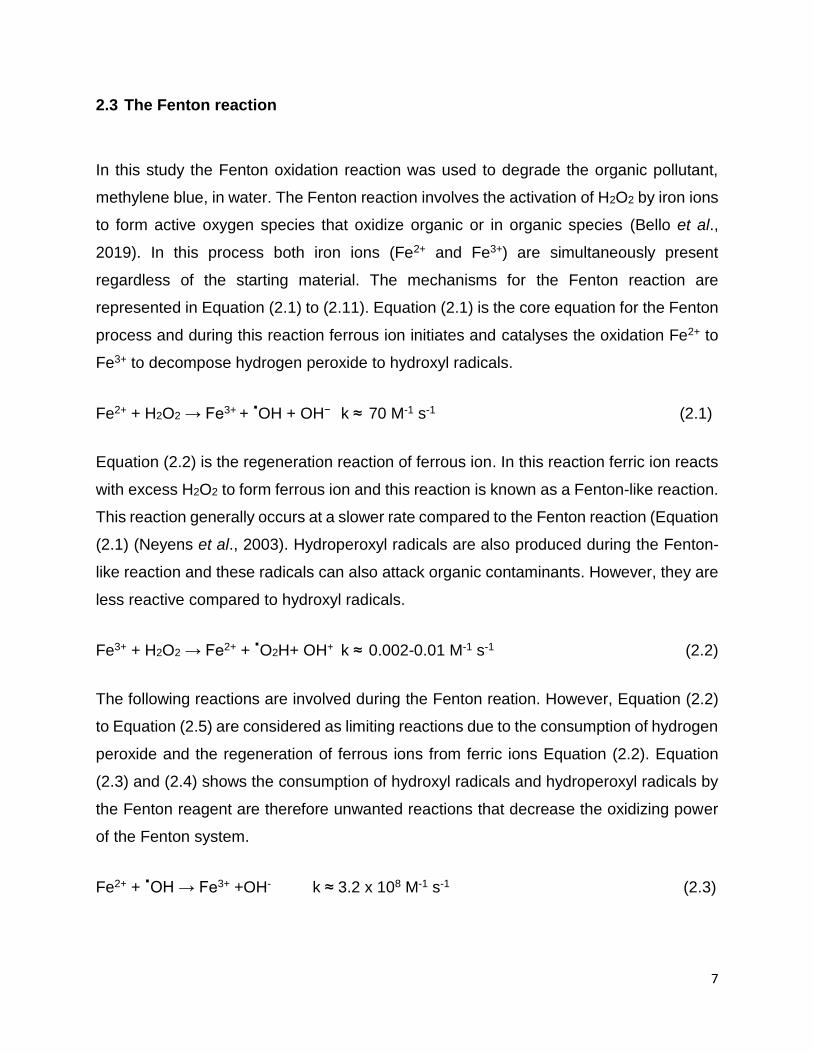
2.3 The Fenton reaction
In this study the Fenton oxidation reaction was used to degrade the organic pollutant,
methylene blue, in water. The Fenton reaction involves the activation of H2O2 by iron ions
to form active oxygen species that oxidize organic or in organic species (Bello et al.,
2019). In this process both iron ions (Fe2+ and Fe3+) are simultaneously present
regardless of the starting material. The mechanisms for the Fenton reaction are
represented in Equation (2.1) to (2.11). Equation (2.1) is the core equation for the Fenton
process and during this reaction ferrous ion initiates and catalyses the oxidation Fe2+ to
Fe3+ to decompose hydrogen peroxide to hydroxyl radicals.
Fe2+ + H2O2 → Fe3+ + .OH + OH− k ≈ 70 M-1 s-1 (2.1)
Equation (2.2) is the regeneration reaction of ferrous ion. In this reaction ferric ion reacts
with excess H2O2 to form ferrous ion and this reaction is known as a Fenton-like reaction.
This reaction generally occurs at a slower rate compared to the Fenton reaction (Equation
(2.1) (Neyens et al., 2003). Hydroperoxyl radicals are also produced during the Fenton-
like reaction and these radicals can also attack organic contaminants. However, they are
less reactive compared to hydroxyl radicals.
Fe3+ + H2O2 → Fe2+ + .O2H+ OH+ k ≈ 0.002-0.01 M-1 s-1 (2.2)
The following reactions are involved during the Fenton reation. However, Equation (2.2)
to Equation (2.5) are considered as limiting reactions due to the consumption of hydrogen
peroxide and the regeneration of ferrous ions from ferric ions Equation (2.2). Equation
(2.3) and (2.4) shows the consumption of hydroxyl radicals and hydroperoxyl radicals by
the Fenton reagent are therefore unwanted reactions that decrease the oxidizing power
of the Fenton system.
Fe2+ + .OH → Fe3+ +OH- k ≈ 3.2 x 10⁸ M-1 s-1 (2.3)
Page 23
8
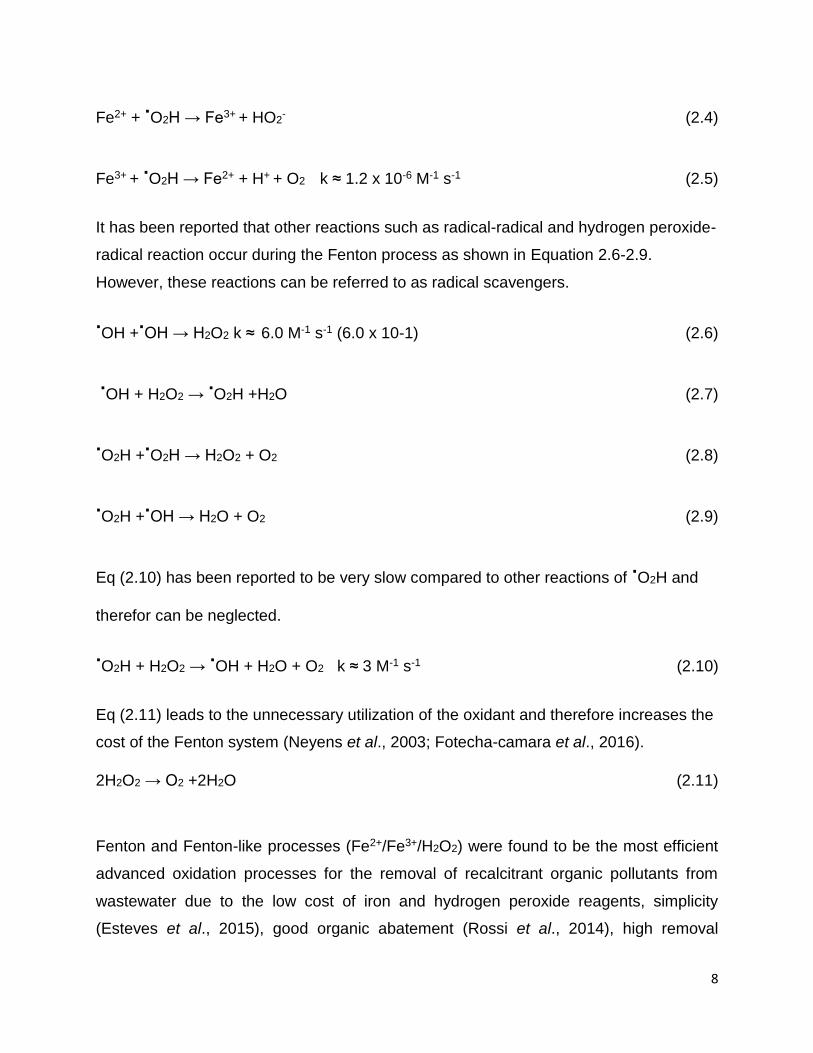
Fe2+ + .O2H → Fe3+ + HO2
- (2.4)
Fe3+ + .O2H → Fe2+ + H+ + O2 k ≈ 1.2 x 10⁻⁶ M-1 s-1 (2.5)
It has been reported that other reactions such as radical-radical and hydrogen peroxide-
radical reaction occur during the Fenton process as shown in Equation 2.6-2.9.
However, these reactions can be referred to as radical scavengers.
.OH +
.OH → H2O2 k ≈ 6.0 M-1 s-1 (6.0 x 10⁻¹) (2.6)
.OH + H2O2 →
.O2H +H2O (2.7)
.O2H +
.O2H → H2O2 + O2 (2.8)
.O2H +
.OH → H2O + O2 (2.9)
Eq (2.10) has been reported to be very slow compared to other reactions of .O2H and
therefor can be neglected.
.O2H + H2O2 →
.OH + H2O + O2 k ≈ 3 M-1 s-1 (2.10)
Eq (2.11) leads to the unnecessary utilization of the oxidant and therefore increases the
cost of the Fenton system (Neyens et al., 2003; Fotecha-camara et al., 2016).
2H2O2 → O2 +2H2O (2.11)
Fenton and Fenton-like processes (Fe2+/Fe3+/H2O2) were found to be the most efficient
advanced oxidation processes for the removal of recalcitrant organic pollutants from
wastewater due to the low cost of iron and hydrogen peroxide reagents, simplicity
(Esteves et al., 2015), good organic abatement (Rossi et al., 2014), high removal
Page 24
9
efficiency within a short period of time and ability to complete the destruction of
contaminants into harmless and environmentally friendlier compounds such as carbon
dioxide and water. However, there are basically two kinds of Fenton processes namely,
classic homogeneous and heterogeneous Fenton’s processes.
The homogeneous Fenton oxidation is one of the most promising and widely used AOPs;
however, this process requires stoichiometric amounts of Fe2+ and large amounts of acid,
usually sulphuric acid since it is more efficient at lower pH values (pH 3) (Costa et al.,
2006). The major setback of using the homogeneous Fenton process is that at higher pH
(around 5-8) the iron catalyst loses its catalytic activity (Lam and Hu. 2013) and the spent
acid (added to wastewater before treatment) and base (added to wastewater after
treatment) increases the cost of the wastewater treatment. The homogeneous Fenton
reaction also results in sludge formation and requires a separation step for the removal
of the remaining metal ions from the treated wastewater and hence increases the cost of
the treatment (Wang et al., 2014). However, a heterogeneous catalyst seems to
overcome the shortcomings of a homogeneous catalyst.
The main advantage of a heterogeneous Fenton-like process is not only the easy
separation of catalyst from the reaction but also the ability to oxidise the acidic, basic and
neutral pollutants discharged to the environment and efficiently degrade the organic
pollutants into CO2 and H2O (Karthikeyan et al., 2016). The use of iron oxides is an
advantage as it reacts at neutral pH with no sludge formation and can be recovered easily
(Pouran et al., 2015). However, the solid iron oxide used presented a weak catalytic
activity. This lower catalytic activity is attributed to the slow regeneration rate of the Fenton
reagent (Fe2+) as shown in Equation (2.2). Furthermore, the Fe content leaches from
catalyst into the solution and is difficult to separate from the treated water. This weakens
the catalytic activity in the long term (Pouran et al., 2015). The development of a catalyst
with a high catalytic activity, good stability, and recyclabilty is thus of considerable
interest.
Catalyst composition and preparation methods
In this study a bimetallic system supported on silica was used to increase the catalytic
activity of a heterogonous catalyst in a Fenton-like reaction. Different metals such as Co,
Page 25
10
Cu, and Mn will be incorporated with iron with the aim of increasing the catalytic activity
of a Fenton reaction. Therein different calcination methods were employed as they also
play a role on the activity of a Fenton reaction.
2.4 The choice of a calcination method during the preparation of the catalyst
It has been reported that the particle size, particle size distribution, crystalline phase,
surface area, dispersion and shape of the particles play an important role in the catalytic
activity of a heterogeneous Fenton-like reaction (Wu et al., 2014, Compas et al., 2015,
Gao et al., 2019). Tremendous efforts are being made toward controlling these properties.
Compas et al. (2015) reported that the heterogeneous catalyst properties depend on the
preparation method. For example, Rad et al. (2015) prepared cobalt ferrite nanoparticles
using both conventional and microwave heating methods. They reported that the
nanoparticles calcined by microwave were more uniform and smaller (16.7 nm) than
those calcined by conventional methods (25.4 nm). This phenomenon was attributed to
heat gradient during the synthesis of the nanoparticles via the microwave that may affect
the homogeneity compared to conventional synthesis. Furthermore, the rapid annealing
using microwave heating resulted in the retention of the morphology, size and shape of
the particles during the densification of the particles, which in turn results in the smaller
size of the nanoparticles with a sharp diameter distribution compared with conventional
method.
Similarly, Reubroycharoen et al. (2007) observed that nanoparticles prepared by
microwave showed smaller particle size compared to those catalysts prepared by
conventional heating. This was attributed to the agglomeration of the cobalt particles
during conventional heating which is due to an outward liquid flow from the inside to the
outside of the support and the concentration gradient of metal oxide on the surface of the
support. This could lead to an accumulation of metal oxide on the outer region of the
support. However, the agglomerated cobalt lowered the dispersion of cobalt and increase
the average particle size of the supported cobalt crystallites. Furthermore, the rapid drying
of the microwave reduced the time for the catalyst preparation. Moreover, the microwave
calcination method resulted in the homogeneous dispersion of the cobalt on the surface
Page 26
11
of the silica support. These results indicated that the short comings of the conventional
calcination methods might be minimized using the microwave.
Furthermore, Reubroycharoen et al. (2007) investigated the effect of optimizing
microwave irradiation time at 700 W microwave power on the catalytic activity of Co
catalyst. They observed that as the microwave irradiation time was increased from 0, 5,
10 and 14 minutes there was an increase in the Fischer-Tropsch catalytic activity. Further
increase on the irradiation time to 45 minutes led to no significant change on the catalytic
activity in the Fischer-Tropsch reaction. The optimum irradiation time was determined to
be 14 minutes.
A comprehensive study comparing activated carbon prepared by conventional and
microwave heating has been done by Huang et al. (2011). This study reported that the
main advantage of microwave heating is the treatment time that can be greatly reduced
and which causes a reduction in the energy consumption and hence reduces the cost of
the preparation. Moreover, the lotus stalks activated carbon prepared by microwave
methods at 700 W for 15 minutes has a higher surface area and a higher total volume
than that obtained by the conventional method. However, the activated carbon prepared
by conventional heating acted as a better adsorbent for the removal of oxyltetracycline
(OTC) from aqueous solution. This fact was attributed to surface characteristics of the
two carbons.
The microwave power and irradiation time play a major role on the uniform dispersion of
the particles, particle size and shape. Mousavi et al. (2015) studied the effect of different
microwave power and irradiation time on the properties of zinc chromite nanostructures.
Firstly, they kept the microwave power constant at 600 W. They observed that as they
increased the irradiation time from 4 to 6 minutes, uniform particles and separated
particles were formed due to sufficient time for the reaction. They also reported that further
increase of irradiation time to 8 minutes led to an agglomeration of the particles. This was
attributed to an increase in the kinetic energy of the prepared particles as this would
increase the collision of the particles leading to agglomeration.
Parida & Parija. (2006) observed similar observations on their preparation of ZnO
particles by varying the microwave calcination irradiation time. The photo catalytic
Page 27
12
degradation percentage increased from 60 to 88% as the calcination irradiation time
during the catalyst preparation was increased from 5 to 15 minutes. This was attributed
to the small particle size and the lager surface area of the catalyst prepared using 15
minutes of calcination. However, a further increase in the calcination irradiation time
during preparation led to a decrease in the percentage removal of the pollutant and thus
a decrease in the catalytic activity. This was attributed to the sintering process as the
irradiation time as increased.
Mousavi et al. (2015) also studied the effect of different microwave power (600 750 and
900 W) at 6 min on the properties of zinc chromite nanostructures. They observed that a
further increase in the microwave power leads to larger particle sizes in the catalysts
which is due to the agglomeration of the particles at higher microwave power. The
optimum microwave power was 600 W 6 minutes.
Based on the literature reviewed above, it has been observed that all the studies showed
different optimal irradiation time and power. This might be due to the different methods
and reactions employed in these studies. The metal loading, metal precursor and the
supporting material may also cause variation in the optimum microwave parameters. The
calcination method needs to be optimized for a particular catalyst and reaction.
2.5 Bi-metallic oxide Fenton catalysts
The main limitation of the heterogeneous Fenton process is due to the lower rate of
reduction of Fe3+ to Fe2+ and this reduces the overall rate of the ●OH production (as shown
in the reaction (i) and (ii)) which in turn lowers the catalytic activity of a Fenton system
(Esteves et al., 2015). Recently bimetallic systems seems to overcome the drawbacks
faced by monometallic heterogeneous Fenton catalyst oxide (Han et al., 2011). A
bimetallic system oxide heterogeneous catalyst is the incorporation of Fe with other
transition metal such as Cu, Mn, Cr, Co etc. (Pouran et al,. 2015). Bimetallic oxide
catalysts exhibit synergetic properties and Wang et al. (2014) attributed this phenomenon
to the two pairs of redox metals incorporated together. Other properties that a bimetallic
catalysts exhibit includes the metal dispersion and interfacial structure which in turn
enhance the degeneration rate of contaminants (Luo et al., 2015). Figure 2. presents the
Page 28
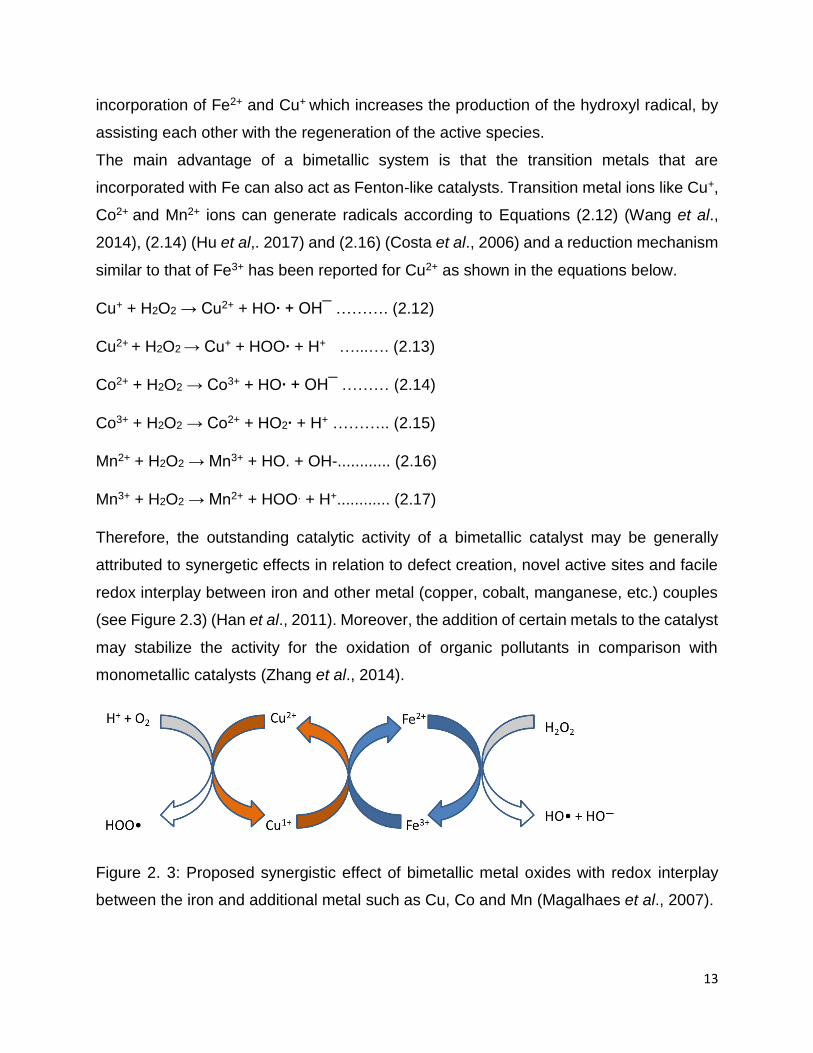
13
incorporation of Fe2+ and Cu+ which increases the production of the hydroxyl radical, by
assisting each other with the regeneration of the active species.
The main advantage of a bimetallic system is that the transition metals that are
incorporated with Fe can also act as Fenton-like catalysts. Transition metal ions like Cu+,
Co2+ and Mn2+ ions can generate radicals according to Equations (2.12) (Wang et al.,
2014), (2.14) (Hu et al,. 2017) and (2.16) (Costa et al., 2006) and a reduction mechanism
similar to that of Fe3+ has been reported for Cu2+ as shown in the equations below.
Cu+ + H2O2 → Cu2+ + HO∙ + OH¯ ………. (2.12)
Cu2+ + H2O2 → Cu+ + HOO∙ + H+ …...…. (2.13)
Co2+ + H2O2 → Co3+ + HO∙ + OH¯ ……… (2.14)
Co3+ + H2O2 → Co2+ + HO2∙ + H+ ……….. (2.15)
Mn2+ + H2O2 → Mn3+ + HO. + OH-............ (2.16)
Mn3+ + H2O2 → Mn2+ + HOO. + H+............ (2.17)
Therefore, the outstanding catalytic activity of a bimetallic catalyst may be generally
attributed to synergetic effects in relation to defect creation, novel active sites and facile
redox interplay between iron and other metal (copper, cobalt, manganese, etc.) couples
(see Figure 2.3) (Han et al., 2011). Moreover, the addition of certain metals to the catalyst
may stabilize the activity for the oxidation of organic pollutants in comparison with
monometallic catalysts (Zhang et al., 2014).
Figure 2. 3: Proposed synergistic effect of bimetallic metal oxides with redox interplay
between the iron and additional metal such as Cu, Co and Mn (Magalhaes et al., 2007).
Page 29
14
The proposed equations for the interaction between couples (Mn-Fe and Co-Fe) of a
bimetallic oxide catalyst are represented below (Wang et al., 2015; Wang et al., 2016).
Fe2+ + Co3+ → Fe3+ + Co2+ (2.18)
Fe2+ + Mn3+ → Fe3+ + Mn2+ (2.19)
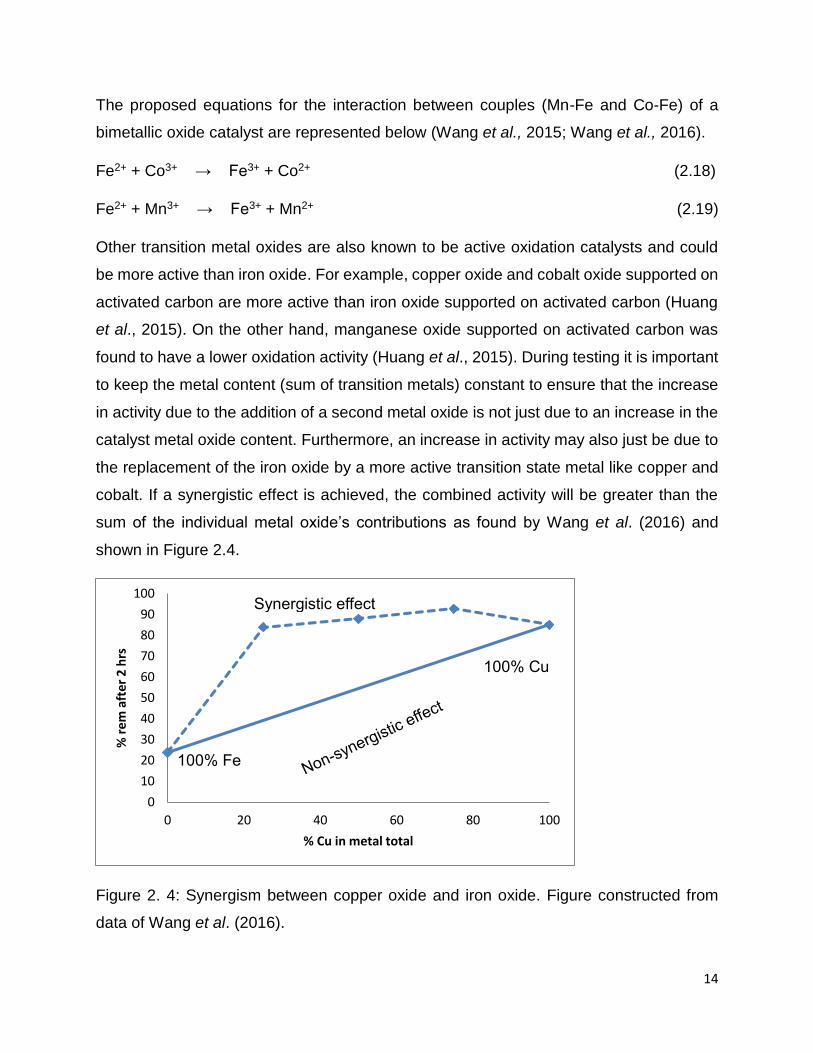
Other transition metal oxides are also known to be active oxidation catalysts and could
be more active than iron oxide. For example, copper oxide and cobalt oxide supported on
activated carbon are more active than iron oxide supported on activated carbon (Huang
et al., 2015). On the other hand, manganese oxide supported on activated carbon was
found to have a lower oxidation activity (Huang et al., 2015). During testing it is important
to keep the metal content (sum of transition metals) constant to ensure that the increase
in activity due to the addition of a second metal oxide is not just due to an increase in the
catalyst metal oxide content. Furthermore, an increase in activity may also just be due to
the replacement of the iron oxide by a more active transition state metal like copper and
cobalt. If a synergistic effect is achieved, the combined activity will be greater than the
sum of the individual metal oxide’s contributions as found by Wang et al. (2016) and
shown in Figure 2.4.
Figure 2. 4: Synergism between copper oxide and iron oxide. Figure constructed from
data of Wang et al. (2016).
0
10
20
30
40
50
60
70
80
90
100
0 20 40 60 80 100
% r
em a
fter
2 h
rs
% Cu in metal total
Synergistic effect
100% Cu
100% Fe
Page 30
15
Examples of mixed oxides used as oxidation catalysts will now be briefly discussed to
demonstrate the advantages of using bi-metallic oxide catalysts.
Magalhaes et al. (2007 showed that the introduction of Cr-containing magnetite’s Fe3-
xCrxO4 showed a significant increase in the activity for degradation of a dye. The higher
activity was attributed to more efficient regeneration of active Fenton species Fe2+ by a
coupling of the redox pairs Fe3+/Fe2+ and Cr3+/Cr2+. On the other hand, they further
explained Fe3-xCrxO4 does not directly promote the Fenton reaction in a direct mode but
instead is involved in the H2O2 decomposition. XPS also showed that whenever Cr2+ is
formed during the Fenton reaction it is rapidly converted back to Cr3+, Cr4+ and Cr6+.
The incorporation of copper into the structure of akageneite [iron oxide hydroxide or
chloride mineral with formula Fe3+O(OH,Cl)] increased the catalytic activity of the catalyst
since higher methylene blue discoloration and removal of organic carbon was observed
dos Santos et al. (2016). They explained that the copper reduced by hydrogen peroxide
can act as an electron donor reducing the ferric to ferrous ions that are more active in the
Fenton reaction. Furthermore, copper, when Cu+ is formed, can promote the formation of
hydroxyl radicals (highly oxidant species) in the Cupro-Fenton reaction.
Esteves et al. (2015) used c a cobalt-iron oxide bimetallic catalyst in their study. They
prepared Fe3-XCoxO4 nanoparticles that reacted with the peroxide to produce highly
reactive and non-selective hydroxyl radicals capable of oxidizing any organic matter
present in an aqueous solution. They found that the use of Fe3-XCoXO4/H2O2 is very
effective for the oxidation of organic matter. They also reported that it is easy to recover
and reuse the catalyst for several reaction cycles without losing its catalytic activity and
since it has magnetic properties one can just apply an external magnet for separating the
catalyst from the water.
Iron-copper bimetallic nanoparticles embedded within ordered mesoporous carbon
composite catalyst (CuFe-MC), were synthesized by Luo et al. (2015) for the
heterogeneous Fenton-like process. A high mineralization efficiency was observed for
phenol, benzoic acid, bisphenol-A, 2,4,6,-trichlorophenol, imidacloprid, ketoprofen,
methylene blue and methyl orange when CuFe-MC was utilized. CuFe-MC has higher
catalytic efficiency than homogeneous Fenton reagent (Fe2+) for the removal of total
Page 31
16
organic carbon (TOC) of contaminants under the same reaction conditions. In this work
CuFe-MC’s high efficiency (94%) for the removal of TOC of imidacloprid (100 mgL-1) was
achieved in 12 hours, while only 38% was achieved by the homogeneous (Fe2+) Fenton
catalyst. This remarkable performance of the heterogeneous Fenton-like catalyst was
attributed to (i) the larger surface area, which plays a major role in the adsorption of
organic contaminants and the mesostructure that favours rapid diffusion of reactants and
products, (ii) the synergetic effect of iron and copper favours the redox cycles of Fe3+/Fe2+,
Cu2+/Cu+, enhancing the catalytic activity of the composite catalyst, (iii) the mesoporous
carbon used as a supporting material can also activate the peroxide to form hydroxyl
radicals. Furthermore, the bimetallic (CuFe-silica) catalysts were more active than the
monometallic (Fe-silica) catalysts (Wang et al., 2015).
Cu-Fe/SBA-15 (SBA-15 silica support) appeared to be an excellent bimetallic Fenton-like
catalyst outperforming monometallic catalysts (Cu/SBA-15 Fe/SBA-15), as observed by
Karthikeyan et al. (2016). They synthesized Cu-Fe bimetallic Fenton-like heterogeneous
catalysts supported on mesoporous silica 15 (SBA-15) that was used to degrade N, N-
diethyl-p-phenyl diamine (DPD) in water. Oxidative degradation of DPD at 100 M/L
occurred over Cu-Fe/SBA-15 with 83% degradation within 120 min and the initial rate of
degradation was first order in DPD for concentrations ranging from 100-500 mg/L. They
also tested a physical mixture of monometallic catalysts (Cu/SBA-15 Fe/SBA-15) and
found that the copper and iron need to be in direct contact (together on the same support)
to achieve the synergistic effect.
Costa et al. (2003) studied the decomposition of peroxide in the presence of the pure
spinel Co3O4 and a solution of CoCl2 and compared it to that of cobalt substituted
magnetite. They discovered that the cobalt substituted magnetite was much more active
(with a zero order reaction rate constant (k) of 0.230 mmol min-1) than the pure iron oxide,
even though Co3O4 showed a slightly higher catalytic activity of (k = 0.044 mmol min-1)
compared to that of Fe3O4 (with k = 0.006 mmol min-1).
Costa et al. (2006) studied the addition of nickel oxide, manganese oxide and cobalt oxide
to magnetite on the oxidation rate of methylene blue. The addition of nickel oxide to the
magnetite did not increase the catalytic activity as was in the case with the addition of
Page 32
17
manganese oxide and cobalt oxide. The results showed only about 10% of colour removal
after 50 min when the bimetallic Ni-Fe oxide catalyst was used in comparison to full
decolorization after 10 minutes when either a Co-Fe oxide or Mn-Fe oxide catalyst was
used. This low activity was attributed to the fact that nickel is only stable as Ni2+ species
and other oxidation states like Ni3+ are not stable. As Ni2+ only replaces mainly Fe2+ in the
magnetite structure the reaction is inhibited since Fe2+ is responsible for the initiation step.
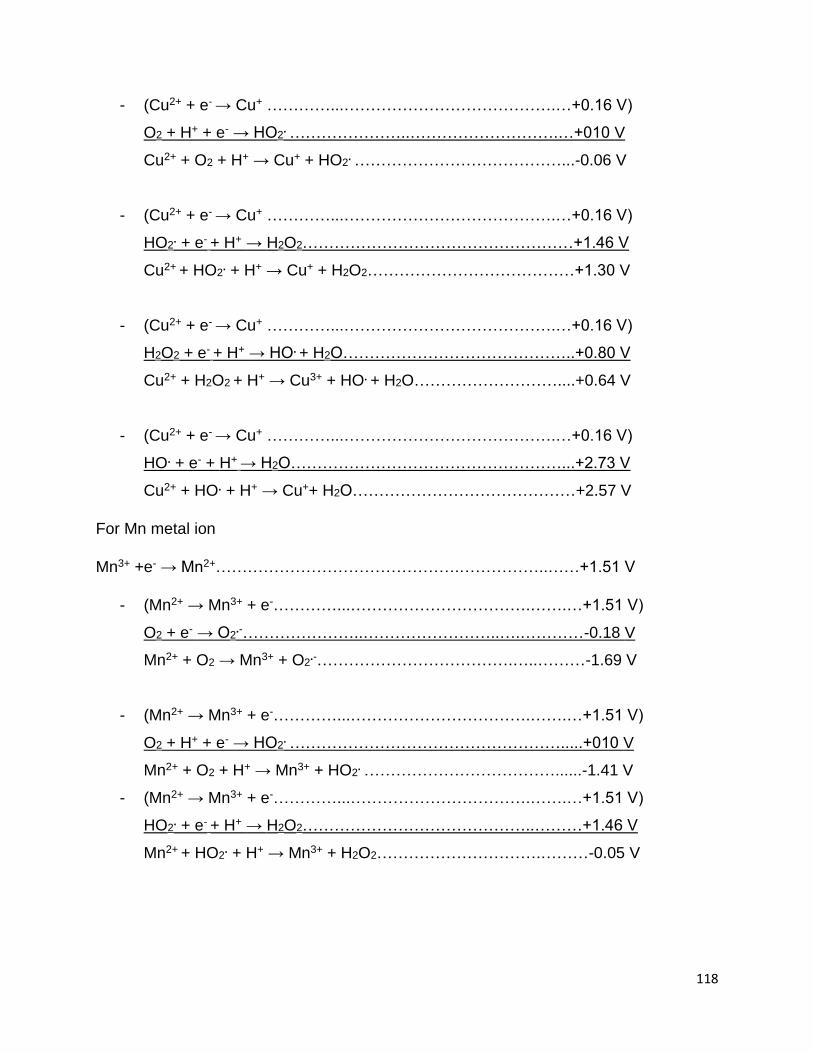
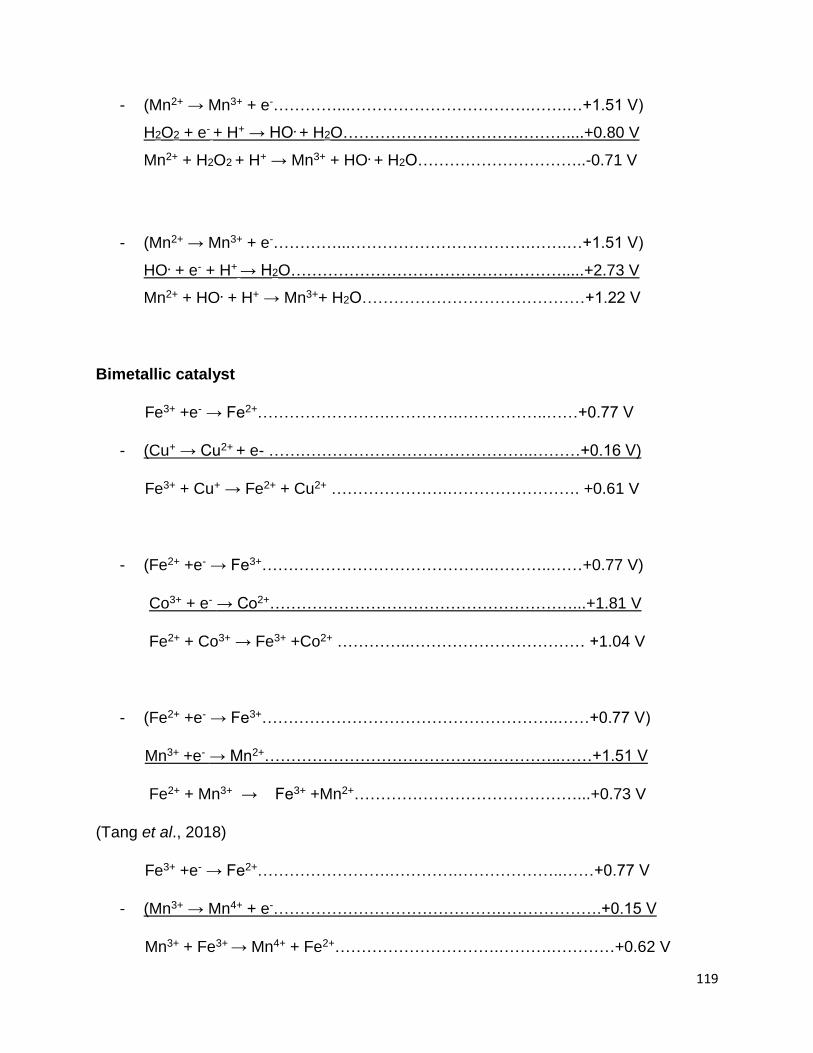
Tang et al. (2018) reported on the synthesis of magnetic separable MnO2/Fe3O4
supported on silica nanofibers for the degradation of Acid red 73. They observed that
MnO2/Fe3O4 nanofibers showed the highest catalytic activity for the removal of Acid red
73 than MnO2, Fe3O4 and MnO2+Fe3O4. This high activity was attributed to the enhanced
redox interplay between Fe(III)/Fe(II) (0.77 V) and Mn(IV)/Mn(III) (0.15 V). This study
further reported that Mn(III) assisted the reduction of Fe(III) to Fe(II), since the potential
of Mn(IV)/Mn(III) was lower than that of Fe(III)/Fe(II). The reaction mechanism is shown
in Appendix D.
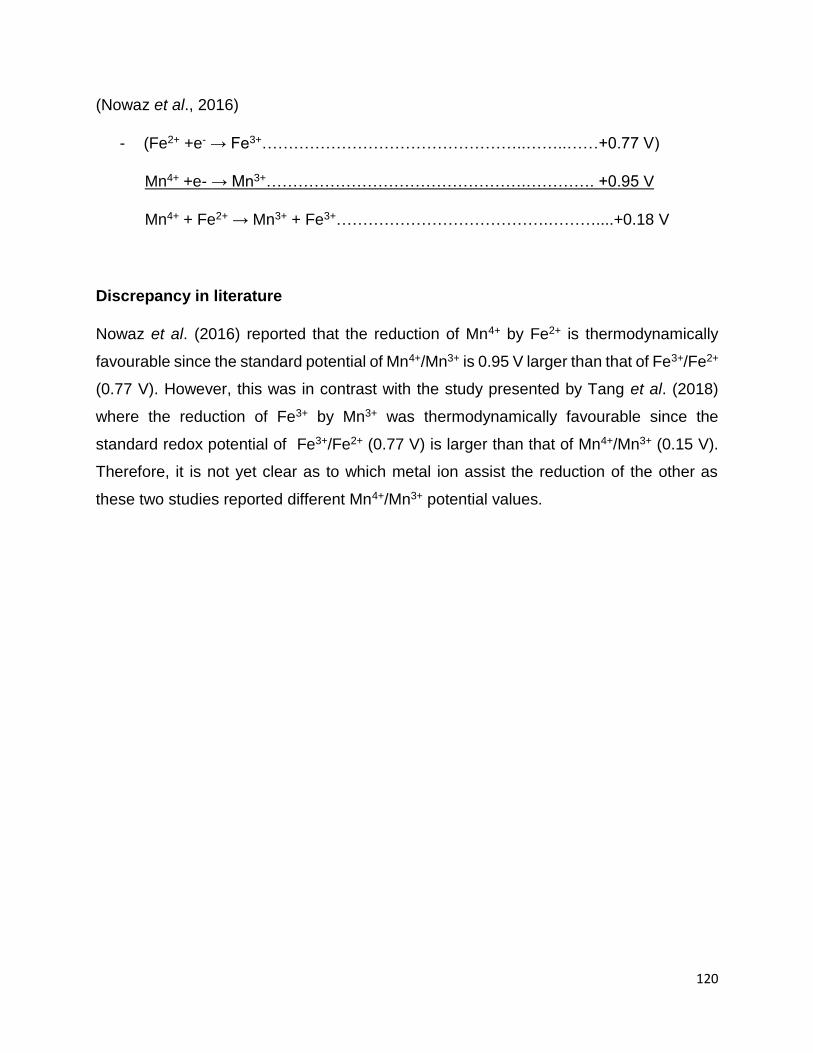
In contrast to the study conducted by Nawaz et al. (2016), this study reported a different
potential value of Mn(IV)/Mn(III) that was (0.95 V) higher than that of Fe(III)/Fe(II) (0.77
V) indicating that the reduction of Mn(IV) by Fe(II) was dynamically favourable. The
reaction mechanism is shown in Appendix D.
In the literature of a bimetallic system it was observed that the total percentage removal
and the rate of the reaction was different for all the bimetallic catalysts used (Costa et al.,
2003; Pouran et al., 2015; Wang et al., 2016). This might be due to several reasons,
namely, the method of preparation of the catalyst, supporting material, concentration of
the pollutant, the nature of the pollutant used, pH used during the experimental and
preparation method and the AOP’s method used. Wang et al. (2016) indicated that the
total metal content present in the catalyst might also affect the catalytic activity of the
Fenton reaction. Lastly, the Fe/M ratio might also have an impact on the activity of a
bimetallic catalyst. Therefore, it is important to study the activity of these monometallic
and bimetallic catalysts under the same conditions and compare their activity.
Herein we report on the preparation of a 10% metal content monometallic (Fe, Mn, Co
and Cu) and bimetallic (FeCo, FeCu and FeMn) catalyst supported on silica via the
Page 33
18
incipient wetness impregnation method. The bimetallic catalysts were prepared by
replacing a third of the Fe with a different metal, M (M= Mn, Co and Cu). The catalysts
were calcined either by microwave power or conventional oven. The activity of these
catalysts was tested during the degradation of MB.
Page 34
19
Chapter 3: Methodology
In this chapter, various chemicals and materials utilized during this study are listed.
Experimental methods for the catalyst preparation, characterization techniques and
Fenton reaction (degradation of MB) are discussed. Other methods that were used during
this study are also discussed. These methods include those for the leaching test, hydroxyl
radical determination, Oxidation Reduction Potentials (ORP) and mass loss studies. The
analytical instruments used in during this study and their methods are also discussed in
this chapter. These instruments include the UV-vis, AAS and photoluminescence
spectrophotometers.
3.1 Materials
Davisil Grade 643 Silica, 99 % with a pore volume of 1.15 cm3/g was purchased from
Sigma-Aldrich and was used as supporting material for the heterogeneous oxide
catalysts. Iron(III) nitrate nonahydrate (98 % Fe(NO3)3.9H2O), copper(II) nitrate trihydrate
(99 % Cu(NO3)2.3H2O), manganese (II) nitrate tetrahydrate (97 % Mn(NO3)2.4H2O),
terephthalic acid (98%) and Methylene blue dye (97 % C16H18ClN3S) were sourced from
Sigma-Aldrich. Cobalt (II) nitrate hexahydrate (99% Co(NO3)2.6H2O) and oxalic acid
anhydrous (99% C2H2O4) were obtained from Fluka. Hydrogen peroxide (in water, 30 %
was purchased from Labo-Chem).
3.2 Catalyst preparation
In this part catalyst preparation will be discussed, Section 3.2.1 will deal with the
preparation of different catalysts, namely Fe, Mn, Cu, Co, 2Fe1Mn, 2Fe1Cu and 2Fe1Co
supported on silica and calcined by the conventional oven method (Conv) and microwave
irradiation power (MW). The bimetallic catalyst with highest catalytic activity for the
Page 35
20
degradation of methylene blue was selected to optimize the relative mass ratios of the
two metals in the catalyst keeping the total metal content constant as explained in Section
3.2.1.3. The 2Fe1Mn catalyst showed the highest catalytic activity for MB dye
degradation. Lastly, the ratio with highest catalytic activity was selected and prepared by
varying the microwave power and time, details are in Section 3.2.1.4. In this case,
0,35Fe2,65Mn catalyst showed the highest activity during the Fenton reaction and was
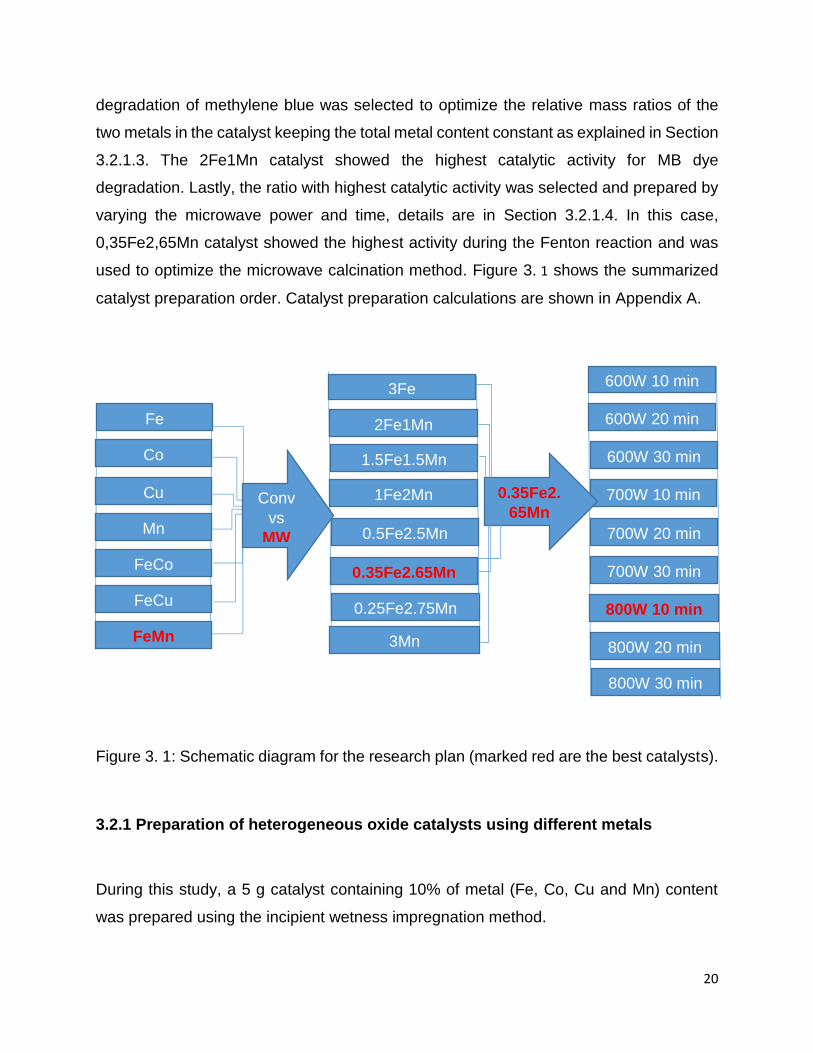
used to optimize the microwave calcination method. Figure 3. 1 shows the summarized
catalyst preparation order. Catalyst preparation calculations are shown in Appendix A.
Figure 3. 1: Schematic diagram for the research plan (marked red are the best catalysts).
3.2.1 Preparation of heterogeneous oxide catalysts using different metals
During this study, a 5 g catalyst containing 10% of metal (Fe, Co, Cu and Mn) content
was prepared using the incipient wetness impregnation method.
Fe
Co
Cu
Mn
FeCo
FeCu
FeMn
Conv
vs
MW
3Fe
2Fe1Mn
1.5Fe1.5Mn
1Fe2Mn
0.5Fe2.5Mn
0.35Fe2.65Mn
0.25Fe2.75Mn
3Mn
600W 10 min
600W 20 min
600W 30 min
700W 10 min
700W 20 min
700W 30 min
800W 10 min
800W 20 min
800W 30 min
0.35Fe2.
65Mn
Page 36
21
3.2.1.1 Preparation of monometallic oxide heterogeneous catalysts
During this study, monometallic oxide heterogeneous catalysts were prepared by
dissolving iron (III) nitrate nonahydrate in a 250 mL beaker containing approximately 5
mL of deionized water as shown in Table 3. 1. Weighed mass of silica was added into the
same beaker (Table 3. 1 illustrates the actual mass weighed). The volume of water used
to dissolve the added corresponds to the pore volume of the silica support. The semi-dry
mixture was then divided into two, one half was calcined by the conventional oven at 250
0C for 2 hours (the conventional oven took approximately 5 min to reach 2500C.
Therefore, the mixture was in the oven for 2 H 5 min) The other half was calcined by
microwave irradiation power at 800 W for 10 min. The same procedure was repeated for
the Co Cu and Mn monometallic oxide catalysts.
3.2.1.2 Preparation of a bimetallic oxide heterogeneous oxide catalyst
During this study a bimetallic oxide catalyst was prepared by replacing a third of the iron
in Fe3O4 with another metal, M (where M can be Co or Cu or Mn) to produce MFe2O4.
These three bimetallic oxide catalysts were characterized and tested in methylene blue
degradation.
In this study different masses, (see Table 3. 2) for the actual mass weighed) of iron (III)
nitrate nonahydrate, copper (II) nitrate hexahydrate, manganese (II) nitrate hexahydrate
and cobalt (III) nitrate hexahydrate were weighed and mixed into different 250 mL beakers
with 5 mL of deionized water. About 4.3 g (see Table 3. 2) of silica support was weighed
and added to the metal nitrate solution and stirred with a glass stirring rod. After mixing
the catalysts were calcined by the oven at 250°C for 2 hrs. The same procedure for
catalyst preparation was repeated for microwave calcination at 800 W for 10 minutes.
Page 37
22
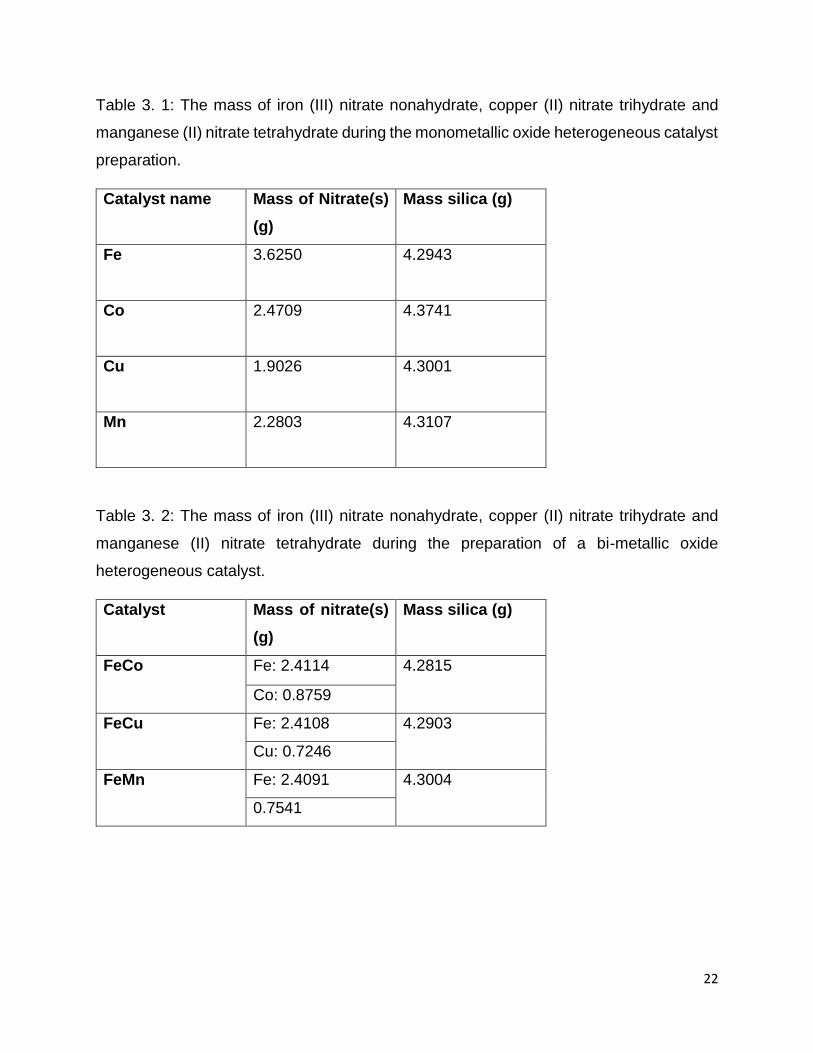
Table 3. 1: The mass of iron (III) nitrate nonahydrate, copper (II) nitrate trihydrate and
manganese (II) nitrate tetrahydrate during the monometallic oxide heterogeneous catalyst
preparation.
Catalyst name Mass of Nitrate(s)
(g)
Mass silica (g)
Fe
3.6250 4.2943
Co
2.4709 4.3741
Cu
1.9026 4.3001
Mn
2.2803 4.3107
Table 3. 2: The mass of iron (III) nitrate nonahydrate, copper (II) nitrate trihydrate and
manganese (II) nitrate tetrahydrate during the preparation of a bi-metallic oxide
heterogeneous catalyst.
Catalyst Mass of nitrate(s)
(g)
Mass silica (g)
FeCo Fe: 2.4114 4.2815
Co: 0.8759
FeCu Fe: 2.4108 4.2903
Cu: 0.7246
FeMn Fe: 2.4091 4.3004
0.7541
Page 38
23
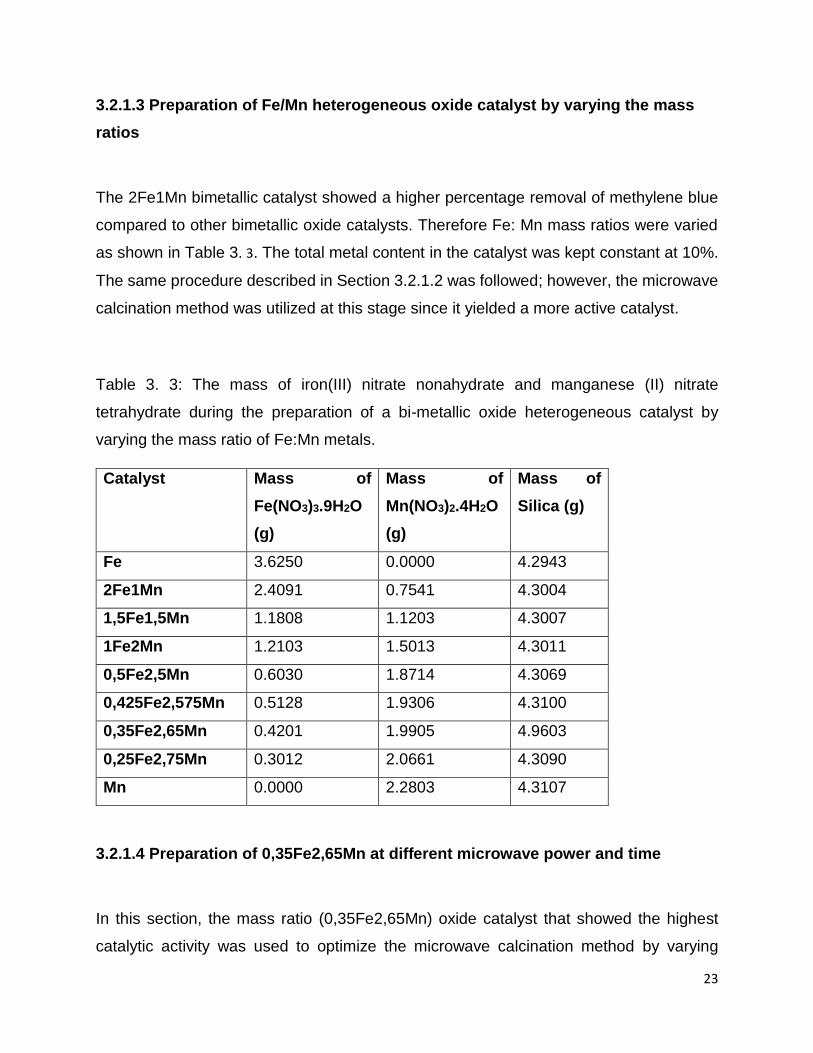
3.2.1.3 Preparation of Fe/Mn heterogeneous oxide catalyst by varying the mass
ratios
The 2Fe1Mn bimetallic catalyst showed a higher percentage removal of methylene blue
compared to other bimetallic oxide catalysts. Therefore Fe: Mn mass ratios were varied
as shown in Table 3. 3. The total metal content in the catalyst was kept constant at 10%.
The same procedure described in Section 3.2.1.2 was followed; however, the microwave
calcination method was utilized at this stage since it yielded a more active catalyst.
Table 3. 3: The mass of iron(III) nitrate nonahydrate and manganese (II) nitrate
tetrahydrate during the preparation of a bi-metallic oxide heterogeneous catalyst by
varying the mass ratio of Fe:Mn metals.
Catalyst Mass of
Fe(NO3)3.9H2O
(g)
Mass of
Mn(NO3)2.4H2O
(g)
Mass of
Silica (g)
Fe 3.6250 0.0000 4.2943
2Fe1Mn 2.4091 0.7541 4.3004
1,5Fe1,5Mn 1.1808 1.1203 4.3007
1Fe2Mn 1.2103 1.5013 4.3011
0,5Fe2,5Mn 0.6030 1.8714 4.3069
0,425Fe2,575Mn 0.5128 1.9306 4.3100
0,35Fe2,65Mn 0.4201 1.9905 4.9603
0,25Fe2,75Mn 0.3012 2.0661 4.3090
Mn 0.0000 2.2803 4.3107
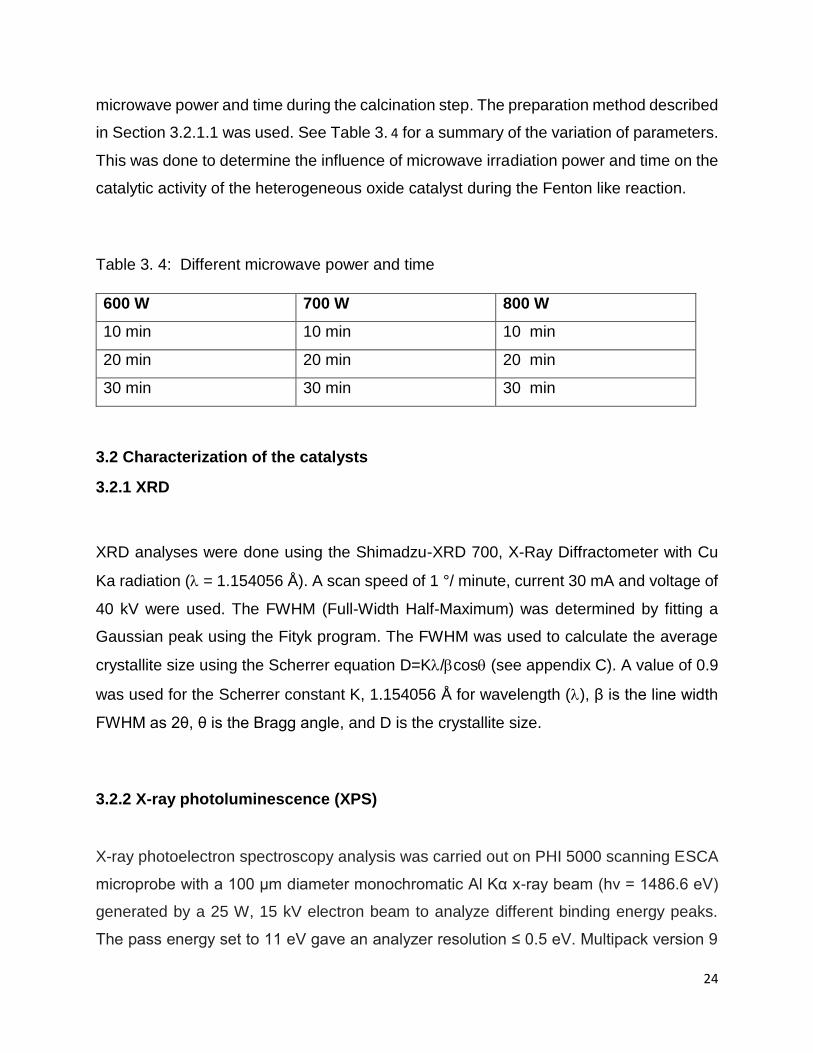
3.2.1.4 Preparation of 0,35Fe2,65Mn at different microwave power and time
In this section, the mass ratio (0,35Fe2,65Mn) oxide catalyst that showed the highest
catalytic activity was used to optimize the microwave calcination method by varying
Page 39
24
microwave power and time during the calcination step. The preparation method described
in Section 3.2.1.1 was used. See Table 3. 4 for a summary of the variation of parameters.
This was done to determine the influence of microwave irradiation power and time on the
catalytic activity of the heterogeneous oxide catalyst during the Fenton like reaction.
Table 3. 4: Different microwave power and time
600 W 700 W 800 W
10 min 10 min 10 min
20 min 20 min 20 min
30 min 30 min 30 min
3.2 Characterization of the catalysts
3.2.1 XRD
XRD analyses were done using the Shimadzu-XRD 700, X-Ray Diffractometer with Cu
Ka radiation ( = 1.154056 Å). A scan speed of 1 °/ minute, current 30 mA and voltage of
40 kV were used. The FWHM (Full-Width Half-Maximum) was determined by fitting a
Gaussian peak using the Fityk program. The FWHM was used to calculate the average
crystallite size using the Scherrer equation D=K/cos (see appendix C). A value of 0.9
was used for the Scherrer constant K, 1.154056 Å for wavelength (), β is the line width
FWHM as 2θ, θ is the Bragg angle, and D is the crystallite size.
3.2.2 X-ray photoluminescence (XPS)
X-ray photoelectron spectroscopy analysis was carried out on PHI 5000 scanning ESCA
microprobe with a 100 μm diameter monochromatic Al Kα x-ray beam (hν = 1486.6 eV)
generated by a 25 W, 15 kV electron beam to analyze different binding energy peaks.
The pass energy set to 11 eV gave an analyzer resolution ≤ 0.5 eV. Multipack version 9
Page 40
25
software was utilized to analyse the spectra to identify the chemical compounds and their
electronic states using Gaussian–Lorentz fits.
3.2.3 Cyclic voltammetry (CV)
CV were carried out in a three-way electrode system using a Biologic SP 240 potentiostat
workstation. The working, reference and counter electrode were glassy carbon
electrodes, Ag/AgCl (in saturated KCl) and platinum wire, respectively. The glassy carbon
electrode (GCE) was thoroughly cleaned with 0.3- and 1-micron alumina powder to
eliminate impurities. The catalyst material (4 mg) was dispersed into 1 mL
Dimethylformamide (DMF) solution using ultra sonification for 15 minutes to obtain a
homogenous solution. DMF was used due to its larger molecule volume than water and
DMF is more inert. A 20 µL sample of the catalyst dispersion was drop cast on the clean
GCE. The EIS experiments was carried out between frequency ranges of 100 KHz to 40
mHz with perturbation amplitude of 5 mV in 5 mM ferrocyanide containing 0.1 M KCl
solution. Appendix D shows redox half reactions for the various metal ions.
3.3 Fenton reaction
The methylene blue degradation was performed by measuring 70 mL of distilled water
which was poured into a 250 mL beaker covered with foil to prevent photo degradation.
The beaker was placed on a magnetic stirrer hot plate, a stirrer bar was immersed inside
the beaker, and the temperature was set at 27 °C at a stirring rate of 500 rpm. A volume
of 10 mL from a 1000 ppm stock solution of methylene blue was also added to the same
beaker. When the temperature of the solution reached 27°C, 0.05 g of catalyst was
weighed and added to the beaker. The solution was stirred for 60 min at 500 rpm to allow
absorption to take place with the temperature maintained at 27°C (the temperature sensor
was immersed inside the solution). After 60 min, 20 mL of H2O2 was added to the beaker
to initiate the Fenton reaction and degradation took place for 60 min.
Page 41
26
A volume of 1 mL was sampled from the solution at predetermined time intervals [0 min
(time of H2O2 addition), 2.5, 5, 7, 9, 11, 13, 15, 17.5, 20, 30 and 60 min] and poured into
100 mL volumetric flask. A 1 mL of isopropanol was added to that 100 mL volumetric flask
(to quench the reaction). The 100 mL volumetric flask was made to the mark with
deionized water and the solution was transferred to centrifuge tubes and centrifuged at
3500 rpm for 3 min to remove the catalyst from the solution. The concentration of the
methylene blue was then measured by UV-vis spectroscopy. The dilution factor and
percentage of degradation was calculated (see Appendix B). Pseudo first order and
second order kinetics were fitted (see Appendix B).
3.4 UV-Vis spectroscopy
The concentration of methylene blue oxidation was measured with T80+ UV–VIS
Spectrophotometer supplied by PG instruments, available with a variable spectral
bandwidth of 0.5, 1, 2, 5 nm. This instrument uses a tungsten and deuterium lamp and
samples were placed in a cuvette (quartz cell size 10 × 10 mm from PG instruments
limited) and placed inside the instrument for quantitative analysis. The MB standard of
0.1, 0.2, 0.3, 0.4, 0.4, 0.5 0.6, 0.7, 0.8, 0.9 and 1 ppm were prepared and used to calibrate
the UV-vis spectrometer.
3.5 Quantification of Fe, Co, Cu and Mn (Leaching test) using AAS
The concentrations of Fe, Co, Cu and Mn leached during degradation were determined
by atomic absorption spectroscopy (AAS) (AA-7000 SHIMADZU). Hollow cathode lamps
(HCL) of Fe (with a wavelength of 248.3 nm and a spectral width slit of 0.2 nm), Co (with
a wavelength of 240.7 nm and a spectral width slit of 0.2 nm), Cu (with a wavelength of
324.8 nm and a spectral width slit of 0.5 nm) and Mn (with a wavelength of 279.5 nm and
a spectral width slit of 0.2 nm) were used during the analysis. Acetylene gas was used as
Page 42
27
a purge gas throughout the analysis. The sample was carried out by acetylene and air
followed by subsequent atomization in the flame.
3.5.1 Leaching test after the Fenton reaction
After the degradation of methylene blue dye as explained in Section 3.4, the solution was
filtered with 0.45 μm filter and the filtered solution was analyzed with AAS for
determination of leached metal concentrations during degradation.
3.5.2 Leaching test under the same conditions
The degradation of methylene blue results in the formation of acids, like oxalic acid, as
intermediates. The catalyst with the highest activity may yield the highest concentration
of acids which is expected to result in the highest amount of leaching. The amount of
leaching may thus be dependent on the activity of the catalyst. It is thus important to
determine the concentration of leached metal ions under the same conditions to
determine the catalyst stability independent of the catalyst activity. This was done by
dispersing 0.02 g of each catalyst into a 10 mL of 0.2 molL-1 of oxalic acid for 1 hour for
catalysis at a stirring rate of 500 rpm. The resulting solution was filtered with a 0.45 μm
filter and measured with AAS.
3.6 Oxidation Reduction Potential (ORP)
Oxidation Reduction Potential meter HI2002 edge® with 5.5-inch LCD display, which uses
an ORP/temperature digital electrode HI136180 that can measure a temperature range
of -5 to 100 0C and a potential of +/- 2000 mV, was used to measure the tendency of the
solution to release or accept the electrons.
Page 43
28
The degradation method was performed with the method described in Section 3.4. The
ORP probe was then immersed into the solution (containing methylene blue dye,
deionized water, hydrogen peroxide and the catalyst) to measure the tendency of a
substance to oxidize or reduce. The potential (mV) was recorded at different time intervals
[0 min (time of H2O2 addition), 2.5, 5, 7, 9, 11, 13, 15, 17.5, 20, 30 and 60 min].
3.7 Mass loss studies
Mass loss studies were performed to investigate the tendency of hydrogen peroxide to
decompose to oxygen as shown in Equation 2.11. This is an unwanted reaction as it
consumes the amount of H2O2 present in the reaction.
During these experiments, 20 mL of H2O2 was placed into a 250 mL beaker with a
magnetic stirrer. The beaker was then weighed using a weighing balance supplied by
RADWAG®, model (AS 220/c/2) and the mass was recorded. A catalyst of approximately
0.005 g was weighed using the same weighing balance and was added into the same
beaker. The beaker was then weighed again and thereafter placed into a magnetic stirrer
supplied by Radley's innovation for chemistry (with a Pt1000 temperature sensor, Pt1000
Medium and Pt1000 safety circuit), the temperature was set at 27oC and the stirring rate
was set to 500 rpm. The beaker with the solution was then weighed at different time
intervals of 0, 2.5, 5, 7, 9, 11, 13, 15, 17.5, 20, 30 and 60 min.
3.8 Hydroxyl radical determination
The Fenton reaction is one of the reactions that are based on the oxidation of hydrogen
peroxide to generate hydroxyl radicals which in turn degrade the dyes (methylene blue
dye in this study) (Gao et al., 2019). The catalyst that shows higher activity for the
formation of these radicals is expected to have higher catalytic activity for the degradation
of MB. Therefore, it is important to determine the formation of these radicals. In this study
Page 44
29
terephthalic acid (TA) was used to determine the generation of hydroxyl radicals. TA
readily reacts with .OH to produce 2-hydroxyterephthlic acid (TAOH) which emits
fluorescence around 424 nm on the excitation at 359 nm. This method was adopted from
Wang et al. (2017) with some modifications. The difference between this method and that
of Wang et al. (2017) is the addition of 20 mL H2O2 since this study was based on Fenton
reaction and not photocatalysis.
A mass of 0.05 g catalyst was weighed and dispersed in an 80 mL of TA (5×10⁻⁴ molL-1)
aqueous solution with NaOH (2×10⁻³ molL-1) and 20 mL 30% H2O2. The reaction was
allowed to take place at a temperature of 270C and was stirred at 500 rpm. The samples
were taken at different time intervals of 0 (before the addition catalyst), 0 (after the catalyst
was added), 5, 10, 20 and 30 and analysed with a photoluminescence spectrophotometer
The emission of the nanoparticles was determined using the Jasco spectrofluorometer
FP-8600 equipped with XE lamp, 150 W, with bandwidth excitation slit 5 nm and the
emission ranging from 200-1010 nm. Fluorescent materials absorb UV light which is then
emitted to longer (frequency visible) wavelength. The instrument consists of a UV source,
a monochromator for selection of the desired wavelength for irradiation, a sample holder,
a second monochromator is used to select the desired wavelength of detection and a
phototube amplifier-output assembly. The fluorometer irradiates and then records the
intensity of the light emitted by the sample on a plate. The wavelength of the excitation
for all the particles was at 359 nm. The emitted intensity gives an indication of the amount
of radical formation.
Page 45
30
Chapter 4: The effect of the catalysts’ composition and calcination method.
This chapter deals with the preparation of monometallic and bimetallic oxide
heterogeneous catalysts calcined by conventional methods (oven) and microwave
irradiation power for the degradation of methylene blue dye.
4.1 Preparation of monometallic oxide heterogeneous oxide catalyst and Fe-M (M
is Mn, Cu and Co) bimetallic oxide heterogeneous catalyst calcined by microwave
and conventional methods (oven) for the Fenton reaction.
4.1.1 Characterization of heterogeneous oxide catalyst with XRD
XRD was used to (i) determine the phase and the type of the oxide formed, (ii) identify
the shifting of peaks between monometallic and bimetallic oxide catalysts to see if there
was a change in the Fe structure when incorporated with other transition metals, and (iii)
to also determine the crystalline size of the catalysts.
4.1.1.1 Identification of the phase
Figure 4. 1(a) and (b) shows the XRD analysis of Fe, FeCo, FeCu and FeMn catalyst
calcined by conventional (Conv) and microwave irradiation power (MW), respectively.
The results showed the existence of a single crystallographic phase corresponding to
hematite Fe2O3, which was identified by its reflections in the XRD pattern (card number:
00-033-0664). Figure 4. 12(a) the XRD also indicated the formation of cobalt oxide
(Co3O4) that corresponded to XRD pattern (card number: 00-042-1467). The presence of
a single crystallographic phase corresponding to tenorite (CuO) with XRD pattern (card
number: 00-048-1548) was observed in Figure 4. 12 (b).
The manganese catalyst showed the presence of pyrolusite also known as manganese
black MnO2, which corresponded to the diffraction peaks of MnO2 with card number 00-
024-0735 as shown in Figure 4. 12(c). The XRD pattern in Figure 4.1 could be assigned
to Fe2O3 (00-033-0664), as all the Fe, FeMn, FeCo and FeCu catalysts shared a single-
Page 46
31
phase structure. No peaks for Mn, Co and Cu were observed in a bimetallic catalyst. This
could be due to the high dispersion of these metal ions in the Fe2O3 lattice (Wang et al.,
2016). This may also be attributed to low metal loading of these transition metals to the
Fe structure and too small metal particles deposited on silica (Wang et al., 2015).
4.1.1.2 Identification of peaks shifts
There was no significant shifting in the diffraction peaks observed when the iron is
incorporated with other transition metals (Co, Cu and Mn). This may indicate that a mixed
spinel did not form. Only the iron oxide diffraction peaks were observed for the bimetallic
catalysts which may be attributed to the low metal loading of the other transition metals
to the Fe structure and too small metal particles deposited on silica (Luo et al., 2015).
4.1.1.3 Determination of the crystallite size
The crystallite size of the catalyst might be influenced by the calcination method.
Catalysts calcined by the microwave irradiation power (MW) showed smaller crystallite
sizes compared to those calcined by a conventional oven method (Conv) except for
copper oxide catalyst as shown in Table 4. 1. Similar results were observed by Rad et al.
(2015). The conventional method heats from the outside of the catalyst particle to the
inside due to heat transfer limitations. This leads to an outward liquid flow from the inside
of the particle to the outside, which leads to agglomeration of the metal oxide on the
outside of the particle (Reubroycharoen et al., 2007), lowering metal dispersion and
increasing the metal oxide particle size. Microwave heating has the advantage of rapid
homogenous drying leading to uniform particle size distribution and physically strong
pellets (Reubroycharoen et al., 2007). The MW outperforms conventional oven heating in
terms of thermal gradient and heating flow. The heating of MW irradiation decreases
gradually from the centre of the material to the surface due to higher temperatures in the
interior than at the surface leading to uniform metal distribution on the support
(Reubroychaoen et al., 2007; Rad et al., 2015).
Page 47
32
Figure 4. 1: XRD diffraction pattern of Fe, FeCu, FeCo and FeMn heterogeneous oxide
catalysts calcined by (a) conventional oven (Conv) and (b) microwave irradiation power
(MW).
a b
Page 48
33
Figure 4. 2: XRD diffraction pattern of monometallic and bimetallic oxide heterogeneous
catalyst calcined by microwave power (MW) and conventional oven (Conv) for (a) Co and
FeCo (b) Cu and FeCu, and (c) Mn and FeMn.
a
b
c
Page 49
34
Table 4. 1: XRD crystallite size of Fe, FeMn, Mn, FeCo, Co, FeCu, Cu oxide
heterogeneous catalyst calcined by conventional methods (oven) and microwave
irradiation power.
Crystalline size (nm), oxides and the peak angle
(degree)
Catalyst name Conventional oven (Conv) Microwave (MW)
Fe
12.1 (Fe2O3 peak at 35.47) 10.6 (Fe2O3 peak at 33.45)
FeMn
6.7 (Fe2O3 peak at 36.12) 4.4 (Fe2O3 peak at 36.24)
Mn
5.8 (MnO2 peak at 37.32) 5.1 (MnO2 peak at 37.18)
FeCo
8.2 (Fe2O3 peak at 33.52) 6.8 (Fe2O3 peak at 37.50)
Co
5.6 (Co3O4 peak at 37.20) 5.0 (Co3O4 peak at 36.96)
FeCu
7.1 (Fe2O3 peak at 33.10) 6.6 (Fe2O3 peak at 32.75)
Cu
6.8 (CuO peak at 37.01) 13.5 (CuO peak at 36.28)
4.1.2 X-ray photoluminescence (XPS)
XPS analyses were also done for the catalyst calcined by microwave heating to see if
peak shifts have occurred in the bimetallic oxide catalysts to indicate if a mixed oxide
formed rather than two separate metal oxides. The peak positions for the Fe2p are shown
in Table 4.2 and Figure 4. 3 and no significant peak shifts were observed. XPS analyses
were also done to determine the oxidation state of the iron to determine whether Fe2O3
or Fe3O4 was formed. Fe2O3 is expected since the catalysts were prepared with Fe3+ ions,
calcined in air and small crystallites are expected to fully oxidize to Fe2O3 (Carvalho et
Page 50
35
al., 2013). However, from the area ratios obtained from the XPS peak deconvolution (see
Figure 4.2 and Table 4.2) it may indicate that Fe3O4 has formed. The catalyst is not
magnetic which rather supports the formation of hematite (Fe2O3).
Table 4. 2: XPS values obtained by peak deconvolution of (a) Fe (b) FeCu (c) FeCo and
(d) FeMn
Catalysts Fe2+/Fe3+
Area ratio
Fe2+ peak position (eV) Fe3+ peak position
(eV)
Fe 0,5 707,8 709,5
FeCu 1,1 708,1 710,3
FeCo 1,5 708,2 710,0
FeMn 1,0 708,1 709,9
Page 51
36
Figure 4. 3: The XPS deconvoluted spectra of Fe2p in the following catalysts (a) Fe (b)
FeCo (c) FeCu and (d) FeMn.
-200
0
200
400
600
800
1000
700 710 720 730 740
Inte
nsi
ty (
a.u
.)
Binding energy (eV)
a
-200
0
200
400
600
800
1000
1200
700 710 720 730 740
Inte
nsi
ty (
a.u
.)Binding energy (eV)
b
-200
0
200
400
600
800
1000
1200
700 710 720 730 740
Inte
nsi
ty (
a.u
.)
Binding energy (eV)
d
-100
-50
0
50
100
150
200
250
300
350
400
700 710 720 730 740
Inte
nsi
ty (
a.u
.)
Binding energy (eV)
c
Page 52
37
4.1.3 Cyclic voltammetry
The electrochemical behaviour of the catalysts was studied with CV. These analyses
were conducted to see if the reduction/oxidation eV shifts have occurred in the bimetallic
oxide catalysts to indicate if the metals are in proximity and can influence each other’s’
redox behaviours. During the Fenton reaction, the reduction of the metal oxides is much
slower than the oxidation of the metal oxide. Therefore, a higher reduction potential (less
negative) may indicate that the metal oxide will reduce easier and could be more active
for the Fenton reaction. As expected the electrode without catalyst (bare) gave the lowest
reduction peak currents compared to the electrodes with the catalysts (Figure 4.4).
However, the metal supported catalysts produced peaks at different reduction potentials
with the FeMn catalyst showing the highest potential peak of -0.21 (V). A decrease in the
potential of FeCu, FeCo and Fe electrode was obtained at -0.19, -0.24 and -0.18 (V) in
the CV curve, respectively. The difference in the potential values of these catalysts may
be attributed to the slow or fast electron transfer rate and the activity of different catalysts
(Ren et al., 2015).
On the other hand, the FeMn catalyst showed the highest intensity current peak
compared to the other catalysts indicating more active sites on the surface of the catalysts
The trend was found to be in the following order FeCo<Fe<FeCu<FeMn. According to
Ren et al. (2015) the difference in the activity of these catalysts depend on the chemical
activity and the capacity of the transitive metal ions in the process of the reduction and
oxidation. Wang et al. (2016) attributed this difference to the electrochemically accessible
sites on the surface of the catalysts.
In addition, the ratio of anodic current to the cathodic current (Ia/Ic) for FeMn catalyst
equals 1.00 (mA) indicating that the electron transfer for this catalyst was chemically
reversible. This suggests that the electron that was donated by the electrode upon
reduction was recovered during the oxidation process which in turn maintains the Fenton
process during the degradation of MB representing a continuous oxidation-reduction
process of the metal ions (Elgrishi et al., 2017). The chemically reversibility trend was
found to be in the following order FeCo<Fe<FeCu <FeMn (Table 4.3). If the extent of
Page 53
38
oxidation-reduction process is not reversible it may lead to the deactivation of the catalyst
during the Fenton reaction.
The peak to peak potential separation (Epc-Epa) depends on the relative rates of oxidation-
reduction as well as the number of electrons transferred. Equation 4.1 indicates that a
value of 57 eV is expected for an electrochemical reversible single electron transfer and
a value smaller than 57 eV for multiple electron transfers.
Epa − Epc =56.6 mV
n (4.1)
One could speculate that a single electron transfer took place since the peak to peak
potential separation is larger the 57 mV (Elgrishi et al., 2017). The electron transfer for all
the catalysts was electrochemically irreversible since the peak to peak separation is larger
than 57 mV (Elgrishi et al., 2017) as presented in Table 4.3.
The Fe and FeCo catalysts showed a less favourable slower electron transfer compared
to FeMn and FeCu, respectively. The smaller peak separation for the FeMn and FeCu
catalysts in comparison to the other catalysts may indicate that the continuous oxidation-
reduction process of the metal oxides that takes place during the Fenton reaction may be
faster for the FeMn and FeCu catalysts and this may possibly lead to an increase the
catalytic activity.
Table 4. 3: CV potential for different catalysts
Catalyst Ia
(mA)
Ic(mA) Ia/Ic Epa
(mV)
Epc
(mV)
Epc -
Epa
(mV)
Emid(Epa+Epc)/2
(mV)
Fe 0.034 -0.041 0.829 -36.90 -227.00 190.10 131.5
FeCo 0.032 -0.040 0.800 -46.60 -243.40 196.80 145.0
FeCu 0.043 -0.047 0.915 -98.00 -185.40 87.40 141.7
FeMn 0.05 -0.05 1.000 -117.60 -207.30 90.30 162.45
Page 54
39
Figure 4. 4: Cyclic Voltammograms of Fe, FeCu, FeMn and FeCo.
4.1.4 Oxidation Reduction potential (ORP)
The ORP is measured in volts (V) or millivolts (mV). The positive results indicate oxidizing
agents (hydrogen peroxide, and radicals, which is stronger oxidizing agent than hydrogen
peroxide, like hydroxide radicals and superoxide radicals) and the negative reading
indicate reducing agents (which is not expected to be present during the Fenton reaction).
He et al. (2009) showed that ORP can be used to monitor the Fenton reaction. They
found that almost all the H2O2 was consumed when the ORP reached a maximum. This
would be the point in the reaction were the Fenton reaction has converted the hydrogen
peroxide to the stronger oxidizing radicals like hydroxide radicals. Thereafter the ORP
decreases to a minimum (from 427 to 355 mV), indicating the completion of the Fenton
reaction due to the depletion of the radicals (He et al., 2009). ORP was done to determine
the relative oxidizing environments created by the different catalysts.
Page 55
40
4.1.4.1 Repeatability of ORP
ORP repeatability studies were performed using the 2Fe1Mn oxide catalyst in five
different runs. Each run was started with the new catalyst that was not reused. Figure 4.5
shows that a similar trend was observed among the ORP repeatability experiments. An
average potential of 376 mV after 60 min with a standard deviation of 13.5 was obtained.
No strong decrease in the ORP values were observed as also shown by He et al. (2009)
which indicates that the Fenton reaction was not completed, meaning that there are still
radicals like hydroxyl radicals present that can oxidize the pollutants.
Figure 4. 5: The repeatability of the 2FeMn heterogeneous oxide catalyst
4.1.4.2 Determination of the tendency of metal ions to reduce or oxidize
The ORP values of the different are shown in Figure 4.5 and the ORP values were
between 320 and 466 mV. This is higher than the values reported by He et al. (2009).
The difference between the FeCo and FeCu catalyst is 9 mV after 60 min which is smaller
than 27 eV (2x standard deviation to account for 95% of the data) for the repeatability
ORP measurements which may indicate that the FeCu and FeCo have similar ORP
0
100
200
300
400
500
0 10 20 30 40 50 60
Po
ten
tial
(m
V)
Time (min)
FeMn FeMn FeMn FeMn FeMn
Page 56
41
values. The difference between the FeMn and FeCu is 38 eV after 60 min and the
difference between the Fe and FeCu is 121 eV after 60 min which is larger than 27 eV
which may indicate that these catalysts have different ORP values.
The ORP results showed that with Fe, FeCo and FeCu catalysts there was a slight
decrease on the ORP values (between 2.5 and 60 min). However, this was different in
the case of FeMn catalyst as this catalyst exhibited a slight increase in the ORP between
2.5 and 60 min. According to Kim et al. (2004) the increase in the ORP potential indicates
the existence of the Fenton reagents that increase the radical formation in the reaction.
No strong decrease in the ORP values were detected as observed by He et al. (2009)
which indicates that the oxidization of the pollutants can still occur.
Figure 4. 6: The ORP results of different catalysts
4.1.5 Decomposition of hydrogen peroxide to oxygen (Mass loss)
Mass loss studies were performed to investigate the tendency of hydrogen peroxide to
decompose to oxygen as shown in the Equation 4.1. This is an unwanted side reaction
as it consumes the amount of H2O2 present in the reaction.
2H2O2 2H2O + O2 (4.1)
0
50
100
150
200
250
300
350
400
450
500
0 10 20 30 40 50 60
Po
ten
tial
(m
V)
Time (min)
Fe FeCu FeCo FeMn
Page 57
42
4.1.5.1 Mass loss statistics
The mass loss repeatability studies were performed using the 2Fe1Mn bimetallic catalyst.
Five experimental runs were performed and each run was started with a new catalyst.
The catalyst was not reused. The results are shown in Figure 4.7. The average final mass
was 22.69 g with a standard deviation of 0.20 g were obtained after 60 min. In Figure 4.8
the first order kinetic model is plotted and the average rate constant of 6.14×10⁻⁴ min-1
with a standard deviation of 1.95×10⁻⁴ min-1 was obtained.
Figure 4. 7: The repeatability results of 2Fe1Mn catalyst for mass loss studies.
22.2
22.4
22.6
22.8
23
23.2
23.4
23.6
23.8
0 10 20 30 40 50 60 70
Mas
s (g
)
Time (min)
Page 58
43
Figure 4. 8: The repeatability results of 2Fe1Mn catalyst for first-order reaction kinetics.
4.1.5.2 Decomposition of hydrogen peroxide to oxygen (mass loss)
In Figure 4.9 the mass loss due to the formation of oxygen during the decomposition of
H2O2 in the presence of Fe, Co, Cu and Mn monometallic oxide heterogeneous catalyst
was measured.
The difference between the Fe and Co catalysts is 0.4 g after 60 min which is equal to 2σ
of the repeatability test (0.4 g) which may indicate that the Fe and Co have similar mass
loss values. The difference between the Fe and Cu is 0.7 g and the difference between
the Fe and Mn is 2.16 g after 60 min which is larger than 2σ of the repeatability test (0.4
g) and this may indicate that these catalysts have different mass loss values. The Mn
catalyst showed the highest activity for decomposition of hydrogen peroxide compared to
all the other monometallic catalysts meaning that more H2O2 decomposed to O2. The
mass loss trend was found to be in the following order from Mn > Cu > Co Fe.
The decomposition of H2O2 in the presence of Fe monometallic oxide catalyst, FeCo,
FeCu and FeMn bimetallic oxide catalyst was also investigated as shown in Figure 4.10.
3.1
3.11
3.12
3.13
3.14
3.15
3.16
3.17
0 10 20 30 40 50 60 70
Ln(M
ass)
Time (min)
Page 59
44
The difference between the Fe, FeCu and FeCo catalyst is 0.4 g after 60 min which may
indicate that the Fe, FeCu and FeCo have similar mass loss values. The difference
between the Fe and FeMn is 0.7 g after 60 min and may indicate that the FeMn catalysts
have a larger mass loss value than the Fe catalyst. The mass loss trend was observed
to be in the following order Fe≈FeCu≈FeCo<FeMn.check the sign?? The FeMn catalyst
showed the highest mass loss due to H2O2 decomposition compared to other catalysts.
Figure 4. 9: The mass loss due to H2O2 decomposition studies when using monometallic
oxide heterogeneous catalysts.
21
21.5
22
22.5
23
23.5
24
24.5
0 10 20 30 40 50 60
Mas
s (g
)
Time (min)
Fe Mn Cu Co
Page 60
45
Figure 4. 10: The mass loss due to H2O2 decomposition studies when using bimetallic
oxide heterogeneous catalyst.
4.1.6 Leaching
The leaching of metal ions from the heterogeneous oxide catalyst is an important problem
for the Fenton process since it results in pollution, deactivation of the catalyst and
promotes the homogeneous Fenton reaction due to the metal ions in the solution
(Fontecha-Cámara et al., 2016). The leaching of a heterogeneous catalyst can be
attributed to different factors. During the degradation of the dyes, the formation of
aromatic compounds and their oxidized by-products to form soluble complexes has also
been reported to take place see Figure 2.2 in chapter 2.
The formation of these intermediates and metal complexes may depend on the activity of
the catalyst being utilized. In other words, the catalyst with the highest activity may yield
the highest concentration of intermediates like acids which can act as ligands to form
metal complexes which are expected to result in the highest amount of leaching
compared to the catalyst with lower catalytic activity. Therefore, it is important to test the
leaching of metal ions under the same condition to elucidate if the leaching of the catalyst
22.6
22.8
23
23.2
23.4
23.6
23.8
24
24.2
0 10 20 30 40 50 60
Mas
s (g
)
Time (min)
FeCu FeMn FeCo Fe
Page 61
46
was due to the formation of metal complexes or the instability of the catalyst (Ammar et
al., 2001).
The catalyst testing under the same conditions was performed using oxalic acid as
described in Chapter 3.5 since different catalytic activities may result in different amounts
of leaching. Oxalic acid is one of the intermediates formed during the degradation of MB.
Pariente et al. (2015) and Rey et al. (2009) observed a significant decrease on the
concentration of iron leaching as the concentration of oxalic acid was decreased. This
phenomenon might be due to chelation (Liotta et al., 2009). Hence leaching experiments
under the same conditions were performed using oxalic acid. Oxalic acid is a bidentate
ligand and therefore it bonds to the metal ion with two bonds forming a ring and allows
the metal ions to bond with it more strongly. This might lead to more leaching of metal
ions from the support and hence in this study oxalic acid was used to test the catalyst
leaching under the same conditions.
4.1.6.1 Leaching repeatability of 2Fe1Mn during degradation
The repeatability study was performed using a 2Fe1Mn bimetallic catalyst (see Figure
4.11 (a)). Five replicates were performed, and each run was started with a new catalyst.
After 60 min of adsorption and 60 minutes of Fenton reaction, the average Fe ion
concentration leached was found to be 1.75 ppm with a standard deviation of 0.54 ppm
and the average Mn ion concentration was 17.62 ppm with a standard deviation of 4.39
ppm after 60 min.
The amount leached in oxalic acid after 60 min was also determined and the results are
shown in Figure 4.11(b). The average Fe ions leached was 120.79 ppm with a standard
deviation of 20.80 ppm and the average Mn ions leached was 66.06 ppm with a standard
deviation of 11.21 ppm.
Page 62
47
Table 4. 4: WHO limit concentrations of metal ions this Table was adapted from (WHO,
1996, 2002, 2011; Chenniah et al. 2014).
Metal WHO limit concentration (ppm)
Fe 0.3
Co 0.05
Cu 1.3
Mn 0.05
Page 63
48
Figure 4. 11: Repeatability concentration of (a) The Fe ions in 2Fe1Mn in oxalic acid (b)
The Fe ions in 2Fe1Mn during degradation.
Figure 4. 12: Repeatability concentration of Mn ions in 2Fe1Mn during the degradation
and the dispersion of catalysts in oxalic acid.
54.82 53.31
70.5074.56 77.10
26.18
15.78 13.79 15.46 16.88
0
10
20
30
40
50
60
70
80
90
FeMn FeMn FeMn FeMn FeMN
Co
nc
Mn
cat
ion
s (p
pm
)
Catalyst name
Oxalic acid Degradation
153.04
100.55 106.32127.89
116.15
0
50
100
150
200
FeMn FeMn FeMn FeMn FeMNCo
nc
Fe c
atio
ns
(pp
m)
Catalyst name
Oxalic acid
2.35
1.36
2.26
1.67
1.11
0
0.5
1
1.5
2
2.5
FeMn FeMn FeMn FeMn FeMNCo
nc
Fe c
atio
ns
(pp
m)
Catalyst name
Degradation
a
b
Page 64
49
4.1.6.2 Leaching of different catalysts
4.1.6.2.1 Leaching of Fe ions
The leaching of Fe ions during the degradation of MB and when the different catalysts
were dispersed in oxalic acid are shown in Figure 4.13(a) and Figure 4.13(b),
respectively. The statistical analysis of the leached metal ions was determined to verify if
different amounts of the catalyst leached out. The difference between the leaching
concentrations was calculated and compared to the 2σ of the repeatability test to account
for the 95% confidence interval of the data. The results showed that the difference
between the concentration of Fe ions in Fe & FeCo, Fe & FeMn and FeMn & FeCo
catalysts was 0.81, 1.06 and 0.25 ppm, respectively after 60 min adsorption and 60 min
catalysis, which is smaller than 2σ (1.08 ppm). This may indicate that the Fe & FeCo, Fe
& FeMn and FeCo & FeCo catalysts have similar leached concentration values. The
difference between the Fe and FeCu is 1.29 ppm after 60 min adsorption and 60 min
catalysis which is larger than 1.08 ppm which may indicate that the FeCu catalysts
leached the differently. The leaching trend was found to be in the following order
Fe&FeCo≈Fe&FeMn≈FeCo&FeCu<Fe&FeCu. The Fe ions leached in the catalysts Fe,
FeCo and FeMn were above the World Health Organization (WHO) limit see Table 4. 4
but on the other hand, iron ions leached in FeCu heterogeneous oxide catalyst were
below the WHO limit.
The Fe, FeCo, FeMn and FeCu catalysts were the dispersed in oxalic acid to determine
leaching Fe ions under the same conditions see Figure 4.13(b). The difference between
Fe and FeMn catalyst is 20.07 ppm which is less than 41.60 ppm for the 2σ. This indicated
that these catalysts have similar leaching amounts. The difference between Fe & FeCo
and Fe & FeCu is 111.30 and 67.14 ppm, respectively. The leached concentration
between these catalysts is above the 2σ and this indicates that this catalyst have different
leaching concentrations. The trend for the Fe ions leached under the same conditions is
in the following order FeCo<FeCu<Fe≈FeMn. The trend of Fe ions leached during the
degradation of MB and Fe ions when the catalyst is dispersed in oxalic acid are different.
The difference between these trends might be due to the difference on the catalytic
Page 65
50
activities of these catalyst. The catalysts that show higher catalytic activity might leach
more than those with lower catalytic activity due to the intermediates that are produced
during degradation. (See degradation pathways in Figure 2.2). Whereas when the
catalysts are dispersed in oxalic acid different catalyst are exposed to the same
conditions.
4.1.6.2.2 Leaching of other metal ions
Non-iron metal ion concentrations leached during the degradation of MB were also
determined and the results are shown in Figure 4.14. The 2σ for other metal ions is 8.78
ppm. The Co (2.10 ppm) and Cu (0.36 ppm) ions in FeCo and FeCu catalysts leached
the same since their concentration difference was 1.74 ppm which is below the 2σ. The
difference between Mn ion leached from Mn and FeMn catalyst is 2.18 ppm which is
below the 2σ this indicated these two catalysts have similar leaching amounts. The Cu
ions in Cu and FeCu and catalyst and the Co ions in Co and FeCo catalyst were above
the 2σ indicating that these catalysts behaved differently. The trend for other metal ion
leaching amounts was found to be increasing in the following order
FeCu≈FeCo<Cu<FeMn≈Mn<Co. The leached metal ions for these catalysts were above
the WHO limit, except for Cu ions in FeCu catalyst the WHO limit concentrations are
represented in Table 4. 4.
Figure 4.14 shows the results of Fe, Co, Mn, Cu, FeCo, FeMn and FeCu catalysts when
dispersed in oxalic acid. The repeatability results showed that the 2σ for other metal ions
dispersed in oxalic acid is 22.42 ppm. The difference between the Mn ion from Mn and
FeMn catalyst is 10.82 ppm indicating that Mn, FeCo and FeMn catalyst leached the
same. The difference between Mn ions and Cu ions when using Mn and FeCu catalysts
respectively is 30.38 ppm indicating that Mn, FeCu, Co and Cu catalysts behave
differently. The trend for the leached metal ions was found to be in the following order
Mn≈FeCo≈FeMn<FeCu<Co,Cu.
Page 66
51
Figure 4. 13: The leaching metal ions (a) during degradation of MB for Fe metal ions (b)
catalyst dispersed in oxalic for Fe ions.
Figure 4. 14: Leached metal ions during degradation and catalyst dispersed in oxalic acid
for Co, Cu and Mn metal ions.
4.1.7 Radical determination
A series of radical detection experiments were conducted to identify the catalyst that
produced more of hydroxyl radicals (active species) for the Fenton reaction and the
degradation process (Upreti et al., 2016). A higher florescence intensity relates to a higher
94.50
46.50
221.28
74.38
44.0054.82
42.53
2.1012.04
0.36
28.00 26.18
0
50
100
150
200
250
Co FeCo Cu FeCu Mn FeMn
Co
nc
dif
fern
t ca
tio
ns
(p
pm
)
Different catlysts
Oxalic acid Degradation
c
Page 67
52
radical concentration. In Figures 4.15 and 4.16, radical experiments results suggested
that FeCo catalyst showed the highest radical formation followed by FeCu, Fe and FeMn,
respectively. In the catalyst FeCo and Fe, these radicals decreased after 20 min this
phenomenon was attributed to the radical scavenging. A decrease in the radical
production may lead to the lower degradation rate of MB. This was not observed in the
case of the FeCu and FeMn catalysts while the radicals were increasing with time. Hence
these catalysts showed higher catalytic activity.
Figure 4. 15: Radical determination of (a) Fe, (b) FeCo, (c) FeCu and (d) FeMn
catalysts.
Page 68
53
Figure 4. 16: Determination of radicals with different catalysts at different time (min)
intervals.
4.1.8 Fenton and Fenton-like reaction
The degradation of methylene blue dye was performed as explained in Section 3.3 in
Chapter 3 to test the catalytic activity of the heterogeneous oxide catalyst during the
Fenton reaction. The first sample was taken few seconds after the addition of H2O2 and
hence the initial percentage removal of MB for different catalysts start at different times.
4.1.8.1 Repeatability of the Fenton reaction
Repeatability studies (see Figure 4.17) were performed using the 2Fe1Mn bimetallic
oxide catalyst. Each replicate was started with a new catalyst. The percentage removal
is shown in Figure 4.17(a). Note that the percentage removal does not start at zero and
this is due to the 60 min adsorption that took place before catalysis, as described in
Chapter 3.3. An average percentage removal of 89.6% after 60 min with a standard
deviation of 1.95 x10⁻⁴ ppm-1.min-1 was obtained. The average R2 for the pseudo-first
0
500
1000
1500
2000
2500
3000
3500
4000
4500
Fe FeCo FeCu FeMn
Inte
nsi
ty (
a.u
)
Different catalysts
0 min 5 min 10 min 20 min
Page 69
54
order kinetic model is 0.9550 and the average R2 for the pseudo-second order is 0.9537.
Therefore, the pseudo-first-order kinetic model fits better since the R2 value is close to
1.0000. However, the results from Table 4.5 show that most reactions followed pseudo-
second order and hence the pseudo-second order kinetic model was use for further
studies.
In Figure 4.17(b) the pseudo-second order kinetic model is plotted and an average rate
constant of 1.16 x10⁻⁴ ppm-1min-1 with a standard deviation of 1.95 x10⁻⁴ ppm-1min-1 was
obtained.
Figure 4. 17: The repeatability of 2Fe1Mn bimetallic oxide heterogeneous catalyst (a) total
percentage removal and (b) Second-order reaction kinetics.
4.1.8.2 Comparison of monometallic catalyst calcined by a conventional oven
method and microwave.
The catalyst were calcined using conventional oven method (Conv) and the microwave
(MW). Figures 4.19 and 4.20, and Table 4. 5 shows the influence of a calcination method
on the total percentage removal during the Fenton reaction. The Co MW, Fe MW and Fe
catalysts have similar k values since the difference between (0.00 ppm-1.min-1) and the k
values of these catalysts is less than 2σ of the repeatability study (3.9 x10⁻⁴ ppm-1.min-1).
On the other hand, the statistical difference between the Cu MW & Co Conv, Cu & Co
MW and Mn MW is 3.95 x10⁻³ ppm-1.min-1, which is larger than 2σ and this may indicate
that these catalysts have different catalytic activities. The degradation results showed that
0
0.02
0.04
0.06
0.08
0.1
0.12
0 20 40 60
ln [
MB
]
Time (min)
0
20
40
60
80
100
0 20 40 60
Tota
l % r
em
ova
l
Time (min)
a b
Page 70
55
Mn monometallic catalyst calcined by the microwave oven showed the highest
degradation of the methylene blue dye compared to other monometallic catalysts.
4.1.8.3 Comparison of bimetallic catalyst calcined by conventional oven method
and microwave.
The bimetallic oxide heterogeneous catalyst calcined by conventional oven (Conv)
showed lower catalytic activity for the degradation of methylene blue compared to those
calcined by the microwave (MW). The results are shown in Table 4. 5, 4.21 and 4.22. This
was confirmed by the statistical analysis of these catalysts. The difference between the
Fe conv and FeCo conv catalyst is 3.0 x10⁻⁴ ppm-1.min-1 after 60 min adsorption and 60
min catalysis which is smaller than 3.9 x10⁻⁴ ppm-1.min-1 (2σ of the repeatability study)
this indicated that Fe conv and FeCo conv catalyst have similar catalytic activity. The
difference between the Fe Conv & FeCu conv and Fe Conv & FeMn MW is larger than
the 2σ indicating that the catalytic activity of these catalysts is different.
4.1.8.4 Comparison of monometallic and bimetallic catalyst calcined by
microwave.
The monometallic and bimetallic oxide heterogeneous catalysts calcined by microwave
irradiation power (MW) were compared. The bimetallic catalyst outperformed the Fe
monometallic oxide catalyst as shown in Figure 4.23. The k values were extracted from
Figure 4.13(d). The difference between the Fe & FeCo, Fe & FeCu and Fe & FeMn
catalysts is 1.64 x10⁻², 5.16 x10⁻² and 7.68 x10⁻² ppm-1.min-1 is larger than 3.9 x10⁻⁴ ppm-
1.min-1 (2σ) which may indicate that the Fe, FeCu, FeCo and FeMn have different catalytic
activity values. However, from Figure 4.13(d) it can be observed that the FeMn catalyst
showed the highest activity for the degradation of MB compared to other bimetallic
catalysts.
The degradation of MB dye follows both the pseudo-first-order and pseudo-second-order
kinetics depending on the catalyst utilized in that experiment, as shown in Table 4. 5.
Most of the data fitted pseudo second order better than pseudo first order based on the
Page 71
56
higher R2 values. The k values for the catalysts calcined by the microwave power was
observed to be higher than the catalysts calcined by the conventional oven (Figure 12
and Table 4. 5).
Figure 4. 18: The pseudo-second order rate constant for the degradation of MB dye of
the catalyst calcined by conventional heating and microwave irradiation.
Figure 4. 19: Comparison of monometallic oxide heterogeneous catalyst calcined by both
conventional oven and microwave irradiation power on the oxidation of MB.
0
0.0002
0.0004
0.0006
0.0008
0.001
0.0012
0.0014
Fe FeMn Mn CoFe Co FeCu Cu
k (p
pm
-1.m
in-1
)
Catalyst name
Microwave Conventional oven
0
10
20
30
40
50
60
70
80
90
100
0 10 20 30 40 50 60
Tota
l (%
) re
mo
val
Time (min)
Fe MW Fe Oven Mn MW Mn Oven
Co MW Co Oven Cu MW Cu Oven
Page 72
57
Figure 4. 20: Pseudo-second order of monometallic oxide heterogeneous catalyst
calcined by conventional oven and microwave irradiation power.
Figure 4. 21: Comparison of Fe oxide monometallic catalyst and bimetallic oxide
heterogeneous catalyst calcined by conventional oven and microwave on the oxidation
of MB.
0
0.01
0.02
0.03
0.04
0.05
0.06
0.07
0.08
0.09
0.1
0 20 40 60
1/[
MB
]
Time (min)
Fe MW
Fe oven
Mn MW
Mn oven
Co MW
Co oven
Cu MW
0
10
20
30
40
50
60
70
80
90
100
0 10 20 30 40 50 60
Tota
l % r
em
ova
l
Time(min)
Fe MW
Fe oven
FeMnMW
FeMnoven
FeCo MW
FeCooven
FeCu Mw
FeCuoven
Page 73
58
Figure 4. 22: Pseudo-second-order Fe oxide monometallic catalyst and bimetallic oxide
heterogeneous catalyst calcined by conventional oven and microwave.
Figure 4. 23: Comparison between Fe monometallic with bimetallic catalysts calcined by
MW.
0
0.02
0.04
0.06
0.08
0.1
0.12
0 10 20 30 40 50 60
1/[
MB
]
Time (min)
Fe MW
Fe oven
FeMn MW
FeMn oven
FeCo MW
FeCo oven
FeCu MW
FeCu oven
0
10
20
30
40
50
60
70
80
90
100
0 10 20 30 40 50 60
Tota
l (%
) re
mo
val
Time (min)
Fe FeMn FeCo FeCu
Page 74
59
Table 4. 5: R2 of the pseudo first order and second order reaction kinetics and their k values and the percentage removal
after Fenton reaction.
Conventional Microwave
Catalyst
Rate constant for a first order (min-1)
R2 for first order
Rate constant for second order (ppm-
1.min-1)
R2 for second order
Total % removal
Rate constant for a first order (min-1)
R2 for
first order
Rate constant for second order (ppm-
1.min-1)
R2 for second order
Total % removal
Fe
2.9×10⁻³
0.8309
5.0×10⁻⁵
0.8325
48.40
4.0×10⁻³
0.9387
7.0×10⁻⁵
0.9531
47.50
Mn
3.5×10⁻²
0.8584
3.3×10⁻³
0.9426
73.00
2.2×10⁻²
0.9409
1.1×10⁻³
0.9896
89.05
Co
3.3×10⁻⁴
0.9169
5.0×10⁻⁵
0.9218
38.30
3.4×10⁻³
0.8032
6.0×10⁻⁵
0.8253
47.10
Cu
8.9×10⁻³
0.9691
2.0×10⁻⁴
0.9871
54.95
2.3×10⁻³
0.9360
3.0×10⁻⁵
0.9463
31.08
FeMn
2.4×10⁻²
0.9902
7.0×10⁻⁴
0.9596
81.80
2.7×10⁻²
0.9968
1.3×10⁻³
0.9389
89.60
FeCo
3.5×10⁻³
0.9209
6.0×10⁻⁵
0.9377
48.90
1.3×10⁻²
0.9279
3.0×10⁻³
0.8994
72.00
FeCu
3.5×10⁻³
0.7177
6.0×10⁻⁵
0.8749
66.50
1.9×10⁻²
0.9641
8.0×10⁻³
0.9883
85.90
Page 75
60
4.1.9 Activation energy
Activation energy studies were conducted to determine the effect of temperature on the
discoloration of MB. The study was also done to determine whether the FeMn bimetallic
catalyst lowered the activation energy during the degradation of MB. The results obtained
at three different temperatures (27, 40 and 50°C) using Fe and FeMn catalysts as shown
in Figure 4.14. The results showed that an increase in temperature results in an increase
in the total percentage removal of MB see Figure 4.24(a) for Fe catalyst and Figure
4.25(a) for FeMn catalyst. Li et al. (2016) observed a similar trend and attributed it to the
dependency of the kinetic constants with the reaction temperature (Arrhenius law).
Furthermore, the Arrhenius plot (lnk vs.1/T) shown in Figure 4.24 and Figure 4.25
suggests that the apparent activation energy Ea for MB degradation on Fe (Figure
4.24(b)) and FeMn (Figure 4.25(b)) catalysts was calculated to be 53.58 and 42.95
kJ·mol−1, respectively. These results suggest that the oxidation of MB in an aqueous
solution by this oxidation process requires a lower activation energy, which will lead to a
higher rate constant (Arrhenius equation) and thus a higher rate for the Fenton reaction
is expected.
Page 76
61
Figure 4. 24: The plot of Fe catalyst for (a) Total percentage removal and (b) lnk vs. 1/T.
Figure 4. 25: The plot of FeMn catalyst for (a) Total percentage removal and (b) lnk vs.
1/T.
0
10
20
30
40
50
60
70
80
0 20 40 60
Tota
l % r
em
ova
l
Time (min)
27 °C 40 °C 50 °C
y = -6278.6x + 15.582R² = 0.9081
-6
-5.5
-5
-4.5
-4
-3.5
0.003 0.0031 0.0032 0.0033 0.0034
In k
1/T
a b
y = -5165.2x + 13.503R² = 0.9019
-4
-3.5
-3
-2.5
-2
0.003 0.0031 0.0032 0.0033 0.0034
Ink
1/T
0
20
40
60
80
100
0 20 40 60
Tota
l % r
em
ova
l
Time (min)
27 °C 40 °C 50 °C
c d
Page 77
62
4.1.10 Discussion on the correlation between the crystallite size, ORP, H2O2
decomposition, radical formation and the rate constant.
The effect of the calcination method on the catalyst activity is shown in Figure 4.26. The
catalyst calcined in the microwave had smaller particle sizes than the catalyst prepared
using conventional calcination (see Figure 4.1). The crystallite size of a catalyst is
expected to play a major role in the catalytic activity of a catalyst. Wan et al. (2016) studied
the effect of size on catalytic activity and observed that the increase in the particle size of
the nanoparticles led to a lower catalytic activity. The catalysts with the same chemical
compositions but different crystallite sizes showed that there is an increase in the rate
constant with a decrease in the crystallite size (see Figure 4.26). The catalysts, FeMn
conv, FeCu MW and FeCo MW, have similar crystallite sizes but very different rate
constants. This thus shows that not only the size but also the chemical composition has
an influence on the rate constant.
Figure 4. 26: Crystallite size and k values of bimetallic and Fe monometallic catalyst. Blue
legends: microwave calcination; orange legends: conventional calcination.
0
0.0002
0.0004
0.0006
0.0008
0.001
0.0012
0.0014
4 5 6 7 8 9 10 11 12
k (p
pm
-1.m
in-1
)
Crystallite size (nm)
FeMn MW
FeMn ovenFeCu MW
FeCu oven FeCo oven
FeCo MW
Fe ovenFe MW
Page 78
63
Fontecha-Cámara et al. (2016) reported that the leached metal ions during the Fenton
reaction can act as homogeneous Fenton catalysts and therefore enhance the oxidation
of methylene blue. The measured MB degradation or mineralization is thus catalysed by
both Fenton mechanisms, heterogeneous and homogeneous. An increase in the amount
of metal ions that leached is expected to increase the total rate of reaction. Figure 4.13
and Figure 4.14 presents the total metal ions concentration that leached. The results
show that the FeMn bimetallic catalyst leaches the most compared to other bimetallic
catalysts. Both Fe and Mn metal ions leach the most. On the other hand, the FeMn
catalyst showed a higher percentage removal of up to 89.6% for the MB degradation.
However, in this study it was realized in Figure 4.27 that the Co catalyst leached more
compared to FeMn and yet the Co catalyst exhibited lower catalytic activity. Similarly, the
Cu catalyst leached more compared to FeCo and FeCu and yet showed lower activity for
the removal of MB. This indicates that the amount of leached metal ions did not play a
major role during the Fenton reaction. No clear trend was observed in Figure 4.27(a)
showing that the amount of leached metal ions does not explain the differences in the
catalytic activities. This suggests that the higher catalytic activity of FeMn catalyst might
not only be due to the leaching of this catalyst. However, when the leaching of metal ions
was tested under the same conditions there was no linear relationship between the
leached metal ion and the rate constant. This indicates that the leaching of metal ions
was not the only effect that contributed to the catalytic activity of FeMn. The higher
leaching of FeMn catalyst might be due to its smaller metal oxide particle size in
comparison to the other catalysts. According to Rey et al. (2009), the smaller metal oxide
particles leaches more than larger particles. The FeMn has the smallest nanoparticles as
determined from XRD and it may explain why this catalyst leached the most.
Page 79
64
Figure 4. 27: Leaching concentration during the (a) Fenton reaction vs the rate constant
(b) when the catalysts were dispersed in oxalic acid vs the rate constant.
The ORP results showed that Fe, FeCo and FeCu catalysts exhibits a decrease in the
ORP potential values. However, in Figure 4.28 it was observed that there was no linear
relationship between the reaction constant and ORP potentials (mV). Although FeCu and
FeCo showed the highest ORP with similar potential values there is a significant
difference in rate constant of these catalysts. On the other hand, the FeMn catalyst
showed a lower ORP potential and high catalytic activity. Lastly the Fe catalyst showed
the lowest ORP potential and this catalyst exhibits the lowest catalytic activity.
0
0.0002
0.0004
0.0006
0.0008
0.001
0.0012
0.0014
0 10 20 30 40 50
k (p
pm
-1.m
in-1
)
Total conc (ppm)
Fe
FeCo
FeMn
FeCu
Mn
CoCu
a
0
0.0002
0.0004
0.0006
0.0008
0.001
0.0012
0.0014
0 50 100 150 200 250
k (p
pm
-1.m
in-1
)
Total conc (ppm)
Co
Mn
FeCo
FeCu
FeCo
Mn
FeCo
FeCu
FeMn
FeCu
b
Page 80
65
Figure 4. 28: Correlation of the average ORP values with the rate constant of the Fenton
reaction.
A higher radical concentration may be expected to lead to a higher rate of degradation of
the methylene blue by the Fenton reaction. The radical determination experiments
showed higher hydroxyl radical generation with the FeCo, Fe and FeCu catalysts than
the FeMn catalyst but the FeMn catalyst had the higher Fenton rate of reaction. No
correlation was found between the amount of radical formation and the rate constant as
shown in Figure 4.29. The amount of radical formation does not explain the high activity
of the MnFe catalyst. According to Ren et al. (2015) the more surface hydroxyl radical
sites occupy in the binding surface of the catalysts the easier is the oxidation reaction to
occur. Therefore, the highest activity of the FeMn catalyst might be due to the formation
of radicals on the surface of the catalysts (Ren et al., 2015) and not in the solution. This
corresponds to the CV results since FeMn catalysts exhibit the highest current during
oxidation and reduction indicating that this catalyst has more active sites on the surface
and should be more capable of generating more radicals on the surface compared to the
other catalysts. The lower activity of the catalysts of FeCo might be due to the generation
of radicals in the reaction solution and not on the catalysts surface.
y = 3E-06x - 0.0005R² = 0.0874
0
0.0002
0.0004
0.0006
0.0008
0.001
0.0012
0.0014
200 250 300 350 400 450 500
k (
pp
m-1
min
-1)
Average potential (mV)
Fe
FeCo
FeCu
FeMn
Page 81
66
Figure 4. 29: Correlation of the radical determination intensity (at 20 min and non-identical
λ) and with the rate constant of the Fenton reaction.
The decomposition of hydrogen peroxide to oxygen and water is an unwanted side
reaction since the oxygen is a weaker oxidizing agent than hydroxyl radicals. A higher
amount of this unwanted side reaction may lead to lower Fenton activity. No indirect
correlation between the rate constant and the percentage decomposition were observed
as shown in Figure 4.30. The FeMn catalyst showed the higher percentage
decomposition of hydrogen peroxide to water and oxygen and the highest activity for the
degradation of methylene blue compared to Fe, Co, Cu, FeCo and FeCu. Therefore the
amount of decomposition of hydrogen peroxide to water and oxygen did not significantly
negatively influenced the rate of the Fenton reaction. The FeMn catalyst showed the
highest decomposition of H2O2 to O2 relative to the other catalysts might be the reason
for the FeMn to have the lowest radical generation intensity as well as the lower ORP
potential values.
y = -2E-07x + 0.0008R² = 0.1169
0
0.0002
0.0004
0.0006
0.0008
0.001
0.0012
0.0014
0 500 1000 1500 2000 2500
k (p
pm
-1m
in-1
)
Intesity (a.u)
FeCu
FeCoFe
FeMn
Page 82
67
Figure 4. 30: Mass loss vs the rate of the reaction.
In addition, the redox pair potentials of Mn3+/Mn2+ (1.51 V) (Costa et al., 2006), Fe3+/Fe2+
(0.77 V), Co3+/Co2+ (1.81 V) (Garrido-Ramírez al., 2016) and Cu2+/Cu+ (0.17 V) (Wang et
al., 2016) of the monometallic catalyst suggests the rate at which these transition metals
will be reduced or oxidized. The smaller the standard potential of the redox pairs the more
they will oxidize and the slower the rate of the reaction since the active species will be
generated at slower rate. Co has higher standard potential compared to Mn, and yet
exhibited lower catalytic activity. The higher activity of manganese monometallic catalyst
compared to that of cobalt monometallic catalyst was attributed to the smaller crystallite
size as shown by XRD (Wan et al., 2016). The XRD also showed the existence of Mn4+.
(Tang et al,. 2019). Mn4+/Mn3+ (0.15 V) oxidation states are unstable and therefore Mn4+
and Mn3+ will be reduced to the Mn2+ which is the most stable oxidation state of Mn.
Lastly, the presence of Co, Cu and Mn in the magnetite structure enhanced the oxidation
of methylene blue. Similar results were observed in previous reports. Wang et al. (2015)
attributed this to the synergistic effect of two metals in close contact. The half reaction in
Appendix D shows that Cu+ can assist the reduction of Fe3+ to Fe2 since this reaction is
y = 1E-04x + 0.0002R² = 0.3007
0
0.0002
0.0004
0.0006
0.0008
0.001
0.0012
0.0014
0 2 4 6 8 10 12
k (p
pm
-1m
in-1
)
Mass loss (%)
FeMn
FeCu
FeCo
Fe
Mn
CoCu
Page 83
68
thermodynamically favourable due to the potential difference of 0.6 v between Fe3+/Fe2+
(0.77 V) and Cu2+/Cu+ (0.17 V) and therefore the electron transfer is enhanced in FeCu
by the redox pairs of Fe3+/Fe2+ and Cu2+/Cu+ (Wang et al. 2016; Garrido-Ramírez al.,
2016). The opposite argument was used for cobalt and manganese than copper. In the
case of cobalt and manganese the iron reduces the cobalt and manganese. The reduction
of Co3+ or Mn2+ , respectively by Fe2+ would be thermodynamically favourable due to the
potential difference of 1.04 V between Fe3+/Fe2+ (0.77 V) and Co3+/Co2+ (1.81), and 0.73
V between Fe3+/Fe2+ (0.77 V) and Mn3+/Mn2+ (1.51 V). Therefore the electron transfer is
enhanced in the case of FeCo and FeMn by the redox cycles of Fe3+/Fe2+ & Co3+/Co2+
and Fe3+/Fe2 & Mn3+/Mn2+, respectively (Costa et al., 2006). However, in the case of
Mn4+/Mn3+ and Fe3+/Fe2+ it is still not clear which metal ion assists the reduction of
another metal ion as this depends on the standard reduction potential utilized. The
explanations of Tang et al. (2019) and Nawaz et al. (2016) for the enhanced catalytic
activity of the bimetallic catalyst contradict each other. Tang et al. (2019) reported that
the standard reduction potential for Mn4+/Mn3+ is 0.15 V and the standard reduction
potential for Fe3+/Fe2+ is 0.77 V these potentials indicate that the Mn3+ will donate
electrons to Fe3+ and therefore Fe3+ will be reduced to Fe2+ due to the gain of electrons
and Mn3+ will be oxidized to Mn4+ due to the loss of electrons. In contrast, Nawaz et al.
(2016) reported that the standard reduction potential for Mn4+/Mn3+ is 0.95 V which is
lower than that of Fe3+/Fe2+ ( 0.77 V). Therefore in this case Fe2+ will assist in the
reduction of Mn4+ to Mn3+. Various redox reaction equations are listed on the Appendix D
showing that there are multiple ways in which the metal ions can be oxidised and reduced
during the Fenton reaction.
In a bimetallic system there are two metal ions responsible for the activation of H2O2 to
produce .OH. However, these two metals also assist the reduction-oxidation cycle of each
other to regenerate the Fenton reagent and therefore the rate at which hydroxyl radicals
are produced is enhanced thus increasing the oxidation rate of MB. This enhanced
reduction oxidation cycle is supported by the cyclic voltammetry results which showed a
smaller peak to peak potential separation.
Page 84
69
4.1.11. Conclusions
Monometallic (Fe, Co, Cu and Mn) and bimetallic (FeCu, FeMn and FeCo) heterogeneous
catalysts supported on silica were prepared using the incipient wetness impregnation
method. These catalysts were calcined either by conventional oven or microwave. The
catalysts were used as Fenton-like catalysts on the oxidation of MB in water.
Monometallic catalyst calcined by the conventional oven exhibited lower catalytic activity
wherein catalyst calcined by microwave exhibited higher catalytic activity during the
oxidation of MB (except for Cu catalyst). The Mn catalyst showed the highest catalytic
activity for the monometallic catalysts for the degradation of MB. The bimetallic catalyst
calcined by the microwave exhibited a higher catalytic activity for the oxidation of MB
compared to the bimetallic catalyst calcined by the conventional oven.
The higher Fenton activity was attributed to the smaller crystallite size of the catalyst
calcined by the MW in comparison to the conventional oven which resulted in the larger
active surface area of the catalysts. The monometallic catalysts calcined by MW had
lower catalytic activities compared to the bimetallic catalysts calcined by the MW. The
crystallite size as well as the chemical composition plays a role in the Fenton activity. The
effect of the chemical composition could be attributed to the existence of a synergetic
effect exhibited by the two metals in the bimetallic catalyst. No peak shifts in the XRD,
and no binding energy changes in the XPS results were observed comparing the
monometallic with the bimetallic catalysts which may indicate that mixed metal oxide
crystals consisting both metals may not have formed.
The cyclovoltammetry results showed shifts in the reduction potentials, different peak to
peak potential separations and different currents for the different catalysts which indicate
that these catalysts exhibit different electrochemical properties. The FeMn catalyst
showed the highest Fenton activity compared to all the catalysts. This catalyst produced
fewer radicals, had a lower ORP and showed higher decomposition of H2O2 to O2
compared to other catalysts and therefore a higher radical formation was not the reason
for the higher activity of the FeMn catalysts.
Page 85
70
The FeMn catalyst had the highest amount of leaching, smallest metal oxide particle size,
a small peak to peak potential separation and the highest current in cyclic voltammogram
in comparison to the other catalysts, and a lower activation energy in comparison to iron
which may explain the higher activity of the catalyst.
Page 86
71
Chapter 5: The effect of the Fe/Mn mass ratio on the catalytic activity of a Fenton
reaction.
This section deals with the preparation of the FeMn catalyst by varying different mass
ratios of Fe and Mn transition metals by keeping the total metal content constant. The
following are the ratios that were studied: Fe, 2Fe1Mn, 1.5Fe1.5Mn, 1Fe2Mn,
0.5Fe2.5Mn, 0.35Fe2.65Mn, 0.25Fe2.75Mn and Mn. These catalysts will be calcined by
microwave irradiation power.
5.1 Characterization
5.1.1 Catalyst characterization using XRD.
All the samples in Figure 5.1 displayed a broad peak at 23.2⁰ and this peak was the
indication of the presence of silica on the catalyst. A similar peak was also observed by
Santos et al. (2016).The XRD results of the iron Fe oxide monometallic catalyst showed
the existence of a single crystallographic phase corresponding to Hematite (Fe2O3) which
was identified by the reflection in the XRD pattern with card number 00-033-0664.
The manganese monometallic oxide heterogeneous catalyst was also analysed and
showed a single crystallographic phase corresponding to Akhtenskite (MnO2), which
corresponded to the diffraction peaks of MnO2 with card number 00-024-0735 (see Figure
5.1.).
Figure 5.2 showed that as the percentage of manganese in different Fe-Mn catalysts
increases, there was no significant peak shift observed. Since the peaks for iron oxide
and manganese oxide are close to each other in the region 35-37° and the peaks are
broad due to the smaller particle sizes, the peaks at a different position (between the iron
oxide and manganese oxide peaks) observed for the 2Fe1Mn and 1.5Fe1.5Fe catalysts
are more likely to be the combination of two peaks than shifts due to the formation of a
mixed oxide. This is supported by the similar peak positions for the 1Fe2Mn, 0.5Fe2.5Mn,
Page 87
72
0.35Fe2.65Mn and 0.25Fe2.75Mn catalysts as shown in Figure 5.2. Similar results were
observed by Wang et al., (2016). The sizes of the catalysts were also calculated (Table
5.1) and no trend was observed when varying different mass ratios of Fe-Mn.
Figure 5. 1: The XRD diffraction pattern for Fe, Fe-Mn at different mass ratios and Mn
catalysts supported on silica.
Page 88
73
Figure 5. 2: The manganese metal content and the peak positions.
Table 5. 1: Crystallite sizes of the prepared catalysts.
Catalyst Manganese content (%) Sizes (nm)
Fe 0 10.6
2Fe1Mn 33 4.4
1,5Fe1,5Mn 50 6.7
1Fe2Mn 66 6.7
0,5Fe2,5Mn 83 6.8
0,35Fe2,65Mn 88 9.9
0,25Fe2,75Mn 92 10.2
Mn 100 5.0
35.7
35.9
36.1
36.3
36.5
36.7
36.9
37.1
37.3
37.5
0 10 20 30 40 50 60 70 80 90 100
Fe p
eak
s (d
egr
ee
s)
Manganese metal content (%)
Page 89
74
5.1.2 Electrochemical characterization of Fe, Mn and 0.35Fe2.65Mn catalysts
During the Fenton reaction, the reduction of the metal oxides is considered the rate
limiting step. Therefore, a higher reduction potential (less negative) may indicate that the
metal oxide will reduce easier. The 0.35Fe2.65Mn catalyst was chosen to be studied its
electrochemical properties since it showed the highest catalytic activity. However, Fe and
Mn catalysts were chosen since they are present in 0.35Fe2.65Mn catalyst. The metal
supported catalysts gave peaks at different potentials with the 0.35Fe2.65Mn catalyst
showing the highest reduction potential peak (Epc) of -0.17 (V). A decrease in the
potential of the Mn and Fe electrode was obtained at -0.20 and -0.18 (V) in the CV curve,
respectively. The difference in the potential values of these catalysts may be attributed to
the low or fast electron transfer rate and the activity of different catalysts (Ren et al.,
2015). The cell potential (Emid) of the 0.35Fe2.65Mn catalyst is also slightly lower than
the Mn and Fe catalyst.
The 0.35Fe2.65Mn catalyst showed the highest intensity current peak compared to the
other catalysts (Table 5.2) which may indicate more active sites on the surface of the
catalysts. The trend was found to be in the following order Mn<Fe<0.35FeMn. According
to Ren et al., (2015) the difference in the activity of these catalysts depend on the
chemical activity and the capacity of the transitive metal ions in the process of the
reduction and oxidation. Wang et al. (2016) attributed this difference to the
electrochemically accessible sites on the surface of the catalysts.
The electron transfer kinetics determines if a reaction is electrochemical reversible
(Elgrishi et al., 2017). For an electrochemical reversible reaction, the ratio of the current
anode (Ia) to current cathode (Ic) must be equal to 1.00 (Elgrishi et al., 2017). The electron
transfer for all the catalysts was chemically irreversible since the ratio is less than 1 as
presented in Table 5.2. The reversibility trend was in the following order
Mn<Fe<0.35Fe2.65Mn. In addition, the electron transfer for all the catalysts was
electrochemically irreversible since the peak to peak separation is larger than 57 mV as
presented in Table 5.2 indicating that the rate of oxidation-reduction is slow.
Page 90
75
The smaller peak separation for the 0.35Fe2.65Mn catalyst in comparison to the other
catalysts may indicate the continuous oxidation-reduction process that happens during
the Fenton reaction may be faster for the 0.35Fe2.65Mn catalyst leading to a more active
catalyst.
Table 5. 2: CV potentials for different catalysts
Catalyst Ia
(mA)
Ic
(mA)
Ia/Ic
(mA)
Epa
(mV)
Epc
(mV)
Epc -
Epa (mV)
Emid(Epa+
Epc)/2
mV)
Fe 0.034 0.041 0.829 -36.90 -227.00 190.10 -131.95
0.35Fe2.65Mn 0.043 0.049 0.878 -85.00 -173.34 88.34 129.17
Mn 0.028 0.035 0.800 -56.00 -202.70 146.70 129.35
Figure 5. 3: Cyclic voltammograms of Fe, 0.35Fe2.65Mn and Mn catalysts.
Page 91
76
5.2 ORP results
5.2.1 Repeatability using the 0.35Fe2.65Mn catalyst
These experiments were carried out by immersing the ORP probe into the Fenton system.
Repeatability of the ORP was carried out with the catalysts 0.35Fe2.65Mn and the results
are shown in Figure 5.4. The average potential for the five experiments was calculated to
be 241.46 mV with a standard deviation of 1.98 mV (2 standard deviation of 3.96).
Figure 5. 4: The ORP repeatability using 0.35Fe2.65Mn catalyst.
5.2.2. The measurement of ORP using different catalyst.
The results from Figure 5.5 suggested the 0.5Fe2.5Mn and 0.25Fe2.75Mn catalysts have
the same oxidation reduction potential since they exhibit a difference that is less than the
1.98 (2 standard deviation). However, all the other catalysts have different oxidation
reduction potentials as they exhibit a larger difference than 2-standard deviation.
From Figure 5.5 the ORP results show that with Mn, 0.5F02.5eMn, 0.35Fe2.65Mn and
0.25Fe0.75Mn catalysts there was a decrease on the ORP values (between 0 and 30
200
220
240
260
280
300
320
340
0 10 20 30 40 50 60
Po
ten
tial
(m
V)
Time (min)
Page 92
77
min) after this interval there was no further decrease. However, this was different in the
case of 2Fe1Mn catalyst as this catalyst exhibited a slight increase in the ORP between
2.5 and 60 min. According to Kim et al. (2004) the increase in the ORP potential indicate
the existence of the Fenton reagents that increase the radical formation in the reaction.
Lastly, the 1.5Fe1.5Mn and 1Fe2Mn catalysts showed a decrease in the ORP potentials
between 0 and 20 min. However, after 20 min there was an increase in the ORP potentials
(20 to 30 min) after there was no further increase or decrease in the potential. A sharp
decrease indicated the completion of the Fenton reagent but this was not observed in
Figure 5.5 (He et al., 2009).
Figure 5. 5: The ORP measurements for the results.
5.3 Radical determination
The radical determination results in Figures 5.6 and 5.7 shows that 0.35Fe2.65Mn
catalyst generated more radicals compared to the Mn catalyst. The produced radicals by
both reactions increased with time. In contrast, the Fe catalyst produced the highest
200
220
240
260
280
300
320
340
360
380
400
0 10 20 30 40 50 60
Vo
ltag
e (
mV
)
Time (Min)
Fe 2Fe1Mn 1.5Fe1.5Mn 1Fe2Mn
0.5Fe2.5Mn 0,35Fe2,65Mn 0.25Fe2.75Mn Mn
Page 93
78
radical concentration compared to Mn and 0.35Fe2.65Mn catalyst; however, the
concentration of radicals decreased with time.
Figure 5. 6: Radical determination of (a) 0.35Fe2.65Mn and (b) Mn catalyst.
Figure 5. 7: Radical determination of Fe, 0.35Fe2.65Mn and Mn catalyst.
0
100
200
300
400
500
600
0 5 10 20
Inte
nsi
ty (
a.u
)
Time (min)
Fe 0.35Fe2.65Mn Mn
a b
Page 94
79
5.4 Decomposition of hydrogen peroxide to oxygen (Mass loss)
5.4.1 Mass loss repeatability using 0.35Fe2.65Mn catalyst
The mass loss repeatability studies were performed using the 2Fe1Mn bimetallic catalyst.
Five experimental replicates were performed and each run was started with a new
catalyst. The results are shown in Figure 5.8. The average final mass was 18.70 g with a
standard deviation (σ) of 1.00 g obtained after 60 min. The 2σ was calculated to be equal
to 2.00g.
Figure 5. 8: Decomposition of H2O2 to O2 using 0.35Fe2.65Mn mass ratio.
5.4.2 Mass loss with different catalysts
From Figure 5.9 the results show that the statistical difference between Fe and
0.5Fe2.5Mn catalysts is 1.90 g which is smaller than the 2.00 g (2σ). This suggests that
all catalysts found between these two catalysts decomposes H2O2 to O2 in a similar
manner. However, the above-mentioned catalysts decomposed H2O2 to O2 differently
compared to the Mn catalysts, since the difference between these catalysts was above
the 2σ. These results also show that 1.5Fe1.5Mn and 0.35Fe2.65Mn catalysts showed
11
13
15
17
19
21
23
25
0 10 20 30 40 50 60
Mas
s lo
ss (
g)
Time (min)
0.35Fe2.65Mn 0.35Fe2.65Mn 0.35Fe2.65Mn
0.35Fe2.65Mn 0.35Fe2.65Mn
Page 95
80
similar H2O2 decomposition mass values (statistical difference is 1.65 g). On the other
hand, these catalysts showed a different H2O2 decomposition compared to 0.25Fe2.75Mn
catalyst with a statistical difference of 2.65 g. The observed trend for these experiments
was such that when the Mn mass ratio is increased in a bimetallic catalyst there was an
increase in the decomposition of H2O2 to O2.
Figure 5. 9: Decomposition of H2O2 to oxygen using different mass ratio catalysts.
5.5 Leaching
5.5.1 Repeatability
Repeatability studies (see Figures 5.10, 5.11 and 5.13) were performed using the
0,35Fe2,65Mn bimetallic oxide catalyst. Each run was started with a new catalyst. The
average concentration and the standard deviation were calculated and presented in Table
5.3.
17
18
19
20
21
22
23
24
25
0 10 20 30 40 50 60
Mas
s (g
)
Time (min)
2Fe1Mn 1.5Fe1.5Mn 1Fe2Mn 0.5Fe2.5Mn
0.35Fe2.65Mn 0.25Fe2.75Mn Mn-O
Page 96
81
Figure 5. 10: Leaching repeatability of (a) Leaching of the catalysts Fe ion using oxalic
acid.
Figure 5. 11: The leaching of catalysts for Fe during the degradation of methylene blue.
91.11
94.06
92.50 92.5093.01
89.590
90.591
91.592
92.593
93.594
94.5Fe
co
nc
(pp
m)
Same catalyst at different runs
1.07
0.49
0.78
0.590.68
0
0.2
0.4
0.6
0.8
1
1.2
0,35Fe2,65Mn0,35Fe2,65Mn0,35Fe2,65Mn0,35Fe2,65Mn0,35Fe2,65Mn
Fe c
on
c (p
pm
)
Same catalyst at different runs
Page 97
82
Figure 5. 12: The leaching of the catalyst for Mn during the degradation and using oxalic
acid.
Table 5. 3: Statistics for the leaching repeatability results
Experiment and
metal ion
Mean σ
2σ
Fe oxalic acid
92.64 0.22 0.44
Fe degradation 0.72
1.06 2.12
Mn oxalic acid 61.60
1.48 2.96
Mn degradation 48.89
2.20 4.40
60.29 60.0262.62 61.62 63.46
52.4546.70
49.29 48.23 47.77
0
10
20
30
40
50
60
70
0,35Fe2,65Mn 0,35Fe2,65Mn 0,35Fe2,65Mn 0,35Fe2,65Mn 0,35Fe2,65Mn
Mn
co
nc
(pp
m)
Same catalyst at different runs
Oxalic acid Degradation
Page 98
83
5.5.2 Leaching test from different mass ratios
5.5.2.1 Fe leaching metal ions
Leaching of Fe ions from the catalysts prepared by varying different mass ratios of Fe
and Mn during the Fenton reaction was determined. The results are presented in Figure
5.13. The results obtained from these experiments exhibit a statically difference of 1.44
ppm which is less than 2σ. Statistically this implies that these catalysts showed similar
Fe ion leaching concentrations. The leaching test was also done under the same
conditions (catalysts dispersed in oxalic acid). The results from Figure 5.14 shows that
these catalysts have different leaching concentrations since the statistical difference
between Fe and 2Fe1Mn is larger (20.07 ppm) than 2σ as shown in Table 5.2. The trend
was found to be in the following order
2Fe1Mn>Fe>0.5Fe2.5Mn>1.5Fe1.5Mn>1Fe2Mn>0.35Fe2.65Mn>0.25Fe2.75Mn.
The leached Fe ion concentrations compares well to the limits set by the World Health
Organisation (WHO) where the Fe limit is 0.3 ppm (see Table 4.3), and the results were
all above the limit.
5.5.2.2 Leaching of Mn ions
Leaching of Mn metal ions during degradation were also determined (Figure 5.15). The
statistical difference between Mn, 2Fe1Mn, 0.5Fe2.5Mn, 0.35Fe2.75Mn and
0.25Fe2.75Mn is less than 2σ (4.40 ppm). This suggested that the above-mentioned
catalyst have similar leached concentrations. However, the difference between Mn,
1.5Fe1.5Mn, 1Fe2Mn0.5Fe2.5Mn is larger than 2σ and this implies that these catalysts
have different leached concentrations. The trend measured to be in the following:
Mn=2Fe1Mn<1Fe2Mn<1.5Fe1.5Mn<0.5Fe2.5Mn=0.25Fe2.75Mn=0.35Fe2.65Mn.
When the catalysts were dispersed in oxalic acid (Figure 5.15), the results showed that
0.5Fe2.5Mn,0.35Fe2.65Mn, and 0.25Fe2.75Mn have similar leached Mn concentrations
when compared to 2σ. On the other hand, Mn, 2Fe1mn, 1.5fe1.5Mn 1Fe2Mn and
Page 99
84
0.5Fe2.5Mn catalysts showed different Mn leaching concentrations. The leaching trend
was observed to be in the following order:
Mn<2Fe1Mn<1.5Fe1.5Mn<0.25Fe2.75Mn=0.5Fe2.5Mn=0.35Fe2.65Mn.
The leached Mn ions after degradation and after being dispersed in oxalic acid were
above the WHO limit as presented in Table 4.4.
Figure 5. 13: Leaching concentrations of Fe ions during the degradation of methylene
blue.
Figure 5. 14: Leaching concentrations of Fe ions using oxalic acid.
1.29
2.35
1.36
0.931.10 1.07
0.91
0
0.5
1
1.5
2
2.5
Co
nce
ntr
atio
n (
pp
m)
Catalyst
132.97
153.04
100.55 96.22103.73
91.11 89.55
0
20
40
60
80
100
120
140
160
Co
nce
ntr
atio
n (
pp
m)
Catalyst
Page 100
85
Figure 5. 15: Leaching concentrations of Mn ions when using oxalic acid and during the
degradation.
5.6 Degradation of MB
5.6.1 Degradation repeatability using 0,35Fe2,65Mn.
Repeatability results in
Figure 4. 17 were performed using the 0,35Fe2,65Mn bimetallic oxide catalyst. Each
replicate was started with a new catalyst. The percentage removal of methylene blue is
shown in Figure 5.16. Note that the percentage removal does not start at zero and this is
due to 60 min adsorption that took place before catalysis, as described in Chapter 3.4.
An average percentage removal of 94.6% after 60 min with a standard deviation of 5.83
x10-3 min-1 was obtained. The R2 for the pseudo-first order is close to one compared to
the R2 for the pseudo-second order. Therefore, the pseudo-first order kinetic model is
more favourable. In Figure 5.17, the pseudo-first-order kinetic model is plotted and an
average rate constant of 4.30 x10⁻² min-1 with a standard deviation of 5.83 x10⁻³ min-1 was
obtained.
44.00
54.8259.88
53.9960.39 60.29 60.64
28.00 26.18
38.0942.75
49.36 52.45 52.63
0
10
20
30
40
50
60
70C
on
cen
trat
ion
(p
pm
)
Catalyst
Oxalic acid Degradation
Page 101
86
Figure 5. 16: Degradation repeatability experiments for the total percentage removal of
MB using the 0.35Fe2.65Mn catalyst.
Figure 5. 17: Pseudo-first-order reaction kinetics for the repeatability experiments.
0
20
40
60
80
100
120
0 10 20 30 40 50 60
Tota
l % r
em
ova
l
Time (min)
0
0.5
1
1.5
2
2.5
3
3.5
4
4.5
5
0 10 20 30 40 50 60
Ln [
MB
]
Time (min)
Page 102
87
5.6.2 Degradation of methylene blue with different catalyst ratios
The degradation of methylene blue was done in order to determine the catalytic activity
of the catalysts prepared by varying different mass ratios. The results are displayed in
Figures 5.18 and 5.19. Mn and 2Fe1Mn catalysts have similar catalytic activities since
the difference between these catalysts is 0 which is less than 0.011 (2 standard deviation).
The difference between Fe, Mn, 0.25Fe2.75Mn, 0.35Fe2.65Mn, 1Fe2Mn and 05Fe2.5Mn
catalysts is larger than 2 standard deviations and this implies that these catalysts have
different catalytic activities.
Figure 5. 18: The percentage removal for the degradation of methylene blue using the
different catalysts of different ratios of each metal supported on silica in the presence of
H2O2.
0
10
20
30
40
50
60
70
80
90
100
0 10 20 30 40 50 60
Tota
l % r
em
ova
l
Time (min)
Fe 2Fe1Mn 1.5Fe1.5mn 1Fe2Mn
0.5Fe2.5Mn 0.35Fe2.65Mn 0.25Fe2.75 Mn
Page 103
88
Figure 5. 19: Pseudo first order reaction kinetics.
The degradation of methylene blue followed the first order reaction as seen in Table 5
where the R2 for the first order is close to 1 whereas the R2 for the second order is lower
than 1. The reaction rates of each catalyst were also calculated as presented on Table
5.4 which shows that the reaction rates of Fe and Mn catalysts are very low while the
bimetallic catalyst displayed higher reaction rates. This is also due to the effect of the
synergy of the two incorporated catalysts which lead to catalytic activities higher than
what was expected due to the combined effect of the metal oxides. This phenomenon
can be observed in Figure 5.20, where the Fe and Mn monometallic catalysts display
lower catalytic activities compared to the bimetallic catalysts. It can also be observed that
the increase in the manganese metal content increased the catalytic activity of the
bimetallic catalysts.
0
0.5
1
1.5
2
2.5
3
3.5
4
4.5
5
0 10 20 30 40 50 60
Ln [
MB
]
Time min)
Fe2Fe1Mn1.5Fe1.5Mn1Fe2Mn0.5Fe2.5Mn0.35Fe2.65Mn0.25Fe2.75MnMn
Page 104
89
Table 5. 4: The reaction rates and R2 of each catalyst.
Catalyst k (min-1) R² for first
order reaction
k (ppm-1min-
2)
R2 for second
order reaction
Fe 4 x10⁻³ 0,9385 7 x10⁻⁵ 0,9531
2Fe1Mn 2.7 x10⁻² 0,9968 1.3 x10⁻³ 0,9390
1.5Fe1.5Mn 4.3 x10⁻² 0,9929 5.1 x10⁻³ 0,8403
1Fe2Mn 4.8 x10⁻² 0,9973 5.1 x10⁻³ 0,8732
0,5Fe2,5Mn 5.6 x10⁻² 0,9759 6.2 x10⁻³ 0,8625
0,35Fe2,65Mn 6.0 x10⁻² 0,9770 4.5 x10⁻³ 0,9150
0,25Fe2,75Mn 5.8 x10⁻² 0,9941 3.9 x10⁻³ 0,9437
Mn 3.5 x10⁻² 0,9409 1.1 x10⁻³ 0,9896
Figure 5. 20: The effect of increasing the fraction of Mn and decreasing that of Fe on the
bimetallic catalyst.
0
0.01
0.02
0.03
0.04
0.05
0.06
0.07
0 0.2 0.4 0.6 0.8 1
Ln C
t
Fraction
Synergistic effect
Page 105
90
5.7 Discussion on the correlation between the crystallite size, ORP, H2O2
decomposition, radical formation and the rate constant.
Previous studies reported that the particle size of the catalyst plays an important role on
the catalytic activity of a Fenton reaction (Chen et al., 2017; Wan et al., 2016). Chen et
al. (2017) reported that magnetic nanoparticles with a smaller particle size showed higher
catalytic activity on the removal of Rhodamine B than the other. In this study, it was
observed that there was no linear trend between the particle size and the rate constant
and this may be explained by the different chemical compositions of the catalysts. In
Figure 5.21 it was observed that the 2Fe1Mn catalyst showed the smallest crystallite size
and yet exhibited lower catalytic activity compared to the 0.35Fe2.65mn catalyst with a
larger particle size. This indicates that in this study it was not only the particle size that
influenced the rate of the reaction but that the chemical composition plays an important
role. Wang et al. (2016) investigated the effect of Fe/Cu mass ratio on the catalytic activity
of a Fenton degradation of a dye. From their results they observed that the catalytic
activity of a Fenton reaction depends highly upon the Fe/Cu ratio. They further observed
that the optimum Fe/Cu mass ratio was 2Fe6Cu. Similarly, in Figure 5.13 it was observed
that increasing the Mn fraction and decreasing the Fe fraction increased the Fenton
activity. Wang et al. (2016) attributed this phenomenon to the synergistic effect of a
bimetallic catalyst.
Page 106
91
Figure 5. 21: Crystallite size and k values of different Fe:Mn bimetallic catalyst at mass
ratios.
There was no linear correlation observed from Figure 5.22 on the radical generation and
the rate constant. Since Fe catalysts showed the highest radical formation and lower rate
constant compared to 0.35Fe2.65Mn that showed the lower radical formation and a high
catalytic activity.
y = 0.0012x + 0.0308R² = 0.0201
0
0.01
0.02
0.03
0.04
0.05
0.06
0.07
0 2 4 6 8 10 12
k (m
in-1
)
Crystallite size (nm)
Fe
2Fe1MnMn
1.5Fe1.5Mn1Fe2Mn
0.5Fe2.5Mn0.25Fe2.75Mn
0.35Fe2.65Mn
Page 107
92
Figure 5. 22: Correlation of the radical determination intensity (at 20 min and at a
wavelength of 409.87 nm) and with the rate constant of the Fenton reaction.
The other effect that might increase the catalytic activity of a Fenton reaction is the
leaching of the metal ions in the solution (Pariente et al., 2015; Pariente et al., 2015).
Fontecha-Cámara et al. (2016) reported that the leaching of metal ion io the solution can
act as a homogeneous catalyst. The catalytic activity of a Fenton reaction might be
enhanced since it is catalysed by two reaction mechanisms (heterogeneous and
homogeneous). Herein it was observed in Figure 5.23 that there was a linear correlation
between the rate constant and the leaching of metal ions during the degradation of MB.
However, when the leaching of metal ions was tested under the same conditions (same
oxalic acid concentration) there was no linear relationship between the leached metal ion
and the rate constant. This may indicate that the higher activity of the catalysts, causing
higher concentrations of acids for the degraded MB (see degradation pathway of MB in
Section 2.2) resulted in the higher amounts of leaching. One may speculate that it was
thus not the higher amounts of leaching that resulted in the higher catalytic activity due to
the contribution of homogenous catalysis.
y = -0.0004x + 0.1745R² = 0.3985
0
0.01
0.02
0.03
0.04
0.05
0.06
0.07
320 340 360 380 400 420 440
Inte
nsi
ty (
a.u
)
Intensity (a.u)
Fe
Mn
0.35Fe2.65Mn
Page 108
93
Figure 5. 23: Leaching concentration during the (a) Fenton reaction vs the rate constant
(b) when the catalysts were dispersed in oxalic acid vs the rate constant.
The decomposition of H2O2 to O2 and water is unwanted since it may lead to the lower
catalytic activity of the Fenton reaction if the concentration of hydrogen peroxide is
significantly decreased due to the unwanted side reaction. However, the mass loss
experiments do not explain the highest catalytic activity of 0.25Fe2.65Mn ratio. This
catalyst exhibits a high mass loss percentage and highest rate constant than the other
catalysts (Fe, 2Fe1Mn, mn, 1.5Fe1.5Mn, 1Fe2Mn and 0.5Fe2.5Mn). Therefore, in this
case the unwanted side reaction did not affect the rate constant for the Fenton reaction,
and one may thus deduce that the concentration of the H2O2 was not significantly affected
due to the decomposition of H2O2 to O2 and H2O. The correlation observed in Figure 5.24
may be explained by the fact that the same catalytic sites responsible for the Fenton
reaction are also responsible for the decomposition side reaction.
a b
Page 109
94
Figure 5. 24: Correlation between the mass loss and the rate of the reaction.
In Figure 5.25 it was observed that there was no linear relationship between the reaction
constant and ORP potentials (mV). Since Fe and 1Fe2Mn showed the highest ORP with
similar potential values and yet there is a significant difference in rate constant of these
catalysts. On the other hand, 0.35Fe2.65Mn catalyst showed a lower similar ORP
potential and high catalytic activity this corresponds to the results obtained by He et al.
(2009). Lastly the Mn catalyst showed the lowest ORP potential and this catalyst exhibits
the lowest catalytic activity.
Figure 5. 25: Correlation of the average ORP values with the rate constant of the Fenton
reaction.
y = 0.003x + 0.0116R² = 0.8297
0
0.01
0.02
0.03
0.04
0.05
0.06
0.07
0 5 10 15 20
k (m
in-1
)
Mass loss %
2Fe1MnMn
1.5Fe1.5Mn
1Fe2Mn0.5Fe2.5Mn
0.35Fe2.65Mn
0.25Fe2.75Mn
Fe
y = -0.0002x + 0.1044R² = 0.1761
0
0.01
0.02
0.03
0.04
0.05
0.06
150 200 250 300 350 400
k (m
in-1
)
Average potential (mV)
Fe
Mn2Fe1Mn
1.5Fe1.5Mn
1Fe2Mn0.5Fe2.5Mn
0.25Fe2.75Mn0.35Fe2.65Mn
Page 110
95
5.8 Conclusions
The results showed that the crystallite size of the catalyst did not play a major role on the
catalytic activity when the Fe/Mn mass ratios were varied and that the chemical
composition of the catalyst caused the differences in the catalytic activity. A synergistic
effect between the Mn and Fe was observed since the bimetallic catalysts had an activity
higher than the combined effect of the individual metal oxides. The synergistic effect may
have been due to enhanced oxidation-reduction behaviour of the bimetallic catalysts
during the Fenton reaction as indicated by the cyclovoltammetry results. The current was
higher which indicated more catalytic active sites. The reduction potential was higher (less
negative) for the bimetallic catalyst and the peak separation was smaller which may
indicate an enhanced oxidation-reduction cycle which may explain the higher catalytic
activity. Homogenous catalysis may have contributed to an increase in the activity of the
catalyst since the catalysts that leached more and had a higher catalytic activity.
However, based on the leaching tests at similar oxalic acid concentration it was argued
that the higher activity of the catalyst leads to higher concentrations of acid intermediates
from the MB degradation causing an increase in leaching.
The ORP potential and radical formation did not show a linear correlation with the rate
constant, since 0.35Fe2.35Mn catalyst showed the lowest ORP potential and exhibited a
higher catalytic activity than the Fe catalyst. Lastly the 0.35Fe2.35Mn catalyst showed
lower radicals produced compared to the Fe catalyst. Therefore, the ORP and radical
formation do not explain the differences between the catalysts.
Page 111
96
Chapter 6: The effect of microwave irradiation time and power.
The size of the metal oxide particles supported on silica depends on the irradiation time
and microwave power (Reubroycharoen et al., 2007). In this section the effect of
irradiation time and the microwave power on the preparation 0.35Fe2.65Mn and their
effect on the catalytic activity during the Fenton reaction was studied.
6.1 XRD
The microwave calcination irradiation times of 10, 20 and 30 minutes were tested for
three power settings of 600, 700 and 800 W.
The peaks in the XRD patters in Figure 6.1 could be assigned to MnO2 (00-024-0735).
Very small broad peaks for MnO2 were observed and the calculated sizes are shown in
Table 6.1. No diffraction peaks for iron oxide was observed. This may be attributed to the
low iron oxide loading and small iron oxide particles (Wang et al., 2015).
Figure 6.2 and Table 6.1 shows that a microwave power of 600W yields the smallest
manganese oxide nanoparticles for most of the catalysts. There is an increase in the
manganese oxide particle size with an increase in the radiation time for the 700W and
800 W microwave power settings as seen in Figure 6.2 and Table 6.1. However, when
the lowest microwave power of 600 W was used, the increase in radiation time did not
have a significant effect on the particle size of the catalyst.
These observations may be explained by an increase in the kinetic energy when the
temperature and collision between the manganese oxide particles led to agglomeration
and sintering of the particles (Parida and Parija., 2006; Mousavi et al., 2015).
Page 112
97
Figure 6. 1: The XRD diffraction pattern for catalysts prepared using different microwave
calcination procedures.
Table 6. 1: XRD crystallite size (nm) calculated at 37°C.
Catalyst 10 min 20 min 30 min
600 W 11.03 12.97 12.17
700 W 15.25 18.21 21.07
800W 10.23 13.53 18.65
Page 113
98
Figure 6. 2: The effect of the microwave time and power during calcination.
6.2 Fenton reaction
The results for the catalytic activity during the degradation of MB are displayed in Figure
6.3. The percentage removal of MB after 1 hour was about 93.3% for all the catalysts as
shown in Figure 6.3. However, the rate at which these reactions took place was different
(Figure 6.4). The data for most of these experiments fit the pseudo first order better than
pseudo second order based on the higher R2 values as shown in Figure 6.4 and Table
6.2. Most of the catalysts calcined at 600 W were more active catalyst than the catalysts
calcined at higher microwave powers. This can be explained by the catalyst calcined at
600W having the smallest crystallite sizes (see Figure 6.2). Figure 6.5 shows that the
catalytic activity of a Fenton reaction decreases with increasing calcination time (min). A
similar trend was observed by Reubroycharoen et al. (2007). These observations were
attributed to an increase in the crystallite size of the particles as the irradiation time was
increased. In Figure 6.6 the effect of the microwave time and power during calcination
are combined and it shows that there is an inverse correlation between the size and the
activity of the catalysts with the same chemical composition.
5
7
9
11
13
15
17
19
21
23
10 15 20 25 30
Size
(n
m)
Time (minutes)
600 W 700 W 800 W
Page 114
99
Figure 6. 3: The degradation of MB total percentage removal.
Figure 6. 4: Pseudo first order reaction kinetics.
0102030405060708090
100
0 10 20 30 40 50 60
Tota
l % r
em
ova
l
Time (min)
600W 10min 600W 20min 600W 30min
700W 10min 700W 20min 700W 30min
800W 10min 800W 20min 800W 30min
0
0.5
1
1.5
2
2.5
3
3.5
4
4.5
5
0 10 20 30 40 50 60
Ln[M
B]
Time (min)
600W 10min
600W 20min
600W 30min
700W 10min
700W 20min
700W 30min
800W 10min
800W 20min
800W 30min
Page 115
100
Figure 6. 5: Rate constant of different catalysts at different time intervals.
Figure 6. 6: Effect of crystallite size on the rate constant (activity) of the catalysts.
0.03
0.035
0.04
0.045
0.05
0.055
10 15 20 25 30
Rat
e c
on
stan
t (m
in-1
)
Time (minutes)
600 W 700 W 800 W
0.02
0.025
0.03
0.035
0.04
0.045
0.05
0.055
0.06
9 11 13 15 17 19 21 23
Rat
e c
on
stan
t (m
in-1
)
Size (nm)
Page 116
101
Table 6. 2: R2 of the pseudo first order and second order reaction kinetics and their k
values (min-1).
Catalyst
power and
time
Rate constant
first order
(min-1)
R2
first order
Rate constant
second order
(ppm.min-2)
R2
second order
600W 10 min 4.9 x10⁻² 0.9516 5.2 x10⁻³ 0.9388
600W 20 min 4.2 x10⁻² 0.9730 3.1 x10⁻³ 0.9250
600W 30 min 4.1 x10⁻² 0.9701 2.7 x10⁻³ 0.9532
700W 10 min 4.0 x10⁻² 0.9725 2.6 x10⁻³ 0.9336
700W 20 min 3.8 x10⁻² 0.9572 2.1 x10⁻³ 0.9376
700W 30 min 3.5 x10⁻² 0.9870 2.1 x10⁻³ 0.9276
800W 10 min 5.0 x10⁻² 0.9879 1.1 x10⁻² 0.8910
800W 20 min 3.9 x10⁻² 0.8647 3.0 x10⁻³ 0.9115
800W 30 min 3.6 x10⁻² 0.9278 2.2 x10⁻³ 0.9913
6.3 Conclusions
Most of the catalyst calcined at 600 W yielded more active catalysts than those calcined
at higher microwave powers. This may be explained by the smaller metal oxide particles
than formed at lower microwave power. An increase in the calcination time at 700W and
800W increased the metal oxide particle size and decreased the activity of the catalyst.
An increase in calcination time at 600W did not affect the catalyst significantly. There is
an inverse correlation between the metal oxide size and the activity of the catalysts with
the same chemical composition.
Page 117
102
Chapter 7: Conclusions and Recommendations
7.1 Conclusions
The manganese oxide catalyst was more active than the iron-, cobalt- and copper oxide
monometallic catalysts and the FeMn oxide catalysts were more active than the FeCo,
FeCu oxide bimetallic catalysts. The iron manganese ratio was optimised and the
0.35Fe2.65Mn was most active of all the catalysts.
The microwave calcination yielded catalysts with smaller crystallite sizes in comparison
to conventional oven calcination. Keeping the chemical composition of the catalysts
constant, the microwave calcined catalysts were more active than the catalysts calcined
in a conventional oven and it can be explained by the smaller metal oxides that formed
using microwave calcination. The microwave time and power were optimised keeping
the chemical composition of the catalyst the same. An increase in the microwave
calcination time and power resulted in an increase in the particle size and a decrease in
the catalytic activity. However, when catalysts with different chemical compositions were
compared, i.e. different metal oxides, different bimetallic combinations and different
iron/manganese ratios, it was observed that the crystallite size was not the only factor
that influenced the rate constant since there was no trend observed between the
crystallite size and the rate constant when the chemical composition varied. This indicates
that the catalytic activity of a Fenton reaction was influenced by both crystallite size and
the chemical composition.
ORP, amount of radical formation, metal ion leaching and mass loss due to the unwanted
decomposition of hydrogen peroxide to oxygen did not explain the differences in the
catalytic activities of the various bimetallic catalysts. The cyclic voltammetry results
showed that the FeMn bimetallic catalyst had the highest current with a small difference
between the peak potentials which may indicate more active sites and that the oxidation-
reduction cycle of the metal ions is more facile for the FeMn bimetallic catalyst in
comparison to the other catalysts. The cyclic voltammetry results may thus explain the
higher activity of the FeMn catalyst. The addition of manganese to the iron catalyst,
Page 118
103
decreased the activation energy of the Fenton reaction, which explains the increase the
rate of reaction for the iron manganese bimetallic catalysts in comparison to the
monometallic iron oxide catalyst.
7.2 Recommendations
The following recommendations are proposed for future studies. The preparation of a
FeMn bimetallic catalyst using a single step method so as to improve the metal support
interaction is recommended. Botas et al. (2010) reported on the preparation of
Fe2O3/SiO2 catalysts via a single step method using co-condensation of silica (TEOS)
with the iron precursor as well as a two-step method where iron chloride was impregnated
on a prepared silica support. Botas et al. (2010) reported that the catalyst prepared by a
single step method showed a lower metal leaching concentration than the catalyst
prepared using impregnation. Furthermore, the preparation of the support material from
bio-waste instead of using commercial support is been recommended to lower the cost
of these catalysts.
Page 119
104
References
AMMAR, H., HINDA, L., MOHAMED, K., ELIMAME, E., CHANTAL, G. & JEAN-MARIE,
H. 2001. Photocatalytic degradation pathway of methylene blue in water. Applied
Catalysis B: Environmental, 31, 157.
ARMSTRONG, D. A., HUIE, R. E., LYMAR, S., KOPPENOL, W. H., MERÉNYI, G., NETA,
P., STANBURY, D. M., STEENKEN, S. & WARDMAN, P. 2013. Standard electrode
potentials involving radicals in aqueous solution: inorganic radicals. Bioinorganic
Reaction Mechanisms, 9, 59-61
ARORA, C., SONI, S., SAHU, S., MITTAL, J., KUMAR, P. & BAJPAI, P. K. 2019. Iron
based metal organic framework for efficient removal of methylene blue dye from industrial
waste. Journal of Molecular Liquids, 284, 343-352.
BELLO, M. M., ABDUL RAMAN, A. A. & ASGHAR, A. 2019. A review on approaches for
addressing the limitations of Fenton oxidation for recalcitrant wastewater treatment.
Process Safety and Environmental Protection, 126, 119-140.
BRILLAS, E., SIRES, I. & OTURAN, M. A. 2009. Electro-Fenton process and related
electrochemical technologies based on Fenton's reaction chemistry. Chemical Reviews,
109, 6570-631.
CARVALHO, M. D., HENRIQUES, F., FERREIRA, L. P., GODINHO, M. & CRUZ, M. M.
2013. Iron oxide nanoparticles: the Influence of synthesis method and size on
composition and magnetic properties. Journal of Solid State Chemistry, 201, 144-152.
CHENNAIAHA, B. L., RASHEEDB, M. A. & PATIL, D. J. 2014. Concentration of heavy
metals in drinking water with emphasis on human health. International Journal of Plant,
Animal and Environmental Sciences, 4, 214.
COSTA, R. C., LELIS, M. F., OLIVEIRA, L. C., FABRIS, J. D., ARDISSON, J. D., RIOS,
R. R., SILVA, C. N. & LAGO, R. M. 2006. Novel active heterogeneous Fenton system
based on Fe3-xMxO4 (Fe, Co, Mn, Ni): the role of M2+ species on the reactivity towards
H2O2 reactions. Journal of Hazardous Materials, 129, 171-8.
Page 120
105
DOS SANTOS, P. L., GUIMARÃES, I. R., MESQUITA, A. M. & GUERREIRO, M. C. 2016.
Copper-doped akaganeite: Application in catalytic Cupro-Fenton reactions for oxidation
of methylene blue. Journal of Molecular Catalysis A: Chemical, 424, 194-202.
ELGRISHI, N., ROUNTREE, K. J., MCCARTHY, B. D., ROUNTREE, E. S., EISENHART,
T. T. & DEMPSEY, J. L. 2017. A Practical Beginner’s Guide to Cyclic Voltammetry.
Journal of Chemical Education, 95, 197-206.
ELSHAFEI, G. M. S., YEHIA, F. Z., ESHAQ, G. & ELMETWALLY, A. E. 2017. Enhanced
degradation of nonylphenol at neutral pH by ultrasonic assisted- heterogeneous Fenton
using nano zero valent metals. Separation and Purification Technology, 178, 122-129.
ELWAKEEL, K. Z., ELGARAHY, A. M. & MOHAMMAD, S. H. 2017. Use of beach bivalve
shells located at Port Said coast (Egypt) as a green approach for methylene blue removal.
Journal of Environmental Chemical Engineering, 5, 578-587.
ESTEVES, L. C., OLIVEIRA, T. R., SOUZA, E. C., JR., BOMFETI, C. A., GONCALVES,
A. M., OLIVEIRA, L. C., BARBOSA, F., JR., PEREIRA, M. C. & RODRIGUES, J. L. 2015.
A fast and environment-friendly method for determination of chemical oxygen demand by
using the heterogeneous Fenton-like process (H2O2/Fe(3-x)Co(x)O4 nanoparticles) as an
oxidant. Talanta, 135, 75-80.
FIDA, H., ZHANG, G., GUO, S. & NAEEM, A. 2017. Heterogeneous Fenton degradation
of organic dyes in batch and fixed bed using La-Fe montmorillonite as catalyst. Journal of
Colloid and Interface Science, 490, 859-868.
FONTECHA-CÁMARA, M. A., MORENO-CASTILLA, C., LÓPEZ-RAMÓN, M. V. &
ÁLVAREZ, M. A. 2016. Mixed iron oxides as Fenton catalysts for gallic acid removal from
aqueous solutions. Applied Catalysis B: Environmental, 196, 207-215.
GAO, P., HAO, M., HE, Y., SONG, Y. & YANG, S. 2019. Effect of Fe2O3–ZrO2 Catalyst
Morphology on Sulfamethazine Degradation in the Fenton-Like Reaction. Catalysts, 9.
GARRIDO-RAMÍREZ, E. G., MARCO, J. F., ESCALONA, N. & URETA-ZAÑARTU, M. S.
2016. Preparation and characterization of bimetallic Fe–Cu allophane nanoclays and their
Page 121
106
activity in the phenol oxidation by heterogeneous electro-Fenton reaction. Microporous
and Mesoporous Materials, 225, 303-311.
HAN, Z., DONG, Y. & DONG, S. 2011. Copper-iron bimetal modified PAN fiber complexes
as novel heterogeneous Fenton catalysts for degradation of organic dye under visible
light irradiation. Journal of Hazardous Materials , 189, 241-8.
HE, S.-L., WANG, L.-P., ZHANG, J. & HOU, M.-F. 2009. Fenton pre-treatment of
wastewater containing nitrobenzene using ORP for indicating the endpoint of reaction.
Procedia Earth and Planetary Science, 1, 1268-1274.
HEGYESI, N., VAD, R. T. & PUKÁNSZKY, B. 2017. Determination of the specific surface
area of layered silicates by methylene blue adsorption: The role of structure, pH and layer
charge. Applied Clay Science, 146, 50-55.
HU, X., LI, R., ZHAO, S. & XING, Y. 2017. Microwave-assisted preparation of flower-like
cobalt phosphate and its application as a new heterogeneous Fenton–like catalyst.
Applied Surface Science, 396, 1393-1402.
HUANG, F., GUO, Y., WANG, S., ZHANG, S. & CUI, M. 2017. Solgel-hydrothermal
synthesis of Tb/Tourmaline/TiO2 nano tubes and enhanced photocatalytic activity. Solid
State Sciences, 64, 62-68.
KARTHIKEYAN, S., PACHAMUTHU, M. P., ISAACS, M. A., KUMAR, S., LEE, A. F. &
SEKARAN, G. 2016. Cu and Fe oxides dispersed on SBA-15: A Fenton type bimetallic
catalyst for N,N-diethyl-p-phenyl diamine degradation. Applied Catalysis B:
Environmental, 199, 323-330.
KERMANIORYANI, M., MUTALIB, M. I. A., KURNIA, K. A., LETHESH, K. C., KRISHNAN,
S. & LEVEQUE, J.-M. 2016. Enhancement of π–π aromatic interactions between
hydrophobic Ionic Liquids and Methylene Blue for an optimum removal efficiency and
assessment of toxicity by microbiological method. Journal of Cleaner Production, 137,
1149-1157.
Page 122
107
LAM, F. L. Y. & HU, X. 2013. pH-Insensitive Bimetallic Catalyst for the Abatement of Dye
Pollutants by Photo-Fenton Oxidation. Industrial & Engineering Chemistry Research, 52,
6639-6646.
LI, M., GAO, Q., WANG, T., GONG, Y.-S., HAN, B., XIA, K.-S. & ZHOU, C.-G. 2016.
Solvothermal synthesis of MnxFe3−xO4 nanoparticles with interesting physicochemical
characteristics and good catalytic degradation activity. Materials & Design, 97, 341-348.
LIOTTA, L. F., GRUTTADAURIA, M., DI CARLO, G., PERRINI, G. & LIBRANDO, V. 2009.
Heterogeneous catalytic degradation of phenolic substrates: catalysts activity. Journal of
Hazardous Materials, 162, 588-606.
LUO, L., DAI, C., ZHANG, A., WANG, J., LIU, M., SONG, C. & GUO, X. 2015. A facile
strategy for enhancing FeCu bimetallic promotion for catalytic phenol oxidation. Catalysis
Science & Technology, 5, 3159-3165.
MAGALHÃES, F., PEREIRA, M. C., BOTREL, S. E. C., FABRIS, J. D., MACEDO, W. A.,
MENDONÇA, R., LAGO, R. M. & OLIVEIRA, L. C. A. 2007. Cr-containing magnetites
Fe3−xCrxO4: The role of Cr3+ and Fe2+ on the stability and reactivity towards H2O2
reactions. Applied Catalysis A: General, 332, 115-123.
MASOMBOON, N., RATANATAMSKUL, C. & LU, M.-C. 2010. Mineralization of 2,6-
dimethylaniline by photoelectro-Fenton process. Applied Catalysis A: General, 384, 128-
135.
MCMURRY, E. J., FAY, R. C. & ROBINSON, J. K. 2015. Chemistry Copyright Licencing
Agency Ltd.
MOUSAVI, Z., ESMAEILI-ZARE, M. & SALAVATI-NIASARI, M. 2015. Magnetic and
optical properties of zinc chromite nanostructures prepared by microwave method.
Transactions of Nonferrous Metals Society of China, 25, 3980-3986.
MUNOZ, M., DE PEDRO, Z. M., CASAS, J. A. & RODRIGUEZ, J. J. 2015. Preparation
of magnetite-based catalysts and their application in heterogeneous Fenton oxidation –
A review. Applied Catalysis B: Environmental, 176-177, 249-265.
Page 123
108
NAWAZ, F., XIE, Y., XIAO, J., CAO, H., LI, Y. & ZHANG, D. 2016. Insights into the
mechanism of phenolic mixture degradation by catalytic ozonation with a mesoporous
Fe3O4/MnO2 composite. The Royal Society of Chemistry 2016, 6, 29674-29684.
NEYENS, E. & BAEYENS, J. 2003. A review of classic Fenton’s peroxidation as an
advanced oxidation technique. Journal of Hazardous Materials, 98, 33-50
PARIDA, K. M. & PARIJA, S. 2006. Photocatalytic degradation of phenol under solar
radiation using microwave irradiated zinc oxide. Solar Energy, 80, 1048-1054.
PARIENTE, M. I., MOLINA, R., MELERO, J. A., BOTAS, J. A. & MARTINEZ, F. 2015.
Intensified-Fenton process for the treatment of phenol aqueous solutions. Water Science
& Technology, 71, 359-65.
POURAN, S. R., AZIZ, A. R. A., DAUD, W. M. A. W. & SHAFEEYAN, M. S. 2015. Effects
of niobium and molybdenum impregnation on adsorption capacity and Fenton catalytic
activity of magnetite. The Royal Society of Chemistry Advances, 5, 87535–87549.
RAD, L. R., HARIRIAN, I. & DIVSAR, F. 2015. Comparison of adsorption and photo-
Fenton processes for phenol and paracetamol removing from aqueous solutions: single
and binary systems. Spectrochimica Acta Part A: Molecular and Biomolecular
Spectroscopy, 136 Pt B, 423-8.
REN, Y., LIN, L., MA, J., YANG, J., FENG, J. & FAN, Z. 2015. Sulfate radicals induced
from peroxymonosulfate by magnetic ferrospinel MFe2O4 (M = Co, Cu, Mn, and Zn) as
heterogeneous catalysts in the water. Applied Catalysis B: Environmental, 165, 572-578.
REUBROYCHAROEN, P., VITIDSANT, T., LIU, Y., YANG, G. & TSUBAKI, N. 2007.
Highly active Fischer–Tropsch synthesis Co/SiO2 catalysts prepared from microwave
irradiation. Catalysis Communications, 8, 375-378.
REY, A., FARALDOS, M., CASAS, J. A., ZAZO, J. A., BAHAMONDE, A. & RODRÍGUEZ,
J. J. 2009. Catalytic wet peroxide oxidation of phenol over Fe/AC catalysts: Influence of
iron precursor and activated carbon surface. Applied Catalysis B: Environmental, 86, 69-
77.
Page 124
109
ROSSI, A. F., MARTINS, R. C. & QUINTA-FERREIRA, R. M. 2014. Composition Effect
of Iron–Copper Composite Catalysts in the Fenton Heterogeneous Process Efficiency
and Co-oxidation Synergy Assessment. Industrial & Engineering Chemistry Research,
53, 15369-15373.
TANG, X., HUANG, J., LIU, K., FENG, Q., LI, Z. & AO, M. 2018. Synthesis of magnetically
separable MnO2/Fe3O4/silica nanofiber composite with enhanced Fenton-like catalytic
activity for degradation of Acid Red 73. Surface & Coatings Technology, 354, 18-27.
UPRETI, A. R., LI, Y., KHADGI, N., NARAGINTI, S. & ZHANG, C. 2016. Efficient visible
light photocatalytic degradation of 17α-ethinyl estradiol by a multifunctional Ag–
AgCl/ZnFe2O4 magnetic nanocomposite. Royal Society of Chemistry Advances, 6,
32761-32769.
WAN, D., LI, W., WANG, G. & WEI, X. 2016. Size-controllable synthesis of Fe3O4
nanoparticles through oxidation–precipitation method as heterogeneous Fenton catalyst.
Journal of Materials Research, 31, 2608-2616.
WANG, J., LIU, C., HUSSAIN, I., LI, C., LI, J., SUN, X., SHEN, J., HAN, W. & WANG, L.
2016. Iron–copper bimetallic nanoparticles supported on hollow mesoporous silica
spheres: the effect of Fe/Cu ratio on heterogeneous Fenton degradation of a dye. Royal
Society of Chemistry Advances, 6, 54623-54635.
WANG, J., LIU, C., TONG, L., LI, J., LUO, R., QI, J., LI, Y. & WANG, L. 2015a. Iron–
copper bimetallic nanoparticles supported on hollow mesoporous silica spheres: an
effective heterogeneous Fenton catalyst for orange II degradation. Royal Society of
Chemistry Advances, 5, 69593-69605.
WANG, J., XIA, Y., ZHAO, H., WANG, G., XIANG, L., XU, J. & KOMARNENI, S. 2017.
Oxygen defects-mediated Z-scheme charge separation in g-C3N4/ZnO photocatalysts for
enhanced visible-light degradation of 4-chlorophenol and hydrogen evolution. Applied
Catalysis B: Environmental, 206, 406-416.
WANG, Y., ZHAO, H., LI, M., FAN, J. & ZHAO, G. 2014. Magnetic ordered mesoporous
copper ferrite as a heterogeneous Fenton catalyst for the degradation of imidacloprid.
Applied Catalysis B: Environmental, 147, 534-545.
Page 125
110
WANG, Y., ZHAO, H. & ZHAO, G. 2015b. Iron-copper bimetallic nanoparticles embedded
within ordered mesoporous carbon as effective and stable heterogeneous Fenton catalyst
for the degradation of organic contaminants. Applied Catalysis B: Environmental, 164,
396-406.
WU, H., YIN, J. J., WAMER, W. G., ZENG, M. & LO, Y. M. 2014. Reactive oxygen
species-related activities of nano-iron metal and nano-iron oxides. Journal of Food and
Drug Analysis, 22, 86-94.
ZHANG, X., DING, Y., TANG, H., HAN, X., ZHU, L. & WANG, N. 2014. Degradation of
bisphenol A by hydrogen peroxide activated with CuFeO2 microparticles as a
heterogeneous Fenton-like catalyst: Efficiency, stability and mechanism. Chemical
Engineering Journal, 236, 251-262.
Page 126
111
Appendix A
Catalyst preparation
Aim is to prepare a 5g catalyst that contains 10% metal content:
mass of Fe =10%
100%X 5g
= 0.5g mass of Fe
Calculate mol of Fe:
n =m
Mm
n =0.5g
55.845 g/mol
= 0.008953 mol Fe
Convert mole of Fe to mole of Fe2O3 using the mol ratio:
1 mol of Fe:2 mol of Fe in Fe2O3 therefore:
mole of Fe2O3 =mole Fe
2
=0.008953 mol
2
= 0.004477 mole Fe2O3
Calculate the mass of Fe2O3:
m = n x Mm
= 0.004477 mol x 159.687
= 0.714867 g of Fe2O3
Calculate the mass of silica:
m = total mass of catalyst − mass Fe2O3
Page 127
112
= 5g − 0.714867g
= 4.28513g
Calculate mass of iron (III) nitrate nonahydrate using the mole ratio:
1mole of Fe : 1mole of Fe in Fe(NO3).9H2O:
m = n x Mm
m = 0.008953 x403.999g/mol
m = 3.6171g
Calculate volume of H2Oto be added:
Pore o silica = 1.15 cm3g-1
V = pore x m of silica
= 1.15cm3/g x 4.2851g
4.93 cm3
Page 128
113
Appendix B
Degradation of MB
Dilution factor is given as:
C1 x V1 = C2 x V2
(0.104mg ⁄ L)(0.1 L) = C2 (0.001L)
C2 =0.0104 mg
0.001L
C2 = 10.04 mg/L
The percentage removal is given as:
% removal =(Co−Ce)
CoX 100%
=(100 mg/L − 10.4 mg/L
100 mg/L X 100%
= 89.60 %
Reaction kinetics
Integrated rate laws (McMurry et al., 2015)
If the concentration of a reactant remains constant because it is in great excess with
respect to the other reactant, its concentration can be included in the rate constant to
simplify the rate equation, obtaining pseudo-first-order or pseudo second order rate
equation. For example, during the Fenton reaction [H2O2] + [MB] → [H2O] + [CO2] the rate
for this reaction is given by: rate=k[MB]x[H2O2]y. The H2O2 has a high concentration
compared to MB such that its consumption is insignificant. Therefore, it can be assumed
that the concentration of the H2O2 remains constant throughout the reaction. The rate of
can be assumed to be rate=kabs [MB]x. The order of the reaction can be determined by
performing some experiments (McMurry et al., 2015).
Page 129
114
Pseudo-first-order:
Pseudo − first − order = Ln[MB]
−d[MB]
dt= k[MB]
∫d[MB]
[A]= ∫ −kdt
∫1
[MB. d[MB] = −k ∫ dt
∫ ln [𝑀𝐵] = −𝑘 ∫ dt
𝑡
0
𝑡
0
ln [𝑀𝐵]𝑡 − ln [𝑀𝐵]0 = −𝑘(𝑡 − 𝑜)
ln [𝑀𝐵]𝑡 − ln [𝑀𝐵]0 = −kt
ln [𝑀𝐵]𝑡 = −kt + ln [𝑀𝐵]0
Therefore Y = mx + c
Pseudo-second-order:
Pseudo − second − order =1
𝑀𝐵
Rate = k[MB]2
−d[MB]
dt= k[MB]2
∫d[MB]
[MB]2= ∫ −k. dt
∫1
[MB]2 . d[MB] = −k ∫ dt
∫−1
[MB]
𝑡
0
= −k ∫ 𝑡𝑡
0
Page 130
115
−1
[𝑀𝐵]𝑡− (−
1
[𝑀𝐵]0= −k(t − o)
1
[𝑀𝐵]𝑡−
1
[𝑀𝐵]0= kt
1
[MB]t= kt +
1
[MB]o
𝒚 = 𝒎𝒙 + 𝒄
Therefore m = k
Appendix C
XRD crystallite size was calculated with Scherrer equation:
D =k.
βcosθ
=(0.9 nm)(0.015418nm)
(0.013673 rad)(cos (0.583818 rad
2 ))
= 10.60 nm
Where, D = Average Crystallite size, β = Line broadening in radians, θ = Bragg angle, λ
= X-Ray wavelength
Page 131
116
Appendix D
Redox potentials for half reaction for the metal ions were obtain from Markmary et al.
(2015) and for the radicals were obtained from Armstrong et al. (2013).
For Fe metal ion
Fe3+ +e- → Fe2+……………………………………….……………..……+0.77 V
- (Fe2+ → Fe3+ + e-…………...………………………………….…+0.77 V)
O2 + e- → O2.-…………………..……………………….…………-0.18 V
Fe2+ + O2 → Fe3+ + O2.-………………………………..…………-0.95 V
- (Fe2+ → Fe3+ + e-…………...………………………………….…+0.77 V)
O2 + H+ + e- → HO2. …………………..……………………….…+010 V
Fe2+ + O2 + H+ → Fe3+ + HO2. …………………………………...-0.67 V
- (Fe2+ → Fe3+ + e-…………...………………………………….…+0.77 V)
HO2. + e-
+ H+ → H2O2……………………………………………+1.46 V
Fe2+ + HO2. + H+ → Fe3+ + H2O2…………………………………+0.69 V
- (Fe2+ → Fe3+ + e-…………...………………………………….…+0.77 V)
H2O2 + e- + H+ → HO. + H2O……………………………………..+0.80 V
Fe2+ + H2O2 + H+ → Fe3+ + HO. + H2O…………………………..+0.03 V
- (Fe2+ → Fe3+ + e-…………...………………………………….…+0.77 V)
HO. + e- + H+ → H2O……………………………………………...+2.73 V
Fe2+ + HO. + H+ → Fe3++ H2O……………………………………+1.96 V
Page 132
117
For Co metal ion
Co3+ + e- → Co2+…………………………………………………………..+1.81 V
- (Co2+ → Co3+ + e-…………...………………………………….…+1.81 V)
O2 + e- → O2.-…………………..……………………….…………-0.18 V
Co2+ + O2 → Co3+ + O2.-………………………………..…………-1.99 V
- (Co2+ → Co3+ + e-…………...………………………………….…+1.81 V)
O2 + H+ + e- → HO2. …………………..……………………….…+010 V
Co2+ + O2 + H+ → Co3+ + HO2. ……………………………….....-1.71 V
- (Co2+ → Co3+ + e-…………...………………………………….…+1.81 V)
HO2. + e-
+ H+ → H2O2……………………………………………+1.46 V
Co2+ + HO2. + H+ → Co3+ + H2O2…………………….…..………-0.35 V
- (Co2+ → Co3+ + e-…………...………………………………….…+1.81 V)
H2O2 + e- + H+ → HO. + H2O……………………………………..+0.80 V
Co2+ + H2O2 + H+ → Co3+ + HO. + H2O………………………....-1.01 V
- (Co2+ → Co3+ + e-…………...………………………………….…+1.81 V)
HO. + e- + H+ → H2O……………………………………………...+2.73 V
Co2+ + HO. + H+ → Co3++ H2O……………………………..……+0.92 V
For Cu metal ion
Cu+ + e- → Cu2+…………………………………………………..………+0.16 V
- (Cu2+ + e- → Cu+ …………...………………………………….…+0.16 V)
O2 + e- → O2.-…………………..……………………….…………-0.18 V
Cu2+ + O2 → Cu+ + O2.-………………………………..…………-0.34 V
Page 133
118
- (Cu2+ + e- → Cu+ …………...………………………………….…+0.16 V)
O2 + H+ + e- → HO2. …………………..……………………….…+010 V
Cu2+ + O2 + H+ → Cu+ + HO2. …………………………………...-0.06 V
- (Cu2+ + e- → Cu+ …………...………………………………….…+0.16 V)
HO2. + e-
+ H+ → H2O2……………………………………………+1.46 V
Cu2+ + HO2. + H+ → Cu+ + H2O2…………………………………+1.30 V
- (Cu2+ + e- → Cu+ …………...………………………………….…+0.16 V)
H2O2 + e- + H+ → HO. + H2O……………………………………..+0.80 V
Cu2+ + H2O2 + H+ → Cu3+ + HO. + H2O………………………....+0.64 V
- (Cu2+ + e- → Cu+ …………...………………………………….…+0.16 V)
HO. + e- + H+ → H2O……………………………………………...+2.73 V
Cu2+ + HO. + H+ → Cu++ H2O……………………………………+2.57 V
For Mn metal ion
Mn3+ +e- → Mn2+……………………………………….……………..……+1.51 V
- (Mn2+ → Mn3+ + e-…………...…………………………….…….…+1.51 V)
O2 + e- → O2.-…………………..……………………..….…………-0.18 V
Mn2+ + O2 → Mn3+ + O2.-……………………………….…..………-1.69 V
- (Mn2+ → Mn3+ + e-…………...…………………………….…….…+1.51 V)
O2 + H+ + e- → HO2. …………………………………………….....+010 V
Mn2+ + O2 + H+ → Mn3+ + HO2. ………………………………......-1.41 V
- (Mn2+ → Mn3+ + e-…………...…………………………….…….…+1.51 V)
HO2. + e-
+ H+ → H2O2……………………………………..………+1.46 V
Mn2+ + HO2. + H+ → Mn3+ + H2O2………………………….………-0.05 V
Page 134
119
- (Mn2+ → Mn3+ + e-…………...…………………………….…….…+1.51 V)
H2O2 + e- + H+ → HO. + H2O……………………………………....+0.80 V
Mn2+ + H2O2 + H+ → Mn3+ + HO. + H2O…………………………..-0.71 V
- (Mn2+ → Mn3+ + e-…………...…………………………….…….…+1.51 V)
HO. + e- + H+ → H2O…………………………………………….....+2.73 V
Mn2+ + HO. + H+ → Mn3++ H2O……………………………………+1.22 V
Bimetallic catalyst
Fe3+ +e- → Fe2+…………………….………….……………..……+0.77 V
- (Cu+ → Cu2+ + e- …………………………………………..………+0.16 V)
Fe3+ + Cu+ → Fe2+ + Cu2+ ………………….……………………. +0.61 V
- (Fe2+ +e- → Fe3+……………………………………..………..……+0.77 V)
Co3+ + e- → Co2+…………………………………………………...+1.81 V
Fe2+ + Co3+ → Fe3+ +Co2+ …………..…………………………… +1.04 V
- (Fe2+ +e- → Fe3+………………………………………………..……+0.77 V)
Mn3+ +e- → Mn2+………………………………………………..……+1.51 V
Fe2+ + Mn3+ → Fe3+ +Mn2+……………………………………...+0.73 V
(Tang et al., 2018)
Fe3+ +e- → Fe2+…………………….………….………………..……+0.77 V
- (Mn3+ → Mn4+ + e-…………………………………….……………….+0.15 V
Mn3+ + Fe3+ → Mn4+ + Fe2+………………………….……….…………+0.62 V
Page 135
120
(Nowaz et al., 2016)
- (Fe2+ +e- → Fe3+…………………………………………..……..……+0.77 V)
Mn4+ +e- → Mn3+………………………………………….…………. +0.95 V
Mn4+ + Fe2+ → Mn3+ + Fe3+………………………………….………....+0.18 V
Discrepancy in literature
Nowaz et al. (2016) reported that the reduction of Mn4+ by Fe2+ is thermodynamically
favourable since the standard potential of Mn4+/Mn3+ is 0.95 V larger than that of Fe3+/Fe2+
(0.77 V). However, this was in contrast with the study presented by Tang et al. (2018)
where the reduction of Fe3+ by Mn3+ was thermodynamically favourable since the
standard redox potential of Fe3+/Fe2+ (0.77 V) is larger than that of Mn4+/Mn3+ (0.15 V).
Therefore, it is not yet clear as to which metal ion assist the reduction of the other as
these two studies reported different Mn4+/Mn3+ potential values.