21
The use of census data as an input in forecasting population, employment and land use change 5 th October 2010 Andy Dobson David Simmonds Consultancy

The use of census data as an input in forecasting population,
employment and land use change
5th October 2010Andy Dobson
David Simmonds Consultancy
Outline of the Presentation
• Context– Forecasting Land Use, Pop, Employment – Use of Land use models
• Data inputs– The use of Census material
• Application – for forecasting change– Policy appraisal

Context• concerned with forecasting
– Population, Households, Employment– Development– Interactions between them
• We use Land Use Models to understand change over time – a forecasting tool
• it differs from many standard population and economic forecasts:– Wider range of influences – development, accessibility,
market, environmental factors
• may operate at a fine geographical level- has a zone structure that often based upon datazones, wards or smaller units
Context
• Land Use Model are concerned with– Population, households, employment, building stocks– Not really about Land !
• They are a powerful tool for testing or appraising policy:
• Eg what happens if we build more houses within City Centre as opposed to edge of town
• Often used in conjunction with transport models• Eg what happens if a new rail link or highway is built
improving access along a transport corridor
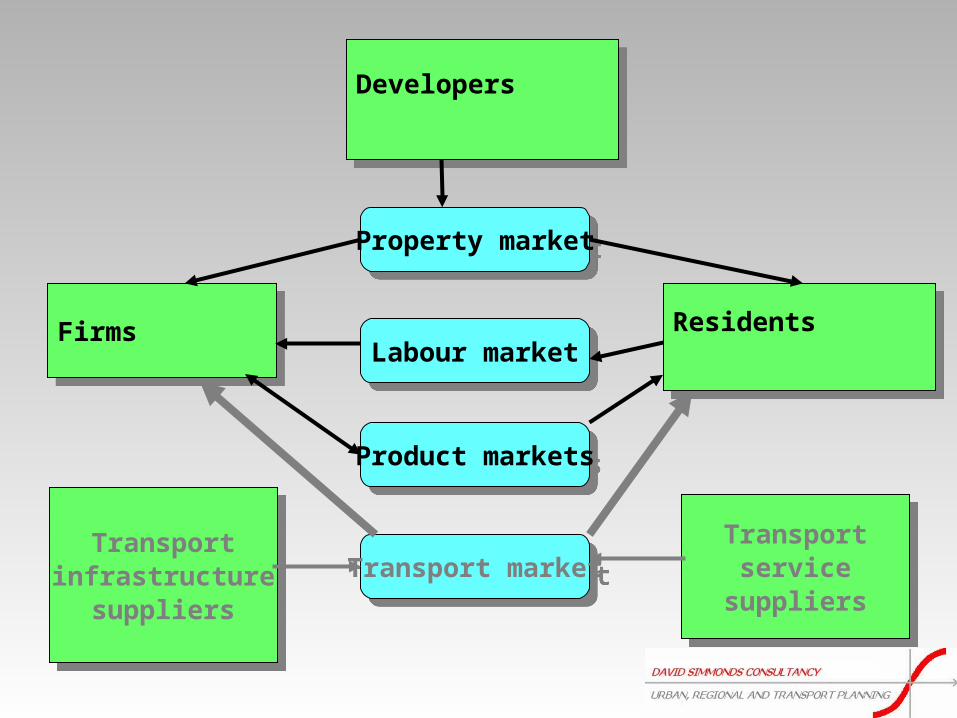
DevelopersDevelopers
FirmsFirms ResidentsResidents
Transportservice
suppliers
Transportservice
suppliers
Transportinfrastructure
suppliers
Transportinfrastructure
suppliers
Property marketProperty market
Labour marketLabour market
Product marketsProduct markets
Transport marketTransport market

Developers:how much to buildwhere to build
Developers:how much to buildwhere to build
Firms:(technology)(macro context)investmentlocationrecruitmentmarketingpurchasingproduction
Firms:(technology)(macro context)investmentlocationrecruitmentmarketingpurchasingproduction
Residents:(demographics)education/traininglocation/housingworkcar ownershipspending
Residents:(demographics)education/traininglocation/housingworkcar ownershipspending
TransportTransportserviceservice
supplierssuppliers
TransportTransportserviceservice
supplierssuppliers
TransportTransportinfrastructureinfrastructure
supplierssuppliers
TransportTransportinfrastructureinfrastructure
supplierssuppliers
Property marketProperty marketProperty marketProperty market
Labour marketLabour marketLabour marketLabour market
Product marketsProduct marketsProduct marketsProduct markets
Transport marketTransport marketTransport marketTransport market


Dynamics
Model is incremental in one year steps so• starts from a base year (and an observed database)• produces an updated database for each forecast year.
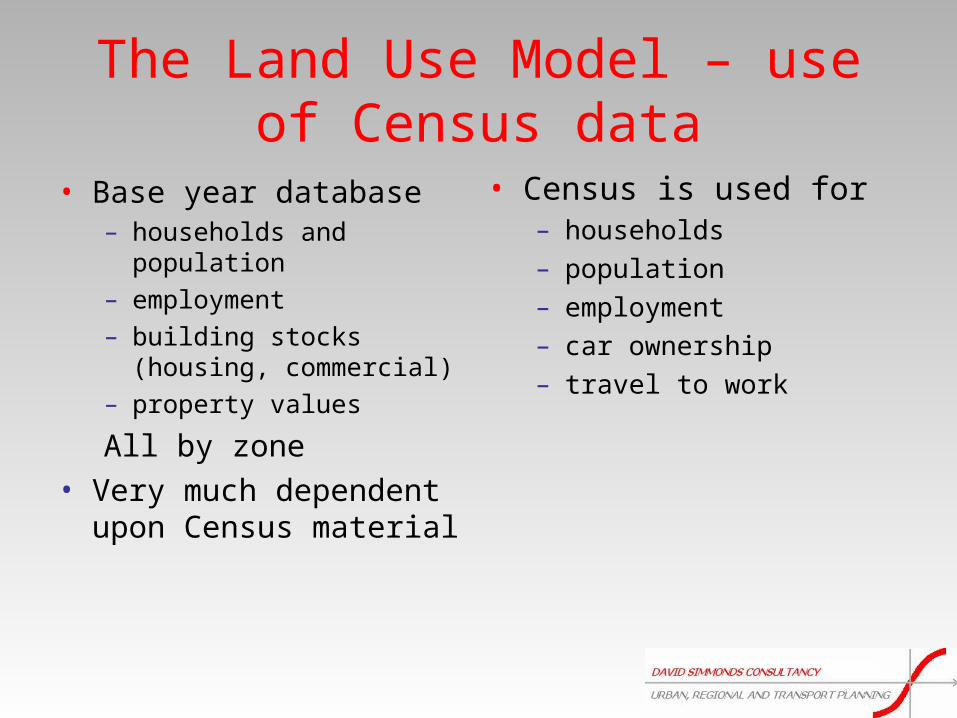
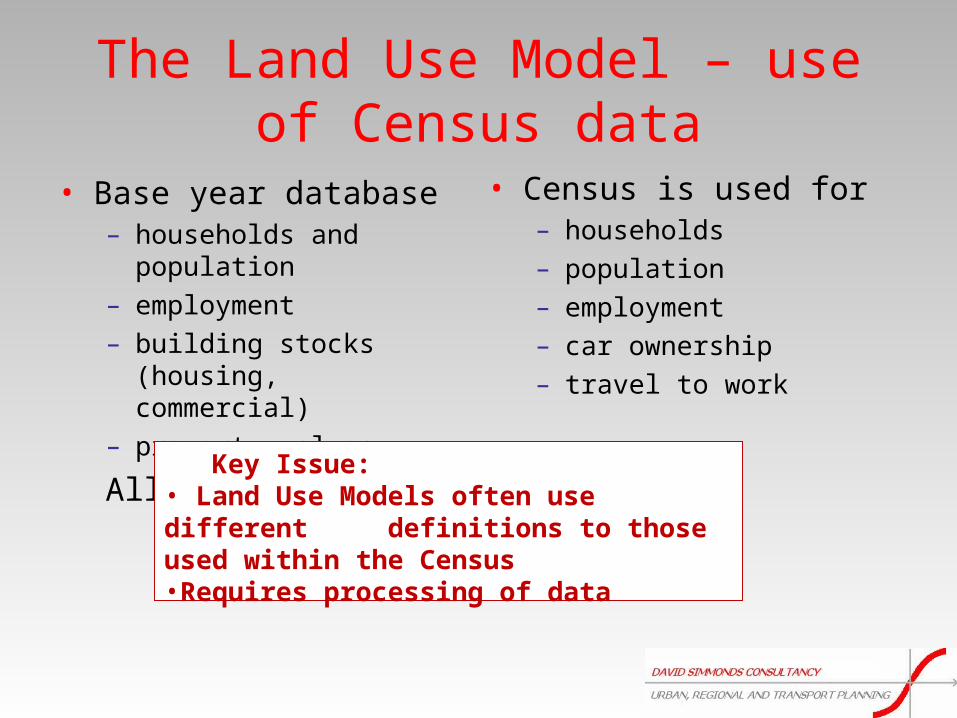
The Land Use Model – use of Census data
• Base year database – households and
population– employment – building stocks (housing,
commercial)– property values
All by zone• Very much dependent
upon Census material
• Census is used for– households– population– employment – car ownership– travel to work
The Land Use Model – use of Census data
• Base year database – households and
population– employment – building stocks (housing,
commercial)– property values
All by zone
• Census is used for– households– population– employment – car ownership– travel to work
Key Issue:• Land Use Models often use different definitions to those used within the Census•Requires processing of data

Processing of data - Households
Census:Tables UV 65 and UV66
Land Use Model:Range of household categories (single/couple/ 3 plus adults, young/older/retired, with/without children) each split into manual and non-manual
Processing:SHS data used to split :i) single non-retired household categoryii) divide a census category labelled ‘2 adults and 3 or more children or 3 or more adults and 1 or more children’ to obtain the land use model’s activity ‘three or more adults with children’,
Census:Specially commissioned tables from GROS and ONS
Processing:No processing required

Processing of data - PopulationCensus:Tables CAS004, CAS061
Land Use Model:Children – under 16sNon workers – 16-74 not in employment, not retiredWorkers – 16-74 in employmentRetired – over 75s and 16-74 classed as economically inactive retired
Processing:When linking population to households we have used proportions from the SHS to estimate the number of workers/non-workers in each household category

Processing of data - Employment
Census:UV77 number of jobs in each industrial sectorUV78 the occupation split
Land Use Model:Employment activity groups based upon Standard Industrial Classification (SIC) and Standard Occupation Classification (SOC) ...Standard Economic LevelTypically split SIC into Manual and Non Manual
Processing:i) Split of some categories within UV77 (ie ‘Financial intermediaries ‘into ‘Financial Management’ and ‘Local Financial services’ii)-to determine the split of manual and non manual ‘higher and intermediate managerial/ administrative/ professional’ and ‘supervisory, clerical, junior managerial/ administrative/ professional’ categories as non manual.

Processing of data – Car Ownership
Census:CAS062 – car ownership
Land Use Model:Proportion of households of each household type owning 0,1 and 2 plus cars
Processing:i) Apply Scottish Household Survey based proportions of number of households owning 0,1,2 cars to household dataii) Adjust so that the total number of car owning households is consistent with the Census outpus

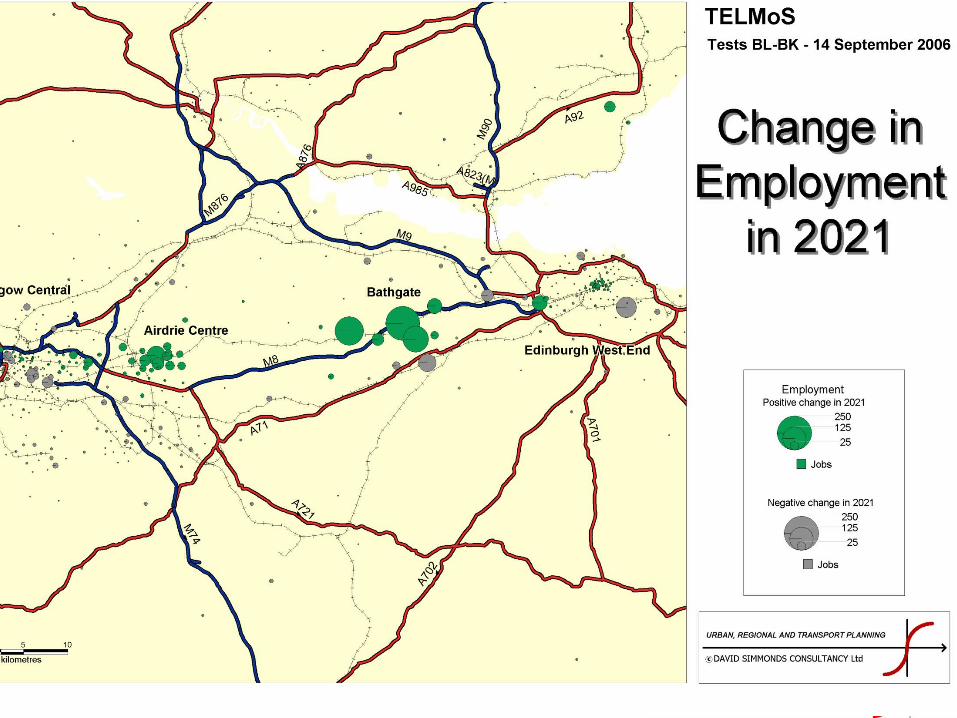
How can the models assist policy appraisal?
• Change in population, households, employment etc
• Influence of wider range of factors:– Where new development is planned– Changes in accessibility
• Showing the impact of policy – rather than simply a trend
• Examples from transport and land use planning

• Appraising transport proposals– model is run with and
without the scheme or intervention
(1)M74 completion (Glasgow)
Applications of Land Use Model
17

18

• Assessing/appraising land use policy– ‘What if’ we have major
development in this zone
• Previous examples – Derby– Greater Manchester LDFs– Glasgow and Clyde Valley
Structure Plans– South Lanarkshire Local Plan
housing allocations– West Edinburgh development
proposals
Applications of Land Use Model

Concluding Remarks
• Land Use Models are a powerful tool:– For small area population and employment forecasts– for appraising policy
• Census data is a key input to the base year– Disaggregated data on population, households,
employment
• Look forward to the publication of 2011 Census material– To revise models– To calibrate models


