56
The Use of Containers in Canada APPENDICES Prepared For Transport Canada Prepared By MariNova Consulting Ltd. & Partners November 2006

The Use of Containers in CanadaAPPENDICES
Prepared ForTransport Canada
Prepared ByMariNova Consulting Ltd.
& Partners
November 2006

Use of Containers in Canada – T8080-06-0175 Appendices
November 24, 2006
APPENDICES:
A – List of Interviews
B – Literature Review
C – Best Practices
D – Trade Data

Use of Containers in Canada – T8080-06-0175 A-1
November 24, 2006
Appendix A – List of Interviews
Port Authorities
Vancouver Port Authority Prince Rupert Port Authority Montreal Port Authority Halifax Port Authority
Container Terminals
TSI, Inc. DP World (ex P&O Ports) Fraser Surrey Docks Coast 2000 Terminals Racine Terminal Task Terminals Termont Halterm Ltd. Logistec Stevedoring
Shipping Lines
Maersk Line Evergreen Line Zim Container Hapag-Lloyd AG/CP Ships NYK Line Hanjin Line Hyundai Merchant Marine Yang Ming Line APL/NOL COSCO Oceanex
Freight Forwarders and 3PLs
Schencker DHL/Danzas AB Transloader

Use of Containers in Canada – T8080-06-0175 A-2
November 24, 2006
OCTS MTE Logistix
Railways
CN Rail CP Rail
Shippers
Canadian Tire HBC Logistics/Zellers Simpson Seeds, Saskcan Pulse Prairie Pulse Walker Seeds Sask Pulse Growers Belle Pulse Vigro Seeds Canadian Wheat Board Parrish & Heimbecker Canexus Chemicals Nova Chemicals Rahr Malting
Industry Associations & Government
WESTAC Canadian Special Crops Association Manitoba Trucking Assoc. Alberta Forest Products Alberta infrastructure & Transportation Latitude/Westrans
Academe
University of Manitoba Université de Montréal Dalhousie University

Use of Containers in Canada – T8080-06-0175 A-3
November 24, 2006
Appendix B – Literature Review
There is an extensive body of literature and research available, particularly in theCanadian context. Because it is so voluminous, we focused on those studies with the mostrelevance to this project.
Container Shipping Background Studies
The Magic Box: A History of Containerization is a very thorough compendium that dealswith the 1960s to the early 1980s. It provides detail regarding the early development ofterminals in Montreal, Halifax, Vancouver, Saint John, Quebec City, etc.1
The Globalisation of the Oceans: Containerisation from the 1950s to the Present is anexamination of the container revolution, from earliest times through to late 1990s. Itlooks at the role of container shipping in globalization and evolution of global supplychains and traces the rise of Asian economies by linking it to the availability of containershipping for shippers both large and small. It shows how well suited it was to theemerging Asian economies of the early 1980s.2
Containerisation International has been the “Bible” of the container industry almostsince its inception. The monthly magazine is supplemented by a Yearbook as well asother specialty issues, such as the Market Analysis Report: World Container Census2006. This Market Analysis Report is an excellent source of information regarding thetotal scope of container usage, both internationally and domestically.3
Literature Review on Intermodal Freight Transportation provides a review of studiesconducted in the US on the issue of intermodal freight transportation.4 The studyindicates that there is no literature on intermodal freight transportation in Canada. Thestudy uses the US experience to identify:
Analytical tools for project evaluation; Intermodal project risks and management approaches; Partnership structure and project governance; Public policy issues; Design of process; and Key contractual instruments and project agreements to support intermodal project.
The bibliography includes 95 papers that were reviewed and the vast majority wereprepared in the US. It highlights in detail the US Intermodal Surface Transportation
1 Peter Hunter, The Magic Box: A History of Containerization.2 Frank Broeze, The Globalisation of the Oceans: Containerisation from the 1950s to the Present,
Research in Maritime History Series, No. 23, International Maritime Economic History Association, 2002.3 Containerisation International Market Analysis: World Container Census 2006, London, 2006.4 Transport Canada, Literature Review on Intermodal Freight Transportation, January 2004.

Use of Containers in Canada – T8080-06-0175 A-4
November 24, 2006
Equity Act (ISTEA) for the 1998-2003 period, which provided major investment in thepublic sector. The ISTEA represented $218 billion of public funding. This study presentsthe various US programs that have been initiated to address the issue of intermodalism.The authors of the study indicate that Intermodal Surface Transportation requires publicfunding and planning, considering the limitations of the private structure to plan, design,finance and manage facilities on a national basis. It highlights the fact that the US hasestablished the "Freight Analysis Framework" (FAF) through the Federal HighwayAdministration (FHWA), which estimates trade flows on the US transportation systemand makes geographic relationships between local flows and the overall transportationsystem. This study indicates that the challenges faced by the US might bring manylessons to Canada. It indicates also that while many Canadian programs benefitintermodalism, Canada should consider elaborating a specific national program toaddress the issue. It shows that intermodalism is required in a global economy and that tobe efficient, the Canadian government should take the lead to assure the integration ofmeasures that will be best suited for the industries, in response to the growth in trade andthe need to improve supply chain efficiency. This a very good study, however, analogiesbetween the US and Canada in terms of public programs might be harder to identify. Theeconomy of scale of the US and the trading capacity is by far much greater.
“Client Industries of Water Transportation” is a report undertaken as part of the federalgovernment’s initiative to better understand the cumulative impact of federal costrecovery measures, and focuses specifically on the clients of water transportationservices. It is based on data collected in 2000. It notes that growth in Canada’scontainerized movements had grown 60% over the previous seven years, whereas non-containerized shipments had grown 40%. The higher the value of the commodity themore likely it was to move by truck, rail, or air, and lower valued commodities tended tomove by water. A “substantial” proportion of Canada’s import and export trade is waterdependent.5
Forecasts
Westac’s “Preparing for Success: Forecasting Surface Freight Demand” is based oninterviews with six primary commodity groups: coal, forest products, grains, fertilizerand potash, sulphur, and chemicals.6 The report provides a number of operational,investment and policy needs. It indicates West Coast container traffic will nearly triple by2015, to 5.41 million TEUs and coal exports can be expected to more than double. Ithighlights the general perception among shippers that the degree of use of containers willbe determined by the rates, service, and availability of containers. The forecast seems toassume almost exponential and uninterrupted growth in western Canada’s major markets.
5 Mariport Group Ltd., “Client Industries of Water Transportation,” March 2002.6 WESTAC, “Preparing for Success: Forecasting Surface Freight Demand,” March 2006.
Use of Containers in Canada – T8080-06-0175 A-5
November 24, 2006
Another study, “Forecast of Container Vessel Specifications and Port Calls within SanPedro Bay,”7 while nominally dealing with the ports of Los Angeles/Long Beach,contains excellent data on the trans-Pacific trades in relation to other major trade lanessuch as the trans-Atlantic and Asia-Europe. Some ports on the West Coast couldaccommodate 12,000 TEU ships but all need improvements to rail yards and rail lines todo so. On the East Coast, only Halifax and Norfolk can handle these vessels. It suggestsship size has to grow beyond 14,000 TEUs to realize any incremental savings because12,000 TEU+ ships need twin screws. The consultants did not expect the largest ships inthe trans-Pacific fleet to exceed 12,000 TEUs by 2020. The trans-Atlantic headhaul tradehas grown at a compound annual growth rate (CAGR) of 4.7% from 1990-2003, Asia-North Europe at 10.0% CAGR, and Asia-North America at 9.2% CAGR. Average vesselsize had increased by 72% and the total capacity of the global fleet had grown by 308%in the same period.
Policy and Regulatory Issues
“A Review of Regulations Governing Use of International Marine Containers inCanadian Domestic Cargo Carriage: Part I – Project Summary Report”8 is a report thatexamines Canadian and American container cabotage legislation as well as reformsoccurring in other countries. The study points out that US legislation allows for 365 daysof “unfettered” domestic usage with international equipment, whereas Canadianlegislation only allows the container to remain for 30 days duty-free, or 180 within acontainer pool. The study found the 30-day rule a hindrance to shippers wishing todevelop more innovative ways of using empty containers. Four case studies indicated fuelsavings and capacity gains if the rule was relaxed. Data obtained for the study indicated20-40% of marine containers are moved empty through Canadian ports, and thatCanadian National (CN) has a daily average of 3,000 empty containers in its westernCanadian yards. It recommended a National Cabotage Review Steering Committee beformed and that any additional studies be funded through federal climate change funding.
The April 2006 “Final Report Review Policy Changes for Transportation andCompetitiveness”9 states the importance of transportation to Saskatchewan, particularlyfor exports. It also reiterates the importance of transportation as the province transitionsto exporting more value-added and identity-preserved products. At the present time,Saskatchewan’s demand for export containers exceeds supply and a system needs to bedeveloped to coordinate supply and demand. It also discusses the issue of running rights.
7 Mercator Transport Group, “Forecast of Container Vessel Specifications and Port Calls within SanPedro Bay” February 2005.
8 Supply Chain Solutions International and University of Manitoba Transport Institute, “A Review ofRegulations Governing Use of International Marine Containers in Canadian Domestic Cargo Carriage: PartI – Project Summary Report,” December 2005.
9 Saskatchewan Agrivision, Triticum, Regina Regional Economic Development Corp., “Final ReportReview Policy Changes for Transportation and Competitiveness,” April 2006.

Use of Containers in Canada – T8080-06-0175 A-6
November 24, 2006
The report suggests the country needs a national container freight strategy and increasedinvestment in infrastructure.
In “The Shipping Conferences Exemption Act: Review and Suggestions of PositionsAppropriate for the Panel,” Trevor Heaver examines issues relating to the ShippingConferences Exemption Act, 1970.10 This Act basically exempted shipping lines fromanti-combines legislation and protected the conference system which had been in placefor over 100 years. At the time it was passed, the shipping industry was divided betweenconference and non-conference carriers, i.e. those which operated inside a cartel-likestructure and those which operated outside it. Shipping lines now operate within“stabilization” agreements and alliance structures, theoretically giving them massivenegotiating power. This power was offset by new capacity entering the trade, and newentrants such as China Shipping entering the marketplace. By 2003, shippers had changedtheir minds about the Act because of changes to the structure and economics of the linershipping industry. They had also learned (through deregulation of other industries) thatthe removal of collective pricing could be very beneficial. The author recommendsreplacing the SCEA with something else more in the interests of shippers and consistentwith the interests of the shipping lines and ports.
In “Recent Developments in International Shipping Policy and their Implications forCanada,” Hodgson and Brooks focus on deep sea shipping policy and how Canada’spolicy has evolved since the 1960s.11 The authors quote Gunnar Sletmo, who suggestedCanada’s de facto shipping policy is to have no policy at all. Canada has had a verylaissez-faire approach to international shipping and has always deflected calls to establishcargo reservation policies or a Canadian merchant marine fleet. Canadian shippers havebenefited from having a myriad of choice when it has come to shipping productsoverseas. However, the country has also missed out on opportunities to develop shipmanagement and other aspects of the shipping industry which have been seized upon bycountries such as Germany and Denmark.
Another study by Hodgson and Brooks reviews previous work relating to the issue ofCanada’s maritime cabotage policy dating back to the 1950s.12 It then explores recentdevelopments in other developed countries including the EU, Australia, and the US. Itconcludes by looking at options for Canada’s future domestic shipping policy. Itdescribes the “artificial” barrier between Canada’s domestic and international operations.It concludes there are fundamental flaws in the rationale for application of a 25% duty onimported vessels. In terms of the present study, the section describing the development ofCanada’s domestic versus international policy is most relevant.
10 Trevor Heaver, “The Shipping Conferences Exemption Act: Review and Suggestions of PositionsAppropriate for the Panel,” CTA Review, 2003.
11 JRF Hodgson and Mary R. Brooks, “Recent Developments in International Shipping Policy and theirImplications for Canada,” 2003.
12 JRF Hodgson & Mary R. Brooks, “Canada’s Maritime Cabotage Policy,” 2004.

Use of Containers in Canada – T8080-06-0175 A-7
November 24, 2006
Empty Container Movements
The “Empty Container Dynamics Study” is a thorough examination of the movement ofempty containers throughout the Vancouver region.13 It stresses the need to manage thisactivity to optimize the overall logistics chain and use road and rail capacity as efficientlyas possible. Most stakeholders are very familiar with their own situations but do notnecessarily have knowledge or understanding of the system as a whole. The availabilityof export cargo at the Port of Vancouver provides it with a competitive advantage overUS West Coast rivals. One major conclusion was that the storage of empty containers atmarine terminals causes congestion during peak periods and impedes overallcompetitiveness. It was suggested that these could be minimized by reducing dwell timesof empty containers and reducing double-handling and empty truck movements.Moreover, importers, exporters and off-dock facilities and truckers do not function as acoordinated system. The report made four specific recommendations: 1) reduce dwelltimes of empty containers at all marine terminals during peak periods; 2) investigate thecosts and benefits of minimizing repositioned empty containers returned by rail; 3) as in2), but related to truck movements; and 4) relocating some container service to off-docklocations.
The Los Angeles/Long Beach port complex is the largest hub in North America, handling14.2 million TEUs in 2005. By 2020 it is expected to handle 28 million TEUs. As aconsequence, port generated traffic is a major cause of traffic congestion. In“Development of Methods for Handling Empty Containers with Applications in the LosAngeles/Long Beach Port Area,”14 the authors examined ways to handle emptycontainers leading to more efficient operations of container transportation. It looks at thepossibility of handling empty containers outside the container terminals, because it ispredicted that by 2020 the port will handle almost 5 million empties. At the same time,shippers will need 1.9 million empties. It concludes that a system which facilitates theinterchange of empties outside ports is desirable and necessary and considers twomethodologies: 1) depot-direct; and 2) street-turn. In the first instance, empty containersare stored, maintained and interchanged at off-dock container depots. In the secondinstance, the container is moved directly from the local consignee to local shippers.
Movement of Containerized Grain in Canada
“The Movement of Grain in Canada: Issues and Measures,”15 is a presentation whichshows the cost differential for source loaded versus port loaded containers. Thedifference is especially acute in Saskatchewan, whereas it is about 6% in Alberta. It also
13 Sandwell Engineering Inc., “Empty Container Dynamics Study,” May 2002.14 METRANS Transportation Centre, “Development Of Methods For Handling Empty Containers
With Applications In The Los Angeles/Long Beach Port Area: Final Report,” METRANS Project 04-05,March 2006.
15 Quorum Corporation, “The Movement of Grain in Canada: Issues and Measures,” Presentation, July2006.

Use of Containers in Canada – T8080-06-0175 A-8
November 24, 2006
illustrates the percentage value (3%) of Canadian shipments to the container linecompared with that of Asian imports. It describes process flows, data flows and theamount of risk exposure and some industry practice that results in sub-optimization of thesupply chain. Cabotage is an issue that needs to be resolved even though the rules areloosely enforced. It also points out that special crops are not conducive to whole unit trainmovement and car allocation is an issue. Other issues and challenges include thesuggestion to treat logistics as a profession rather than an administrative burden. There islimited knowledge of the port sector on the part of most grain shippers. Suggestedmeasures include: container movements (statistics and demographics); equipmentavailability; and velocity and special crops data.
The study “Container Measures Study: Issues and Discussion for Proposed Measures forthe Grain Monitoring Program” (on which the above presentation is based) investigatesand provides an assessment of the issues and challenges surrounding the movement ofspeciality crops and grain to export points in Western Canada.16 The paper providesinsights on the logistics of source loading and port loading activities, including amovement economic model based on actual costs and the risks associated with containeravailability, repositioning and storage, which cause delays to the shippers and increasethe risks. It highlights the lack of harmonization in the system's mechanisms (forecasting,operational processes, and communications), that affect the overall efficiency of thesupply chain. The Quorum Corp. study indicates that shippers suffer from the absence ofdirect customer service from the railway companies. Documentation issues (letter ofcredit, US Customs, CBSA, D3 Regulation, etc.), communication issues and commercialrelationships with the railways are risk elements to the shippers. It suggestsimprovements to the Grain Monitoring Program (GMP) to include containers and toincrease the focus on special crops. The study concludes that the overall lack of statisticalmeasures has negative impacts and that additional measures (traffic, movement, andallocation performance measures) are required to improve the overall efficiency of thesupply chain performance.
Containerization on the Prairies
In “Exploratory Study of the Alberta Intermodal Containerized Freight System,” the GTSGroup examined the intermodal containerized freight system serving Alberta.17 Mostintermodal containerized freight was found to be transported in and out of the Calgaryand Edmonton regions where rail intermodal terminals are located, and containerizedshipments are most often used for international shipments. West Coast containerizedmoves are dominated by 40 foot units and an increasing number of 20 foot reefers werefinding their way onto the Prairies from Australia and New Zealand. Shipping lines wereexpecting to see fewer containers moving inland with more being transloaded or going to
16 Quorum Corp, “Container Measures Study: Issues and Discussion for Proposed Measures for theGrain Monitoring Program,” Report of the Grain Monitor: Supplemental Program, June 2006.
17 GTS Group International, “Exploratory Study of the Alberta Intermodal Containerized FreightSystem,” June 2004.

Use of Containers in Canada – T8080-06-0175 A-9
November 24, 2006
Distribution Centres in Vancouver. This results in fewer marine containers beingavailable in Alberta, Saskatchewan and Manitoba. About two-thirds of shippers and one-half of third parties interviewed indicated they used international steamship service.Domestic intermodal was used by 38% of system users. Factors limiting growth ofoutbound intermodal containerized shipments were: 1) availability of temperaturecontrolled equipment; 2) global sales efforts; 3) acceptance of Alberta’s food andagricultural products; and 5) exchange rates. Price was a factor, as was service reliability;availability/suitability of equipment was also cited. Intermodal was not used when on-time performance was important. Issues facing Alberta’s containerized shipping systemincluded: 1) terminal access; 2) congestion; 3) volume/capacity; 4) container handling; 5)customs/security; and 6) labour, among others.
“A Look at Container Stuffing Locations” examined whether Alberta’s exporters loadtheir containers at source (source loading) or whether they send their goods to a locationcloser to the port (port loading).18 The study found that the majority (57%) of Albertashippers source load their products into containers, compared with 47% who transloadednear a port facility. This practice was unevenly split among various commodity groups:56% of grain, pulse and feed shippers source loaded, while only 4% of forest product and80% of industrial producers did. The main reason shippers did not source load was theavailability of containers. In order to obtain a better supply of containers, betterforecasting was needed on the part of the producer/shipper.
In “Peace Region Access to Container Transportation: Restructuring a Northern AlbertaRail/Road Intermodal System,” the authors examine the potential for extending rail-basedcontainer service into the Peace River region.19 At the time of study, containertransportation was used primarily for exports through BC ports by truck via Edmontonand thence to port terminals in Vancouver. There is a relatively high volume of lowervalue, cost sensitive cargo available in the region. Containers are considered attractive forexport expansion and identity preservation of agri-food products. It was also determinedthat the cargo was not sufficiently profitable for CN to provide competitive rates forconnecting short lines but that container transportation is beneficial for export baseloading to further lower handling costs and divert long haul trucking. It was estimatedthat the total Peace region market consisted of 13,800 containers ex BC ports and about800 for East Coast destinations.
The “Feasibility of a Saskatchewan Container Pilot Project” provides an overview of thelack of empty container availability to special crop traders in Saskatchewan.20 This studyindicates that improved accessibility of containers would enhance the globalcompetitiveness of Saskatchewan based shippers. This study examines the feasibility ofrunning a container pilot project with the objectives of increasing the awareness and
18 Charlene Sych, “A Look at Container Stuffing Locations” (no date).19 ProLog Canada Inc., “Peace Region Access to Container Transportation: Restructuring a Northern
Alberta Rail/Road Intermodal System,” March 2003.20 Logistic Marketing Services, “Feasibility of a Saskatchewan Container Pilot Project,” July 2001.
Use of Containers in Canada – T8080-06-0175 A-10
November 24, 2006
improving the logistics of container placement in the province by coordinating thetransactions among the key players. The proposed solution includes:
Costs of expanded uses of containers compared to the current system; Transportation logistics and communications system requirements for Saskatchewan; Viability of container rail loading points; Establishment of peak shipping periods; and Recommendations.
Of notable interest, most container lines were not aware of the future growth potential ofvalue-added agriculture in Saskatchewan. The province was seen to be at a transportationdisadvantage compared with Australia, but not elsewhere in the world. It was estimatedthat there would be demand for 15,100 TEUs of West Coast pulse exports fromSaskatchewan by 2007 and a further 17,000 over the East Coast. The study examinedempty moves from east to west through Saskatchewan and found that about 16,000containers traversed the province empty in 2000. It was found that a site in Saskatoonwould minimize the amount of road miles required to move containers to an intermodalyard.
In “Assessment of Overseas Container Service: Issues and Opportunities forSaskatchewan Exporters,” DDC Consulting Services estimated that $500 million ofSaskatchewan products are shipped in export containers annually.21 Most of theshipments are agricultural products such as pulse crops, high protein feeds, and barley, aswell as farm machinery, pulp, meat, and foodstuffs. It indicates that 175,000 containersleave empty from Vancouver to Asia, while an estimated 35,000 to 50,000 containers areexported from Saskatchewan, of which over half are loaded at port. The study estimatesthat the use of containers for grain shipping represents a saving of approximately $15 pertonne. However, it also states that the cost of shipping a 20-foot container of grain to Asiavaries from US $800 to US $1,500. The study also indicates that transloading at the port(Prince Rupert and Vancouver) adds $18 to $50 per tonne. Offshore exports represented$3.7 billion or 36% of Saskatchewan's export trade in 2003. The annual transportationbill is $100-150 million. The report details a number of key issues: 1) empty containershortage; 2) repositioning of empty containers; 3) specialized container shortages;4) transportation rate sensitivity; and 5) scale economies. Suggestions for addressing theissue included: 1) creating shipper consortium; 2) working with Prince Rupert to developa second corridor; 3) enhancing inland container port operations; and 4) developing aSaskatchewan distribution hub.
21 DDC Consulting Services Inc., “Assessment of Overseas Container Service: Issues andOpportunities for Saskatchewan Exporters,” December 2004.

Use of Containers in Canada – T8080-06-0175 A-11
November 24, 2006
Western Container Studies
A recent study in Kamloops examines the potential to build an inland terminal atKamloops, in the BC interior.22 It would offer re-load facilities, storage, or customsfacilities for containerized, break bulk, and bulk cargo moving by rail to the Port ofVancouver. The main opportunity is to transport lumber and pulp products.Approximately 43,000 TEUs of container volume originates from this region on anannual basis. Anticipated benefits would include reducing the number of trucks on theTCH, increasing efficiency and capacity at the Port of Vancouver, reducing costs forexport shippers, etc. Challenges include obtaining rail cooperation and buy-in, access toempty containers, and logistical challenges (i.e. the necessity for JIT shipments andcompetitiveness of trucking direct to port).
The ”North Dakota Strategic Freight Analysis” is a very relevant study in terms of thepresent exercise.23 At the outset, it states that intermodal truck-rail transportation offerstwo distinct advantages: 1) it allows combining the better service characteristics of truckwith lower rates of rail; and 2) it increases the ease of shipping internationally. It alsostates the North Dakota commodities ideally suited to container movements includevalue-added wood products and furniture, industrial and agricultural machinery, andproducts such as soybeans and confection sunflowers, as well as organic and identitypreserved grains. The benefits of intermodal transportation are many, including: lowerlogistics costs; increased productivity; reduced congestion on highways; reduced energyemissions; increased safety; and opportunities for new business growth anddiversification.
Atlantic Region Studies
MariNova Consulting Ltd. has been involved in two studies that are relevant to thisproject. “The Greater Halifax Distribution Study”24 examined the potential to attractdistribution centres to the Halifax region. It concluded that due to the region’s smallpopulation base of just 2.4 million people, it was not likely to attract this type of activity,but that transload operations offered more potential. Since the study was completed in2004, two companies have established transloads in the area. The idea is to balanceimport containers coming back empty to Halifax from Toronto, with eastbound trucksthat were going back to central Canada empty. The transload operations afford theopportunity for containers to stay in Halifax where they can be loaded with exports.
22 Advanced Technology Centre, “Opportunity Assessment for an Inland Intermodal Container Facilityin Kamloops,” September 2006.
23 Upper Great Plains Transportation Institute, “North Dakota Strategic Freight Analysis,” November2002.
24 MariNova Consulting Ltd., “Greater Halifax Distribution Study,” 2004.

Use of Containers in Canada – T8080-06-0175 A-12
November 24, 2006
Another MariNova study, the “Halifax Inland Terminal and Trucking Options Study,”25
examined the issue of heavy container-laden trucks travelling city streets and thepotential use of CN’s rail cut through the city to be used as a rail and truckway. Thisoption was found not to be possible, but the study proposed that an inland terminal bebuilt about 15 kms from the southend container terminal and that rail shuttles be operatedfor local traffic. It would be located in an area close to major distribution and warehousefacilities and offer some synergies with that sector.
A similar study has been completed for a transport node in Moncton, New Brunswick,but the study has not been released.
Academic Studies
The Transport Institute at University of Manitoba study “A Mixed Logistics Strategy forGrain: The Competitiveness of Containers versus Bulk”26 provides a review of thelogistical aspects of bulk and containerized shipping systems and of the historicalcontext. It highlights the transportation requirements for IP grain and GMOs andindicates a cost saving of $3 to $5 per ton for backhauled containers versus bulk shippingfrom Vancouver to Asia. It provides an overview of the recent changes in the grainindustry:
More smaller numerous independent buyers; IP Grain; GMOs; GMO Free; JIT; KVD; and Trade imbalances.
This study compares the economic aspects of bulk versus containers and highlights theadvantages and disadvantages of both systems in addressing the markets. It alsohighlights the trade imbalances and presents the cost elements of both systems. Thisstudy is limited to the shipping of grain commodities, however it provides a rationalapproach to the transportation issues by comparing the two systems.
In the article “Multicommodity network flow model for Asia’s container ports,” theauthors pay most attention to Asia-Europe and Asia-North American trade, however thispaper demonstrates the importance of intra-regional trade within the Asian port system.27
For some ports this is becoming a very large portion of the cargo they handle and shouldnot be ignored. It occupies terminal space and impacts on the intermodal system.
25 MariNova Consulting Ltd., “Halifax Inland Terminal and Trucking Options Study, 2006.26 The Transport Institute – University of Manitoba, A Mixed Logistics Strategy for Grain The
Competitiveness of Containers versus Bulk,” October 2002.27 Loo Hay Lee, Ek Peng Chew, Leng Siang Lee, “Multicommodity network flow model for Asia’s
container ports,” Maritime Policy and Management, September 2006.

Use of Containers in Canada – T8080-06-0175 A-13
November 24, 2006
The paper “The time factor in liner shipping services” describes how container shippinglines have developed (or at least aim to develop) liner service networks characterized bylow operating costs, high frequencies, fast transit times, and both tight and reliablevoyage schedules.28 Container shipping has made possible just-in-time production andstore replenishment. The paper offers an analysis of transit times and schedule reliability,and identifies and evaluates sources of delays. In a narrow approach, the transit time canbe defined as the number of sailing days on a port-port basis. In a broader logistics chainapproach, the transit time is the total time on a door-door basis, including dwell times atterminals and drayage to and from the shipper.
A European article, “Southern European Ports and the Spatial Distribution of EDCs,”states the creation of a borderless trade area in the EU in the early 1990s led to a differentnetwork of distribution centres (DCs) and a restructuring of logistics.29 The recentenlargement to 25 countries will lead to a de-concentration of the distribution system,setting up DCs in Eastern Europe. The article points out that inland distribution isbecoming a very important dimension of the globalized transport system. Structuralchanges in logistics have generated new patterns of freight distribution and theregionalization of port-related activities. Manufacturers and retailers outsource logisticshandling of their products towards distribution centres located near consumer markets.European Distribution Centres (EDCs) are usually located near producers’ end usemarkets but many are now being located close to ports to take advantage of or exploitsynergies.
28 Theo E. Notteboom, “The time factor in liner shipping services,” Maritime Economics & Logistics,8, 2006.
29 Claudio Ferrari, Francesco Parola & Elena Morchio, “Southern European ports and the spatialdistribution of EDCs,” Maritime Economics and Logistics, 8, 2006.
Use of Containers in Canada – T8080-06-0175 A-14
November 24, 2006
Appendix C – Best Practices
The logistics industry is aware of the need to identify best practices using benchmarkingtechniques. This is a global issue because all maritime supply chains are facing commontrends and issues including the need to manage supply chains in order to remaincompetitive, growth in trade and container traffic, increased congestion on roads,increasing awareness of environmental issues, greater awareness of security, and thedevelopment of new technology. These issues have created common challenges, one ofwhich is the need to develop a logistics chain view and the associated managementbehaviours. The use of Best Practices is one factor that will facilitate the development ofa supply chain view.30
For this section, we interviewed two American examples of Best Practice including twoThird Party Logistics Providers (3PLs)—PacerStack Train and Midwest ShippersAssociation. We also reviewed additional literature with respect to supply chainmanagement, site location assessment for DCs, and US planning strategy reports.
Pacer Stacktrain
Pacer Stacktrain is a 3PL provider of transloading and backhaul drayage for bothdomestic and international containers from the US West Coast and US Midwest. Theyalso service Mexico and Canada, and have been affiliated in the past with APL, whichoperated the APL Linertrain. The company also provides domestic and internationalfreight brokerage services, warehousing services, and local drayage. It is a publicly heldcompany traded on the NYSE.
This company handles 1 million TEUs annually, over 20% of total containerized railshipments in North America. It has contracts with various mid-size lines, and $375million in annual sales. It has its own equipment, including leased railcars and containers,and provides third party services to warehouses and cross docks. It has 1,858 doublestack railcars, 28,231 containers, and 28,697 chassis for 53 foot domestic containers. Itoperates over 54 ramps, 48 container yards and has the largest domestic container fleet inNorth America.
Pacer Stacktrain’s clients include the auto sector, which represents 20% of movements.Other clients include CH Robinson, General Electric, Sony, Union Pacific, Toyota,Whirlpool, Big Lots, The Scotts Company, Shaw Industries, Owens Corning and Sysco.The company also has 1,000 international clients.
30Trevor Heaver, “Current Trends and Issues in the Maritime Supply Chain,” paper presented at thePlanning and Transport Research Centre’s Industry Conference on Maritime Logistics: Land-side Issuesand Opportunities, November 2004.

Use of Containers in Canada – T8080-06-0175 A-15
November 24, 2006
It has long-term contracts with UP, BNSF, CSX, KCSM and CN. It providesrepositioning services to container lines for their units, and in 2005 repositioned 91,628units, slightly down from 2004 when volumes were 94,827.
Pacer Stacktrain’s best practices include:
1. Proactive shipment monitoring;2. Door to door services, thus they are the agent to provide services;3. Double stack services;4. C-TPAT certified;5. Non-asset based strategy, have numerous agreements with transportation carriers and
equipment providers, reduces working capital;6. Use independent owner operators for trucking;7. Reposition services for container lines;8. Multi-lingual capabilities; and9. Insurance coverage.
They expect rail service delays of two to four days with all rail companies to continue,due to congestion. They compete with rail carriers on domestic container services usingthe railroads infrastructure.
Midwest Shippers Association
This association was created in 2002 and is based in Minneapolis. It was created to assistsmaller operators/growers located in the Midwest to market their identity preserved (IP)products to international markets and provide logistic and educational services tomembers.
The Association provides the following services to its members:
Negotiates annual volume contracts with container lines; Assists in documentation requirements; Issues marine insurance; Conducts educational forums; and Hosts annual conferences re marketing IP and logistics.
They have similar issues to sourcing containers in the Midwest as Western Canada does.They will book and supply containers to Midwest. Drayage is from Minneapolis to NorthDakota or Iowa at US $600 to $800 per container. Empties typically are sourced fromChicago with demurrage charges applying at rail yards.
New contracts are to be negotiated with container lines expecting 30-40% increases inrates in Q1 2007, as container lines are renegotiating their current five to ten yearcontracts with Class 1 carriers in the US.
This Association provides a format and window to smaller shippers and growers whomay not want to market products direct to larger grain companies such as Cargill, Cenex

Use of Containers in Canada – T8080-06-0175 A-16
November 24, 2006
Harvest States (CHS), and Archer Daniels Midland (ADM). Through educational andtrade forums, they provide exchange and interaction between both the grower and endusers, as they identified marketing a as a service they can provide to interested end users.They have had delegates from Japan, Taiwan, and other Asian countries attend theirannual conference in Minneapolis.
Their exports are 80% to Japan, 10% to Taiwan, and another 10% to the EU. They alsohave limited access to funding resources, and thus are very selective as to what activitiesto engage and invest in, and where they can get the best returns for their members. Mostrecently, they have been emphasizing marketing and freight contracting services.
Melbourne, Australia
In Australia, especially at the ports of Sydney and Melbourne, port-adjacent and inner-city gridlock is driving the mantra of “more containers on rail.”31 Australia’s containerterminals are operating within their capacities but their dependence on road and truckingoperations is having a major impact on the inner city locations of terminals. The solutionappears to be “more containers on rail” but Ross Robinson, author of the paper “Port-oriented landside logistics in Australian ports: A strategic framework,” suggests this is a“coping” rather than a long term development strategy. He suggests a closer look at the“drivers” of landside logistics is called for. There has been a realization on the part ofport authorities and terminal operators that control over landside competitive space iswhere significantly higher margins can be obtained. Value has also migrated fromindividual corporations to sets of logistics chains. The new value is in the integration ofthese chains. Three terminal operators have three different strategies at the Port ofMelbourne. The most recent entrant has built a new terminal in the inner harbour alongwith an inland terminal outside the port area.
BTS and FHWA
US state and National Federal Highways (BTS) provide benchmark studies with respectto evaluating transportation flows of containers, rail and truck. There is a modeldeveloped by the Office of Freight Management and Operations of the Federal HighwayAdministration (FHWA) that: 1) estimates commodity flows and associated freightactivity; and 2) forecasts changes because of shifts in economic factors, transportationassets, etc. The FHWA is currently enhancing the model so that it will provide betterestimates of freight flows and impacts of policy changes, and utilize better data sources.The improved model will be able to provide forecasts up to 2040.32
31 Ross Robinson, “Port-oriented landside logistics in Australian ports: A strategic framework,”Maritime Economics and Logistics, 8, 2006.
32 FHWA, DOT, “Freight Analysis Framework: Issues and Plans,” April 2004.

Use of Containers in Canada – T8080-06-0175 A-17
November 24, 2006
Impact of Shifting Container Flows
Michael McGowan’s article, “The impact of shifting container cargo flows on regionaldemand for US warehouse space,”33 identifies how the recent increased flows ofcontainers have increased the need for more intermodal trains to inland locations. Thestudy reviews container flows and how new distribution centres will gravitate towardsrail centres such as Chicago, Memphis, St. Louis and New Orleans. The study shows thatten 40 foot containers can be transloaded into seven 53 foot domestic containers, thusresulting in lower costs to shippers and carriers. The paper discusses some strategies ofretailers such as Wal-Mart and Target Stores, with respect to locating larger DCs to ruralareas for lower wages to offset higher drayage charges.
Another example of best practice evaluates a research paper that developed a model tosimulate US container transportation routes for different cargoes through various ports.34
The model compares 14 ports across the US and the areas that they serviced. The modelalso provides an example of increasing port charges and the impact on where cargowould flow. The model requires international trade patterns, geographical locations ofports, service areas, availability of multi modes, and port costs. The model provides abasis to evaluate spatial change of port service trade areas due to changing trade andeconomic conditions.
Benchmarking the Performance of Intermodal Transport
The OECD has also published several studies on this subject, such as “BenchmarkingIntermodal Freight Transport,” 2002.35 The purpose of this study was to review the issuesrelating to developing a performance model to assess the relative efficiency ofmodes/modal combinations and intermodal transfers, and to identify inefficiencies thatcould contribute to modal choice.
The study outlines a framework for measuring intermodal performance, comparing price,financial issues, transit time, damage, ease of use, technical issues and asset management.It provides a comparison of distance-based to value-based to time-based and thewillingness to negotiate between parties in the supply chain. The steps outlined toconduct an intermodal evaluation are as follows:
Indicators of modal split and intermodal relation for all modes; Weights for indicators; and Aggregation rule to find one value for evaluation procedure.
33 Michael McGowan, “The impact of shifting container cargo flows on regional demand for USwarehouse space,” Journal of Real Estate Portfolio Management, May-Aug 2005.
34 Miffing Lou and Thomas A. Grigalunas, “A Spatial Economic Multimodal TransportationSimulation Model for US Coastal Container Ports,” Univ. of Rhode Island, 2002.
35 OECD, “Benchmarking Intermodal Freight Transport,” 2002.

Use of Containers in Canada – T8080-06-0175 A-18
November 24, 2006
The indicators that are used for weight need to be relevant, complete and quantifiable. Allindicators need to be monetary. They suggest four indicators for simplicity:
1. Price of transportation over total supply chain;2. Cost of total travel time;3. Cost of total waiting time; and4. Value of container load.
Evaluations should be targeted at specific components such as routes or corridors.Geographic groupings incorporating shipping lines, wharves, container yards, accessroads should be benchmarked. Data needs to be collected to benchmark components ofthe supply chain. The study also provides the formula for the Inter-modal evaluationmodel that can be applied across all modes within the network. Once all the supply chainsare compared, the model would identify the most efficient route network.
Australian Data Collection
Access to information and the publication of data used by players within the marketplaceprovide mutual benefits to stakeholders. In this regard Southern Australia Ports publishkey statistics of container flows through their ports comparing imports-exports ofcontainers by container type between 20 to 40 ft and whether the container is used for dryor reefer cargo. The following table shows the reporting structure of containers inFlinders Port Districts.
Port Adelaide containers Sept 2006 by Trade Region
Empty Container Table Port Adelaide
COMMERCIAL Import/Export CONTAINERISED Goods excl. OVERSTOWS in TEUs
Flinders Ports gives no guaranteeregarding this information and acceptsno liability for any inconvenience, or anydirect or consequential loss, arising fromreliance upon this information.
Port Adelaide
Dry Reefer Dry Reefer Dry Reefer Dry Reefer
Cereal preparations- n.e.s. *** 0 0 0 0 0 2 0 0 0 2
Chemical products n.e.s. 7 0 12 0 19 0 0 0 0 0
Consignments not classified by commodity 35 0 20 0 55 24 0 0 0 24
Lead- unwrought (i.e. bullion- ingots- pig lead etc) 0 0 0 0 0 1 0 0 0 1
Meat - fresh- frozen or chilled- n.e.s. 0 0 0 0 0 0 4 0 4 8
Peas - field 0 0 0 0 0 1 0 0 0 1
Seeds ( of a kind used for sowing ) 0 0 0 0 0 2 0 0 0 2
Wool- greasy 0 0 0 0 0 0 0 8 0 8
Seychelles Meat - fresh- frozen or chilled- n.e.s. 0 0 0 0 0 0 1 0 0 1
Chemical products n.e.s. 0 0 0 0 0 6 0 0 0 6
Consignments not classified by commodity 0 0 0 0 0 5 0 18 0 23
Copper- worked 0 0 0 0 0 1 0 0 0 1
Furniture- and parts thereof 0 0 0 0 0 1 0 0 0 1
Household appliances and parts- n.e.s. * 0 0 0 0 0 0 0 2 0 2
Lead- unwrought (i.e. bullion- ingots- pig lead etc) 0 0 0 0 0 15 0 0 0 15
Meat - fresh- frozen or chilled- n.e.s. 0 0 0 0 0 0 3 0 38 41
Seeds ( of a kind used for sowing ) 0 0 0 0 0 0 0 2 0 2
Wine and vermouth 0 0 0 0 0 1 0 0 0 1
Tanzania, United Republic of Consignments not classified by commodity 0 0 0 0 0 0 0 2 0 2
South Africa
AFRICA - SOUTH & EAST COAST Mauritius
Import Export
September 2006
40ft20ft 40ft 20ft TotalTotal

Use of Containers in Canada – T8080-06-0175 A-19
November 24, 2006
Flinders Ports gives no guarantee regarding thisinformation and accepts no liability for anyinconvenience, or any direct or consequentialloss, arising from reliance upon this information.
Import Export
AFRICA - SOUTH & EAST COAST 5 0
EAST ASIA 0 59
MEDITERRANEAN 0 2
NEW ZEALAND 220 0
NORTH ASIA 0 8
OTHER TRADE REGIONS 0 6
PERSIAN GULF 0 20
SCANDINAVIA 0 1
SOUTH ASIA 0 21
SOUTH EAST ASIA 239 1026
WESTERN EUROPE 0 35
464 1178Total
Port Adelaide
September 2006
COMMERCIAL Import/Export EMPTY CONTAINERS excl. OVERSTOWS in TEUs

Use of Containers in Canada – T8080-06-0175 A-20
November 24, 2006
Appendix D – Trade Data
Halifax Imports, Exports, Domestic Tonnage,Containerized, by Commodity Groups
Commodity Description 2000 2001 2002 2003Sector: DomesticMixed loads or unidentified freight or cargo 79,550.00 87,679.00 94,848.00 91,424.00Sector: ExportAlcoholic and non-alcoholic beverages 30,666.00 42,724.61 52,652.97 23,928.14Animal or vegetable fats, oils and flours 22,050.07 16,996.63 16,332.39 12,622.32Articles of base metal 55,213.16 49,733.30 30,287.52 35,406.08Coal coke and petroleum coke 8,240.38 5,633.59 17,158.79 7,705.05Crude petroleum 906.49 194.85 9.12 19.96Feed, cereal straw, eggs and other animal products 52,755.86 68,872.53 48,863.93 41,196.55Fertilizers (excluding potash) 3,183.66 2,860.56 1,778.42 2,070.31Fresh, chilled or dried fruit and nuts 27,098.77 23,437.97 26,146.38 30,974.58Fresh, chilled or dried vegetables 174,917.18 165,814.24 79,267.79 97,293.48Fuel oils 907.01 462.47 1,140.51 789.60Gasoline and aviation turbine fuel 108.80 82.02 240.11 94.61Iron and steel – primary or semi-finished 50,112.17 52,342.98 32,832.71 89,781.47Iron ores and concentrates 281.25 581.35 47.23 569.09Logs and other wood in the rough 33,163.28 24,903.23 13,236.87 9,103.89Lumber 58,399.99 63,047.95 61,229.74 57,773.10Machinery 130,043.72 160,205.65 163,328.44 158,475.68Meat, fish, seafood, and preparations 240,093.11 277,176.84 293,694.17 286,156.61Metallic waste and scrap 8,653.08 9,037.77 9,622.92 12,077.22Milled grain products and preparations, and bakery products 15,713.69 24,511.28 16,806.68 16,610.76Mixed loads or unidentified freight or cargo 11,568.33 1,149.78 2,695.82 7,505.57Newsprint 249,609.54 171,563.69 203,679.17 273,266.17Non-metallic waste and scrap 13,566.27 13,115.47 27,485.09 41,896.94Other basic chemicals 71,536.98 65,839.36 60,554.66 73,274.26Other chemical products and preparations 47,074.04 36,316.35 34,306.31 27,365.18Other manufactured and miscellaneous goods 314,154.33 290,980.19 248,913.99 224,407.81Other non-ferrous metal – primary or semi-finished 58,195.80 38,214.11 23,098.60 24,338.85Other non-metallic mineral products 62,625.17 55,774.61 57,461.20 43,614.56Other non-metallic minerals 188,706.05 173,614.13 160,629.29 140,713.95Other oil seeds and nuts and other agricultural products 54,387.53 47,864.91 41,672.83 33,022.34Other refined petroleum and coal products 9,592.97 11,614.02 8,118.81 7,579.65Other wood products (plywood, veneer) 12,884.22 10,599.49 11,295.66 7,585.54Paper and paperboard, except printed products 111,988.04 105,913.13 91,938.05 128,071.34Plastic and rubber 78,894.57 63,954.63 65,207.70 54,474.53Prepared foodstuffs (not elsewhere classified) 92,215.24 94,122.23 97,141.74 90,125.73Rye, oats and other cereal grains 2,756.82 2,105.66 1,118.69 1,140.36Salt 960.61 2,118.31 1,452.60 2,425.40Stone, sand, gravel and crushed stone 8,405.81 10,166.71 8,169.44 6,663.39Sugar 3,182.55 4,437.03 5,522.45 3,454.05Sulphur 8,921.68 15,101.77 14,032.40 12,645.81Vehicles and parts and accessories 72,211.51 34,385.31 34,683.44 46,968.29Wheat 1,453.62 2,349.02 169.57 326.65Wood chips 2,151.80 3,212.73 4,252.86 4,878.51Wood pulp 57,833.92 91,543.57 140,394.69 152,938.37

Use of Containers in Canada – T8080-06-0175 A-21
November 24, 2006
Commodity Description 2000 2001 2002 2003Sector: ImportAlcoholic and non-alcoholic beverages 107,120.26 131,382.78 128,115.38 123,986.09Animal or vegetable fats, oils and flours 19,452.96 19,564.87 21,710.54 26,049.78Articles of base metal 71,405.80 56,951.16 60,889.68 70,205.35Coal coke and petroleum coke 403.18 1,362.00 783.01 1,932.58Crude petroleum 17.43 9.95 49.31Feed, cereal straw, eggs and other animal products 23,888.40 19,803.25 15,270.56 19,412.05Fertilizers (excluding potash) 456.49 556.56 326.40 899.29Fresh, chilled or dried fruit and nuts 4,665.81 5,776.11 5,297.63 11,878.94Fresh, chilled or dried vegetables 12,224.01 9,254.53 13,302.41 14,255.28Fuel oils 7.20 127.23 1,106.73 68.83Gasoline and aviation turbine fuel 90.77 80.11 20.54Iron and steel – primary or semi-finished 54,226.84 53,497.55 48,334.48 49,823.34Iron ores and concentrates 549.13 379.63 2,605.41 6,297.02Logs and other wood in the rough 924.16 2,195.85 1,080.67 619.56Lumber 7,542.39 9,168.41 13,932.97 12,898.26Machinery 178,843.10 219,279.00 208,736.48 254,607.47Meat, fish, seafood, and preparations 60,855.94 72,869.81 54,590.03 88,111.65Metallic waste and scrap 1,618.39 3,286.88 2,150.60 1,481.13Milled grain products and preparations, and bakery products 13,134.63 20,499.38 19,020.63 13,820.81Mixed loads or unidentified freight or cargo 8,665.27 26,162.88 11,693.49 2,848.99Newsprint 3,046.28 418.79 469.54 84.29Non-metallic waste and scrap 165.60 21.69 442.90Other basic chemicals 88,998.83 121,893.94 103,261.00 110,362.73Other chemical products and preparations 50,793.72 40,751.03 45,332.72 52,827.99Other manufactured and miscellaneous goods 396,114.43 341,995.70 362,145.25 378,309.93Other non-ferrous metal – primary or semi-finished 25,316.77 27,714.14 35,592.15 30,290.71Other non-metallic mineral products 174,808.21 183,699.08 185,214.25 250,362.26Other non-metallic minerals 192.63 284.13 462.25 421.29Other oil seeds and nuts and other agricultural products 6,403.02 8,472.91 12,601.74 14,382.30Other refined petroleum and coal products 926.03 1,600.83 3,537.49 4,032.98Other wood products (plywood, veneer) 20,871.38 16,476.30 20,836.41 23,394.80Paper and paperboard, except printed products 49,962.21 45,500.22 53,960.80 57,423.93Plastic and rubber 103,412.73 112,023.48 126,102.36 122,463.75Prepared foodstuffs (not elsewhere classified) 197,751.35 203,974.42 202,918.78 211,356.45Rye, oats and other cereal grains 5,539.80 9,037.73 7,606.92 9,330.57Salt 99.62 867.58 1,041.97 1,121.95Stone, sand, gravel and crushed stone 7,409.83 15,212.80 24,243.87 16,789.45Sugar 189.32 1,486.37 1,732.72 2,758.46Sulphur 5,557.11 6,711.22 11,219.87 12,763.12Vehicles and parts and accessories 39,163.81 32,215.06 35,134.57 31,758.28Wheat 189.83 505.71 179.24 760.89Wood chips 1,771.77 22.85 1,364.90 44.98Wood pulp 1,395.81 3,045.51 6,311.54 3,270.08Grand Total 4,273,107.32 4,248,382.71 4,153,848.94 4,416,776.11

Use of Containers in Canada – T8080-06-0175 A-22
November 24, 2006
CANADA WIDE Exports
Canada-wide Exports by Containerization, 2000
Export Roll-on/Roll-off0.05%
Export Containerized7.29%
Export Non-containerized92.66%
Export Containerized Export Non-containerized Export Roll-on/Roll-off
Canada-wide Exports by Containerization, 2001
Export Roll-on/Roll-off0.02% Export Containerized
7.60%
Export Non-containerized92.38%
Export Containerized Export Non-containerized Export Roll-on/Roll-off

Use of Containers in Canada – T8080-06-0175 A-23
November 24, 2006
Canada-wide Exports by Containerization, 2002
Export Non-containerized92.17%
Export Containerized7.82%
Export Roll-on/Roll-off0.01%
Export Containerized Export Non-containerized Export Roll-on/Roll-off
Canada-wide Exports by Containerization, 2003
Export Non-containerized92.03%
Export Containerized7.92%
Export Roll-on/Roll-off0.04%
Export Containerized Export Non-containerized Export Roll-on/Roll-off
Use of Containers in Canada – T8080-06-0175 A-24
November 24, 2006
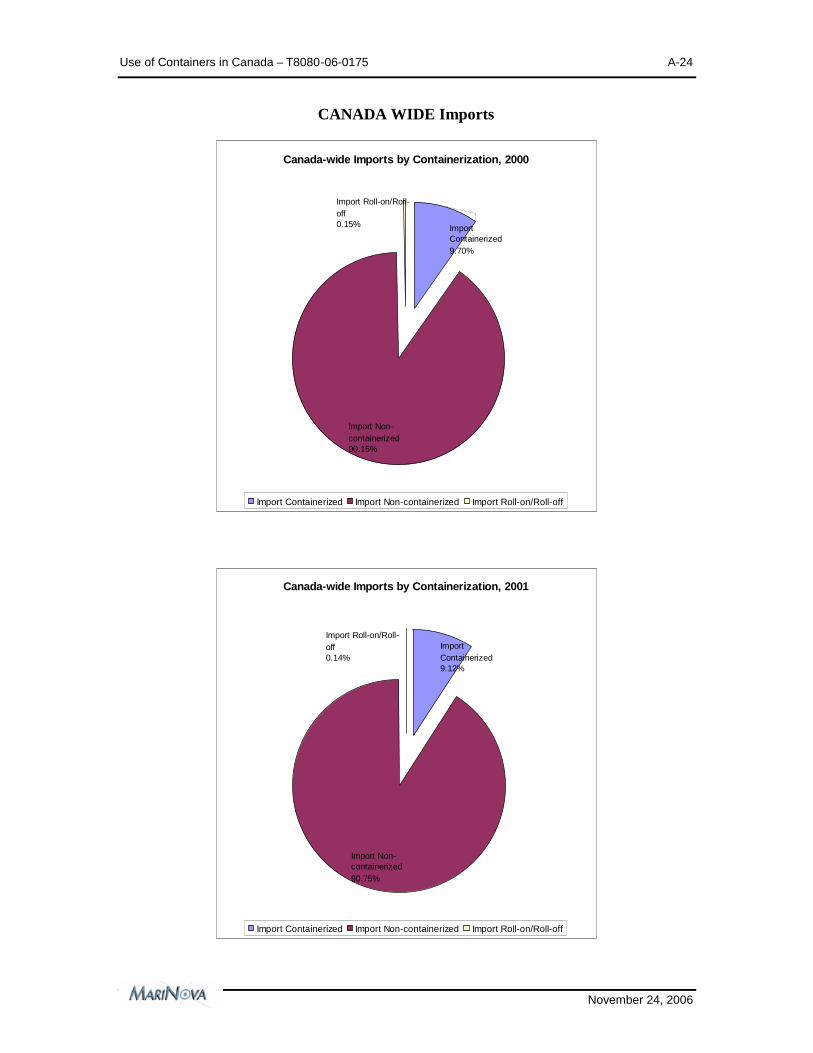
CANADA WIDE Imports
Canada-wide Imports by Containerization, 2000
Import Roll-on/Roll-off0.15% Import
Containerized9.70%
Import Non-containerized90.15%
Import Containerized Import Non-containerized Import Roll-on/Roll-off
Canada-wide Imports by Containerization, 2001
Import Non-containerized90.75%
ImportContainerized9.12%
Import Roll-on/Roll-off0.14%
Import Containerized Import Non-containerized Import Roll-on/Roll-off

Use of Containers in Canada – T8080-06-0175 A-25
November 24, 2006
Canada-wide Imports by Containerization, 2002
Import Roll-on/Roll-off0.16% Import
Containerized11.03%
Import Non-containerized88.82%
Import Containerized Import Non-containerized Import Roll-on/Roll-off
Canada-wide Imports by Containerization, 2003
Import Non-containerized88.52%
ImportContainerized11.32%
Import Roll-on/Roll-off0.17%
Import Containerized Import Non-containerized Import Roll-on/Roll-off
Use of Containers in Canada – T8080-06-0175 A-26
November 24, 2006
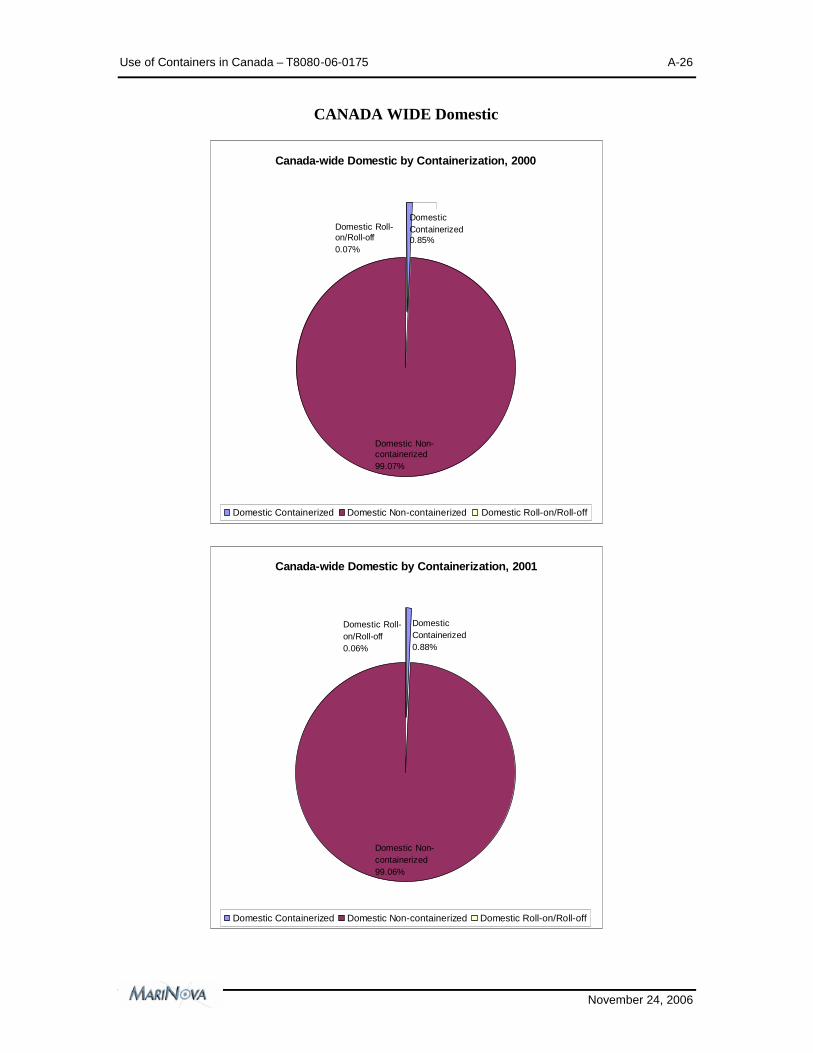
CANADA WIDE Domestic
Canada-wide Domestic by Containerization, 2000
Domestic Non-containerized99.07%
DomesticContainerized0.85%
Domestic Roll-on/Roll-off0.07%
Domestic Containerized Domestic Non-containerized Domestic Roll-on/Roll-off
Canada-wide Domestic by Containerization, 2001
Domestic Roll-on/Roll-off0.06%
DomesticContainerized0.88%
Domestic Non-containerized99.06%
Domestic Containerized Domestic Non-containerized Domestic Roll-on/Roll-off
Use of Containers in Canada – T8080-06-0175 A-27
November 24, 2006
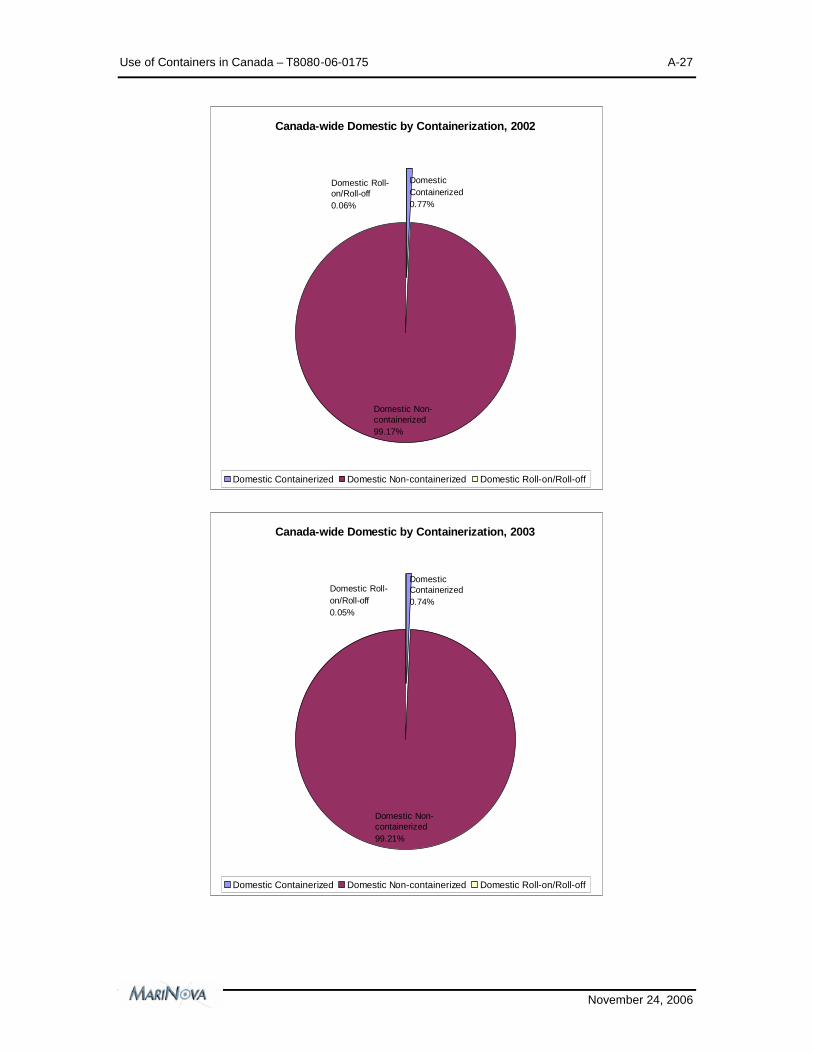
Canada-wide Domestic by Containerization, 2002
Domestic Non-containerized99.17%
DomesticContainerized0.77%
Domestic Roll-on/Roll-off0.06%
Domestic Containerized Domestic Non-containerized Domestic Roll-on/Roll-off
Canada-wide Domestic by Containerization, 2003
Domestic Non-containerized99.21%
DomesticContainerized0.74%
Domestic Roll-on/Roll-off0.05%
Domestic Containerized Domestic Non-containerized Domestic Roll-on/Roll-off
Use of Containers in Canada – T8080-06-0175 A-28
November 24, 2006
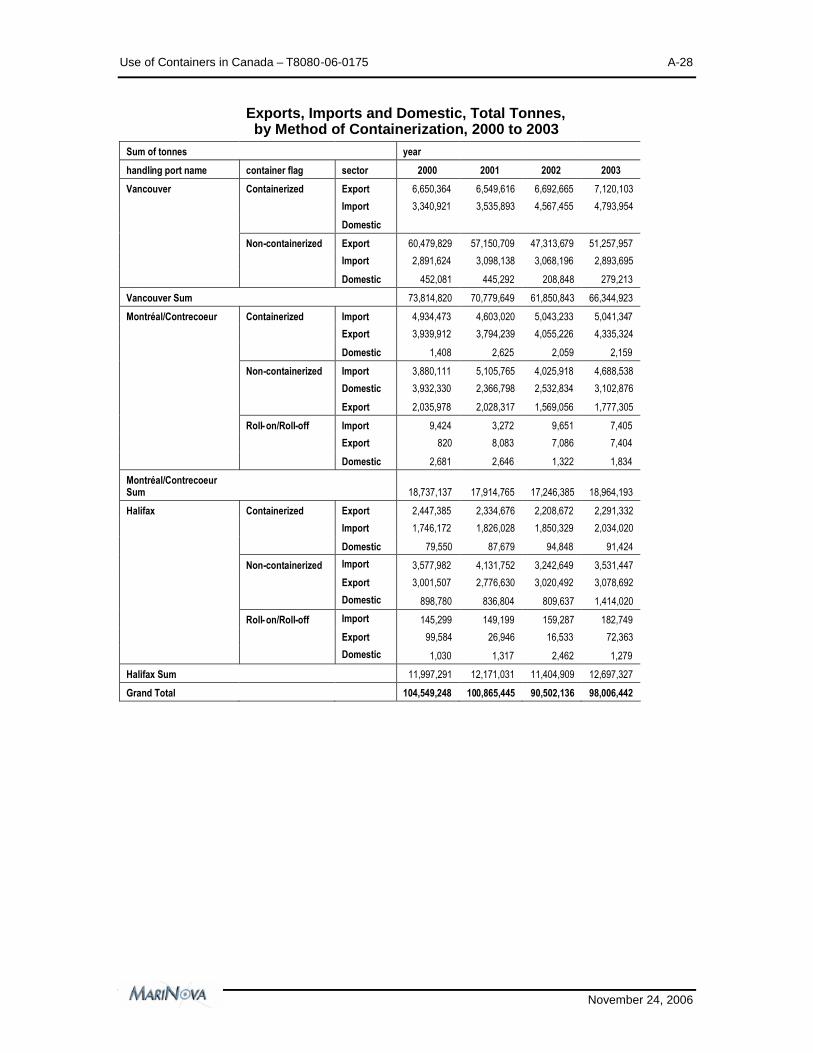
Exports, Imports and Domestic, Total Tonnes,by Method of Containerization, 2000 to 2003
Sum of tonnes year
handling port name container flag sector 2000 2001 2002 2003
Vancouver Containerized Export 6,650,364 6,549,616 6,692,665 7,120,103
Import 3,340,921 3,535,893 4,567,455 4,793,954
Domestic
Non-containerized Export 60,479,829 57,150,709 47,313,679 51,257,957
Import 2,891,624 3,098,138 3,068,196 2,893,695
Domestic 452,081 445,292 208,848 279,213
Vancouver Sum 73,814,820 70,779,649 61,850,843 66,344,923
Montréal/Contrecoeur Containerized Import 4,934,473 4,603,020 5,043,233 5,041,347
Export 3,939,912 3,794,239 4,055,226 4,335,324
Domestic 1,408 2,625 2,059 2,159
Non-containerized Import 3,880,111 5,105,765 4,025,918 4,688,538
Domestic 3,932,330 2,366,798 2,532,834 3,102,876
Export 2,035,978 2,028,317 1,569,056 1,777,305
Roll-on/Roll-off Import 9,424 3,272 9,651 7,405
Export 820 8,083 7,086 7,404
Domestic 2,681 2,646 1,322 1,834
Montréal/ContrecoeurSum 18,737,137 17,914,765 17,246,385 18,964,193
Halifax Containerized Export 2,447,385 2,334,676 2,208,672 2,291,332
Import 1,746,172 1,826,028 1,850,329 2,034,020
Domestic 79,550 87,679 94,848 91,424
Non-containerized Import 3,577,982 4,131,752 3,242,649 3,531,447
Export 3,001,507 2,776,630 3,020,492 3,078,692
Domestic 898,780 836,804 809,637 1,414,020
Roll-on/Roll-off Import 145,299 149,199 159,287 182,749
Export 99,584 26,946 16,533 72,363
Domestic 1,030 1,317 2,462 1,279
Halifax Sum 11,997,291 12,171,031 11,404,909 12,697,327
Grand Total 104,549,248 100,865,445 90,502,136 98,006,442

Use of Containers in Canada – T8080-06-0175 A-29
November 24, 2006
Containerized Exports by Trade Route; Tonnes; Halifax, Montreal, and Vancouver, 2003
0
1,000,000
2,000,000
3,000,000
4,000,000
5,000,000
6,000,000
7,000,000
8,000,000
Ha
lifax
Mo
ntré
al/C
ontr
eco
eur
Van
couv
er
Ha
lifax
Mo
ntré
al/C
ontr
eco
eur
Van
couv
er
Ha
lifax
Mo
ntré
al/C
ontr
eco
eur
Van
couv
er
Ha
lifax
Mo
ntré
al/C
ontr
eco
eur
Van
couv
er
Ha
lifax
Mo
ntré
al/C
ontr
eco
eur
Van
couv
er
Ha
lifax
Mo
ntré
al/C
ontr
eco
eur
Van
couv
er
Ha
lifax
Mo
ntré
al/C
ontr
eco
eur
Van
couv
er
Ha
lifax
Van
couv
er
Ha
lifax
Van
couv
er
Ha
lifax
Ha
lifax
Mo
ntré
al/C
ontr
eco
eur
Van
couv
er
Export Export Export Export Export Export Export Export Export Export Export
Africa (ExcludingMiddle East)
Antilles (CaribbeanIslands)
Asia (Excluding MiddleEast)
Central America Eastern Europe Middle East North America Oceania(PacificIslands)
South America U.S.Other
Western Europe
Use of Containers in Canada – T8080-06-0175 A-30
November 24, 2006
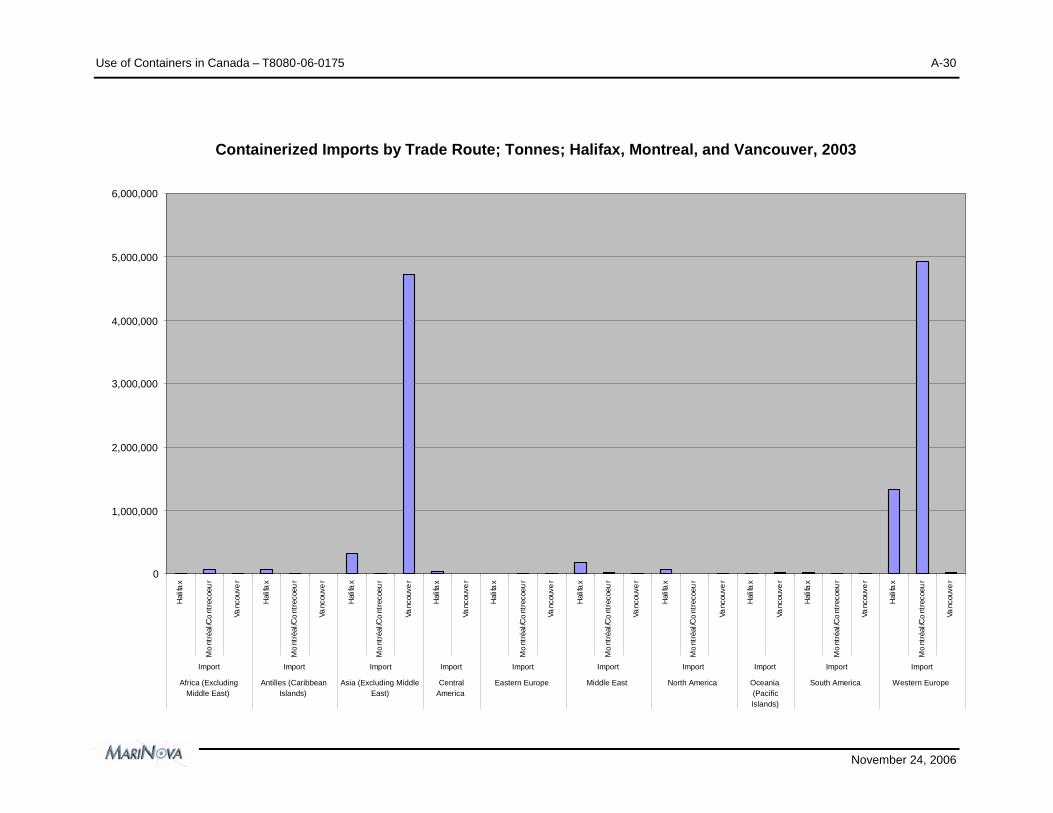
Containerized Imports by Trade Route; Tonnes; Halifax, Montreal, and Vancouver, 2003
0
1,000,000
2,000,000
3,000,000
4,000,000
5,000,000
6,000,000
Hal
ifax
Mo
ntré
al/C
ont
reco
eur
Vanc
ouve
r
Hal
ifax
Mo
ntré
al/C
ont
reco
eur
Vanc
ouve
r
Hal
ifax
Mo
ntré
al/C
ont
reco
eur
Vanc
ouve
r
Hal
ifax
Vanc
ouve
r
Hal
ifax
Mo
ntré
al/C
ont
reco
eur
Vanc
ouve
r
Hal
ifax
Mo
ntré
al/C
ont
reco
eur
Vanc
ouve
r
Hal
ifax
Mo
ntré
al/C
ont
reco
eur
Vanc
ouve
r
Hal
ifax
Vanc
ouve
r
Hal
ifax
Mo
ntré
al/C
ont
reco
eur
Vanc
ouve
r
Hal
ifax
Mo
ntré
al/C
ont
reco
eur
Vanc
ouve
r
Import Import Import Import Import Import Import Import Import Import
Africa (ExcludingMiddle East)
Antilles (CaribbeanIslands)
Asia (Excluding MiddleEast)
CentralAmerica
Eastern Europe Middle East North America Oceania(PacificIslands)
South America Western Europe

Use of Containers in Canada – T8080-06-0175 A-31
November 24, 2006
2003 Halifax - Containerized Imports and Exports by Trade Route; Tonnes
0
200,000
400,000
600,000
800,000
1,000,000
1,200,000
1,400,000
1,600,000H
alifa
x
Hal
ifax
Hal
ifax
Hal
ifax
Hal
ifax
Hal
ifax
Hal
ifax
Hal
ifax
Hal
ifax
Hal
ifax
Hal
ifax
Hal
ifax
Hal
ifax
Hal
ifax
Hal
ifax
Hal
ifax
Hal
ifax
Hal
ifax
Hal
ifax
Hal
ifax
Hal
ifax
Hal
ifax
Export Import Export Import Export Import Export Import Export Import Export ImportDomesticExport Import Export Import Export Import Export Export Import
Africa(Excluding
Middle East)
Antilles(Caribbean
Islands)
Asia(Excluding
Middle East)
CentralAmerica
EasternEurope
Middle East North America Oceania(PacificIslands)
South America U.S.Other
WesternEurope
Use of Containers in Canada – T8080-06-0175 A-32
November 24, 2006
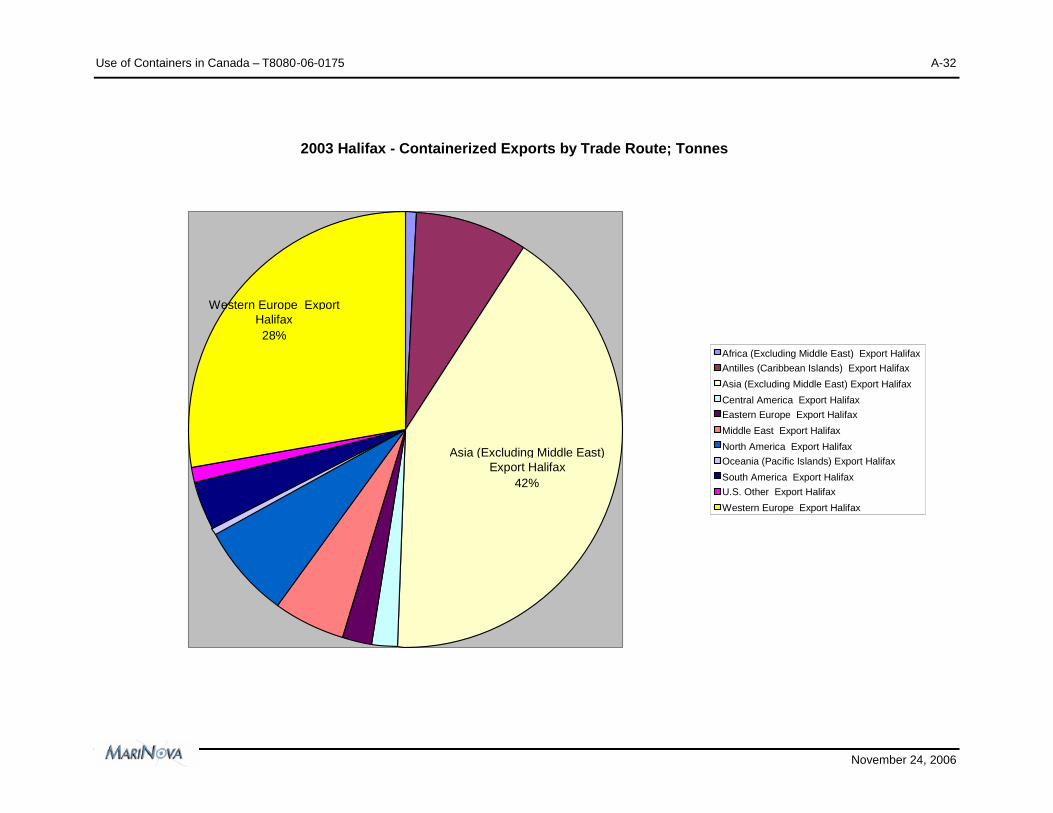
2003 Halifax - Containerized Exports by Trade Route; Tonnes
Asia (Excluding Middle East)Export Halifax
42%
Western Europe ExportHalifax28%
Africa (Excluding Middle East) Export HalifaxAntilles (Caribbean Islands) Export Halifax
Asia (Excluding Middle East) Export Halifax
Central America Export HalifaxEastern Europe Export Halifax
Middle East Export Halifax
North America Export HalifaxOceania (Pacific Islands) Export Halifax
South America Export HalifaxU.S. Other Export Halifax
Western Europe Export Halifax

Use of Containers in Canada – T8080-06-0175 A-33
November 24, 2006
2003 Halifax - Containerized Imports by Trade Route; Tonnes
Western Europe ImportHalifax65%
Africa (Excluding Middle East) Import Halifax
Antilles (Caribbean Islands) Import Halifax
Asia (Excluding Middle East) Import HalifaxCentral America Import Halifax
Eastern Europe Import Halifax
Middle East Import HalifaxNorth America Import Halifax
Oceania (Pacific Islands) Import Halifax
South America Import HalifaxWestern Europe Import Halifax

Use of Containers in Canada – T8080-06-0175 A-34
November 24, 2006
2003 Montreal - Containerized Imports and Exports by Trade Route; Tonnes
0
1,000,000
2,000,000
3,000,000
4,000,000
5,000,000
6,000,000M
ontré
al/C
ontre
coeu
r
Mon
tréal
/Con
treco
eur
Mon
tréal
/Con
treco
eur
Mon
tréal
/Con
treco
eur
Mon
tréal
/Con
treco
eur
Mon
tréal
/Con
treco
eur
Mon
tréal
/Con
treco
eur
Mon
tréal
/Con
treco
eur
Mon
tréal
/Con
treco
eur
Mon
tréal
/Con
treco
eur
Mon
tréal
/Con
treco
eur
Mon
tréal
/Con
treco
eur
Mon
tréal
/Con
treco
eur
Mon
tréal
/Con
treco
eur
Mon
tréal
/Con
treco
eur
Mon
tréal
/Con
treco
eur
Mon
tréal
/Con
treco
eur
Export Import Export Import Export Import Export Export Import Export Import Domestic Export Import Import Export Import
Africa (ExcludingMiddle East)
Antilles (CaribbeanIslands)
Asia (ExcludingMiddle East)
CentralAmerica
Eastern Europe Middle East North America SouthAmerica
Western Europe

Use of Containers in Canada – T8080-06-0175 A-35
November 24, 2006
2003 Montreal - Containerized Exports by Trade Route; Tonnes
Western Europe ExportMontréal/Contrecoeur
98%
Africa (Excluding Middle East) Export Montréal/Contrecoeur
Antilles (Caribbean Islands) Export Montréal/ContrecoeurAsia (Excluding Middle East) Export Montréal/Contrecoeur
Central America Export Montréal/Contrecoeur
Eastern Europe Export Montréal/ContrecoeurMiddle East Export Montréal/Contrecoeur
North America Export Montréal/Contrecoeur
Western Europe Export Montréal/Contrecoeur
Use of Containers in Canada – T8080-06-0175 A-36
November 24, 2006
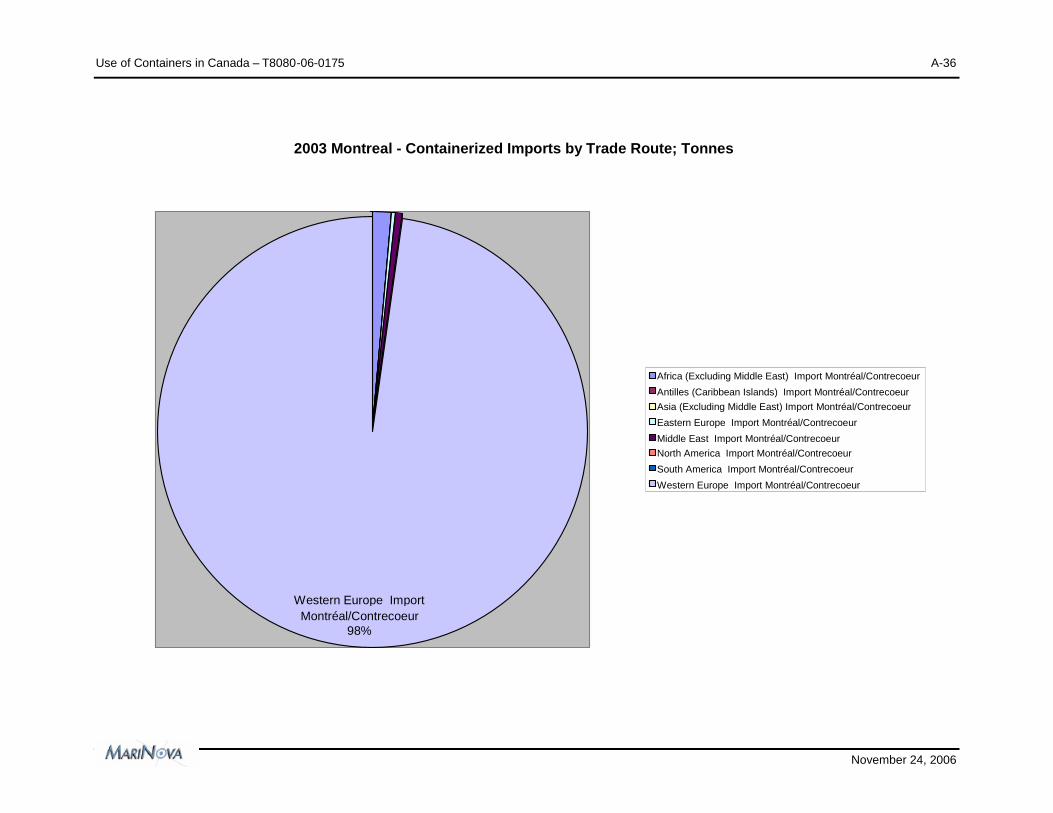
2003 Montreal - Containerized Imports by Trade Route; Tonnes
Western Europe ImportMontréal/Contrecoeur
98%
Africa (Excluding Middle East) Import Montréal/Contrecoeur
Antilles (Caribbean Islands) Import Montréal/ContrecoeurAsia (Excluding Middle East) Import Montréal/Contrecoeur
Eastern Europe Import Montréal/Contrecoeur
Middle East Import Montréal/ContrecoeurNorth America Import Montréal/Contrecoeur
South America Import Montréal/Contrecoeur
Western Europe Import Montréal/Contrecoeur
Use of Containers in Canada – T8080-06-0175 A-37
November 24, 2006
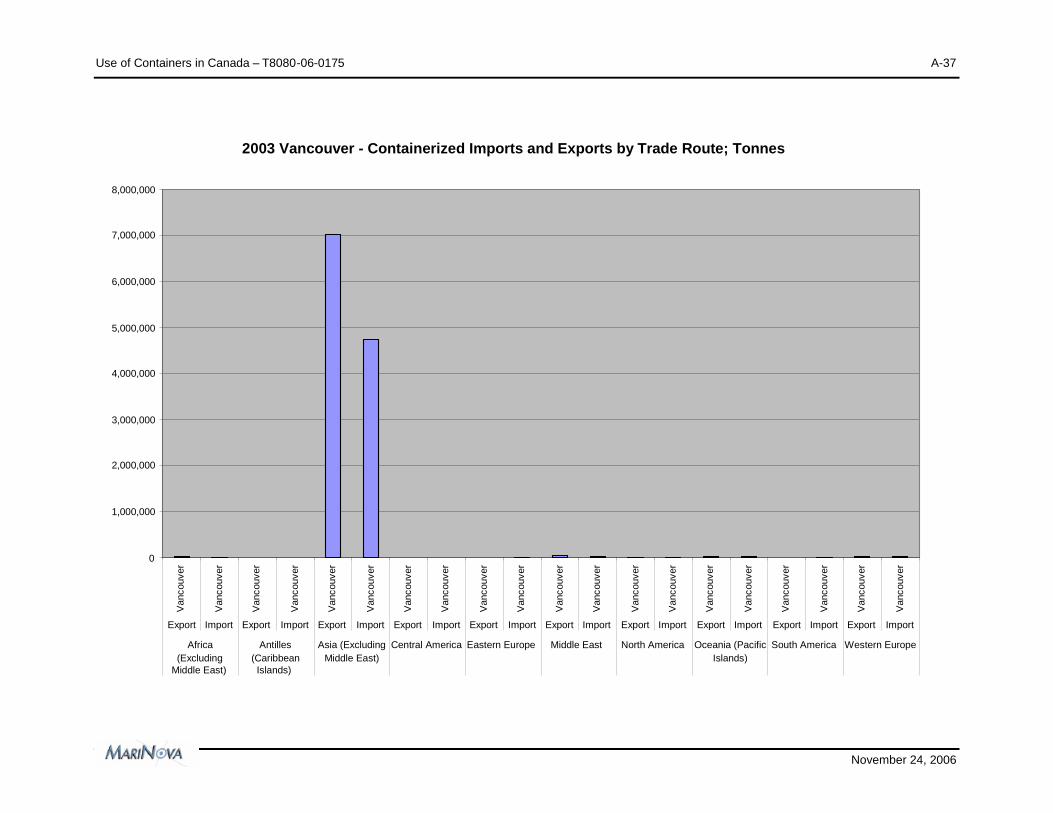
2003 Vancouver - Containerized Imports and Exports by Trade Route; Tonnes
0
1,000,000
2,000,000
3,000,000
4,000,000
5,000,000
6,000,000
7,000,000
8,000,000V
anco
uver
Van
couv
er
Van
couv
er
Van
couv
er
Van
couv
er
Van
couv
er
Van
couv
er
Van
couv
er
Van
couv
er
Van
couv
er
Van
couv
er
Van
couv
er
Van
couv
er
Van
couv
er
Van
couv
er
Van
couv
er
Van
couv
er
Van
couv
er
Van
couv
er
Van
couv
er
Export Import Export Import Export Import Export Import Export Import Export Import Export Import Export Import Export Import Export Import
Africa(Excluding
Middle East)
Antilles(CaribbeanIslands)
Asia (ExcludingMiddle East)
Central America Eastern Europe Middle East North America Oceania (PacificIslands)
South America Western Europe
Use of Containers in Canada – T8080-06-0175 A-38
November 24, 2006
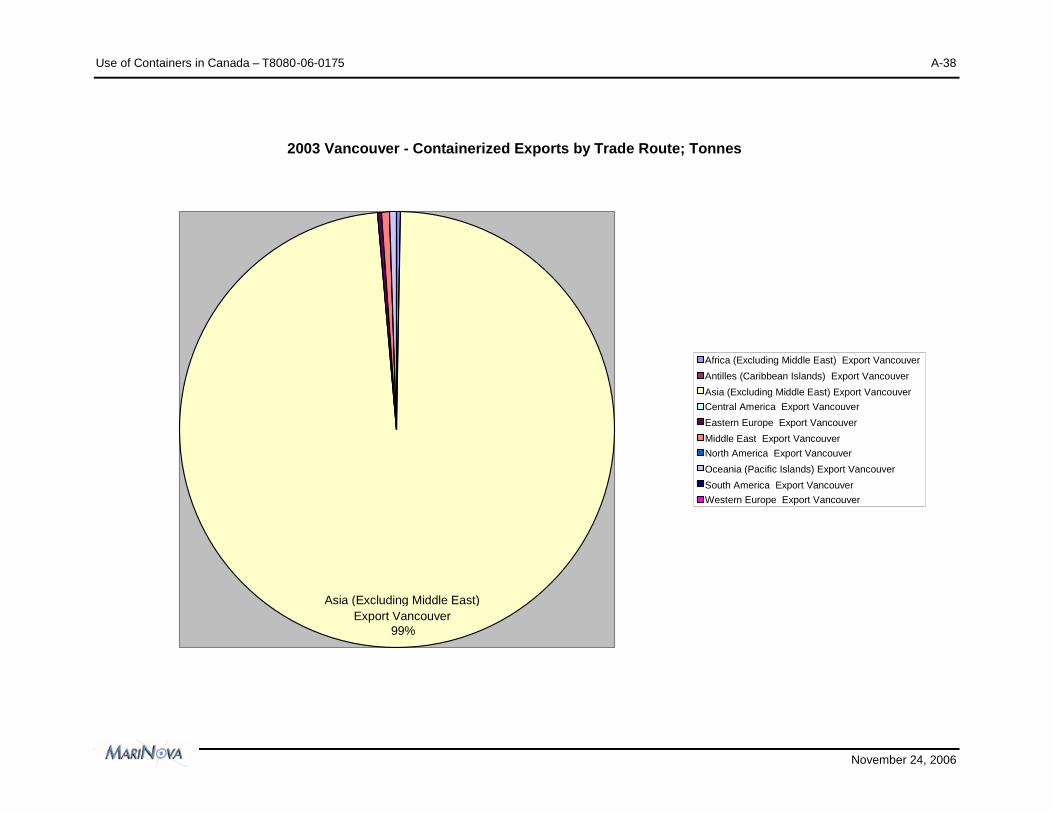
2003 Vancouver - Containerized Exports by Trade Route; Tonnes
Asia (Excluding Middle East)Export Vancouver
99%
Africa (Excluding Middle East) Export Vancouver
Antilles (Caribbean Islands) Export Vancouver
Asia (Excluding Middle East) Export VancouverCentral America Export Vancouver
Eastern Europe Export Vancouver
Middle East Export VancouverNorth America Export Vancouver
Oceania (Pacific Islands) Export Vancouver
South America Export VancouverWestern Europe Export Vancouver

Use of Containers in Canada – T8080-06-0175 A-39
November 24, 2006
2003 Vancouver - Containerized Imports by Trade Route; Tonnes
Asia (Excluding Middle East)Import Vancouver
99%
Africa (Excluding Middle East) Import Vancouver
Antilles (Caribbean Islands) Import Vancouver
Asia (Excluding Middle East) Import VancouverCentral America Import Vancouver
Eastern Europe Import Vancouver
Middle East Import VancouverNorth America Import Vancouver
Oceania (Pacific Islands) Import Vancouver
South America Import VancouverWestern Europe Import Vancouver

Use of Containers in Canada – T8080-06-0175 A-40
November 24, 2006
HALIFAX - Charts Based on: 2000-2003 PORT TRAFFIC.XLS
Halifax Total Tonnes, 2000 to 2003
Handling portname Region 2000 2001 2002 2003
Halifax Region Not Specified 167 357 3,030 4,494
Africa (Excluding Middle East) 455,529 512,127 684,336 348,293
Antilles (Caribbean Islands) 228,781 462,027 276,588 547,498
Asia (Excluding Middle East) 1,083,939 985,504 1,100,267 1,307,406
Central America 45,287 104,646 86,969 88,531
Eastern Europe 46,286 61,211 53,324 148,732
Middle East 361,149 326,411 225,451 309,021
North America 4,796,810 4,464,669 4,338,068 6,048,363
Oceania (Pacific Islands) 19,748 4,796 2,683 10,320
South America 866,780 1,291,914 942,081 319,897
U.S. Other 28,848 31,170 37,816 21,842
Western Europe 4,063,966 3,926,198 3,654,296 3,542,930
Halifax Total 11,997,291 12,171,031 11,404,909 12,697,327
Halifax Containerised Tonnes, 2000 to 2003
Handling portname Region 2000 2001 2002 2003
Halifax Region Not Specified 167 357 3,030 4,494
Africa (Excluding Middle East) 74,541 65,948 22,584 20,563
Antilles (Caribbean Islands) 173,851 224,583 216,713 254,068
Asia (Excluding Middle East) 989,918 944,686 1,059,408 1,262,463
Central America 45,261 62,891 86,969 88,527
Eastern Europe 35,684 36,792 29,318 49,523
Middle East 331,110 313,009 216,844 304,893
North America 316,003 360,479 391,266 325,126
Oceania (Pacific Islands) 17,043 4,796 2,683 9,406
South America 61,652 77,657 63,843 103,773
U.S. Other 9,048 10,829 18,916 21,842
Western Europe 2,218,830 2,146,358 2,042,275 1,972,100
Halifax Total 4,273,107 4,248,383 4,153,849 4,416,776

Use of Containers in Canada – T8080-06-0175 A-41
November 24, 2006
MONTREAL - Charts Based on: 2000-2003 PORT TRAFFIC.XLS
Montréal/Contrecoeur Total Tonnes, 2000 to 2003
Handling portname Region 2000 2001 2002 2003
Montréal/Contrecoeur Region Not Specified 41 42 231
Africa (Excluding Middle East) 1,053,256 753,471 669,123 652,751
Antilles (Caribbean Islands) 376,099 1,089,099 952,590 540,137
Asia (Excluding Middle East) 232,288 132,732 113,945 147,597
Central America 73,647 24,575 101,440 117,563
Eastern Europe 340,710 179,188 88,638 264,397
Middle East 376,468 483,806 179,118 172,309
North America 5,522,675 4,346,168 3,764,908 4,904,383
Oceania (Pacific Islands) 136,882 362,801 201,085 215,738
South America 771,495 754,987 1,004,544 940,772
U.S. Other 55,664 38,852 6,545
Western Europe 9,797,952 9,749,046 10,170,952 11,001,771
Montréal /ContrecoeurTotal
18,737,137 17,914,765 17,246,385 18,964,193
Montréal/Contrecoeur Containerised Tonnes, 2000 to 2003
Handling portname Region 2000 2001 2002 2003
Montréal/Contrecoeur Region Not Specified 41 42 231
Africa (Excluding Middle East) 117,011 113,423 136,473 96,788
Antilles (Caribbean Islands) 37,418 41,394 23,665 8,274
Asia (Excluding Middle East) 23,152 51,090 52,903 23,355
Central America 19 98 78 10
Eastern Europe 10,682 12,917 20,600 12,423
Middle East 184,287 171,852 150,132 60,150
North America 1,453 2,647 2,224 3,839
Oceania (Pacific Islands) 17
South America 717 12 261 2,663
Western Europe 8,501,036 8,006,412 8,714,140 9,171,099
Montréal /Contrecoeur
Total8,875,793 8,399,884 9,100,518 9,378,830

Use of Containers in Canada – T8080-06-0175 A-42
November 24, 2006
VANCOUVER - Charts Based on: 2000-2003 PORT TRAFFIC.XLS
Vancouver Total Tonnes, 2000 to 2003
Handling portname Region 2000 2001 2002 2003
Vancouver Region Not Specified 100 229 243 220
Africa (Excluding Middle East) 1,487,528 885,210 632,198 873,602
Antilles (Caribbean Islands) 315,529 270,934 285,171 213,447
Asia (Excluding Middle East) 45,591,822 44,450,087 39,400,159 41,230,091
Central America 738,953 667,226 559,256 392,382
Eastern Europe 357,945 111,713 7,366 110,914
Middle East 4,101,314 2,829,865 1,884,106 2,359,695
North America 6,641,948 6,404,069 7,375,774 7,403,268
Oceania (Pacific Islands) 1,466,240 1,449,283 1,508,030 1,262,911
South America 5,867,788 5,780,714 3,991,408 5,625,741
U.S. Other 30,860 26,308 23,184 1,935
Western Europe 7,214,794 7,904,011 6,183,948 6,870,715
Vancouver Total 73,814,820 70,779,649 61,850,843 66,344,923
Vancouver Containerised Tonnes, 2000 to 2003
Handling portname Region 2000 2001 2002 2003
Vancouver Region Not Specified 100 229 243 220
Africa (Excluding Middle East) 11,273 11,601 13,436 15,950
Antilles (Caribbean Islands) 1,954 434 1,166 242
Asia (Excluding Middle East) 9,443,116 9,524,686 10,915,538 11,744,172
Central America 19,886 15,103 2,157 158
Eastern Europe 2,643 3,676 3,707 8,806
Middle East 48,816 64,543 52,380 58,311
North America 26,703 23,311 7,728 6,358
Oceania (Pacific Islands) 36,425 49,305 49,544 42,560
South America 297,104 271,255 127,245 3,376
Western Europe 103,265 121,367 86,976 33,903
Vancouver Total 9,991,285 10,085,510 11,260,119 11,914,057

Use of Containers in Canada – T8080-06-0175 A-43
November 24, 2006
Port of Vancouver, 2005 Tonnes of Imports and Exports, by Province of 'All Directions', AllCommodities
Alberta7.63%
British Columbia51.25%
Canada Other0.01%
Manitoba1.51%
Maritimes0.05%
Ontario23.81%
Quebec14.87%
Sask0.87%
Alberta British Columbia Canada Other Manitoba Maritimes Ontario Quebec Sask
Use of Containers in Canada – T8080-06-0175 A-44
November 24, 2006
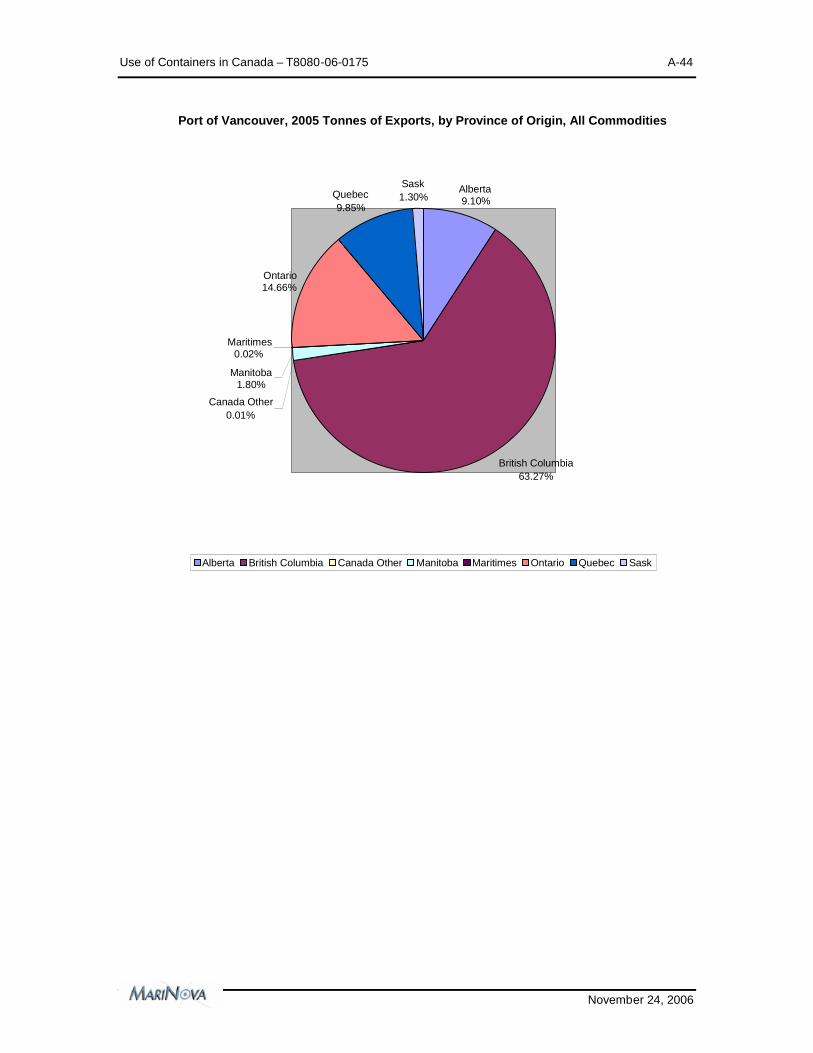
Port of Vancouver, 2005 Tonnes of Exports, by Province of Origin, All Commodities
Alberta9.10%
British Columbia63.27%
Canada Other0.01%
Manitoba1.80%
Maritimes0.02%
Ontario14.66%
Quebec9.85%
Sask1.30%
Alberta British Columbia Canada Other Manitoba Maritimes Ontario Quebec Sask

Use of Containers in Canada – T8080-06-0175 A-45
November 24, 2006
Port of Vancouver, 2005 Tonnes of Imports, by Province of Destination, All Commodities
Alberta5.49%
British Columbia33.80%
Canada Other0.01%
Manitoba1.10%
Maritimes0.10%
Ontario37.10%
Quebec22.16%
Sask0.25%
Alberta British Columbia Canada Other Manitoba Maritimes Ontario Quebec Sask

Use of Containers in Canada – T8080-06-0175 A-46
November 24, 2006
Port of Vancouver, 2005 Tonnes of Exports, Top 10 Commodities
Fresh/Frozen Pork6% Hay / Alfalfa
6%
Lumber21%
Malt4%
Misc Grains / Animal Feeds5%
Peas / Beans / Lentils9%
Scrap Metal4%
Soya Beans7%
Waste Paper9%
Woodpulp29%
Fresh/Frozen Pork Hay / Alfalfa Lumber MaltMisc Grains / Animal Feeds Peas / Beans / Lentils Scrap Metal Soya BeansWaste Paper Woodpulp

Use of Containers in Canada – T8080-06-0175 A-47
November 24, 2006
Port of Vancouver, 2005 Tonnes of Exports, Top 3 Commodities by Province of Origin
0 200000 400000 600000 800000 1000000 1200000 1400000 1600000 1800000
Hay / Alfalfa
Leather / Hides
Resins / Plastic Films
Lumber
Peas / Beans / Lentils
Woodpulp
Leather / Hides
Misc Fresh/Froz Meat & Seafood
Textiles / Clothing
Fresh/Frozen Pork
Frozen French Fries
Iron / Steel
Frozen French Fries
Misc Fresh/Froz Fruit & Veg
Misc Fresh/Froz Meat & Seafood
Soya Beans
Waste Paper
Woodpulp
Fresh/Frozen Pork
Soya Beans
Waste Paper
Hay / Alfalfa
Mustard Seed
Peas / Beans / Lentils
Alb
erta
Brit
ish
Col
umb
iaC
anad
aO
the
rM
anito
baM
arit
imes
Ont
ario
Que
bec
Sa
sk

Use of Containers in Canada – T8080-06-0175 A-48
November 24, 2006
Containers Loaded, Top Five Commodities by Tonnes, Top Five Ports, 2003
0 500,000 1,000,000 1,500,000 2,000,000 2,500,000
Pulp, Newsprint, Paper, and Paperboard
Wood Products
Waste and Scrap
Agricultural Products Except Live Animals, Cereal Grains, an
Animal Feed and Feed Ingredients, Cereal Straw, and Eggs and
Agricultural Products Except Live Animals, Cereal Grains, an
Pulp, Newsprint, Paper, and Paperboard
Miscellaneous Manufactured Products
Logs and Other Wood in the Rough
Basic Chemicals
Pulp, Newsprint, Paper, and Paperboard
Meat, Fish, Seafood, and Preparations
Agricultural Products Except Live Animals, Cereal Grains, an
Machinery
Non-metallic Minerals n.e.c.
Pulp, Newsprint, Paper, and Paperboard
Agricultural Products Except Live Animals, Cereal Grains, an
Wood Products
Waste and ScrapMeat, Fish, Seafood, and Preparations
Prepared Foodstuffs n.e.c. and Fats and Oils
Agricultural Products Except Live Animals, Cereal Grains, an
Meat, Fish, Seafood, and Preparations
Non-metallic Minerals n.e.c.
Pulp, Newsprint, Paper, and Paperboard
Van
cou
ver
Mon
treal
Con
trec
oeu
rH
alifa
xFr
ase
rRiv
er
Sai
ntJo
hn

Use of Containers in Canada – T8080-06-0175 A-49
November 24, 2006
Tonnes of Containers Loaded, Top Five Ports, 2003
Vancouver, 7120093.00, 46%
Montreal Contrecoeur,4335342.00, 29%
Halifax, 2291341.00, 15%
Fraser River, 1139603.00,8%
Saint John, 239093.00, 2%

Use of Containers in Canada – T8080-06-0175 A-50
November 24, 2006
Tonnes of Containers Loaded and Unloaded, Top Five Ports, 2003
7,120,093
4,793,949
4,335,342
5,041,362
2,291,341
2,034,038
1,139,603
1,089,210
239,093
36,396
0 1,000,000 2,000,000 3,000,000 4,000,000 5,000,000 6,000,000 7,000,000 8,000,000
Sum ofContainerized_Loaded
Sum ofContainerized_Unloaded
Sum ofContainerized_Loaded
Sum ofContainerized_Unloaded
Sum ofContainerized_Loaded
Sum ofContainerized_Unloaded
Sum ofContainerized_Loaded
Sum ofContainerized_Unloaded
Sum ofContainerized_Loaded
Sum ofContainerized_Unloaded
Van
cou
ver
Mon
treal
Con
trec
oeu
rH
alifa
xFr
ase
rRiv
er
Sai
ntJo
hn

Use of Containers in Canada – T8080-06-0175 A-51
November 24, 2006
Containers Loaded, Top Five Commodities by Tonnes, Top Five Ports, 2003
0 500,000 1,000,000 1,500,000 2,000,000 2,500,000
Pulp, Newsprint, Paper, and Paperboard
Wood Products
Waste and Scrap
Agricultural Products Except Live Animals, Cereal Grains, an
Animal Feed and Feed Ingredients, Cereal Straw, and Eggs and
Agricultural Products Except Live Animals, Cereal Grains, an
Pulp, Newsprint, Paper, and Paperboard
Miscellaneous Manufactured Products
Logs and Other Wood in the Rough
Basic Chemicals
Pulp, Newsprint, Paper, and Paperboard
Meat, Fish, Seafood, and Preparations
Agricultural Products Except Live Animals, Cereal Grains, an
Machinery
Non-metallic Minerals n.e.c.
Pulp, Newsprint, Paper, and Paperboard
Agricultural Products Except Live Animals, Cereal Grains, an
Wood Products
Waste and ScrapMeat, Fish, Seafood, and Preparations
Prepared Foodstuffs n.e.c. and Fats and Oils
Agricultural Products Except Live Animals, Cereal Grains, an
Meat, Fish, Seafood, and Preparations
Non-metallic Minerals n.e.c.
Pulp, Newsprint, Paper, and Paperboard
Van
cou
ver
Mon
treal
Con
trec
oeu
rH
alifa
xFr
ase
rRiv
er
Sai
ntJo
hn
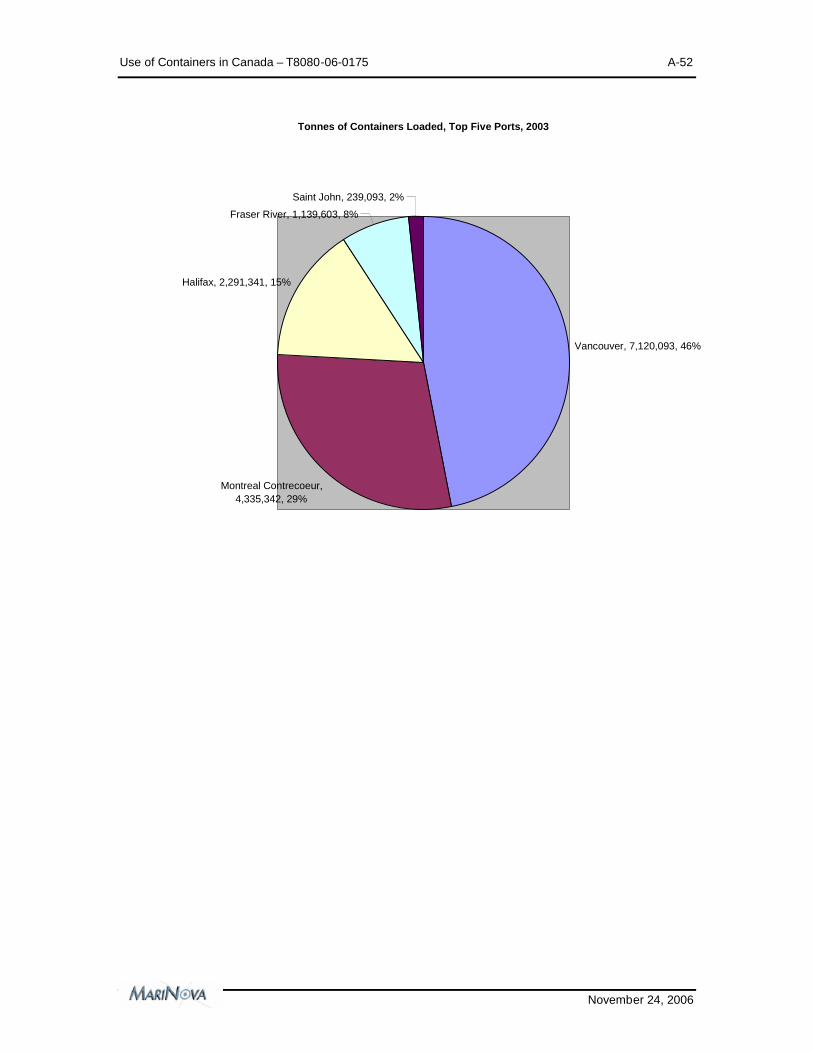
Use of Containers in Canada – T8080-06-0175 A-52
November 24, 2006
Tonnes of Containers Loaded, Top Five Ports, 2003
Vancouver, 7,120,093, 46%
Montreal Contrecoeur,4,335,342, 29%
Halifax, 2,291,341, 15%
Fraser River, 1,139,603, 8%
Saint John, 239,093, 2%

Use of Containers in Canada – T8080-06-0175 A-53
November 24, 2006
Tonnes of Containers Unloaded, Top Five Ports, 2003
Vancouver, 4,793,949, 37%
Saint John, 36,396, 0%
Montreal Contrecoeur,5,041,362, 39%
Halifax, 2,034,038, 16%
Fraser River, 1,089,210, 8%

Use of Containers in Canada – T8080-06-0175 A-54
November 24, 2006
Tonnes of Containers Loaded and Unloaded, Top Five Ports, 2003
7,120,093
4,793,949
4,335,342
5,041,362
2,291,341
2,034,038
1,139,603
1,089,210
239,093
36,396
0 1,000,000 2,000,000 3,000,000 4,000,000 5,000,000 6,000,000 7,000,000 8,000,000
Sum ofContainerized_Loaded
Sum ofContainerized_Unloaded
Sum ofContainerized_Loaded
Sum ofContainerized_Unloaded
Sum ofContainerized_Loaded
Sum ofContainerized_Unloaded
Sum ofContainerized_Loaded
Sum ofContainerized_Unloaded
Sum ofContainerized_Loaded
Sum ofContainerized_Unloaded
Van
cou
ver
Mon
treal
Con
trec
oeu
rH
alifa
xFr
ase
rRiv
er
Sai
ntJo
hn


