Page 1
The use of cues to convergence and accommodation in naive, uninstructed participants
Article
Accepted Version
Horwood, A. M. and Riddell, P. M. (2008) The use of cues to convergence and accommodation in naive, uninstructed participants. Vision Research, 48 (15). pp. 1613-1624. ISSN 0042-6989 doi: https://doi.org/10.1016/j.visres.2008.04.023 Available at http://centaur.reading.ac.uk/26371/
It is advisable to refer to the publisher’s version if you intend to cite from the work. See Guidance on citing .
To link to this article DOI: http://dx.doi.org/10.1016/j.visres.2008.04.023
Publisher: Elsevier
All outputs in CentAUR are protected by Intellectual Property Rights law, including copyright law. Copyright and IPR is retained by the creators or other copyright holders. Terms and conditions for use of this material are defined in the End User Agreement .
Page 2
www.reading.ac.uk/centaur
CentAUR
Central Archive at the University of Reading
Reading’s research outputs online
Page 3
Horwood & Riddell Cues to conv & accom in naïve participants
1
The use of cues to convergence and accommodation in
naïve, uninstructed participants.
Anna M Horwood PhD
Patricia M Riddell DPhil
Address for correspondence:-
School of Psychology & Clinical Language Sciences
University of Reading
Earley Gate
Reading
RG6 6AL
UK
Keywords: Accommodation, vergence, near cues, naturalistic, photorefraction
Page 4
Horwood & Riddell Cues to conv & accom in naïve participants
2
Abstract
A remote haploscopic videorefractor was used to assess vergence and accommodation
responses in a group of 32 emmetropic, orthophoric, symptom free, young adults
naïve to vision experiments in a minimally instructed setting. Picture targets were
presented at four positions between 2m and 33cm. Blur, disparity and looming cues
were presented in combination or separately to asses their relative contributions to the
total near response in a within-subjects design.
Response gain for both vergence and accommodation reduced markedly whenever
disparity was excluded, with much smaller effects when blur and proximity were
excluded. Despite the homogeneity of the participant group there were also some
individual differences.
Page 5
Horwood & Riddell Cues to conv & accom in naïve participants
3
Ocular convergence and accommodation occur in response to cues from the visual
environment as a target approaches. The main cues are blur and binocular disparity,
with a smaller part being played by proximal cues such as looming, motion parallax
and overlay of contours. Under typical conditions, all cues to an approaching target
are available and provide consistent depth information. In this study, we looked at the
relative contributions of these cues to concurrent convergence and accommodation in
a visually normal group of participants. Accommodation and vergence responses to a
naturalistic target with full cues to depth were measured, and compared to responses
when different cues to depth were removed. The purpose of the study was to
determine the range of individual differences in cue use in visually mature individuals
with no visuomotor deficits.
Much of the previous research in this area has studied either vergence or
accommodation in response to single depth cues, including defocus (blur), disparity or
proximal cues. This has provided data for systems models of accommodation,
vergence and their interactions (Eadie & Carlin, 1995, Hung, 1992, Schor, 1992).
Early studies suggested that blur was the primary drive to accommodation and
provided a sufficient cue in isolation (Phillips & Stark, 1977). It was also suggested
that blur was the main drive to vergence via the accommodative vergence cross-
linkage(Alpern, 1962, Maddox, 1893). More recently, however, disparity cues have
been shown to provide the primary drive to vergence (Semmlow & Wetzel, 1979),
and there is also evidence to suggest that these provide the main drive to
accommodation via the convergence accommodation/convergence (CA/C) crosslink
(Crone, 1973, Fincham & Walton, 1957, Judge, 1996, Semmlow & Wetzel, 1979).
While retinal disparity and blur have been accepted as driving the accommodation and
vergence systems, the role of proximity is less clear. Some studies report variable and
Page 6
Horwood & Riddell Cues to conv & accom in naïve participants
4
idiosyncratic use of proximal cues (Ogle & Martens, 1957), whereas, in other studies,
proximal responses have been shown to be linearly related to target distance
(Rosenfield, Ciuffreda & Hung, 1991).
In order to assess typical vergence and accommodation responses, it is necessary to
assess the role of multiple cues to depth in driving both accommodation and vergence
simultaneously. Some researchers have attempted such studies (McLin, Schor &
Kruger, 1988a, Okada, Ukai, Wolffsohn, et al., 2006, Rosenfield, et al., 1991, Weiss,
Seidemann & Schaeffel, 2004), however, this is relatively rare in the literature. In
contrast, most previous studies have tended to measure responses to individual cues in
isolation (Arnott & O'Callaghan, 1971, Breinin, 1971, Filipovic, 1998, Havertape,
Cruz & Miyazaki, 1999, Hung, 1991, Hung, 1997, Hung, Ciuffreda & Rosenfield,
1994, Jiang, 1994, Rosenfield, Ciuffreda & Chen, 1995, Schor, 1983, Schor, 1986,
Schor, 1992, Wick, 1985, Wick, & Currie, 1991). While such studies fail to reflect
real life situations where it is very rare that only one of the near cues is present or
varies in isolation, they will have clinical relevance since there are many conditions
where, for instance, one cue to appropriate near focus is unavailable, impoverished or
conflicting. For example, blur cues can be impoverished due to refractive error or
media opacity, but disparity and proximity cues are still available; disparity detection
can be disrupted by strabismus but blur and proximal cues are often still intact; and in
heterophoria, disparity cues can be in conflict with blur cues. The effect of such cue
conflict was demonstrated by Okada et al (2006) who found that convergence driven
accommodation responses dominated when cue conflict was high, but not in low
conflict conditions. While the results of these studies can be related to some clinical
conditions, they are likely to have less relevance to uncontrolled, naturalistic
responses in typical individuals.
Page 7
Horwood & Riddell Cues to conv & accom in naïve participants
5
A second problem with many experimental reports is that no attempt is made to
control for participants‟ higher level perception of the apparent nearness of the target.
“Awareness of nearness”, and voluntary factors driven by perceived nearness are
known to induce convergence and accommodation (Charman & Tucker, 1977, Mein
& Trimble, 1991, Morgan, 1968, Schober, Dehler & Kassel, 1970, Thompson, 1952)
and this can be trained as part of conventional orthoptic treatment (Ansons, Trimble,
& Davis, 2001, Griffin & Grisham, 2002, Pratt-Johnson & Tillson, 1994). Despite
this, experimental participants are frequently staff and students from optometry
departments who are likely to be more aware of their accommodation and vergence
response than the general population, and many studies require extensive participant
training. It is therefore possible that “expert” participants could be invoking undefined
higher level conscious control, even when efforts are made to reduce this (Ciuffreda,
1991, Ciuffreda, & Hokoda, 1985, Francis, Jiang, Owens, et al., 2003, Karania &
Evans, 2006).
Thirdly, while both early, and some more recent, studies of convergence and
accommodation emphasise the variability in the range of normal responses (Fincham
& Walton, 1957, Harb, Thorn & Troilo, 2006, Judge, 1996, Ogle & Martens, 1957,
Schaeffel, Wilhelm & Zrenner, 1993, Whitefoot & Charman, 1992), it is common in
adult studies to tighten experimental control in order to produce more repeatable
results. Developmental studies, in contrast, frequently report greater variability in
responses (Currie & Manny, 1997, Hainline, Riddell, Grose Fifer, et al., 1992,
Tondel, Wang & Candy, 2002, Tondel & Candy, 2007, Turner, Horwood, Houston, et
al., 2002), implying that there is a progression from the reported wide variability in
developing infants and children to more reliable adult responses. This might not result
Page 8
Horwood & Riddell Cues to conv & accom in naïve participants
6
from purely developmental changes, but could also reflect differences in
methodology, particularly in instruction set and experimental control. In addition, it is
accepted by clinicians that there is a substantial degree of variability in characteristics,
symptoms and responses to treatment in all age groups.
In order to bridge the gap between highly controlled, adult, lab-based studies, and
developmental and clinical studies there is a clear need for a methodology that can be
used to assess the relative contributions of the cues to simultaneous vergence and
accommodation across a range of participant groups. We have devised such a flexible
and non-invasive method to study the response to depth targets when all cues are
available, when each is minimised, and when predominantly one single cue is
provided in isolation. Here, we report the results from a group of minimally
instructed, visually mature, participants. This data provides baseline measures of the
relative influences of the main cues to convergence and accommodation and the range
of individual differences within this population. From our previous studies (Horwood,
Riddell, 2002, Horwood, Turner, Houston, et al., 2001, Turner et al., 2002), we
predicted that most participants would show the greatest reduction in convergence and
accommodation when the retinal disparity cue was removed, but that there would be a
some degree of individual differences in the pattern of response to each cue even in
this visually normal population.
Methods
The study was designed according to the tenets of the Declaration of Helsinki, in
accordance with institutional ethics regulations and the participants gave fully
informed consent.
Page 9
Horwood & Riddell Cues to conv & accom in naïve participants
7
Participants
We made strenuous efforts to recruit naïve, orthophoric and emmetropic participants.
We tested 94 asymptomatic individuals using a battery of tests. Participants who
might not have been naïve to manipulation of vergence and accommodation due to
previous therapy were excluded. All testing was completed in a single session, with
conventional clinical tests being performed between two repeated experimental
sessions. All participants had equal visual acuity of at least 0.0 logMAR in each eye
tested using a logMAR acuity chart and none were able to overcome more than +0.5D
lenses at 6m. All participants had attended an optometrist within the last four years
but had not been prescribed spectacles or any other treatment. Heterophoria was
measured using alternate prism cover test at 6m and 33cm with subjective
confirmation that the phi phenomenon was minimised with the correcting prism. No
participant had an exophoria greater than 4 for near (mean 0.6 ± 1.4 ), any
measurable heterophoria at distance, or any esophoria. Prism cover tests were
repeated with +3.0D lenses at 33cm and -3.00D lenses at 6m with the participants
clearing a 0.1 logMAR letter so that a clinical gradient stimulus AC/A ratio could be
assessed. Particular care was taken to allow time for the participants to clear the target
before alternate occlusion. AC/A ratios were all less than 3 :1D (mean
1.50±1.13 /1D). All had at least 60 seconds of arc stereoacuity using the TNO
stereotest (mean 50.7±14.1 sec of arc) and all had a near point of accommodation of
less than 7cm from the bridge of the nose both binocularly and monocularly (mean
6.15±0.44cm). Fusion was assessed with prisms. At 33cm all participants had a base
out blur point of at least 20 (mean 37.2±11.5 ) and break point of at least 35
(mean 43.6±10.7 ), and a base in break point of at least 8 (mean 12.4±3.5 ). At 6m
they all had a distance base out prism fusion range of at least 20 (22.3±2.4 ) to
break and 18 (20.4±2.7 ) to blur, and a base in range of at least 6 to break (mean
Page 10
Horwood & Riddell Cues to conv & accom in naïve participants
8
7.9±1.5 : blur was rarely noticed before break). All could converge binocularly to at
least 6cm (mean 5.6±0.6cm). The relatively large standard deviations reflect
considerably better responses than our minimum inclusion criteria.
Of the 94 individuals tested, 62 participants were excluded because they had mild
refractive errors, asymptomatic heterophorias, mild accommodation or convergence
insufficiency, or had received some form of vision therapy in the past. Of the
remaining 32 participants who passed the screening, 23 participants were psychology
undergraduates aged between 18 and 24 years of age with no history of ocular
symptoms, spectacles, or participation in any previous visual experiment. 9
participants were typically developing children aged 8 yrs 8 months to 9 years 10
months who had had no ocular treatment. We wanted to explore two distinct age
groups in the young, “visually mature” age range to ascertain whether developmental
changes occur between late childhood and adulthood.
The participants were told that the purpose of the experiment was to measure how
their eyes responded to pictures at different distances, but were given no further
details until the end of the testing session. When asked, no participants were able to
accurately describe what had been tested and most erroneously guessed that we had
been studying pupil reactions.
Apparatus
We used an adaptation of the Remote Haploscopic Photorefractor designed by Israel
Abramov and Louise Hainline, Infant Study Centre, Brooklyn College of the City
University of New York. Our modifications were suggested by experience from our
previously published studies (Horwood, et al., 2001, Horwood & Riddell, 2004,
Page 11
Horwood & Riddell Cues to conv & accom in naïve participants
9
Turner et al., 2002) and the availability of new commercially produced equipment
(Erdurmus, Yagci, Karadag, et al., 2007, Hunt, Wolffsohn & Gilmartin, 2003,
Schimitzek & Lagreze, 2005, Wolffsohn, Hunt & Gilmartin, 2002). The remote
haploscopic photorefractor (Figure 1) consists of two optical pathways, one for off-
axis infra-red continuous photorefraction and the other for target presentation so that
binocular photorefraction can take place independent of target manipulation.
---------------------Figure 1 --------------------------
Target Pathway
The equipment is fully enclosed in black painted shuttering except for the aperture
through which the target is visible. The room lighting was dimmed so that light levels
are low. Dim lighting is necessary to allow the pupils to dilate sufficiently for
accurate photorefraction at the closest target distance, but does not result in significant
dark adaptation (see later for target details and luminance).
The target was presented on a monitor mounted on a motorised beam that moves
between the different fixation distances. The monitor moves in a pseudo random
sequence between five different fixation distances (0.33m, 2m, 0.25m, 1m and 0.5m),
representing 3, 0.5 , 4, 1, and 2 dioptres (D), or metre angles (MA), demand, so that a
near target is always followed and preceded by a far target. Thus, linear responses
across target distance demonstrate that participants have detected and responded to
both near and distance cues accurately.
From the monitor, the optical pathway passes through two concave lens mirrors,
placed such that the virtual image of the monitor is in front of the participant‟s face
Page 12
Horwood & Riddell Cues to conv & accom in naïve participants
10
and a virtual image of the participant‟s eyes is in front of the upper mirror (F: Figure
1). The participant sees a single bright image of the target on the screen approaching
in the primary position. The participants were not shown the true position of the
computer monitor. When asked to touch the 0.33m targets, a separate group of adult
participants reached for the image at the correct distance in mid-air (± 1.5 cm) and
were frequently surprised when it could not be touched.
The main advantage of such a system is that remote occlusion of one eye is possible.
If the image of one eye is occluded at the level of the upper lens mirror (F in Figure
1), it obscures the participant‟s view of the target in the same way as if an occluder
was placed directly before that eye, but both eyes are still able to be photorefracted
simultaneously. After testing, we asked the participants to say if they had noticed
anything unusual to determine whether they had been aware of the occlusion.
Approximately 30% of the participants were unaware that they had been occluded for
part of the experiment. The others had been aware they were only using one eye, but
had not been able to work out where or how the occlusion had occurred.
Photorefraction Pathway
We used a commercially available infra-red photorefractor (PlusoptiX S04, Plusoptix
GmbH, Nurenberg, Germany). This was designed for child vision screening and
incorporates a PowerRefII (R-mode) that makes simultaneous recordings of
accommodative state and gaze direction. The PlusoptiX S04 is placed at a testing
distance of 1m ± 5cm and uses an infrared source and sensors, and is mounted so that
it captures the image of the participant‟s eyes via a large 600mm diameter “hot”
mirror (Knight Optical UK Ltd: as recommended by the manufacturers of the
PlusoptiX SO4: E in Figure 1). This reflects infra-red wavelengths (750-1150nm:
Page 13
Horwood & Riddell Cues to conv & accom in naïve participants
11
reflectance 95%) but allows through visible light at 45 (425-765nm: transmittance
92%). As we were interested in binocular responses, the camera was mounted in the
midline between the eyes, but no significant differences have been found between
refraction in the midline and along the fixation axis in the range of target demands we
used here (Seidemann & Schaeffel, 2003). The centre of the camera was optically
aligned with the centre of the target on the monitor. The fixation LEDs on the sensor
gun were covered with opaque tape. When no target is presented, the infra red sources
could be seen subjectively as very faint red dots, but when any fixation target was on
the monitor, these were obscured by the brighter target elements and were invisible to
the participant.
Target
We were interested in studying the relative use of the three main cues to vergence and
accommodation (blur, proximity and disparity). Two targets were designed: one to
stimulate accommodation maximally, and the other minimally. Luminance of both
targets was 10cd/m2. Although both targets were presented on a black background, the
background luminance of the screen was dimly visible against the screen edge. Screen
edges were therefore masked with an increasing density filter mask to blur the edge
contrast gradient and minimise the screen edges as a stimulus to accommodation.
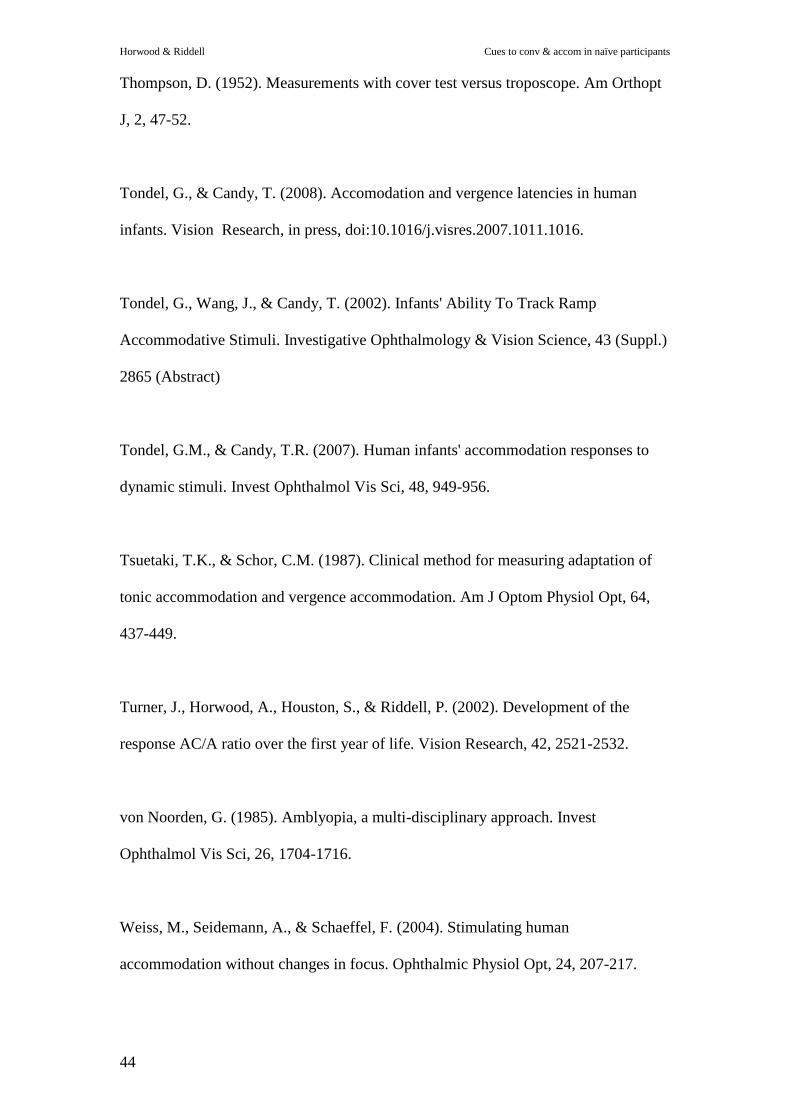
The first target was a brightly coloured picture of a clown containing a range of
spatial frequencies, colours and high contrast edges. As the apparatus was designed
for use with infants with developing visual acuity and attentional capability, the clown
target was designed to contain both high and low spatial frequencies (Figure 2). The
central white „face‟ portion of the clown subtended 3.15 at 2m and 18.26 at 33cm.
The rings of the nose were 3mm wide and so subtended approximately 5 min of arc at
Page 14
Horwood & Riddell Cues to conv & accom in naïve participants
12
2m and 30 min of arc at 33cm, and were edged in a black outline of 1 pixel width
(subtending 1 minute of arc at 2m). Thus, high spatial frequencies of near acuity
threshold were included in the concentric rings of the nose and lower spatial
frequencies in the gross details for the eyes, mouth and hat. This target was chosen in
preference to more traditional accommodative targets, for instance a Maltese cross,
since it is suitable for use at different distances for participants with both low and high
acuity, and will maintain attention in our infant groups. Two versions of the central
components of the picture (nose, eyes, mouth) alternated at 1Hz (2a & 2b) to provide
an attentional cue for future experiments which will use infant participants.
-----------------------Figure 2 -------------------------
We tested the possibility that our clown target was a less demanding accommodative
target than an adult near work task such as reading small print. In the pilot phase we
compared adult accommodation responses to the clown with those obtained while 39
participants read aloud a 3 patch of 8 point text at 33cm. The participants were not
instructed to keep the text clear, but had to use a habitual amount of accommodation
to perform the task. A paired t-test showed no significant difference in
accommodative response between the text and clown, although accommodative
responses were slightly better to the clown target than to the text. (Mean
accommodation to clown = 2.76D, mean accommodation to text = 2.57, t(38)=1.322
p=0.194). We therefore feel confident that our near target stimulated similar
accommodative responses to those found during short, uninstructed, everyday but
demanding, adult close work tasks.
Page 15
Horwood & Riddell Cues to conv & accom in naïve participants
13
Disparity cues were present when the target was visible to both eyes, and removed by
occluding the target before the left eye at the level of the upper mirror.
A second target was used to minimise accommodative cues. We used an image of a
difference of Gaussian (DoG) patch against a black background subtending the same
visual angle as the clown (Figure 2c). DoG patches have been used by others to
investigate open loop accommodation (Kotulak & Schor, 1987, Rosenfield, et al.,
1991, Tondel & Candy, 2008, Tsuetaki & Schor, 1987)}. In our study, the DoG patch
provided a low spatial frequency, defocused image, while retaining some attentional
element which a more diffused image might lack. In order to stimulate the same
attentional demand as the alternating clown target as closely as possible, we alternated
the colour of the patch between yellow and green (chosen because of their position as
near to the centre of the visible spectrum as possible to minimise the duochrome
effect).
Proximity cues were made available by using the same size of target at all fixation
distances, so that it changed angular subtense as it moved to a new target distance
(looming cue). To minimise these proximal cues, the picture was scaled so that it
subtended the equivalent angular subtense at all fixation distances as the unscaled
clown at 2m (i.e. 3.15 with targets elements of 1 minute of arc). To minimise any
residual looming cues from the monitor edges, an opaque black cloth screen (J in
Figure 1) was raised to obscure the participant‟s view of the monitor during screen
movement in the proximity-excluded conditions.
Since we also intend to test infants under the same conditions, when attention may be
more limited, we needed to develop a testing sequence that would maximise useful
Page 16
Horwood & Riddell Cues to conv & accom in naïve participants
14
data in less co-operative groups. We therefore divided target presentations into blocks
(all cues; one cue removed; and one cue only). We initially presented the all cue
condition (“bdp” – blur, disparity and proximity) to obtain a baseline response. We
then presented a block of targets with one cue removed in turn (bp(-d); bd(-p); dp(-
b)). Order of testing within this block was counterbalanced across trials.
After a rest period, we presented a second block of presentations where the target
presented one cue in isolation (b, d or p), by removing the two other cues, again
counterbalanced across trial. This block also included a minimal cue (o) condition
(scaled, occluded, DoG) to obtain a measure of a “minimal cue baseline” response
that might be driven by residual cues which we could not control e.g. auditory cues
from the monitor beam motor, residual proximal cues from the masked dim screen
edge, residual blur cues from the DoG target as well as higher voluntary influences.
Finally the all cue (bdp) condition was repeated to check for practice or fatigue effects
within the session. After a 10 minute rest period, this whole sequence was repeated
again with the order of cue(s) removed counterbalanced within blocks.
Data Recording
The examiner started and stopped the PlusoptiX recording, which was continuous for
each sequence of the five fixation distances. The participant‟s fixation and recording
traces were observed during recording. The fixation target was only moved to the next
position once the target had stopped and fixation had steadied for a period of at least
three seconds and had provided a section of reliable continuous recording. If
excessive blinks, off-axis fixations, pupil or lid fluctuations, or light meter
Page 17
Horwood & Riddell Cues to conv & accom in naïve participants
15
adjustments meant that continuous data was lost, the recording period was increased
so that a stable section of at least 25 continuous readings (one second) was recorded.
Calibration and Calculations from Raw Data Spreadsheet
Accommodation
We transposed refraction so that we obtained a measure of accommodation in
response to target demand (i.e. a –2.0D myopic refraction indicated 2D of
accommodation). 1 While individual calibration would have been possible with these
participants, it will not be possible with the infants and young children we plan to test,
and we are particularly keen to compare this adult data with these less co-operative
groups, so we used refraction readings provided by the PlusoptiX but adjusted
refractive estimates according to group norms derived from a separate calibration
group.
Accommodation Calibration
59 separate adult participants with a range of low refractive errors between -0.75 and
+1.0 or corrected mild myopes (up to -3.0DS) wearing current contact lenses (mean
manifest refraction of group = -0.116D) were refracted using the PlusoptiX while
fixing the 2m, 1m, 0.5m and 0.33m clown target. The same participants were then
1 We were unable to fix pupil size in this paradigm and so we accept that we cannot control for
apparent accommodation leads and lags due to spherical aberration which vary with pupil size
Buehren, T., & Collins, M.J. (2006). Accommodation stimulus-response function and retinal image
quality. Vision Res, 46, 1633-1645.. However, over the range of target distances tested here, the mean
leads and lags that might be expected to result from spherical aberration are less than +0.5D which is
close to the measurement tolerance of the paradigm.
Page 18
Horwood & Riddell Cues to conv & accom in naïve participants
16
tested using dynamic retinoscopy (monocular estimate method (Eskridge, 1989)),
carried out by an experienced retinoscopist (AH) while fixing the same clown target
on a similar monitor in similar light levels at the same distances in the same dimly lit
laboratory. The tester was unaware of PlusoptiX refractions.
The PlusoptiX estimate of the refraction with the target at 1m was not significantly
different from the manifest refraction of the participants (mean -0.127D, paired t-test;
t(58)=-0.13, ns) i.e. it made a good estimate of manifest refractive error when tested at
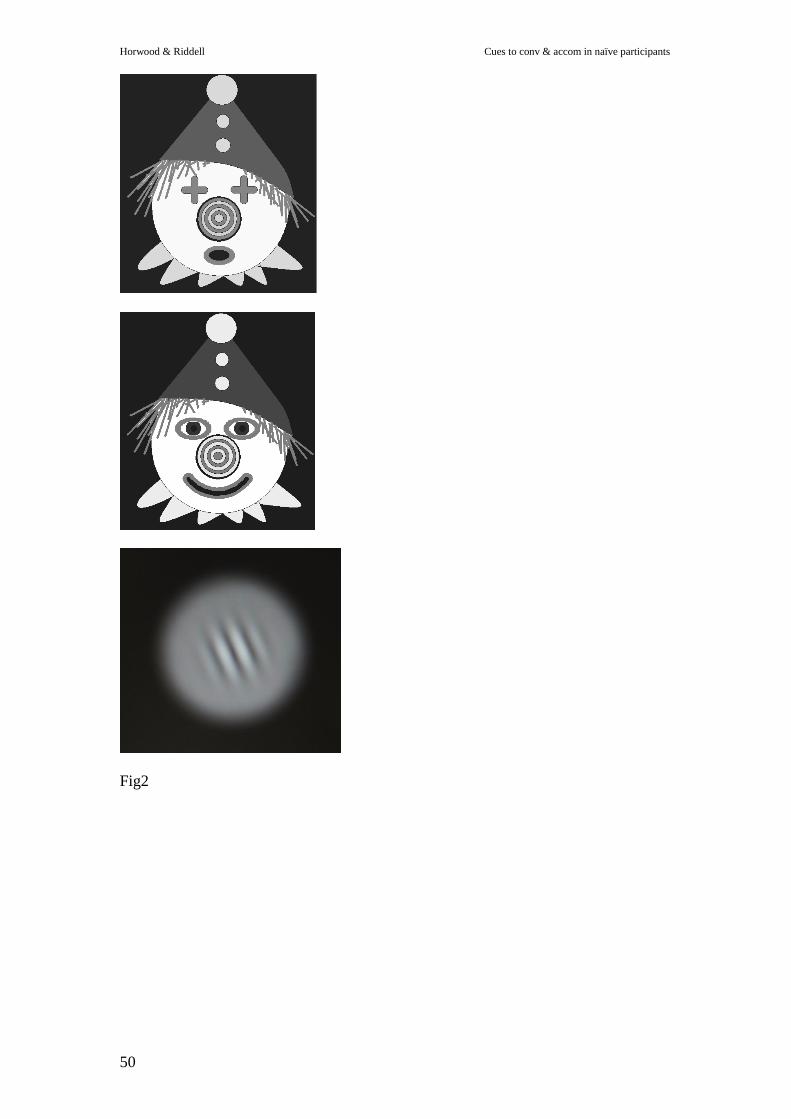
the instrument‟s recommended testing distance of 1m. We consistently measured a
smaller accommodative response to target demand with the RHP in comparison to
dynamic retinoscopy (Figure 3), and this increased away from 0 D, as found by Harb
et al (2006) using an earlier version of the PowerRefractor.
----------------------Figure 3 --------------------------
Correlation between the two readings was good (r2=0.695). We used the slope
function from Figure 3 to adjust our estimate of true refraction by correcting the RHP
measure of accommodation by 1.2385x+0.799: a formula derived from the slope of
the fitted line in Figure 3.
Vergence
Although studies have been published validating the refraction data, little has been
published to validate gaze measurements using the PlusoptiX. We confirmed that the
PlusoptiX calculation of gaze deviation was accurate for our lab by testing a group of
10 adult participants fixating targets at 5 horizontal intervals and confirmed that
mean estimate of gaze position was not significantly different from the
Page 19
Horwood & Riddell Cues to conv & accom in naïve participants
17
manufacturer‟s value (mean PlusoptiX estimate of gaze change per 1 of target shift
normally distributed about mean 1.01 (95%CI 0.97-1.04)).
Vergence Calculations
Angle lambda (the angle between the pupillary axis and the line of sight formed at the
centre of the pupil (Millodot, 1997)) varies between individuals, changes throughout
growth, and must be taken into account whenever assessing gaze position by corneal
reflections. We obtained the best estimate of angle lambda when fixing at infinity by
plotting the mean y-intercept of the nasal displacement from the pupil centre averaged
across both eyes at all four fixation distances in the all cue (bdp) condition.
We transposed the raw PlusoptiX gaze position data so that version was converted to
vergence. As we study participants with widely differing inter-pupillary distances
(IPD) and use our data in comparison with accommodation responses, it is desirable
to report vergence in terms of metre angles (MA) rather than degrees. We therefore
calculated a constant for each participant to transform degrees into metre angles based
on individual IPD (from the y-intercept of the PlusoptiX IPD measurements at all test
distances using the bdp stimulus).
Vignetting
For each testing session, plots of the raw accommodation data against time (Figure 4)
were produced so that we could identify representative vignettes of stable data to
provide an average accommodative response. We aimed for vignettes of 25
continuous frames (1.0 sec of stable fixation) at each fixation distance.
-------------------------Figure 4 -----------------------------
Page 20
Horwood & Riddell Cues to conv & accom in naïve participants
18
We chose these relatively short vignettes as we will be comparing the adult data with
infant and child groups, where prolonged fixation is impossible to guarantee. We were
careful to select vignettes that were representative of the response when the
participant was attending to the target. Where the participant could watch the target
moving (i.e. where proximal cues were present) or where the curtain had obscured the
target, there was a transition phase as the eyes responded to the target. Vignettes were
only chosen after the response had settled and flattened out for at least 0.5 sec (Tondel
& Candy, 2007), but before any tonic changes would be expected to have occurred.
Blinks distort the data and have been removed before analysis by other authors (Day,
Strang, Seidel, et al., 2006, Harb et al., 2006). Examination of our data showed that
the recovery from the blink spike took up to 5 data points (0.2s) in excess of the
portion where data was missing during the blink (Figure 5).
----------------------------Figure 5 -------------------------
We therefore chose to remove the five data points after the onset of the spike (i.e. if
the blink lasted 0.25sec (6 missing data points) plus 5 extra points for recovery = 11
data points (0.44ms) and insert data points that were an average of the two points
either side of the blink. Less than 2% of vignettes included a blink and none included
more than one blink.
After vingetting, graphs were plotted for monocular and binocular vergence and
accommodation (Figure 6). Two scorers independently identified vignettes from 98
separate recording sessions for both vergence and accommodation were correlated
Page 21
Horwood & Riddell Cues to conv & accom in naïve participants
19
using Pearson‟s r and Bland Altman analysis(Bland & Altman, 1986, Bland &
Altman, 1999). Extremely close correlation was found between individual scorers‟
judgement of a representative vignette at the different fixation distances even though
vignettes were rarely chosen from exactly the same section of data. For both
vergence and accommodation, this analysis showed a high agreement: vergence:
r=0.99, mean inter-scorer difference & limits of agreement = 0.037±0.37MA;
accommodation r= 0.99, mean inter-scorer difference 0.0095±0.175D.
-----------------Figure 6 ---------------------
Data Analysis
For both vergence and accommodation analyses, stimulus response graphs for each
individual were fitted using linear regression. In some participants, the
accommodation data was non-linear between the two furthest testing distances as
expected if a proportion of the blur is within depth of focus. Despite this, we chose to
fit a linear function since vergence responses were very clearly linear and we wished
to analyse both systems in the same manner. In order to compare responses across
stimulus conditions, we therefore chose to examine the data in terms of response slope
(gain), the y-intercept (reflecting an estimate of focus at infinity), and the strength of
the linear relationship between the responses at different target demands (r2).
Data was processed using Microsoft Excel and then statistically examined using
repeated measures and between groups analyses. ANOVAs with planned comparisons
quote the Greenhouse-Geisser correction where appropriate.
Results
Page 22
Horwood & Riddell Cues to conv & accom in naïve participants
20
Repeatability
We examined the data for order effects, and repeatability across each target condition.
There were no significant differences between first and second measurement sets
under any target condition (t-test p>0.4 in all cases). The all cue (bdp) condition was
tested four times (at the beginning and end of each of the two testing sessions) and
there were no significant differences between any of these repetitions
(F((3,114)=0.65, p=0.58). Accommodation was generally more variable than
vergence. 95% limits of agreement were +/- 0.17 for vergence slope and +/-0.26 for
accommodation slope. In view of this analysis, results from repeated recordings were
averaged.
Slopes
Figure 7 illustrates mean responses at each demand for the eight different cue
conditions. Both vergence and accommodation were relatively accurate in all
conditions where disparity was present (Fig. 7a, c, e & h), but showed a marked lag
when disparity was removed (Fig.7b, d , f, g). When blur was minimised, there was
only a small reduction in responses (7e), and responses were poor when blur was the
only cue (7f). Manipulating proximity had a weak effect, with only a small reduction
in responses when minimised (7c). The proximity-only responses (7d) were
marginally worse than the no-cue condition (7b). In the majority of cases, vergence
was more accurate than accommodation.
------------- Figure 7 --------------
Page 23
Horwood & Riddell Cues to conv & accom in naïve participants
21
The slope reflects the proportion of a response that occurs in relation to demand
(Table 1). Differences in slope across condition were found. Since the nine children
might form a separate group on the basis of developmental stage, a three-way mixed
design ANOVA considered cue condition, vergence vs. accommodation response, and
child vs. adult responses. The response slopes from the nine children were generally
slightly higher than those from the young adults. Mean difference in slope for the
children was 0.09 steeper for vergence and 0.18 for accommodation (F(1,30)=7.94, p
= 0.008), but no main effect of cue or type of response, and no interactions
approached significance. We therefore collapsed data across age for all subsequent
analyses.
A two-way repeated measures ANOVA for slope comparing slope (accommodation
or vergence) and cue (the eight target conditions) showed no significant main effects
of slope (F(1,31)=0.419, p=0.5), but a highly significant effect of cue
(F(1,31)=109.92,p<0.0000).
------------------- Table 1 ------------------
Slopes for both vergence and accommodation were markedly higher (more
appropriate) whenever disparity cues were available. There was also a significant
interaction between cue condition and accommodative vs. vergence response
(F(1,31)=14.85,p<0.0000). Post hoc testing (bold text in Table 1) showed that
vergence slope was significantly higher (more appropriate) than accommodation in
the all cue (bdp) and blur minimised (dp) conditions and lower in the blur only
condition. Vergence slope was also slightly lower than accommodative slope in the
disparity only, and minimal cue condition.
Page 24
Horwood & Riddell Cues to conv & accom in naïve participants
22
A repeated measures ANOVA was used to determine the effects of the three different
cues (blur, disparity and proximity) on vergence slopes. This showed highly
significant main effects of disparity (F(1,31)= 399.6, p <0.000), blur (F(1,31)=31.2, p
<0.000) and proximity (F(1,31)= 12.57 p=0.001), significant two-way interactions
between disparity and blur (F(1,31)=22.3, p=0.000), and blur and proximity (F(1,31)=
11.6, p=0.002) but no significant three way interaction.
Planned comparisons (Table 2) looked at the effect of cue removal on the vergence
slope. When a single cue was removed from the all cue condition (bdp), the largest
reduction in the vergence slope occurred when disparity was the cue removed (Fig 7a
compared with 7g). However, removing any other single cue also significantly
reduced the vergence slope so that three cues were always better (produced a larger
slope) than two cues (Fig 7a compared with 7c, e and g).
---------------- Table 2 ----------------
When the conditions in which two cues were available are compared to conditions in
which a single cue is available, there was no effect on vergence slope when the single
cue remaining was disparity (Fig 7c and e compared to 7h). In comparison, when the
remaining cue was either proximity or blur, there was a reduction in the vergence
slope from the two cue to single cue conditions (Fig 7c, e and g compared with 7 d
and f). Thus, the most important cue to vergence across all participants was disparity
since loss of the disparity cue resulted in the largest decrease in vergence slope.
Page 25
Horwood & Riddell Cues to conv & accom in naïve participants
23
A similar analysis of the effects of cue removal on the accommodation slope was
carried out (Table 2). There were highly significant main effects of disparity
(F(1,31)= 196.2, p <0.000), blur (F(1,31)= 32.3, p <0.000) and proximity (F(1,31)=
11.3, p=0.002), as well as significant two-way interactions between disparity and blur
(F(1,31)= 29.8, p=0.00001) and blur and proximity (F(1,31)= 9.6, p =0.004).
When a single cue was removed from the all cue condition (bdp), the largest reduction
in slope was seen when disparity was removed (Fig 7a compared with 7g). There was
also a significant reduction in the accommodation slope when blur was minimised
(Fig 7a compared with 7e), however, there was no change in slope when proximity
was removed as a cue to accommodation (Fig 7a compared with 7c).
When the single cue conditions were compared to the conditions in which two cues
were available, there was a large reduction in accommodative slope when disparity
was removed (Fig 7c and e compared with 7f and d). There was a reduction in
accommodative slope when blur was removed leaving proximity as the only cue (Fig
7g compared with 7d). However, there was no reduction in accommodative slope
when blur was removed leaving disparity as the only cue (Fig 7c compared with 7h).
When proximity was removed as a cue, the same pattern emerged; there was a
reduction in accommodative slope when proximity was removed leaving blur as the
only cue (Fig 7c compared with 7f) but not when disparity was the only remaining
cue (Fig 7e compared with 7h). Thus, disparity is the most important cue to
accommodation across all participants.
Y-intercepts
Page 26
Horwood & Riddell Cues to conv & accom in naïve participants
24
The y-intercept represents an estimate of focus and alignment at infinity (zero target
demand) and can also estimate manifest refractive error. A two-way ANOVA with
cue type (eight stimulus conditions) and response (accommodation or vergence) as
factors, showed a significant main effect of cue (F(7,140.4)= 39.35,p<0.000),
response (F(1,31)=15.6,p<0.000), and also a significant interaction
(F(7,137.06)=6.74, p<0.000). Vergence intercept was close to zero in all conditions
where disparity was present, and rose to around 0.25MA when disparity was absent
(Figure 8). When disparity was absent, the responses flattened, and the intercepts of
both vergence and accommodation increased i.e. this suggested some over
convergence and over-accommodation for distance targets. When disparity was
present, vergence intercept remained accurate, and accommodation reduced to
marginally hyperopic values (as might be expected from this non-spectacle wearing
typical population), but when disparity was absent, y-intercepts settled at myopic and
slightly converged values (Figure 8).
-------------- Figure 8 ---------------
A repeated measures ANOVA looking at the effect of cue (blur, disparity and
proximity) on vergence y-intercept showed a highly significant main effect of
disparity (F(1,31)= 88.86, p <0.000), with no significant blur effect (F(1,31)=2.304,
ns) and no effect for proximity (F(1,31)= 0.14, ns). There was a significant two-way
interaction between disparity and blur (F(1,31)=6.27, p=0.018) but no three way
interaction. Removing disparity caused the intercept to increase (Figure 8, bp(-d), b, p
and o conditions). Removing blur caused vergence intercept to rise only if disparity
was absent.
Page 27
Horwood & Riddell Cues to conv & accom in naïve participants
25
Similar analysis of accommodation y-intercept showed somewhat different results.
Main effects of cue were highly significant for all factors (disparity (F(1,31)= 101.88,
p <0.000), blur (F(1,31)= 18.28, p <0.000) and proximity (F(1,31)= 14.45, p=0.001),
as well as significant two-way interactions between disparity and blur (F(1,31)=14.45,
p=0.001) and blur and proximity (F(1,31)= 4.85, p =0.035). Removing disparity
always caused the intercept to rise, but removing blur caused a larger increase in y-
intercept if disparity was absent and an even greater increase if proximity was also
absent.
Stability and variability of response slopes (r2)
r2 values were calculated for each individual‟s response slopes, to provide an estimate
of overall linearity and accuracy of response across the different target demands. r2
values were generally high, which, in our pseudo-random order of presentation
confirms the overall linearity of the response to demand. Values were always above
0.6 but Table 1 illustrates that responses became progressively less accurate as one,
two or three cues were removed, in whichever order this occurred, (significant linear
trends for r2 to reduce each time a cue is removed (F(1,31)>37.00, p<0.000 in all
cases), but the greatest reduction occurred when disparity was removed, wherever it
occurred.
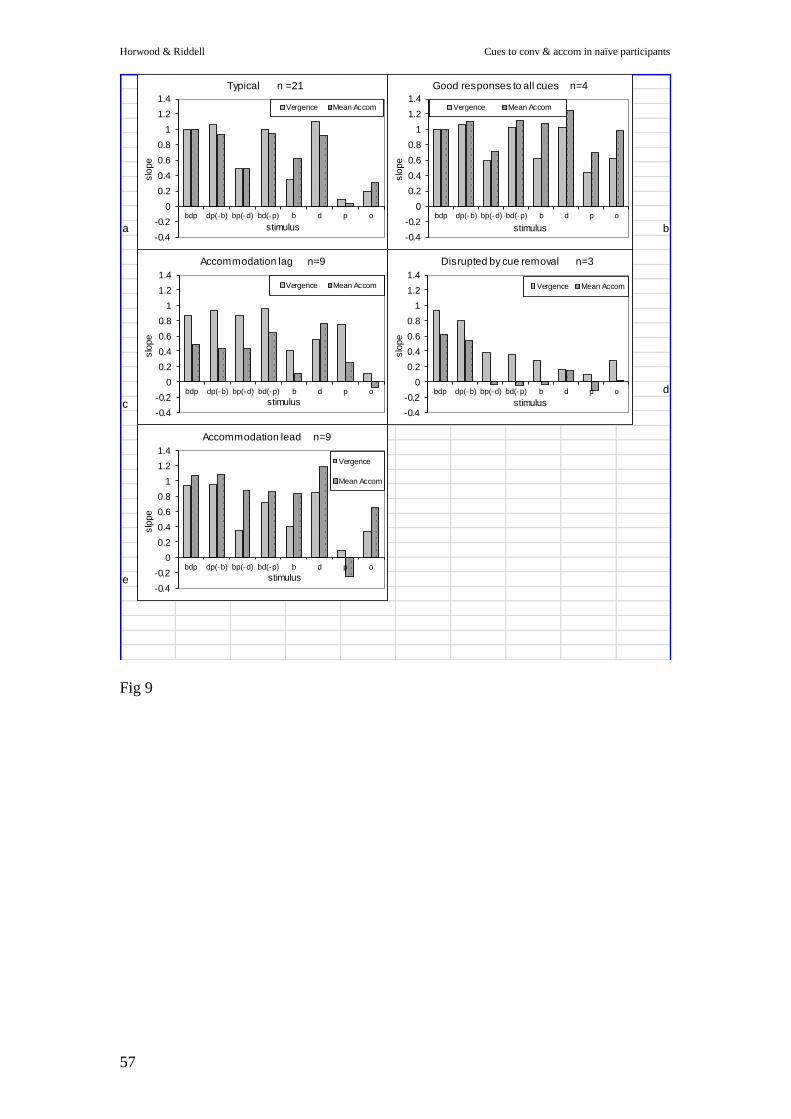
Individual Differences
While we noted that there was a pattern of response that was typical amongst our
participants, there were also some individual differences in response patterns (Figure
9).
------------------ Figure 9 ------------------
Page 28
Horwood & Riddell Cues to conv & accom in naïve participants
26
The most common response was for vergence slope to be accurate whenever disparity
was present (21/32 participants; 65%), with only small changes in vergence or
accommodation responses when either of the other two stimuli was removed or added
(Fig 9a). Accommodation slope was typically similar or slightly lower than vergence,
reflecting a lag of accommodation of approximately 0.5D at 3D demand for all cues
except blur alone, when accommodation generally exceeded vergence. Responses
generally reduced in parallel when a cue was removed, suggesting either a strong
cross-linkage or common drive to both systems.
It was very noticeable, however, that there were some less typical responses.. These
idiosyncratic patterns were repeatable for an individual over the two testing sessions.
When differences in response to cues was considered we found that some participants
were little disrupted by the removal of any cue (4/32: 13%: Fig. 9b), while other
participants showed a large disruption whenever any cue was removed (3/32: 9%:
Fig.9d). When differences in accommodative responses were examined, we found that
some participants showed a lead of accommodation (9/32: 28%: Fig 9e), while others
showed a considerable lag (9/32: 28%: Fig 9c).
Finally, when we compared vergence and accommodation we found that some
individuals (n = 15 e.g. Fig 9d) showed broadly similar disruption across vergence
and accommodation, whatever the cue removed, while others showed differential
degradation depending on the type of stimulus disruption (n = 17: e.g.Fig.9c& e). This
highlights the individual nature of the use of cues to vergence and accommodation in
such a homogeneous, visually normal population.
Page 29
Horwood & Riddell Cues to conv & accom in naïve participants
27
We considered whether conventional indicators of association between vergence and
accommodation such as AC/A or CA/C ratio might characterise these patterns. The
vergence slope in the blur-only condition represents a response AC/A relationship and
the accommodation slope in the disparity-only condition represents CA/C relationship
(Figure 10).
----------------Figure 10 -------------------------------
When the accommodation lag and lead groups were compared with the typical pattern
it can be seen that CA/C in the accommodative lag group is significantly less than that
of the typical group (t=3.33, p=0.002) and the lead group (t=4.01, p=0.001). This
suggests that not only were accommodation responses in these individuals poorer
overall (a criterion for inclusion in the lag group), but accommodation also provided
less drive to vergence. No other differences reached significance.
Discussion
There is a substantial literature on vergence, accommodation and their interactions
(see e.g. Schor & Cuiffreda (1985) for a now classic review volume), but relatively
little research investigates the interfaces between experimental, clinical and
developmental studies, mainly as a result of methodological difficulties. The results
presented here provide a further step in this process by providing an overview of the
relative contributions of the three main cues to accommodation and vergence in a
naïve population carefully screened to exclude any visuomotor deficits.
Response slopes
Page 30
Horwood & Riddell Cues to conv & accom in naïve participants
28
The younger participants produced overall steeper response slopes for both vergence
and accommodation, but this difference was consistent across cue condition and did
not differ significantly between vergence and accommodation. Accommodation
slopes appeared slightly steeper in the children than those of vergence, but in this
relatively small sample, the interaction did not reach significance. It was striking that
the overall pattern of responses to the different cue conditions was indistinguishable
from that of the adults.
Our within-subjects design strengthens our main findings. The mean responses in
each target condition confirmed the primacy of disparity as the main drive to both
vergence and accommodation. Removing disparity as a cue caused a large reduction
in the slopes of both responses. Both vergence and accommodation were accurate in
all conditions where disparity was present. Indeed, disparity was able to drive
accommodation as much as vergence when it was the only cue available. This result
supports the views of Fincham & Walton (1957), Stark(1983), and Judge(1996), who
hypothesised a strong role for disparity cues in driving accommodation and vergence,
and refutes the older views of Maddox (1893) who hypothesised that blur would
drive both systems. While Maddox‟s model is not well supported by our, and others‟,
mean data, it is often cited by clinical texts (Ansons et al., 2001, Griffin & Grisham,
2002, Pratt-Johnson & Tillson, 1994, von Noorden, 1985) and, for example, seems to
be influential in the case of accommodative strabismus. One possible explanation for
this would be that cue use in clinical populations, such as strabismics and amblyopes,
is different to that in typical adults, as suggested by Kenyon et al (1980, 1981). If
these clinical populations do use the cues to vergence and accommodation differently,
it would be of interest to investigate whether differences in cue use and response are
causal or secondary to the onset of abnormalities.
Page 31
Horwood & Riddell Cues to conv & accom in naïve participants
29
Blur had a much smaller, but still significant, effect than disparity on response slopes.
As an isolated cue it significantly increased slope from baseline (Fig 7f compared
with Fig 7b). When added to proximity, blur also resulted in significant increase in
slope (Fig 7d compared to Fig 7g). When both disparity and proximity remained
present, minimising the blur cues had a small detrimental effect on accommodation
but, interestingly, resulted in an even larger mean decrease in vergence (Fig.7a
compared to 7e). We considered whether this small blur effect could be due to a
weakness in our target; either resulting from an inability of the DoG target to
eliminate accommodative cues sufficiently, or from insufficient detail in the clown
target, but we feel that this is not the reason for our findings. The poor slopes to the
DoG target in the two disparity-free conditions (“o” and “p”) reflect mean responses,
and although some individuals are more affected by cue removal than others, in 34%
of cases both vergence and accommodation slope was less than 0.15, suggesting that
the DoG target is truly a weak cue. We are also confident that the clown target
provides a good accommodation stimulus, as shown by the comparable responses to
this target and when reading small text in the pilot studies.
Although the DoG target was of low contrast and spatial frequency to minimise
accommodative stimulus, its spatial frequency and grating contrast gradient does
change at the different fixation distances in the unscaled condition (lower spatial
frequency for near) and may contribute to the residual accommodation response in the
same way that Okada et al (2006) found that when vergence cues were in conflict
with accommodation cues, more accommodation occurred when the target was
blurred. However, the poor responses to the blur only condition (scaled, occluded
clown target) where high frequencies and contrast were available, in comparison to
the minimal cue condition, suggest that these changes in spatial frequency are a weak
Page 32
Horwood & Riddell Cues to conv & accom in naïve participants
30
cue especially in conditions when cues are not in conflict.
Proximity alone appears to have no influence on accommodation and vergence slope
over and above the baseline level of the minimal cue condition, despite the looming
cues of the target being intuitively a powerful stimulus on casual observation. Indeed,
mean accommodation responses in the minimal cue condition (Fig.7b) were
significantly better than in the proximity-only (Fig.7d) condition. However, proximity
does have a small main effect, reducing accommodation and vergence slopes when
removed from the all-cue condition (Fig 7a compared with 7c). Our data agree with
Weiss et al (2004) who also found that looming is a weak cue to vergence and
accommodation, while earlier studies had suggested that looming has a greater ability
to drive these responses (Kruger & Pola, 1985, McLin, Schor & Kruger, 1988b,
North, Henson & Smith, 1993)., It is possible that evidence for proximity as a strong
drive to vergence and accommodation is only found in open loop conditions (Hung,
Ciuffreda & Rosenfield, 1996). Since the vergence and accommodation loops were
closed in many of our conditions, we would not expect to see a large effect of
proximity. It is also possible that in this visually normal group, where disparity is so
dominant, proximity is of little importance.
While the screen edges were masked, the remaining dim outline of the screen edges
might still have provided minimal looming cues even in the scaled conditions and is a
possible source of the residual responses found in this condition. However, in the
scaled condition, not only is the image obscured by the cloth screen during target
movement, but the screen edge will increase in angular subtense while the scaled
target does not. This might be expected to provide conflicting cues to accommodation
and vergence and therefore to result in lower slopes in the minimal cue condition
Page 33
Horwood & Riddell Cues to conv & accom in naïve participants
31
when compared to proximity only, where looming is retained; but this was not found
to be the case in this study. We were unable to quantify what drives the minimal “o”
responses. It is likely to be a combination of residual blur cues given by the DoG
grating, the screen edges that we were unable to fully mask and “top down” voluntary
influences driven by familiarity with the task learned from the initial “bdp” stimulus
condition. Although the low gains in the minimal cue condition show we have not
fully eliminated all near cues, this does not detract from a main finding in this study,
which is that providing blur cues (clown target), and proximity cues (looming) cause
so little improvement in vergence and accommodative responses in comparison to the
relatively flat “o” (minimal cue) condition.
y- intercepts
As long as disparity was present, y-intercepts, representing focus at infinity, were
very close to zero MA for vergence and slightly hyperopic for accommodation. In
order to compare vergence and accommodation we chose to use a linear fit. It is
possible that by fitting a non-linear function to the accommodation data, the absolute
values of these y-intercepts could be increased slightly. However the overall pattern
of responses between cue conditions would be unchanged. As with response slopes,
disparity had a greater effect than blur on moving the intercepts in a negative direction
i.e. at infinity vergence estimate was closer to zero (perfect alignment) and refraction
slightly hyperopic, as might be expected in such a typical group. Accommodation was
more sensitive to changes in blur or proximity than was vergence. When disparity was
absent, y-intercepts rose to slightly positive levels, representing focus closer than
infinity and closer to the levels of dark or open-field focus (Baker, Brown & Garner,
1983, Leibowitz & Owens, 1975, Owens, 1979), as might be expected in a reduced
stimulus situation. These positive levels could also include elements of instrumental
Page 34
Horwood & Riddell Cues to conv & accom in naïve participants
32
proximal responses (Rosenfield & Ciuffreda, 1991) that are overridden by stronger
disparity cues when present. These orthophoric participants showed a vergence y-
intercept of approximately 0.3MA (2 esodeviation) in the minimal cue and
proximity-only conditions.
Individual Variability
We made strenuous efforts to ensure that our participants would be considered
visually normal even by stringent clinical measures. While it was possible to identify
a “typical” response pattern (Fig 9a) there were also a small number of participants
who showed different individual responses. Specifically, four participants showed
little degradation of response whatever cue was removed and so contributed to the
residual slopes in the “o” and “p” conditions. These participants were not as
dependent on disparity as our typical participants since they were able to use blur and
proximity, and possibly voluntary, cues to drive accommodation and vergence even
when disparity was not present. Three other participants‟ responses were very
disrupted whichever cue was removed. These participants behave similarly to infants
who have also been shown to decrease their accommodative and vergence responses
when individual cues are removed (Currie & Manny, 1997, Turner et al., 2002). There
were no appreciable age differences between these small groups of participants.
Approximately half the participants‟ accommodation and vergence responses changed
concurrently in relation to different stimulus conditions, while the others showed
differential responses, with vergence being more affected by one cue and
accommodation by another. It was not possible to identify any clinical correlates to
differentiate these two groups or to identify a particular cue with a pattern of change
in vergence but not accommodation, or vice versa.
Page 35
Horwood & Riddell Cues to conv & accom in naïve participants
33
Previous studies from our laboratory (Horwood et al., 2001, Horwood & Riddell,
2004, Turner et al., 2002), as well as the individual variability that classic strabismus
and paediatric ophthalmology texts emphasise, suggest that there may be many
“styles” of interpretation of near cues, and also that flexibility in the use of near cues
enables comfortable near vision under a range of commonly occurring circumstances
(such as monocular viewing or uncorrected refractive error). Published models
suggest how this might occur (Schor 1992, Hung et al 1996) but little attention is paid
to whether this is task- or “individual style”- related and it is obscured in studies
which consider mean data only. Our data suggest that, when different cue conditions
are tested within participant, the majority of visually normal, individuals show the
same pattern of response.
We were unable to find many clinical correlates with the laboratory data apart from
the lower CA/C ratio in the accommodative lag group, which may provide some
support for the model suggested by Schor(1999) but which we feel is not
incompatible with our contention that some individuals are less responsive to blur.
This has been suggested in the case of myopes (Radhakrishnan, Allen & Charman,
2007), but has not been suggested to contribute to typical individual variability in
normal responses. This is not necessarily surprising in this symptom free, normal
group with no atypical participants, but it is possible that by studying clinical groups
such as strabismus and refractive error we may find more marked and significant
differences that characterise clinical diagnosis. There also may be a typical
developmental progression in infants. Blur is known to be more important for
individuals with poor disparity detection due to suppression (Kenyon, Ciuffreda &
Page 36
Horwood & Riddell Cues to conv & accom in naïve participants
34
Stark, 1980); proximity may play a larger, or disproportionate, role in some clinical
conditions such as intermittent exotropia as suggested by Kushner (1988, 1999).
This study provides a baseline with which atypical groups and developmental
progression can be compared. The strength of this naturalistic study is that
comparison of the relative contributions of the different near cues across cues can be
made because the target presentation method, instruction set (minimal) and
measurement method can be held constant. Conventional clinical tests and
experimental methods allow the effects of individual cues to be investigated, but do
not usually look at them all under the same conditions. Here we have identified the
full range of typical visually mature naïve responses and limits of normality before
researching typical infant development and clinical groups. We hypothesise that being
able to use all or any of the near cues reduces risk of clinical problems, while over- or
under-reliance on one cue may lead to greater clinical difficulties. This type of
research has the potential for use in predicting risk of later abnormalities or refining
screening programmes.
Acknowledgement
We would like to thank Professor Philip Smith for statistical advice. This research
was supported by a Department of Health Research Capacity Development
Fellowship award PDA 01/05/031 to AMH.
Page 37
Horwood & Riddell Cues to conv & accom in naïve participants
35
References
Alpern, M. (1962). Accommodation:evaluation of the theories of presbyopia. In: H.
Davson (Ed.) The Eye, 3 (pp. 191-229). London: Academic Press.
Ansons, A., Trimble, R., Davis, H., & Mein, J. (2001). Diagnosis and management of
ocular motility disorders. Oxford: Blackwell Science.
Arnott, E., & O'Callaghan, K. (1971). Further investigations of the AC/A ratio. Brit
Orthoptic J, 28, 11-22.
Baker, R., Brown, B., & Garner, L. (1983). Time course and variability of dark focus.
Invest Ophthalmol Vis Sci, 24, 1528-1531.
Bland, J.M., & Altman, D.G. (1986). Statistical methods for assessing agreement
between two methods of clinical measurement. Lancet, 8476, 307-310.
Bland, J.M., & Altman, D.G. (1999). Measuring agreement in method comparison
studies. Stat Methods Med Res, 8, 135-160.
Breinin, G. (1971). Accommodative strabismus and the AC/A ratio. Am J
Ophthalmol, 71, 303.
Page 38
Horwood & Riddell Cues to conv & accom in naïve participants
36
Buehren, T., & Collins, M.J. (2006). Accommodation stimulus-response function and
retinal image quality. Vision Res, 46, 1633-1645.
Charman, W., & Tucker, J. (1977). Dependence of accommodation response on the
spatial frequency spectrum of the observed object. Vision Research, 17, 129-139.
Ciuffreda, K. (1991). The Glenn A. Fry Invited Lecture. Accommodation to gratings
and more naturalistic stimuli. Optometry & Vis.Sci., 68, 243-260.
Ciuffreda, K.J., & Hokoda, S.C. (1985). Effect of instruction and higher level control
on the accommodative response spatial frequency profile. Ophthalmic Physiol Opt, 5,
221-223.
Crone, R. (1973). The control of eye movements. In: Diplopia (p. 89). New York:
American Elsevier.
Currie, D., & Manny, R. (1997). The development of accommodation. Vision Res, 37,
1525-1533.
Day, M., Strang, N.C., Seidel, D., Gray, L.S., & Mallen, E.A. (2006). Refractive
group differences in accommodation microfluctuations with changing accommodation
stimulus. Ophthalmic Physiol Opt, 26, 88-96.
Eadie, A.S., & Carlin, P.J. (1995). Evolution of control system models of ocular
accommodation, vergence and their interaction. Med Biol Eng Comput, 33, 517-524.
Page 39
Horwood & Riddell Cues to conv & accom in naïve participants
37
Erdurmus, M., Yagci, R., Karadag, R., & Durmus, M. (2007). A comparison of
photorefraction and retinoscopy in children. J AAPOS, 11, 606-611.
Eskridge, J.B. (1989). Clinical objective assessment of the accommodative response. J
Am Optom Assoc, 60, 272-275.
Filipovic, T. (1998). The accommodative convergence/accommodation (AC/A) and
near convergence/distance(NC/D) ratios in esotropia. J Pediatric Ophthalmol & Strab,
35, 91-95.
Fincham, E., & Walton, J. (1957). The reciprocal actions of accommodation and
vergence. J Physiol, 137, 488-508.
Francis, E., Jiang, B., Owens, D., & Tyrrell, R. (2003). Accommodation and vergence
require effort-to-see. Optometry & Vision Science, 80, 467-473.
Griffin, J., & Grisham, J. (2002). Binocular Anomalies: Diagnosis and Vision
Therapy. Boston: Butterworth-Heinemann.
Hainline, L., Riddell, P., Grose Fifer, J., & Abramov, I. (1992). Development of
accommodation and convergence in infancy. Behavioural Brain Research, 49, 33-50.
Harb, E., Thorn, F., & Troilo, D. (2006). Characteristics of accommodative behavior
during sustained reading in emmetropes and myopes. Vision Res, 46, 2581-2592.
Page 40
Horwood & Riddell Cues to conv & accom in naïve participants
38
Havertape, S., Cruz, O., & Miyazaki, E. (1999). Comparison of methods for
determining the AC/A ratio in accommodative esotropia. J Pediatric Ophthalmol &
Strab, 36, 178-183.
Horwood, A., & Riddell, P. (2002). The role of near cues in neonatal misalignments.
Invest.Ophth. Vis.Sci., e-abstract 4707.
Horwood, A., Turner, J., Houston, S., & Riddell, P. (2001). Variations in
accommodation and convergence responses in a minimally controlled photorefractive
setting. Optometry & Vis Sci, 78, 791-804.
Horwood, A.M., & Riddell, P.M. (2004). Can misalignments in typical infants be
used as a model for infantile esotropia? Invest Ophthalmol Vis Sci, 45, 714-720.
Hung, G. (1991). Linear model of accommodation and vergence can account for
discrepancies between AC/A measures using the fixation disparity and phoria
methods. Ophthalmic Physiol Opt, 11, 275-278.
Hung, G. (1997). Quantitative analysis of the accommodative convergence to
accommodation ratio: Linear and static models. IEEE Transactions on Biomedical
engineering, 44, 306-316.
Hung, G., Ciuffreda, K., & Rosenfield, M. (1994). Static model of proximal
accommodation and vergence. Invest Ophth Vis Sci, 35, 1280.
Page 41
Horwood & Riddell Cues to conv & accom in naïve participants
39
Hung, G., Ciuffreda, K., & Rosenfield, M. (1996). Proximal contributions to a linear
static model of accommodation and vergence. Ophthalmic Physiol Opt, 16, 31-41.
Hung, G.K. (1992). Adaptation model of accommodation and vergence. Ophthalmic
Physiol Opt, 12, 319-326.
Hunt, O.A., Wolffsohn, J.S., & Gilmartin, B. (2003). Evaluation of the measurement
of refractive error by the PowerRefractor: a remote, continuous and binocular
measurement system of oculomotor function. Br J Ophthalmol, 87, 1504-1508.
Jiang, B.-C. (1994). A method for correction of CA/A ratio based on linear model of
accommodation and vergence. Optom Vision Sci, 71, 192-197.
Judge, S. (1996). How is binocularity maintained during convergence and
divergence? Eye, 10, 172-176.
Karania, R., & Evans, B.J. (2006). The Mallett Fixation Disparity Test: influence of
test instructions and relationship with symptoms. Ophthalmic Physiol Opt, 26, 507-
522.
Kenyon, R., Ciuffreda, K., & Stark, L. (1980). Dynamic vergence eye movements in
strabismus and amblyopia: symmetric vergence. Invest Ophthalmol Vis Sci, 19, 60-
74.
Kenyon, R., Ciuffreda, K., & Stark, L. (1980). Dynamic vergence eye movements in
strabismus and amblyopia: asymmetric vergence. Brit. J. Ophthalmol, 65, 167-176
Page 42
Horwood & Riddell Cues to conv & accom in naïve participants
40
Kotulak, J., & Schor, C. (1987). The effects of optical vergence, contrast, and
luminance on the accommodative response to spatially bandpass filtered targets
[published erratum appears in Vision Res 1988;27(10):361]. Vision Res, 27, 1797-
1806.
Kruger, P.B., & Pola, J. (1985). Changing target size is a stimulus for
accommodation. J Opt Soc Am A, 2, 1832-1835.
Kushner, B. (1988). Exotropic deviations: a functional classification and approach to
treatment. Am Orthoptic J, 38, 81-93.
Kushner, B. (1999). Diagnosis and treatment of exotropia with a high
Accommodation convergence- accommodation ratio. Arch Ophth, 117, 221-224.
Leibowitz, H.W., & Owens, D.A. (1975). Anomalous myopias and the intermediate
dark focus of accommodation. Science, 189, 646-648.
Maddox, E. (1893). Investigations on the relationship between convergence and
accommodation of the eyes. J Anat, 20, 475-505, 565-484.
McLin, L., Schor, C., & Kruger, P. (1988a). Changing size (looming) as a stimulus to
accommodation and vergence. Vision Res, 28, 883-898.
McLin, L.N., Jr., Schor, C.M., & Kruger, P.B. (1988b). Changing size (looming) as a
stimulus to accommodation and vergence. Vision Res, 28, 883-898.
Page 43
Horwood & Riddell Cues to conv & accom in naïve participants
41
Mein, J., & Trimble, R. (1991). Diagnosis and Management of Ocular Motility
Disorders. Oxford: Blackwell Scientific Publications.
Millodot, M. (1997). Dictionary of Optometry & Visual Science (p16). Oxford:
Butterworth-Heinemann.
Morgan, M. (1968). Accommodation and vergence. Am J Optom Arch Am Acad
Optom, 45, 417-454.
North, R., Henson, D., & Smith, T. (1993). Influence of proximal, accommodative
and disparity stimuli upon the vergence system. Ophthalmic Physiol Opt, 13, 239-
243.
Ogle, K., & Martens, T. (1957). On the accommodative convergence and the proximal
convergence. Arch Ophth, 128, 702-715.
Okada, Y., Ukai, K., Wolffsohn, J.S., Gilmartin, B., Iijima, A., & Bando, T. (2006).
Target spatial frequency determines the response to conflicting defocus- and
convergence-driven accommodative stimuli. Vision Res, 46, 475-484.
Owens, D.A. (1979). The Mandelbaum effect: evidence for an accommodative bias
toward intermediate viewing distances. J Opt Soc Am, 69, 646-652.
Phillips, S., & Stark, L. (1977). Blur: a sufficient accommodative stimulus. Doc
Ophthalmol, 43, 65-89.
Page 44
Horwood & Riddell Cues to conv & accom in naïve participants
42
Pratt-Johnson, J., & Tillson, G. (1994). Management of Strabismus and Amblyopia.
New York: Thieme.
Radhakrishnan, H., Allen, P.M., & Charman, W.N. (2007). Dynamics of
Accommodative Facility in Myopes. Invest. Ophthalmol. Vis. Sci., 48, 4375-4382.
Rosenfield, M., Ciuffreda, K., & Chen, H. (1995). Effect of age on the interaction
between the AC/A and CA/C ratios. Ophthalmic Physiol Opt, 15, 451-455.
Rosenfield, M., Ciuffreda, K., & Hung, G. (1991). The linearity of proximally
induced accommodation and vergence. Invest Ophth Vis Sci, 32, 2985-2991.
Rosenfield, M., & Ciuffreda, K.J. (1991). Effect of surround propinquity on the open-
loop accommodative response. Invest Ophthalmol Vis Sci, 32, 142-147.
Schaeffel, F., Wilhelm, H., & Zrenner, E. (1993). Inter-individual variability in the
dynamics of natural accommodation in humans: relation to age and refractive errors. J
Physiol, 461, 301-320.
Schimitzek, T., & Lagreze, W.A. (2005). Accuracy of a new photo-refractometer in
young and adult patients. Graefes Arch Clin Exp Ophthalmol, 243, 637-645.
Schober, H., Dehler, H., & Kassel, R. (1970). Accommodation during observations
with optical instruments. J Opt Soc Am, 60, 103-107.
Page 45
Horwood & Riddell Cues to conv & accom in naïve participants
43
Schor, C. (1983). Analysis of tonic and accommodative vergence disorders of
binocular vision. Am J Optom Physiol Opt, 60, 1-14.
Schor, C. (1986). The Glenn A.Fry Award Lecture: Adaptive regulation of
accommodative vergence and vergence accommodation. Am J Optom &
Physiological Optics, 63, 587-609.
Schor, C. (1992). A dynamic model of cross-coupling between accommodation and
convergence - simulations of step and frequency responses. Optom Vision Sci, 69,
258-269.
Schor, C. (1999). The influence of interactions between accommodation and
convergence on the lag of accommodation. Ophthalmic Physiol Opt, 19, 134-150.
Schor, C.M., & Cuiffreda, K. (1985). Vergence Eye Movmements. Basic & Cinical
Aspects. Woburn,MA: Butterworth.
Seidemann, A., & Schaeffel, F. (2003). An evaluation of the lag of accommodation
using photorefraction. Vision Res, 43, 419-430.
Semmlow, J., & Wetzel, P. (1979). Dynamic contributions of the components of
binocular vergence. J Opt Soc Am, 69, 639-645.
Stark, L. (1983). Normal and abnormal vergence. In: C.Schor, & K.Cuiffreda (Eds.),
Vergence Eye Movements (pp. 3-14). Woburn,MA: Butterworth.
Page 46
Horwood & Riddell Cues to conv & accom in naïve participants
44
Thompson, D. (1952). Measurements with cover test versus troposcope. Am Orthopt
J, 2, 47-52.
Tondel, G., & Candy, T. (2008). Accomodation and vergence latencies in human
infants. Vision Research, in press, doi:10.1016/j.visres.2007.1011.1016.
Tondel, G., Wang, J., & Candy, T. (2002). Infants' Ability To Track Ramp
Accommodative Stimuli. Investigative Ophthalmology & Vision Science, 43 (Suppl.)
2865 (Abstract)
Tondel, G.M., & Candy, T.R. (2007). Human infants' accommodation responses to
dynamic stimuli. Invest Ophthalmol Vis Sci, 48, 949-956.
Tsuetaki, T.K., & Schor, C.M. (1987). Clinical method for measuring adaptation of
tonic accommodation and vergence accommodation. Am J Optom Physiol Opt, 64,
437-449.
Turner, J., Horwood, A., Houston, S., & Riddell, P. (2002). Development of the
response AC/A ratio over the first year of life. Vision Research, 42, 2521-2532.
von Noorden, G. (1985). Amblyopia, a multi-disciplinary approach. Invest
Ophthalmol Vis Sci, 26, 1704-1716.
Weiss, M., Seidemann, A., & Schaeffel, F. (2004). Stimulating human
accommodation without changes in focus. Ophthalmic Physiol Opt, 24, 207-217.
Page 47
Horwood & Riddell Cues to conv & accom in naïve participants
45
Whitefoot, H., & Charman, W.N. (1992). Dynamic retinoscopy and accommodation.
Ophthalmic Physiol Opt, 12, 8-17.
Wick, B. (1985). Clinical factors in proximal vergence. Am J Optom Physiol Opt, 62,
1-18.
Wick, B., & Currie, D. (1991). Dynamic demonstration of proximal vergence and
proximal accommodation. Optom Vision Sci, 68, 163-167.
Wolffsohn, J.S., Hunt, O.A., & Gilmartin, B. (2002). Continuous measurement of
accommodation in human factor applications. Ophthalmic Physiol Opt, 22, 380-384.
Page 48
Horwood & Riddell Cues to conv & accom in naïve participants
46
Legends
Table 1
Response slope (gain) for each target condition. Bold type signifies significant
differences between vergence and accommodation on post hoc testing. Italics signify
accommodation slope steeper than vergence. Abbreviations for target conditions e.g.
bdp = blur, disparity & proximity all present, dp(-b) = disparity and proximity
present, blur removed, b = blur only.
Table 2.
Planned comparisons on response slope comparing effects of removing a cue from the
stimulus.
Figure 1
The Remote Haploscopic Videorefractor. A. Motorised beam. B. Target monitor. C.
Upper concave mirror. D. Lower concave mirror. E. Hot mirror. F. Image of
participant‟s eye where occlusion takes place. G. PlusoptiX SO4 PowerRef II. H.
Headrest J. Raisable black cloth screen.
Figure 2
a) & b) Clown target alternating at 1Hz containing bright colours, high contrast and
range of spatial frequencies. Black outlines to picture elements do not reproduce well
in this reduced illustration c) Difference of Gaussian patch. Colour alternated between
green and yellow with equal luminance at 1Hz.
Figure 3.
Page 49
Horwood & Riddell Cues to conv & accom in naïve participants
47
RHP vs dynamic retinoscopy of 59 participants fixating targets at 33cm, 50cm,1m
and 2m. Error bars indicate 95%CI.
Figure 4.
Example of vignette indentification. Plots of partially processed data (before degrees
converted to metre angles and angle lambda corrected) used for vignette
identification. Responses against time (x-axis) to identify target position and
continuous data sections. y-axis scale in dioptres for accommodation and degrees for
vergence. Vignettes of 25 continuous data points were selected (shaded) to represent
a sample of stable response at each fixation distance
Figure 5.
Sample of actual accommodation data over a blink. Dark shaded area = missing
points during blink which fulfil spike identification criterion. Paler shaded area =
removed points during blink recovery. Points either side of excluded portion averaged
and substituted.
Figure 6.
Example of a typical response plot after correction for accommodation calibration,
angle lambda and IPD. Vergence plotted in metre angles (MA). Uniocular gaze
positions summed to show binocular vergence. Uniocular accommodation averaged.
Figure 7. Response to demand in each stimulus condition. Solid points = vergence,
open points = accommodation, dotted line = ideal response to demand. Error bars
represent 95%CI.
Page 50
Horwood & Riddell Cues to conv & accom in naïve participants
48
Figure 8 .
Vergence and accommodation intercepts. “bdp” = all cues present, “dp(-b)” =
disparity and proximity present, blur removed, “b” = blur only etc.
Figure 9.
Examples of different individual response types. Grey bars represent vergence slope,
striped bars represent accommodation slope. Letters on y-axis represent cue available
(or excluded) e.g. dp(-b) = disparity & proximity present, blur removed. a) typical
response in which the vergence and accommodation responses are both reduced when
the disparity cue is absent, b) good responses for most stimuli, c) accommodation lag
d) disrupted by any cue removal, e) accommodation lead as well as differential
response to specific cue removal . Categories are not mutually exclusive.
Figure 10
AC/A and CA/C relationship between groups (±SE). Accommodative vergence
represented by gain of vergence response in the “blur only” condition. Vergence
accommodation represented by gain of accommodation response in “disparity only”
condition. Accommodative vergence gain not significantly different between groups.
Vergence accommodation significantly lower in the “lag” group (asterisked).
Page 51
Horwood & Riddell Cues to conv & accom in naïve participants
49
.
Fig 1
Page 52
Horwood & Riddell Cues to conv & accom in naïve participants
50
Fig2
Page 53
Horwood & Riddell Cues to conv & accom in naïve participants
51
Fig3
Page 54
Horwood & Riddell Cues to conv & accom in naïve participants
52
Fig 4
Page 55
Horwood & Riddell Cues to conv & accom in naïve participants
53
Fig 5
Page 56
Horwood & Riddell Cues to conv & accom in naïve participants
54
Fig 6
Page 57
Horwood & Riddell Cues to conv & accom in naïve participants
55
a b
c d
e f
g hFigure 7
0
0.5
1
1.5
2
2.5
3
3.5
0 1 2 3 4
Respnse (
MA
or
D)
Demand (MA or D)
Blur + Disparity + Proximity
0
0.5
1
1.5
2
2.5
3
3.5
0 1 2 3 4
Respnse (
MA
or
D)
Demand (MA or D)
Blur + Disparity (- Prox)
0
0.5
1
1.5
2
2.5
3
3.5
0 1 2 3 4
Respnse (
MA
or
D)
Demand (MA or D)
Blur + Proximity (- Disp)
0
0.5
1
1.5
2
2.5
3
3.5
0 1 2 3 4
Respnse (
MA
or
D)
Demand (MA or D)
Disparity +Prox (- Blur)
0
0.5
1
1.5
2
2.5
3
3.5
0 1 2 3 4
Re
sp
nse
(M
A o
r D
)
Demand (MA or D)
Minimal Cue
0
0.5
1
1.5
2
2.5
3
3.5
0 1 2 3 4
Re
sp
nse
(M
A o
r D
)
Demand (MA or D)
Proximity only
0
0.5
1
1.5
2
2.5
3
3.5
0 1 2 3 4
Re
sp
nse
(M
A o
r D
)
Demand (MA or D)
Blur only
0
0.5
1
1.5
2
2.5
3
3.5
0 1 2 3 4
Respnse (
MA
or
D)
Demand (MA or D)
Disparity only
Page 58
Horwood & Riddell Cues to conv & accom in naïve participants
56
Fig 8
Page 59
Horwood & Riddell Cues to conv & accom in naïve participants
57
a b
d
c
e
-0.4
-0.2
0
0.2
0.4
0.6
0.8
1
1.2
1.4
bdp dp(-b) bp(-d) bd(-p) b d p o
slo
pe
stimulus
Typical n =21
Vergence Mean Accom
-0.4
-0.2
0
0.2
0.4
0.6
0.8
1
1.2
1.4
bdp dp(-b) bp(-d) bd(-p) b d p o
slo
pe
stimulus
Good responses to all cues n=4
Vergence Mean Accom
-0.4
-0.2
0
0.2
0.4
0.6
0.8
1
1.2
1.4
bdp dp(-b) bp(-d) bd(-p) b d p o
slo
pe
stimulus
Accommodation lag n=9
Vergence Mean Accom
-0.4
-0.2
0
0.2
0.4
0.6
0.8
1
1.2
1.4
bdp dp(-b) bp(-d) bd(-p) b d p oslo
pe
stimulus
Disrupted by cue removal n=3
Vergence Mean Accom
-0.4
-0.2
0
0.2
0.4
0.6
0.8
1
1.2
1.4
bdp dp(-b) bp(-d) bd(-p) b d p o
slp
pe
stimulus
Accommodation lead n=9
Vergence
Mean Accom
Fig 9
Page 60
Horwood & Riddell Cues to conv & accom in naïve participants
58
Fig 10