JOURNAL OF RESEAR CH of the Notional Bur ea u of Standards - C. Engineering and In strum entation Vol. 74C, No s. 3 and 4, July- December 1970 The Use of Dew-Point Temperature in Humidity Calculations Lawrence A. Wood Institute for Materials Research, National Bureau of Standards, Washington, D.C. 20234 (August 21, 1970) Th e de w- point te mp era tur e ha s a numb er of desirable fe atur es as a mea ns of e xpr ess in g humidit y. Th e Ant oine Equ ation, log ew= A - B(T+ C)- I, wh ere ew is th e partial press ure a nd T is th e te mp era- tur e of sa tur ated a qu eous vapo r, re prese nt s the Go ff- Grateh formul a ti on quite we ll over th e range of te m pera tur e from 0 to 140 o f. Th e press u re ew, in in c hes of mercury, is obta in ed by taking the constan ts A=6. 70282 , B = 3150.515 (OF)-l a nd C = 391.0 o f, ca lc ul ated from va lu es given by Dreisbac h. It is shown that the de w- point DP is related to the rela ti ve humidit y RH by the rel at ion: (DP + C) - l= (T + C) - I+ B- l log ( RH )-l " Lin es of nea rly consta nt positive slope r ep rese nt constant relat ive humidit.y valu es on graphs of dew- point against tempera tur e. Th e value of the slope d ec r eases fro m unity fo r RH = 100 pe rce nt to abo ut 0.76 for RH = 10 per ce nt , co rr es ponding to the lin ea r e qu a ti on DP = [I + 0.147 1 log ( RH )-I]- '( T- 70 ) + DP,o wh e re DP70 = [2169 + 319 log ( RH )- l] -l x 10li -391. Psyc hr ometric c hart s showing dew-point a nd dr y- bulb te mp era tur e as coordinates with lin es re pre- sentin g consta nt relative humidit y and co nstant wet-bulb tem pera tur e (o btained fr om the Fe r re l Eq ua- ti on) are e xtr emely use ful , s ince given valu es for any two of th ese fo ur va ri ables se rv e to loca te a point, from which th e valu es of the oth er t wo var ia bl es ca n be read direct.l y. Key words: Ant oine Eq ua ti on; dew point; humidit y; h yg rometry; psyc hr ometric chart; relat iv e hu- midity; vapo r pr ess ur e of wat er; wet-bulb te mp e ratur e. 1. Introduction In calculati ons of th e humidity of air c ontamm g mois tur e, th e dew-point te mp era tur e h as a numb er of d es irable fe atur es as a means of e xpress in g th e ab- solut e humidity_ In many in s tan ce s in which the te mp e ratur e of th e air is c hanged the dew point re- main s relatively constant. On e illustration of this is th e ri se of te mp e rature when cold outdoor air in winter is he at ed and brought indoor s without humidification . Th e dew point remains relativ ely constant also dur- ing th e normal daily rise and fall of te mp e ratur e of outd oor air. In fact, th e usual morning we ath er report s could provide a numb er which would be mu ch l ess subj ec t to c han ge durin g th e day if th e value of dew point were to be re port ed in pla ce of th e relativ e humidity. Th e prese nt pap er s tr esses th e advant ages of using dew point in e xpr ess in g humidity , deriv es some ap- plic abl e e quations , and pres ent s illus trati ve c hart s and tabl es to fa cilitat e the op e rati on_ The result s given here s hould be u se ful for engi- neering purpos es of meas ur eme nt a nd c ontrol of humidity in th e ran ge above about 5 per ce nt relativ e humidity at press ures ne ar a no rm al a tm os ph er e, wh ere th e r eq uir eme nt s for pr eC1S lOn at tem pe ratu res betwee n 0 and 140 of, do not excee d about 0_ 5 perce nt in relative humidity or a few te nth s of a d egr ee F in te mp erature_ Th ese re quir eme nt s ar e int e rm e diat e betwee n th e approximat e values s ome tim es use d in rough c alculations based on readings with hair hy- g rometers or similar instruments and the mor e prec i se values required in research in hygrom e try_ The temperature range wa s cho se n to in cl ud e th e complete range of un c ontrolled variati on of a tmo s- pheri c temperature. Wh e n a referen ce te mp e ratur e near normal room te mp e ratur e is re quir ed, a value of 70 OF has be en chosen, to be at th e midpoint of the ran ge_ 2. Definitions and Tabulations of Values The present paper makes use of the definitions adopted by the Conference of Directors, International Meteorological Organization, meeting in Washingt on in 1947 , with the revised definition ofrelative humidity adopted by the International Joint Committee on P s y- c hrometric Data, meeting in Philadelphia in 1950_ 117
Transcript
JOURNAL O F RESEARCH of the Noti onal Burea u of Standards - C. Engineering and Instrum enta tion Vol. 74C, Nos. 3 and 4, July- December 1970
The Use of Dew-Point Temperature in Humidity Calculations
Lawrence A. Wood
Institute for Materials Research, National Bureau of Standards, Washington, D.C. 20234
(August 21, 1970)
The de w- point te mperature has a number of desi rable features as a means of expressing humidity. The Antoine Equation, log ew= A - B (T + C) - I , wh ere ew is the partial pressure and T is the temperature of satura ted aqueous vapo r , re presents the Goff-Gra te h formul ation quite well over the range of te mperature from 0 to 140 of. The pressure ew , in inches of me rc ury, is obta ined by taking the cons tan ts A=6. 70282 , B = 3150.515 (OF) - l and C = 391.0 of, calc ulated fro m va lues given by Dre is bach. It is shown that the dew- point DP is rela ted to the rela ti ve humidity RH by the relation :
(DP + C) - l= (T + C) - I+ B- l log (RH )- l
" Lines of nearl y co nstant pos itive s lope represent cons tant re lat ive humidit.y values on graphs of dewpoint aga inst tempe ra ture. The value of the s lope decreases fro m unity fo r RH = 100 perce nt to abo ut 0.76 for RH = 10 percent, corresponding to the linear equa tion
DP = [ I + 0.1471 log (RH )- I]- '( T - 70 ) + DP,o whe re DP70 = [2169 + 319 log (RH )- l] - l x 10li -391.
P sychrome tri c charts s howing de w-point and dry- bulb temperature as coo rdina tes with lines representing constant relative humidity a nd consta nt we t-bulb te mpera ture (obta ined from t he Ferre l Eq uation) a re extremely useful , s ince given values for any two of th ese four va ri ab les se rve to loca te a po int , from which the values of the other t wo variables can be read d irect.ly.
Key words: Antoine Equation; dew point ; humid ity; hyg rometry; psychrometric c hart; re lat ive humidity; vapor pressure of water; we t-bulb temperature.
1. Introduction
In calculations of the humidity of air contammg moisture, the dew-point temperature has a number of desirable features as a means of expressing the absolute humidity_ In many instances in which the temperature of the air is changed the dew point remains relatively constant. One illustration of this is the ri se of temperature when cold outdoor air in winter is heated and brought indoors without humidification. The dew point remains relatively constant also during the normal daily rise and fall of temperature of outdoor air. In fact , the usual morning weath er reports could provide a number which would be much less subject to change during the day if the value of dew point were to be reported in place of the relative humidity.
The present paper stresses the advantages of using dew point in expressing humidity , derives some applicable equations , and presents illustrati ve charts and tables to facilitate the operation_
The results given here should be useful for engineering purposes of measurement and control of humidity in the range above about 5 percent relative
humidity a t pressures near a normal a tmosphere, where the require ments for preC1SlOn a t te mperatu res be tween 0 and 140 of , do not exceed about 0_5 percent in relative humidity or a fe w tenths of a degree F in temperature_ These r equirements are intermediate between the approximate values sometimes used in rough calculations based on readings with hair hygrometers or similar instruments and the more precise values required in research in hygrometry_
The temperature range was c hosen to include the complete range of uncontrolled variation of a tmospheric temperature. Whe n a reference temperature near normal room tempe rature is required , a value of 70 OF has been chosen , to be at the midpoint of the range_
2. Definitions and Tabulations of Values
The present paper makes use of the definitions adopted by the Conference of Directors, International Meteorological Organization, meeting in Washington in 1947, with the revised definition ofrelative humidity adopted by the International Joint Committee on P sychrometric Data, meeting in Philadelphia in 1950_
117
L
These are presented in detail in the Smithsonian Meteorological Tables, Sixth Edition 1951 [1].' The same definitions are accepted by the American Society of Heating, Refrigeration, and Air Conditioning Engineers (ASHRAE) and published in the ASHRAE Guide and Data Book [2].
An extensive study of the the rmodynamic properties of moist air completed in 1945 and 1946 by Goff and Gratch [3, 4, 5] led to formulation of tables of consistent numerical values. These values have been accepted and promulgated by both the Directors of the International Meteorological Organization and the ASHRAE. They have been published in several handbooks [1 , 2 , 6].
The numerical values of vapor pressure used in the prese nt work are those shown in Table 95 of the Smithsonia n Meteorological Tables [1], which gives values of aqueous saturation vapor pressure at intervals of 0.1 OF at the standard atmospheric pressure of 29.921 inches of mercury (760.00 mm of mercury, 101 ,325 N m - I).
Relative humidity RH is defined as the ratio of the mol-fraction of water vapor in a given volume of moist air to the mol-fraction of water vapor in the same volume of saturated moist air at the same temperature and pressure. For the ideal gas mixtures assumed here , this definition is equivalent to defining relative humidity as the ratio of the partial pressure e of water vapor in moist air to the partial saturation pressure of water vapor ew at the temperature of the air [2]. The partial pressure of saturated water vapor is affected only slightly by the presence or absence of air [1]. At atmospheric pressure near room temperature the difference is of the order of 0.5 percent, and will be neglected in the present work.
Dew-point temperature is defined as the temperature at which the partial vapor pres~ure of water in moist
! Figu res in bracke t s indica te the litera ture re ferences a t the end of this paper.
air would be sufficient to saturate the air. In other words , the partial vapor pressure at the given temperature is equal to the partial saturation vapor pressure at the dew-point temperature.
3. Dew-Point and Relative Humidity
Let us consider first only three variables, limiting ourselves to standard atmospheric pressure and postponing for the present all discussion of wet-bulb temperatures. The variables are (dry-bulb) temperature, relative humidity, and dew point. In a search of the literature I could find no tables showing explicitly the dew point as a function of temperature and relative humidity, although small graphs with temperature in Celsius degrees have been given in the German literature [7]. Consequently table 1 has been drawn up in order to show the dew poi~t for different temperatures at 10° intervals from 0 to 140 OF and for relative humidities at 10 percent intervals from 10 to 100 percent. Values of the saturation vapor pressure of water are shown in the second column of the table. They are taken from the Goff-Gratch formulation , as presented in the Smithsonian Meteorological Tables [1]. The units of pressure are inches of mercury, each equivalent to 3386.389 N/m2 •
Table 1 was prepared by calculating the vapor pressure as the product of the saturation vapor pressure ew and the relative humidity RH. The dew point was then read to the nearest 0.1 ° from the Tables as the temperature at which this value of vapor pressure is equal to the saturation vapor pressure.
4. Antoine Equation for Vapor Pressure
Of the many empirical forms of equations for the pressure of the saturated vapor of a liquid [8] the one proposed by Antoine for water [9, 10] and later extended to other liquids [11] possesses a number of ad-
TABLE 1. Saturated aqueous vapor pressure and dew point (oF)
T ew 10% 20% 30% 40% 50% 60% 70% 80% 90% 100%
OF in Hg 0 0.04477 -44.2 -31.6 - 24.1 -18.6 - 14.2 - ]0 .6 -7.5 -4.7 -2.2 0.0
vantages [12]. Consequently it has been extensively used in recent years. It may be written
log e", = A - B ( T + C) - I (1)
where e", is the partial pressure an d T the te mperature of the saturated vapor , while A, B , and C are em piri cal constants.
When ew is expressed in millimeters of merc ur y a nd T in degrees Celsius , the constants for water betwee n o and 60 °C have been evaluated by Dreisbach [13a, 13b] as
A = 8.10765, B = 1750.286 , (deg C)- I and C = 235.0 deg C.
When ew is expres~ed in inches of mercury and Tin degrees Fahrenheit the constants for water between 32 and 140 °C may be calculated from those just given. This calc ulation gives :
A = 6.70282, B = 3 150. 515, (deg F)- I and C = 391.0 deg F.
With these con s tants the Antoine Equation yields values of vapor pressure which , for our purposes, are in completely adequate agreement with those given in the Goff-Gratch tabulation [1 , 2, 6]. The differences are less than about 0.00040 in of mercury for temperatures in the range 40 to 120 of and less than about 0.00100 in of mercury in the ranges 0 to 40 of and 120 to 140 of.
If differences of this magnitude are not to be tolerated recourse must be had to equations of much greater complexity containing many more constants [1]. Computer programs have been developed to deal with this situation [14].
5. Dew Point and Relative Humidity
Since the dew point temperature DP and the relative humidity RH are de fin ed in te rms of vapor press ures, an equation involving them may be easily derived from eq (1). The vapor press ure at te mperature Tis (RH)e w
and is equal to the sa turation vapor press ure at the dew point te mpeJ'ature DP. Thus by applying eq (1) at the dew point temperature we obtain
log (RH)ew = A-B(DP+C) - I. (2)
Subtracting eq (2) from eCI (1) we have:
log (RH) - I=B[(DP+C) - I-(T+C) - I]
(DP+C) - I = (T+C) - I + B - 1 log (RH) - I. (3)
This form of equation suggests a plot of (DP + C) - I against (T+C) - I. When C is again take n as 391.0 OF. the li-nes obtained for constant relative humidity are straight and have unit slope, as predi c ted. From the intercepts a value of B - 1 may be obtained.
In the present work , however , a nongraphical method has been employed to obtain B - 1 with greater sensitivity. This involved calculating the difference of (DP+C)- I and (T+C)- I from th e values of dew point as a function of temperature as give n in table 1. The constant C was taken as 391.0 OF, a before. The average value of this difference for all temperatures from o to 140 OF for a given relative humidity was divided by log (RH)- I to obtain B- 1.
No significant trends could be noted in thi s differe nce as a fun ction of temperature or in the values of B- 1 as a function of relative humidity. The mean value of B- 1 obtained in this way was 318.6 X 10- 6 (deg F)-I. The reciprocal of the value of B in the Antoine Equation as given above by Dreisbach [13], is 317.4 X 10- 6
(deg F)- I. The agreement between these two independent values is highly satisfactory. In the remainder of this paper we shall take the value of B - 1 as 319 X 10-tl (OF)- I. Both the graph of eq (3) and the constancy of the individual values of B - 1 confirm the validity of the equation in represe nting experimental values of dew point.
According to the present results, the values of the constants as given by Dreisbach for the range 32 to 140 OF appear to be valid also for the saturated vapor pressure of subcooled water in th e range 0 to 32 OF.
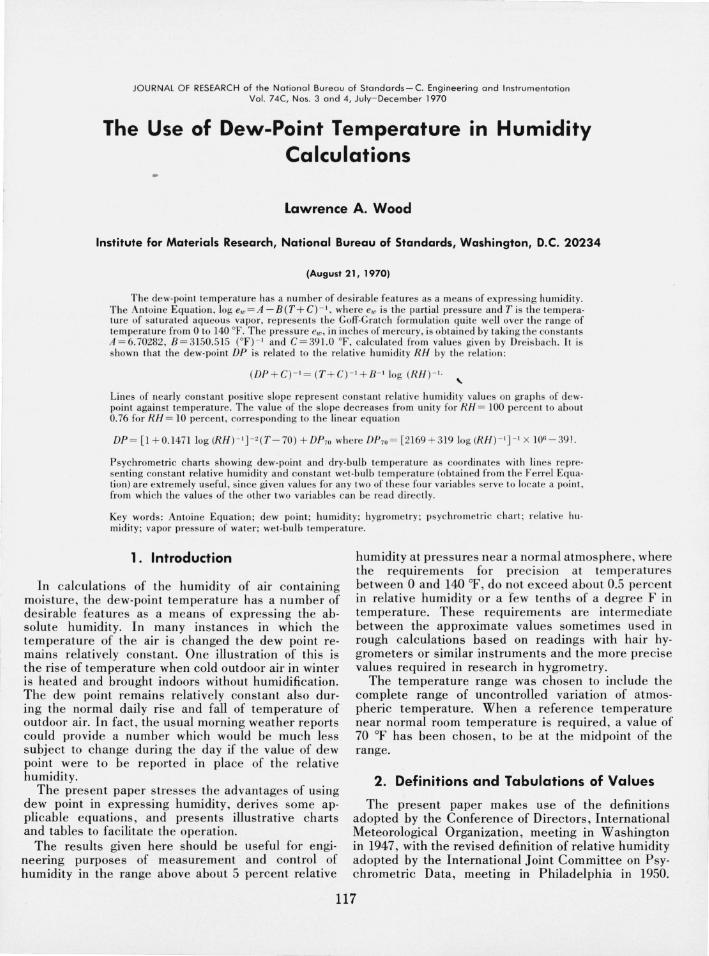
When the dew point for a given relative humidity is plotted as a function of temperature it is found that the data can be represented by a family of almost linear curves. Figure 1 shows such a plot, where the points represent the data of table 1. The lines shown are s traight lines with slopes decreasing [rom unity at RH = 100% to about 0.76 at RH = 10% .
FIG URE 1. Dew point DP as afunction of temperature T at different vaLues of reLative humidity RH.
119 403-833 0 - 70 - 5
Numerical values of the slope may be calculated from an equation obtained by differentiation of eq (3). This is:
d(DP)/dT=[I+B- I(T+C) log (RH) - I] - z. (4)
When the numerical values just obtained for the con· stants B- 1 and C are inserted it is found that the slope for the curve corresponding to 90 percent relative humidity should be about 0.986 at 70 of. The slope is about 0.2 percent greater than this at 0 of and about 0.2 percent less than this at 140 of. The predicted slope of the curve corresponding to 10 percent relative humidity should be about 0.76 at 70 of. It should be about 4 percent greater than this at 0 of and about 4 percent less than this at 140 of.
In view of this close approach to linearity of DP as a function of T at constant RH it is sometimes convenient to express the relation between dew point and temper.ature in strictly linear form involving DPo, the dew pomt at some reference temperature To , and a constant slope equal to the slope at To. DP=[1 + B- I(To +C) log (RH)- I] - Z[T- To]+DPo (Sa)
where
DPo= [(TO+C) - I + B- 1 log (RH) - I] - I-C. (5b)
For work near room temperature it is convenient to take the reference temperature To = 70 of. With the constants C = 391.0 of and B- 1 = 319 X 10- 6 (deg F)- I these equations become:
It should be recognized that this equation, in explicit form to yield the dew point, is an approximation. Equation (3) on the other hand depends only on the validity of the Antoine form and the proper evaluation of its constants Band C. However, calculation of values by eq (6) over the range of temperatures and humidities shown in table 1 leads to the conclusion that the differences are not significant for the degree of precision contemplated in the present work. The largest differences are found at the highest and lowest temperatures, as would be expected, and at the lowest humidities. At 0 and 140 of for 10 percent relative humidity the approximation yields values of dew point about 1 to 2° higher than eq (3). This difference falls to about 0.5° at 40 percent humidity and is still less at higher humidities. Even at 10 percent relative humidity it is no greater than 0.6° for temperatures from 30 to 130 of.
The straight lines in figure 1 were drawn, not to conform necessarily to the points, but rather to represent the dew point as a function of temperature as predicted by eq (6). It can be seen that the lines do conform very well to the points and that the differences are approximately those just mentioned.
When the linear approximation is not made, the values predicted by eq (3) differ by only a few tenths of a degree from those given in table 1 and thus deviate only imperceptibly from the experimental points shown in figure 1.
6. Wet-Bulb Temperature Isotherms
The lowering of temperature of a thermometer surrounded by a wick from which water is evaporating is often used to measure humidity [15]. There are numerous possibilities for error and uncertainty, but the method gives useful results when the proper precautions are taken.
Humidity is calculated from readings of wet-bulb temperature by the use of the Ferrel Equation [1, 15, 16, 17]
where er is the partial pressure of water vapor at the dry-bulb temperature T, e;"T' is the partial pressure of saturated water vapor at the wet-bulb temperature rand p is the total pressure . The quantity eT calculated by this equation is divided by ewT, the saturation vapor pressure at temperature T to obtain the relative humodity RH. From this , the dew point may be calculated by the methods given in the preceding sections of this paper. The total atmospheric pressure p appears in the Ferrel Equation , and due regard must be paid to variations in it, in calculations of humidity by this method. As in the preceding sections, the value here will be assumed to be the standard atmosphere of 29.921 in of mercury.
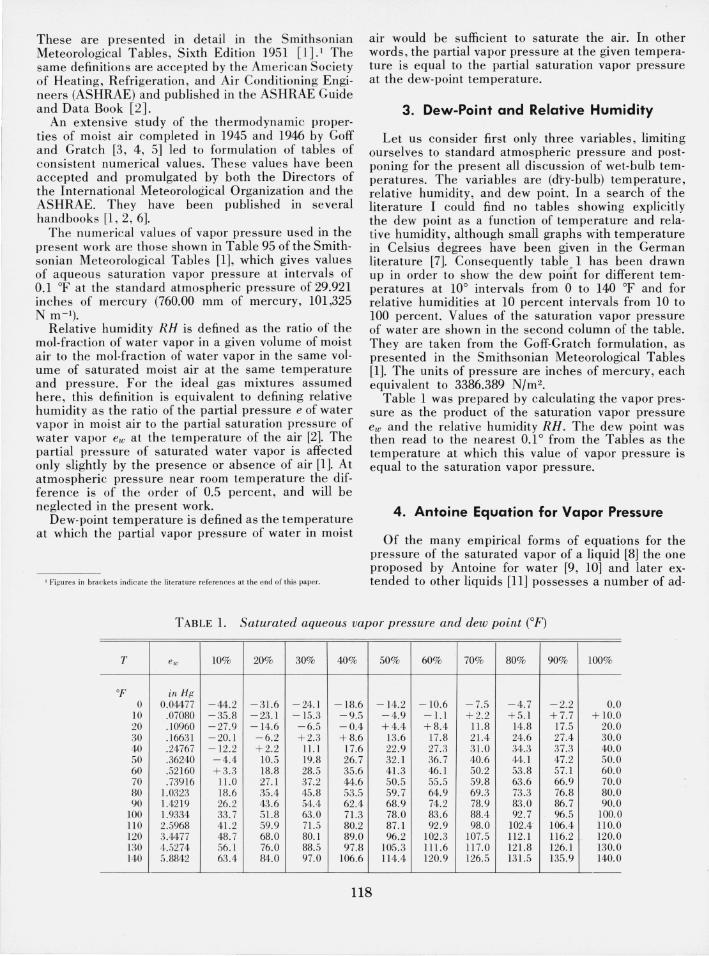
On a chart with dew point as ordinate and dry bulb temperature as abscissa one can show a family of curves corresponding to constant wet-bulb temperature. In figure 2 these curves have been drawn at 10° intervals. The values shown are those calculated from eq (7) in the manner just described. It will be noted that the slopes are always negative and that their absolute value increases with increase of dry-bulb temperature or with decrease of wet-bulb temperature. Several of the constant humidity lines of figure 1 are also shown in figure 2.
Dew point values as calculated from the Ferrel Equation to the nearest degree only, are tabulated directly as a function of wet- and dry-bulb temperatures in tables issued by the Weather Bureau [17]. Although the results are based on saturated vapor pressure values antedating those of Goff and Gratch [3, 4, 5], the I
dew points tabulated agree, to the nearest degree , with those calculated in the manner just described for the range studied in the present work.
7. Psychrometric Charts
A psychrometric chart with dew point as ordinate and temperature as abscissa, like figure 1, is very useful in humidity calculations. If wet-bulb temperatures are required, it can show superposed, as in figure 2, both the family of curves for constant wet-bulb temperature with negative slopes and the family of lines of positive slope representing constant relative humidity.
120
140r----,-----,----,-----,----.----~--__,
120
100
90
80
DP(OF) 60
40
20
-20 ~-~----1.<~:L::L---::Il:----,,Jl:-----L--L---L----1---.J o 60 80 120 140
T (OF)
F IC URE 2. Dew point DP as a/unction 0/ temperature T at different values 0/ wet·bulb temperature T '.
The lin es for rela tive humidi ti es of iO pe rcent . 50 pe rcent , and 100 percent fro m figure 1 are shown for compari son.
The rectangular box shows the range of values cove red in f-i gurc 3.
The psychrometric charts usually available in the handbooks a nd other references [2, 6] are similar to these but show as ordinate the partial vapor press ure or the absolute humidity in mass per unit volume of dry air or the humidity ratio (also called mixing ratio) in mass per unit mass of dry air, rather than the dew point. In all these charts the graphs representing constant relative humidities are c urves of constantly increasing slope, rather than the linear graphs shown in figure s 1 and 2_ Consequently , the calculation of the points, the drawing of the c urves, and the vi sual interpolation are all con siderably more difficult. However, the c urves representing constant wet-bulb tempe rature are us ually linear in contrast with those in figure 2.
As a measure of humidity the use of the dew point has another advantage over that of vapor pressure or mass per unit volume, since the conversion from British units to metri c units involves only a change from temperatures in degrees Fahrenheit to temperatures in degrees Celsius_ For example, figure 1 requires only a relabeling of the two coordinates in degrees Celsius to conform to the metric sys te m; fi gures 2 and 3 require, in addition, only the conversion of the wet-bulb temperatures to degrees Celsius_
Our psychrometric c hart shows four variables- dry bulb te mperature a nd dew point as coordinates with relative humidity and wet-bulb te mperature as lines. Given values for any two of the variables serve to define a point on the chart , from which the values of the other two variabl es may be read directly_ Such a chart is ~impler and easier to use than variou s nomograms whICh are available for humidity calculations [16].
In practical problems of humidity measurement and control the ranges of interest are usually much smaller than those shown in fi gu res 1 and 2_ Under such circumstances it is very con ve ni ent to use eqs (6) and (7) as a basis for drawing a grid consistin g of lin es of constant relative humidity and cons tant wet-bulb te mpe rature on a psychrometric chart.
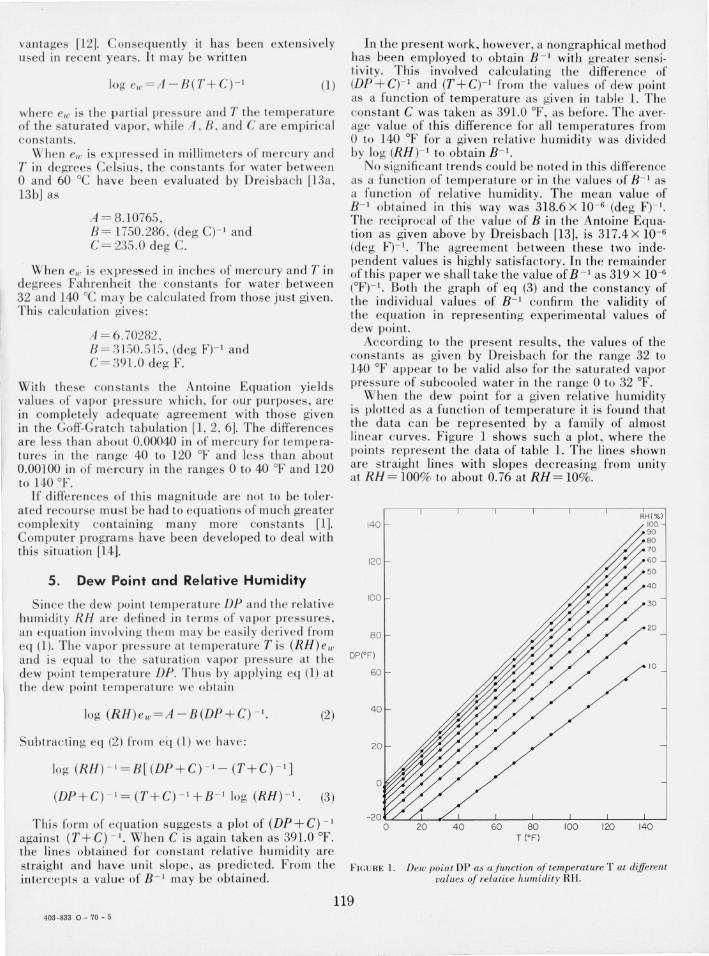
A typical example is shown in figure 3, which has been applied to the measurement and control of the humidity and temperature of the air surrounding a carbon arc. The relative humidity lines are drawn at intervals of 2 percent and the wet-bulb temperature curves at intervals of 1 OF on graph paper measuring 250 X 180 mm. Visual estimation of tenths of the intervals between curves makes possible interpolation of values to 0.2 percent relative humidity and 0.1 OF wet-bulb temperature. Each millimeter on the scales for coordinates represents tenth s of degrees for dew point and dry bulb te mperature.
In one application of the chart it was desired to find the we t-bulb te mperature corresponding to 30 percent relative humidity a t 117 OF. The chart showed the dew point to be 77.5 OF , and the corresponding wet-b ulb te mperature was th e n es timated as 87.0 OF by vi s ual interpola tion along a lin e through the de w point a pproxim ately normal to the two neares t wetbulb iso th erm s.
In another typical application the wet-bulb temperature was observed to be 84.5 OF at a te mperature of 110 OF. The de w point was then read from the chart as 76.0 OF and the relative humidity as 35.0 percent.
On another occasion it was desired to know how high the relative humidity could be a t 115 OF without having condensation when the air was cooled to room temperature 77 oF. This was read from the chart as 31.4 percent, together with the corresponding wetbulb te mperature of 86.3 OF.
Finally, a fourth problem involved de terminin g the temperature to which one mu st heat air with a dew point of 70 OF in order to reduce its rela tive humidity to 30 percent. The value was read to be 108.5 OF, with a corresponding wet-bulb te mperature of 80.7 OF.
In all four proble ms the values of the desired qunatities were found by locating a single point on the chart, and the whole operation was completed in a much shorter time than when alternative methods were used.
8. Summary and Conclusions
. The Antoine Equation has been shown to represent wIth good accuracy the values of the saturated vapor pressure of water over the range 0 to 140 OF, as formulated by Goff and Gratch and promulgated by meteorological and air-conditioning organizations. The dew point DP is related to the temperature T and relative humidity RH by the following equation:
(DP+C) - '=(T+C) - '+B - 'log (RH) - '
where B - 1 and C, constants in the Antoine Equation, ~ave the values 31?X 10- 6 CF)- ' and 391 CF) respectively. The dew pomt DP may also be calculated with
121
78
76
74
72 DP ('F)
70
68
66
64
95 110 120 T ('F)
fI GU RE 3. Typical psychrometric chart of dew point DP llnd temperatu re T used in humidity calcu lations. The ra nge of vaJ w 's coye red is tha t of th e reelangu lar Lox s hown in fig ure 2. Lin es of posi t ive s lope co rres pon d to con~ t a n t \~Ia ' i\'e humid it y (HH= IH to 60%). I.in t.' s of ne ga ti ve s lu pp C! 'ITCS pund tn cons ta nt \ .... e l-bu lb tempe ra ture (1" = 74 10 88 o ~ ').
satisfactory accuracy from the linear equation
DP=[l+0.1471log (RH) - I] - 2(T-70) + DP70
where
DP70 = [2169+319 log (RH) - I] - I X 106-39l.
It is convenient and useful to plot the dew point of moist air as a func tion of the temperature of the air. Points corresponding to constant relative humidity are well represented by lines of constant positive slope with the value of the slope decreasing from unity at 100 percent relative humidity to about 0.76 at 10 percent relative humidity. On the same chart showing dew point as ordinate and temperature as abscissa, points corresponding to constant wet· bulb temperature appear on lines of variable negative slope. The absolute value of this slope in creases with increase of (dry-bulb) temperature and with decrease of we t-bulb temperature. Psychrometric charts showing dry-bulb temperature and dew point as coordinates with relative humidity and wet-bulb temperatu re as lines are extremely useful in humidity calculations, since given values for any two of these four variables serve to locate a point, from whi ch the values of the other two variables can be read directly.
[ 1]
[2]
[3]
[4]
9. References List, Robert J., Smith sonian Meteorological Tabl es , 6th Re·
ASHRAE Guide and Data Book. 1965- 66 , p. 29 . Ameri can Soc iety of Hea ting. Refri gerating and Air Conditioning Engin ee rs, Ne w York, 1965.
Goff, J. A., and Gratch , S ., Thermodynamic Properties of Moi st Air , Am . Soc. Heating and Ventilating Engineers Trans. 51, 125 (1945); Heating. Piping, and Air Conditioning ASHVE lournal 17,334 (1945).
Goff, J. A., and Gratch , S. , Low Pressure Properties of Water in the Range-160 to 212 OF, Am. Soc. Heating and Ventilat· ing Engineers Trans. 52,95 (1946).
[5] Goff, 10hn A. , Chairma n, Standardi zat ion of The rm odynamic P roperti es of Mois t Ai r. Final Report of Work ing S ubcom· mittee, Intern ational l oint Committee on Psychrometri c Data, Am . Soc. Mech. Eng. Trans. 71, 903 (1949); A m. Soc. Hea ting Ve ntila ting Eng. Tra ns. 55 , 463 (1949).
[6] P erry, John H., Editor, Chemical Engineers Handbook, 3rd Edition , p. 760 , McGraw Hill , New York, 1950.
[7 ] Liene weg, F., Absolute und relative Feuchtbes timmun gen mi t den Lithiumc hl orid Feuchtemesser, Siemens·Zeitschr ift 29, No. 5/6, 212 (1955). Reproduced in book, W. Luck Feuchtigkeit : Grundlagen, Messen, R egel n , P . Olde nbourg, Muni ch and Vie nna , 1964; and a lso in book D. Sonntag Hygrometri e, E in Handbauch der fe uchtigkeitsmess ung, No. 6 , p. 985 (Akadem ie· Ve rlag , Berlin , 1966).
[8] Pa rtington, .J. P., An Advanced Treatise on Physical Che mis· try, Vol. 2 , p. 265 (Longmans, Green, and Co. , London , 1951).
[9] Antoine , c. , Vapor Press ures , New rela tion between pressures and temperatures, Comptes Rendus 107,681 (1888).
[ lO] Antoine , c. , On the vapor pressure of water up to 200 at· mospheres, Compt es Rendu s 113 , 328 (l891 ); 116, 870 (1893).
[11 ] Antoine , c. , Calcul a t ion of pressures of various vapors , Com ptes Re ndu s 107, 778 a nd 836 (1888).
[ 12] Thomson , C. W., T he Antoine Equation for vapor·pressure data , C he m. Rev. 38, 1 (1946).
[13a1 Dreis bach, R. R. , Ph ys ical Properti es of Chemical Co m· pou nds, Vol. III , p. 474, Advances in Chemistry Series No. 29 , American C he mical Society, Washington, 1961.
[13bJ Lange, N. A. , Handbook of C he mi stry, 10th Edition , p. 1438 (McG raw·Hill , New York , 1961).
[14] Ku suda , T., Algorithm s for psychometri c calcul ations ofth erm· odyna mic properti es of moist air , Nat. Bur. Stand. (U.S.), BSS 21 , 53 pa~es (Ja n. 1970). U.S . Gove rnment Printing Office, Washin gton, D.C. 20402.
[15] Wexl er , A. , and Bro mbache r, W. G., Methods of Meas urin g Humidity and Testing H ygrom ete rs, Nat. Bur. Stand. (U.S.), Circ. 512, 18 pages (1951).
[Hi] Bindon, H. H., A C riti cal Review of Tables and C harts Used in P sychrom etry , Vol. I, p. 3 in Book Humidit y a nd Mois· ture , Measureme nt and Control in Science and Industry, Arnold Wexl er , Ed. (Reinhold. New York . 1964).
[17] Marvin , C. F ., P s ychrometri c Tables for Obt a inin g Va por Pressure, Relative Humidity, and Dew Point , U.S. Dept. of Commerce, Weather Bureau, U.S. Gove rnme nt Printing Office , Washington , D.C. (1941).