Page 1
1 januari 2008
The use of LiDAR data in peatland mapping and
management
Deltares ‘lowland/peat’ team:
Al Hooijer, Ronald Vernimmen, Martijn Visser
Corine ten Velden, Dirk Eilander, Dedi Mulyadi, Angga Yuherdha
[email protected]
Visit of delegation Indonesian Ministry of Environment and Forestry, Wageningen University, 5 April 2016
Page 2
1 januari 2008
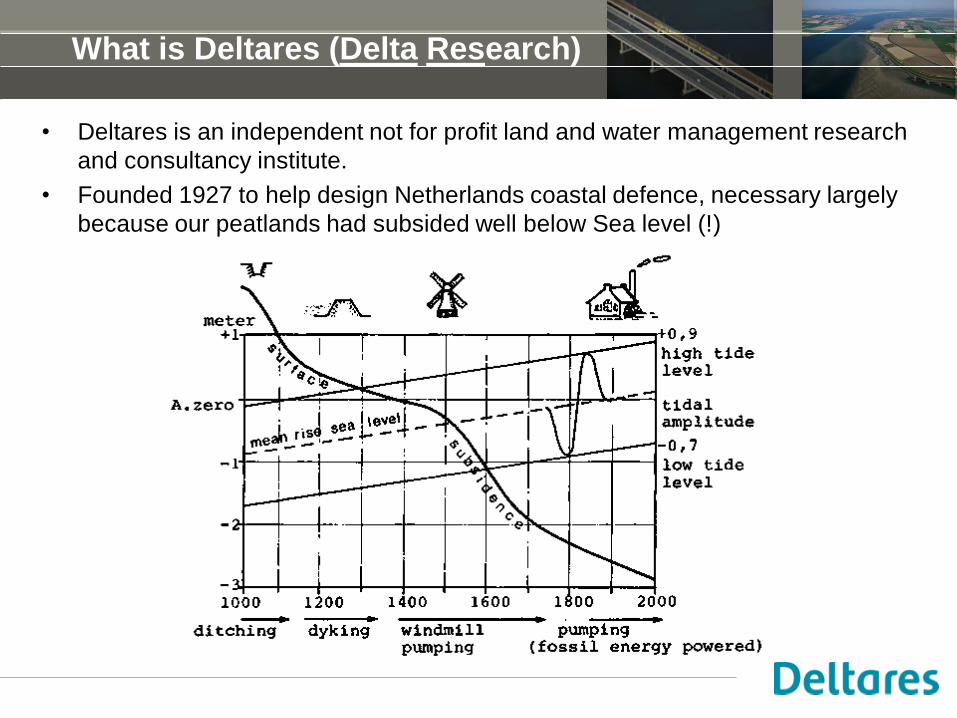
• Deltares is an independent not for profit land and water management research
and consultancy institute.
• Founded 1927 to help design Netherlands coastal defence, necessary largely
because our peatlands had subsided well below Sea level (!)
What is Deltares (Delta Research)
Page 3
Who am I
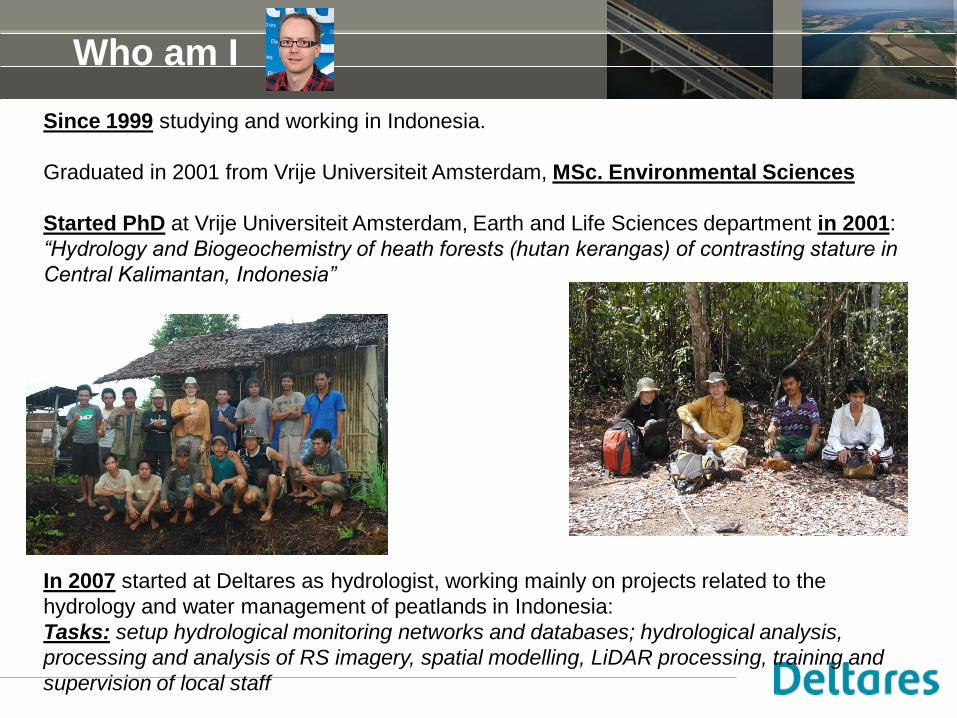
Since 1999 studying and working in Indonesia.
Graduated in 2001 from Vrije Universiteit Amsterdam, MSc. Environmental Sciences
Started PhD at Vrije Universiteit Amsterdam, Earth and Life Sciences department in 2001:
“Hydrology and Biogeochemistry of heath forests (hutan kerangas) of contrasting stature in
Central Kalimantan, Indonesia”
In 2007 started at Deltares as hydrologist, working mainly on projects related to the
hydrology and water management of peatlands in Indonesia:
Tasks: setup hydrological monitoring networks and databases; hydrological analysis,
processing and analysis of RS imagery, spatial modelling, LiDAR processing, training and
supervision of local staff
Page 4
1 januari 2008
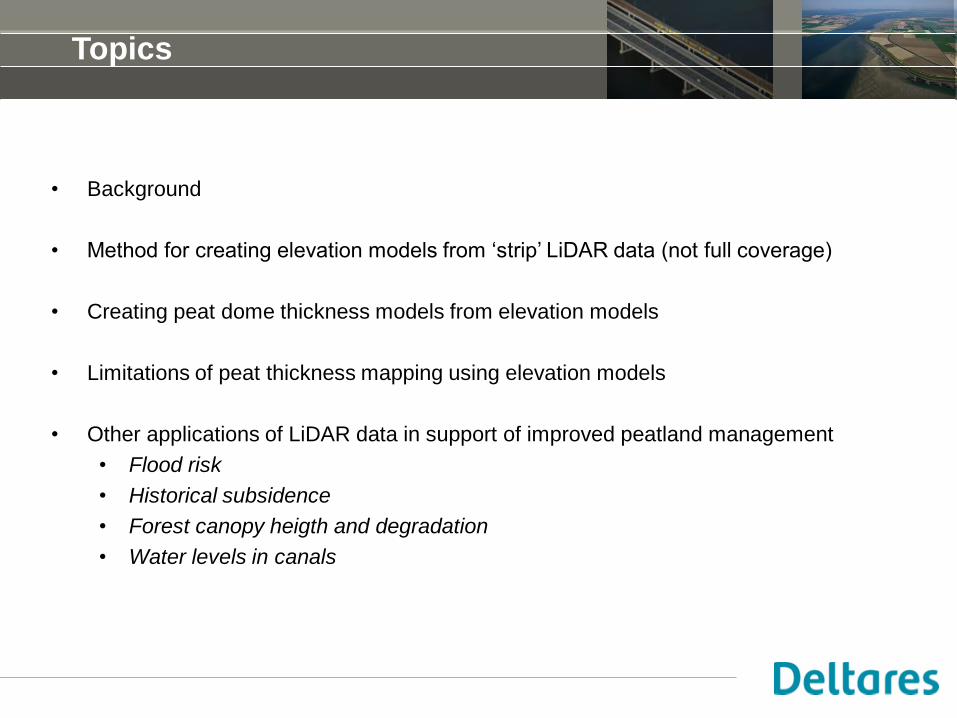
• Background
• Method for creating elevation models from ‘strip’ LiDAR data (not full coverage)
• Creating peat dome thickness models from elevation models
• Limitations of peat thickness mapping using elevation models
• Other applications of LiDAR data in support of improved peatland management
• Flood risk
• Historical subsidence
• Forest canopy heigth and degradation
• Water levels in canals
Topics
Page 5
1 januari 2008
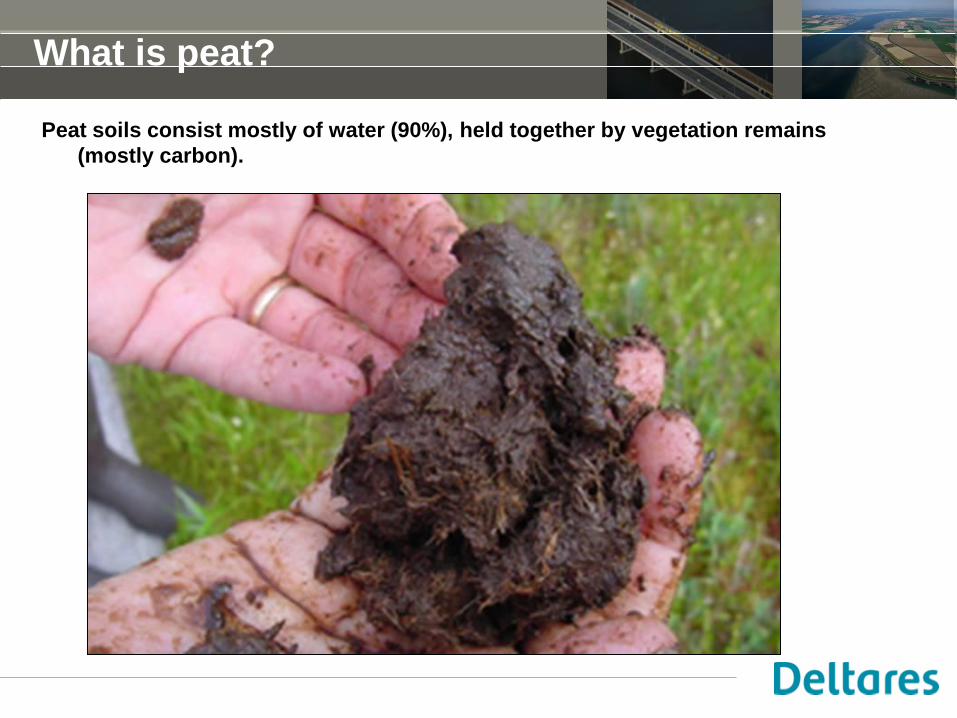
Peat soils consist mostly of water (90%), held together by vegetation remains
(mostly carbon).
What is peat?
Page 6
1 januari 2008
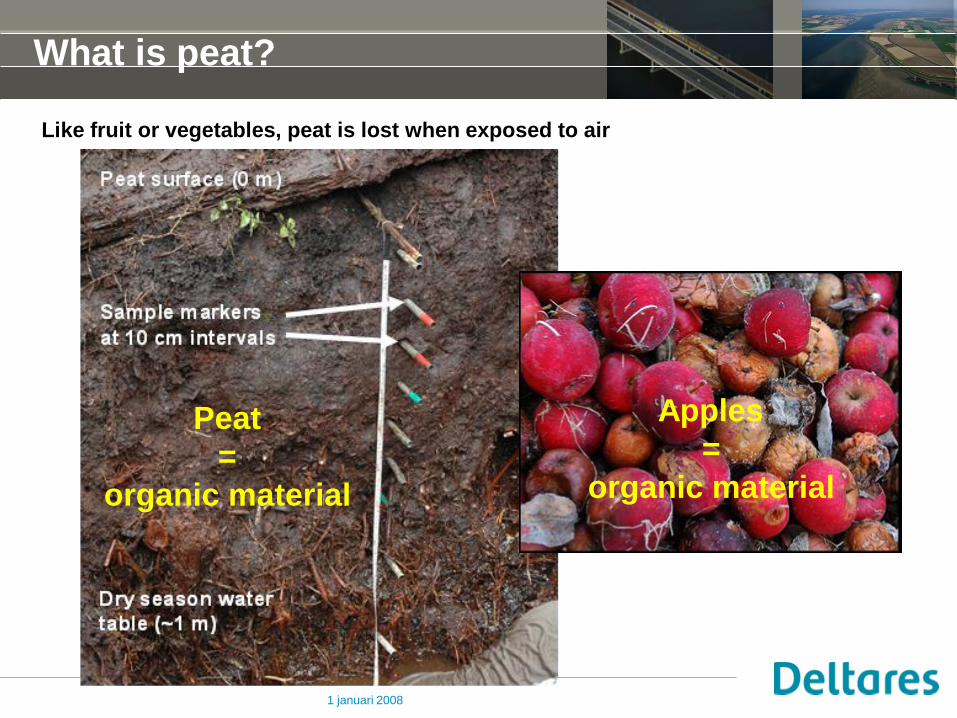
Like fruit or vegetables, peat is lost when exposed to air
What is peat?
Peat
=
organic material
Apples
=
organic material
Page 7
1 januari 2008
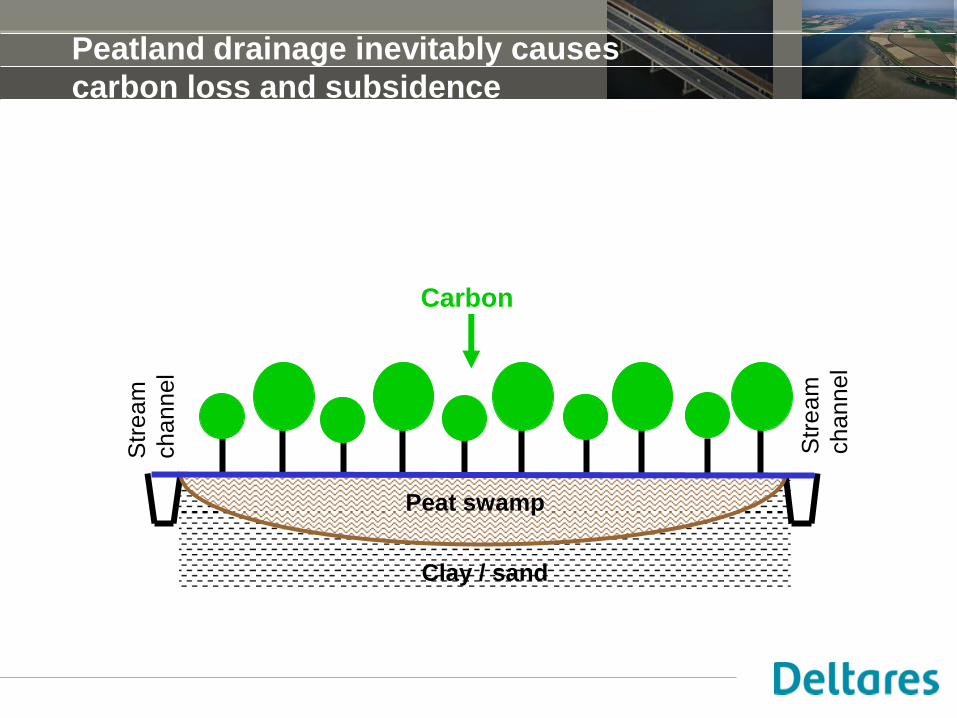
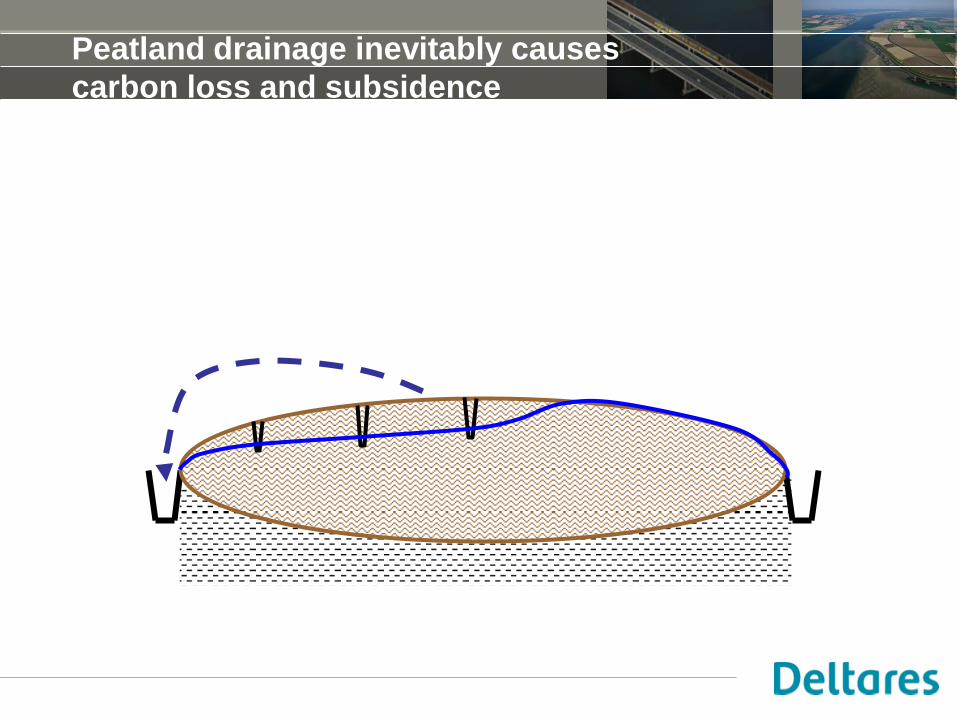
Peatland drainage inevitably causes
carbon loss and subsidence
Clay / sand
ΔL
Peat swamp
Str
ea
m
ch
an
ne
l
Str
ea
m
ch
an
ne
l
Carbon
Page 8
1 januari 2008
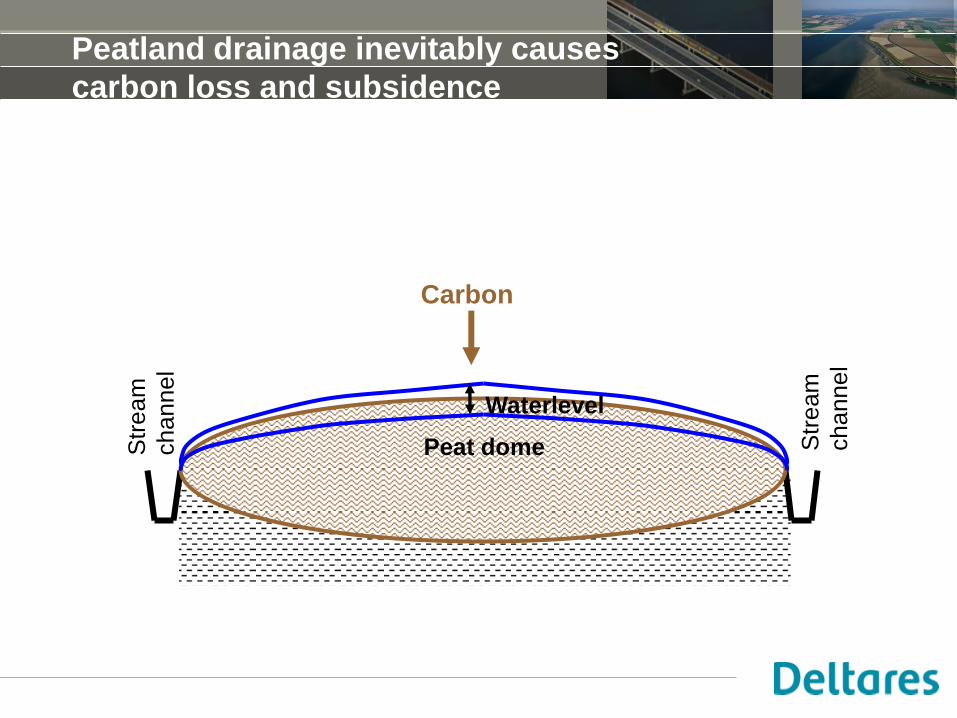
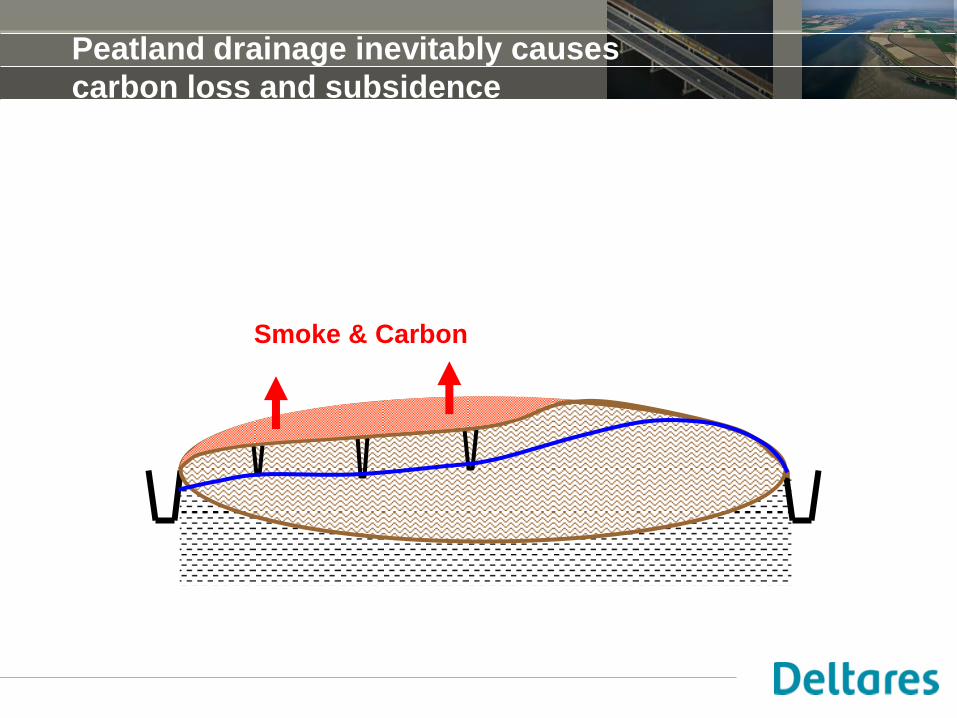
Peatland drainage inevitably causes
carbon loss and subsidence
Waterlevel
Peat dome Str
ea
m
ch
an
ne
l
Str
ea
m
ch
an
ne
l
Carbon
Page 9
1 januari 2008
Peatland drainage inevitably causes
carbon loss and subsidence
Page 10
1 januari 2008
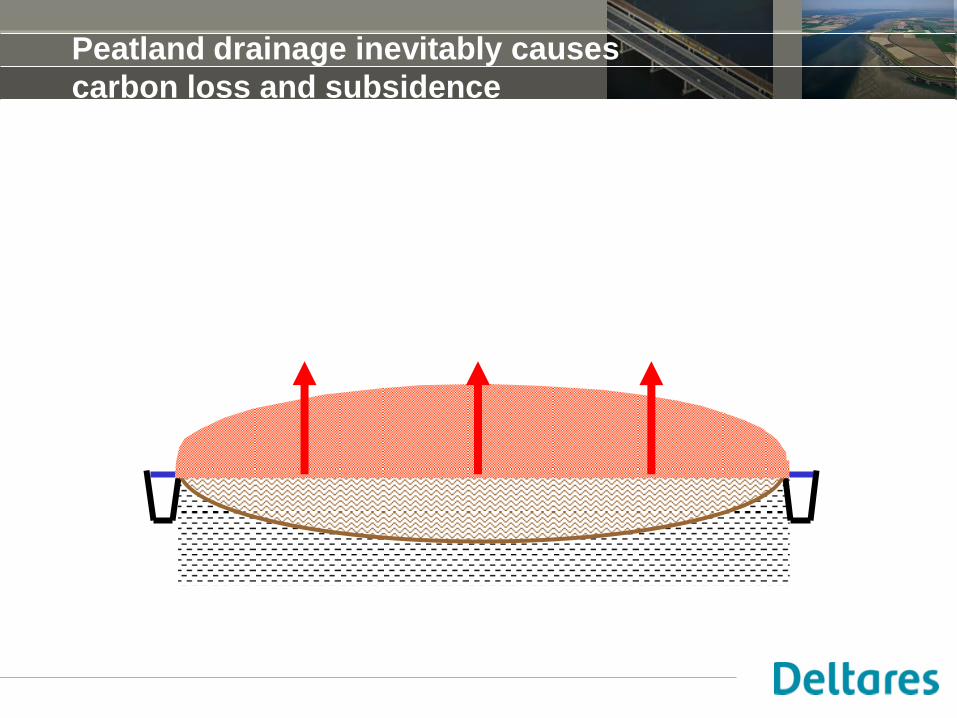
Peatland drainage inevitably causes
carbon loss and subsidence
Smoke & Carbon
Page 11
1 januari 2008
Peatland drainage inevitably causes
carbon loss and subsidence
Page 12
1 januari 2008
Background - summary
Peat consists of 90% water and 10% organic material that is mostly carbon.
After drainage, peat will decompose, and often burn, causing carbon emissions to the
atmosphere, as well as land subsidence that results in flooding.
Peatlands are therefore not really ‘land’ in the normal sense, but should be managed
as wetlands with high water levels and limited disturbance to keep the carbon stored
and the surface above flood levels.
Better data is needed for better management. Elevation models can be used to
produce peat thickness maps as well as flood risk models.
Such maps are needed to determine what activities are possible on peatland, as deep
peat is known to be unsuitable for many uses. With better maps, better spatial planning
and zoning is possible that minimizes carbon emissions, fire risk and flood risk.
Page 13
1 januari 2008
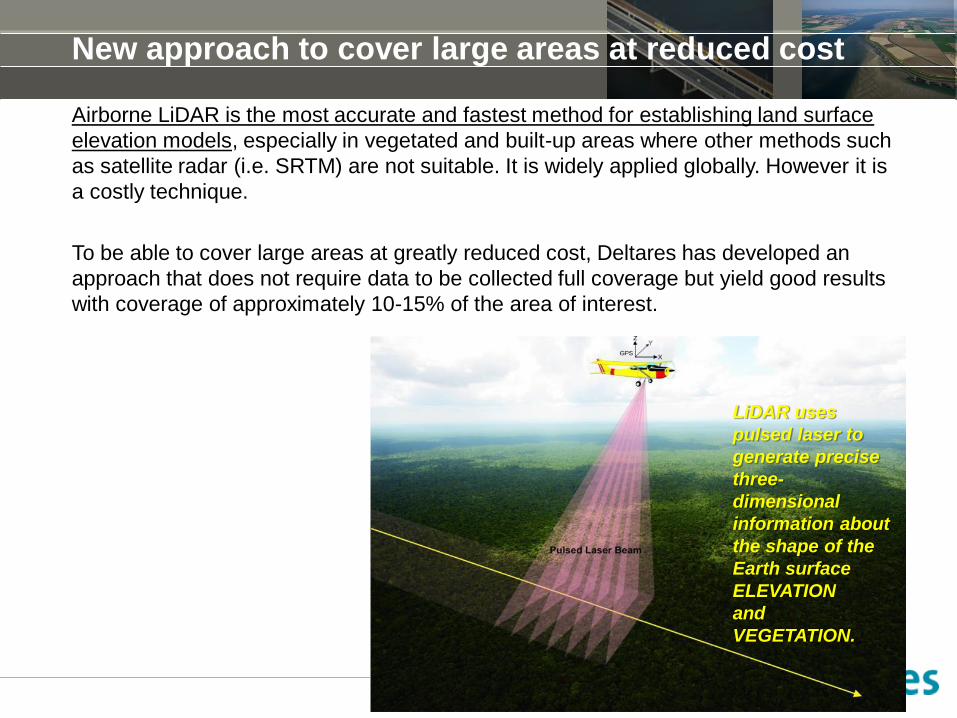
New approach to cover large areas at reduced cost
Airborne LiDAR is the most accurate and fastest method for establishing land surface
elevation models, especially in vegetated and built-up areas where other methods such
as satellite radar (i.e. SRTM) are not suitable. It is widely applied globally. However it is
a costly technique.
To be able to cover large areas at greatly reduced cost, Deltares has developed an
approach that does not require data to be collected full coverage but yield good results
with coverage of approximately 10-15% of the area of interest.
LiDAR uses
pulsed laser to
generate precise
three-
dimensional
information about
the shape of the
Earth surface
ELEVATION
and
VEGETATION.
Page 14
1 januari 2008
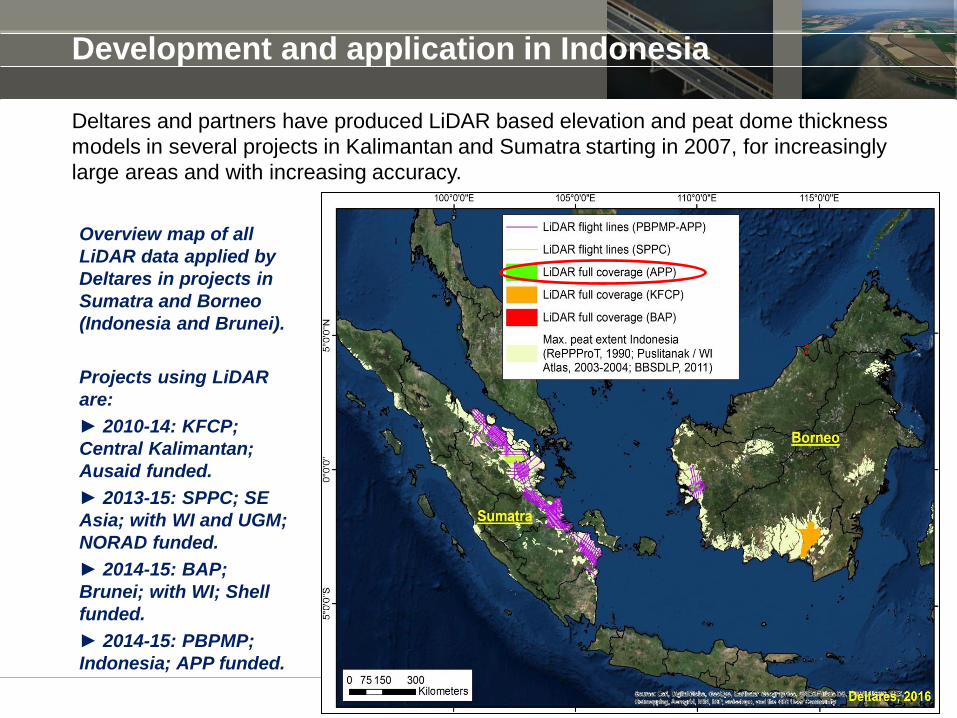
Development and application in Indonesia
Overview map of all
LiDAR data applied by
Deltares in projects in
Sumatra and Borneo
(Indonesia and Brunei).
Projects using LiDAR
are:
► 2010-14: KFCP;
Central Kalimantan;
Ausaid funded.
► 2013-15: SPPC; SE
Asia; with WI and UGM;
NORAD funded.
► 2014-15: BAP;
Brunei; with WI; Shell
funded.
► 2014-15: PBPMP;
Indonesia; APP funded.
Deltares and partners have produced LiDAR based elevation and peat dome thickness
models in several projects in Kalimantan and Sumatra starting in 2007, for increasingly
large areas and with increasing accuracy.
Page 15
1 januari 2008
Determining the peat extent to be mapped
The LiDAR based approach can be used to determine the extent of peat domes from
elevation models, from the shape of the landscape or from estimated peat thickness. In
Indonesia, we find it to be suitable for mapping peat that is over 2 or 3 metres in depth.
However, it is less suitable for mapping the full extent of peatland because there are
areas of shallow peat that can not be distinguished from LiDAR images.
To plan the area over which airborne LiDAR data should be collected for mapping of
peat domes, we first determine minimum, likely and maximum peat extent from three
existing maps.
Page 16
1 januari 2008
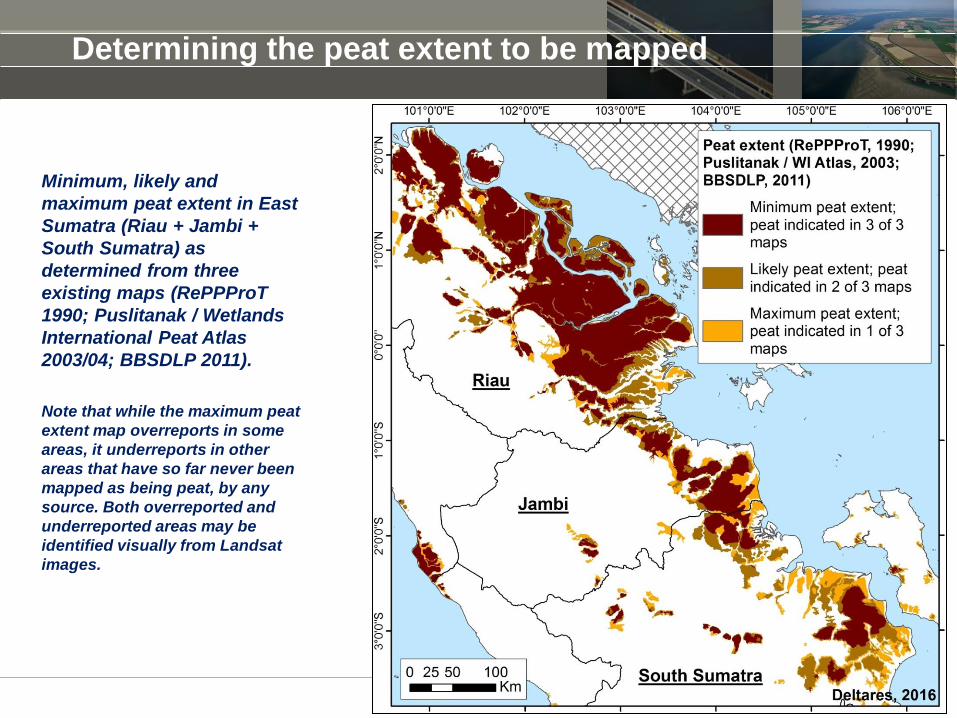
Minimum, likely and
maximum peat extent in East
Sumatra (Riau + Jambi +
South Sumatra) as
determined from three
existing maps (RePPProT
1990; Puslitanak / Wetlands
International Peat Atlas
2003/04; BBSDLP 2011).
Note that while the maximum peat
extent map overreports in some
areas, it underreports in other
areas that have so far never been
mapped as being peat, by any
source. Both overreported and
underreported areas may be
identified visually from Landsat
images.
Determining the peat extent to be mapped
Page 17
1 januari 2008
Method for creating a surface elevation model from
LiDAR strip data
Over the period of April to May 2015, LiDAR data were collected covering the coastal
peatlands of East Sumatra along a total of ~9,600 km of flight lines at 5 to 10 km
intervals.
The LiDAR data were referenced to Mean Sea Level (MSL) through linking the LiDAR
data to 6 national second order vertical control benchmarks distributed throughout the
survey area; referencing was verified against actual Sea levels as occurring in the
LiDAR data.
Vegetation signal was filtered out, yielding ‘strips’ of LiDAR data points representing
surface elevation only;
Contour lines at 1 m intervals were manually drawn between ‘data strips’, aided
visually with Landsat composite images in the background to take into account location
of rivers and general landscape morphology, to improve accuracy of the resulting
surface elevation model that was created through inverse distance interpolation
between strip data and contour lines.
Page 18
1 januari 2008
Method for creating a surface elevation model
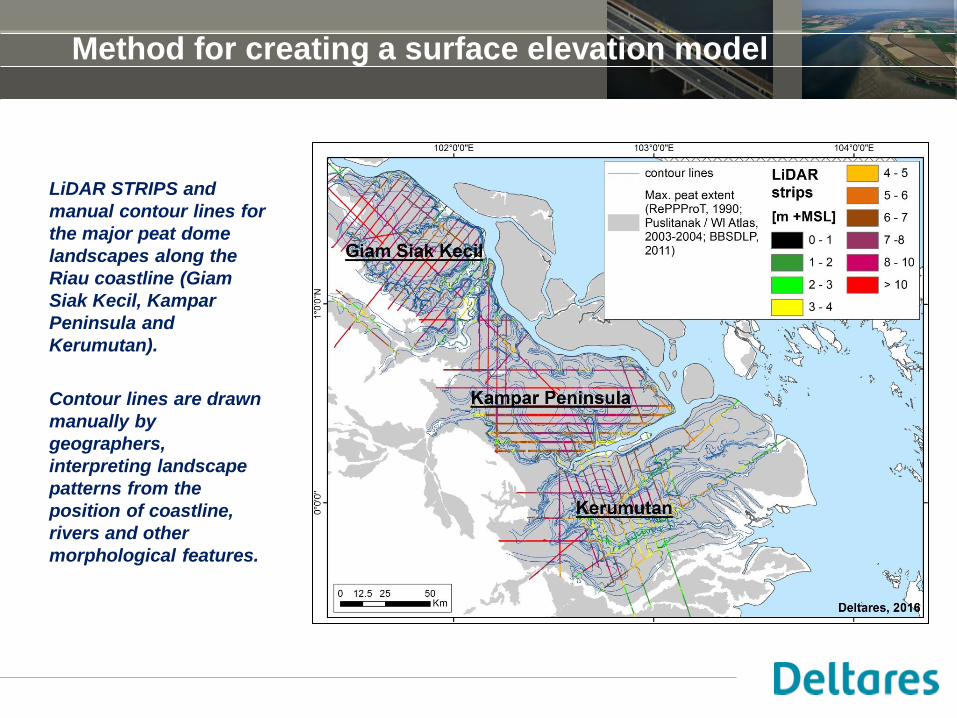
LiDAR STRIPS and
manual contour lines for
the major peat dome
landscapes along the
Riau coastline (Giam
Siak Kecil, Kampar
Peninsula and
Kerumutan).
Contour lines are drawn
manually by
geographers,
interpreting landscape
patterns from the
position of coastline,
rivers and other
morphological features.
Page 19
1 januari 2008
Method for creating a surface elevation model
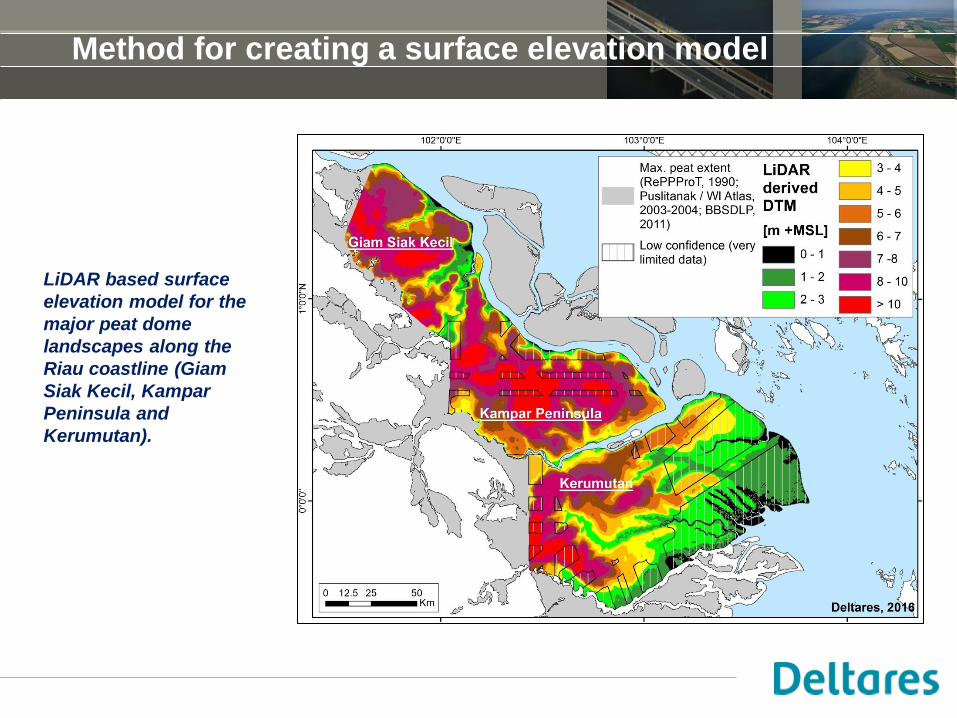
LiDAR based surface
elevation model for the
major peat dome
landscapes along the
Riau coastline (Giam
Siak Kecil, Kampar
Peninsula and
Kerumutan).
Page 20
1 januari 2008
Method for creating a surface elevation model
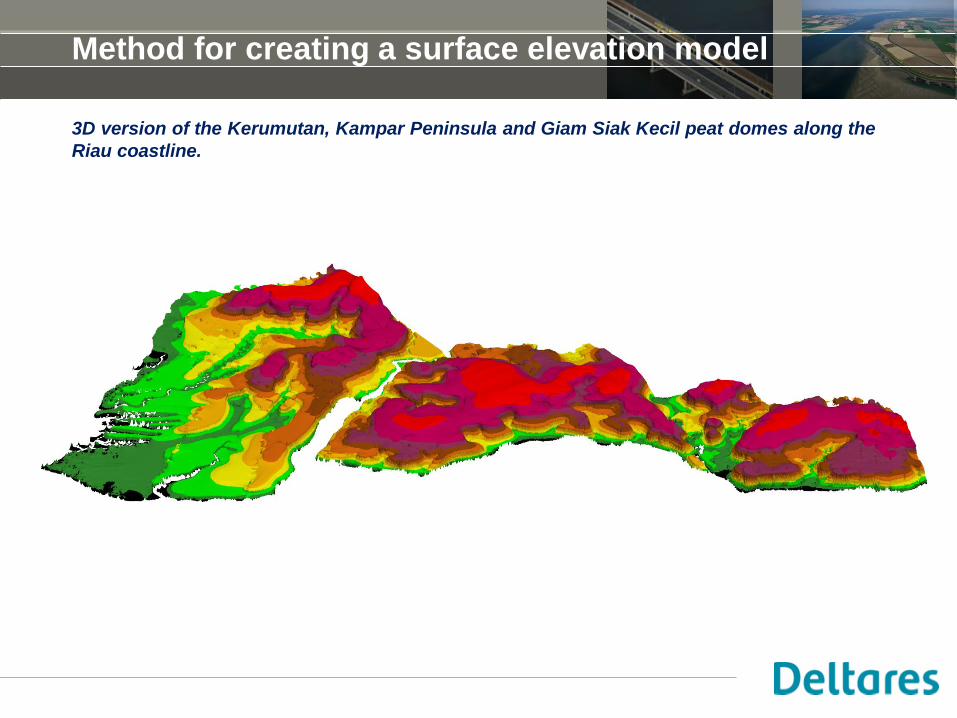
3D version of the Kerumutan, Kampar Peninsula and Giam Siak Kecil peat domes along the
Riau coastline.
Page 21
1 januari 2008
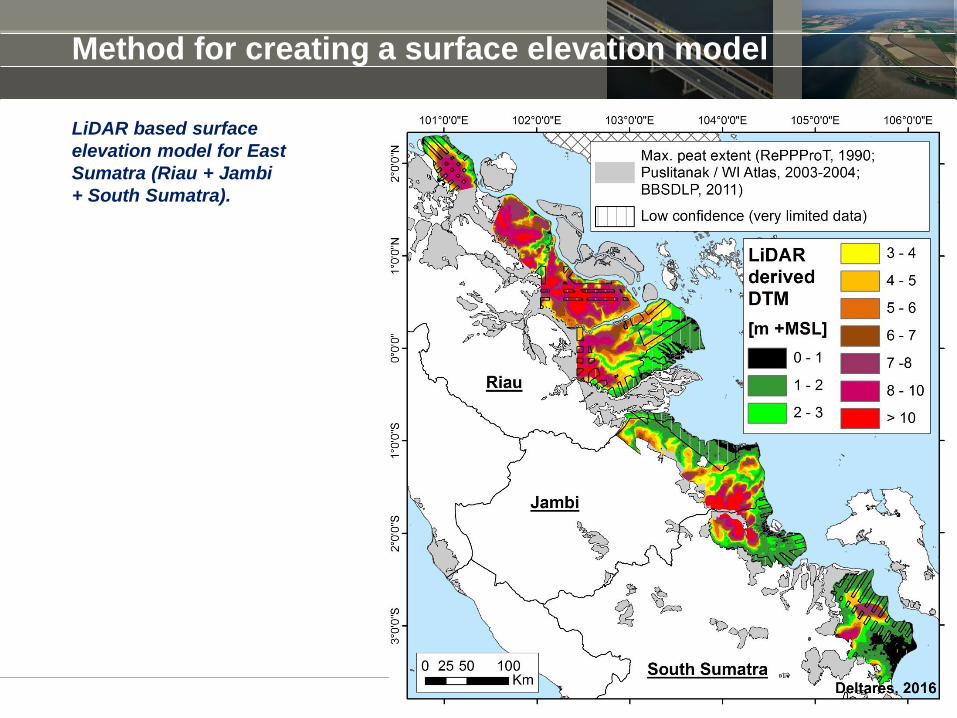
Method for creating a surface elevation model
LiDAR based surface
elevation model for East
Sumatra (Riau + Jambi
+ South Sumatra).
Page 22
1 januari 2008
Method for creating a surface elevation model
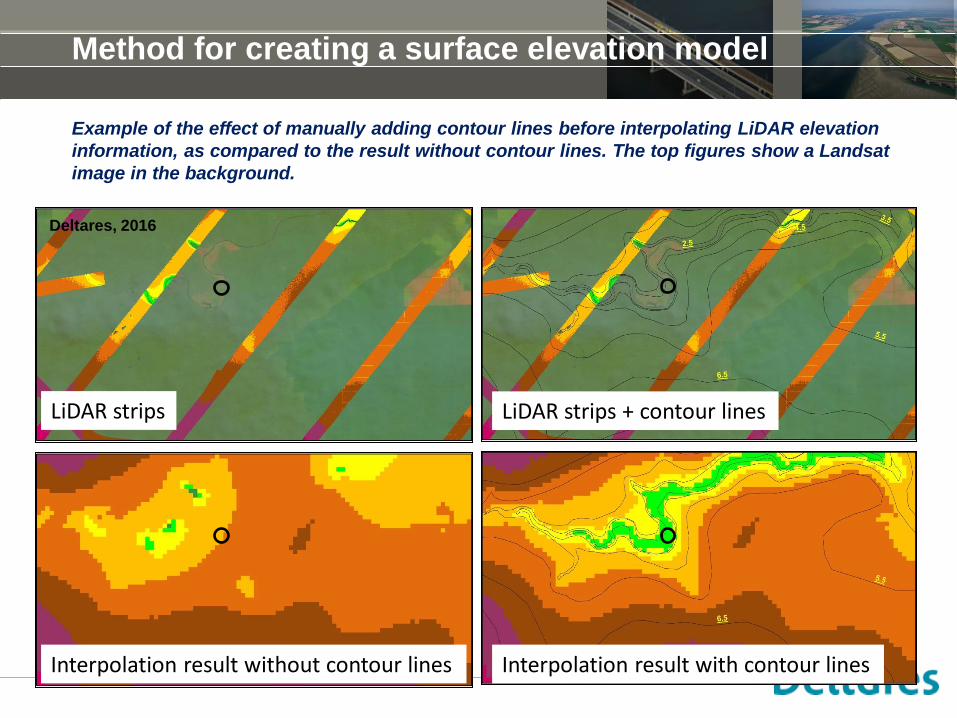
Example of the effect of manually adding contour lines before interpolating LiDAR elevation
information, as compared to the result without contour lines. The top figures show a Landsat
image in the background.
Interpolation result without contour lines Interpolation result with contour lines
LiDAR strips + contour lines LiDAR strips
Deltares, 2016
Page 23
1 januari 2008
Accuracy of surface elevation model
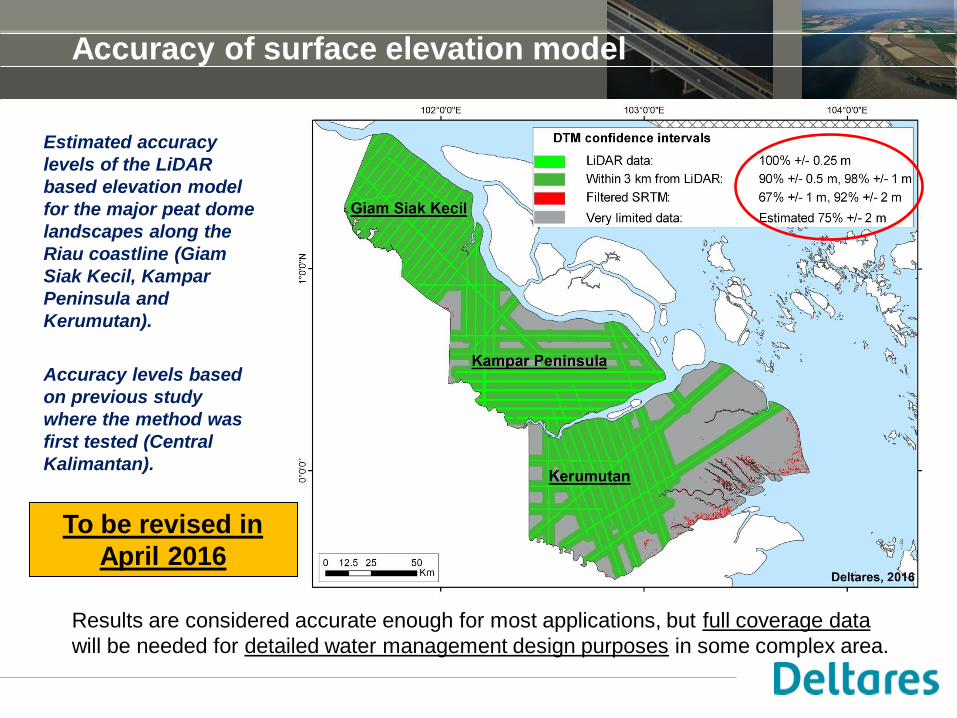
Estimated accuracy
levels of the LiDAR
based elevation model
for the major peat dome
landscapes along the
Riau coastline (Giam
Siak Kecil, Kampar
Peninsula and
Kerumutan).
Accuracy levels based
on previous study
where the method was
first tested (Central
Kalimantan).
Results are considered accurate enough for most applications, but full coverage data
will be needed for detailed water management design purposes in some complex area.
To be revised in
April 2016
Page 24
1 januari 2008
Using the surface elevation model to create a peat
thickness model for peat domes
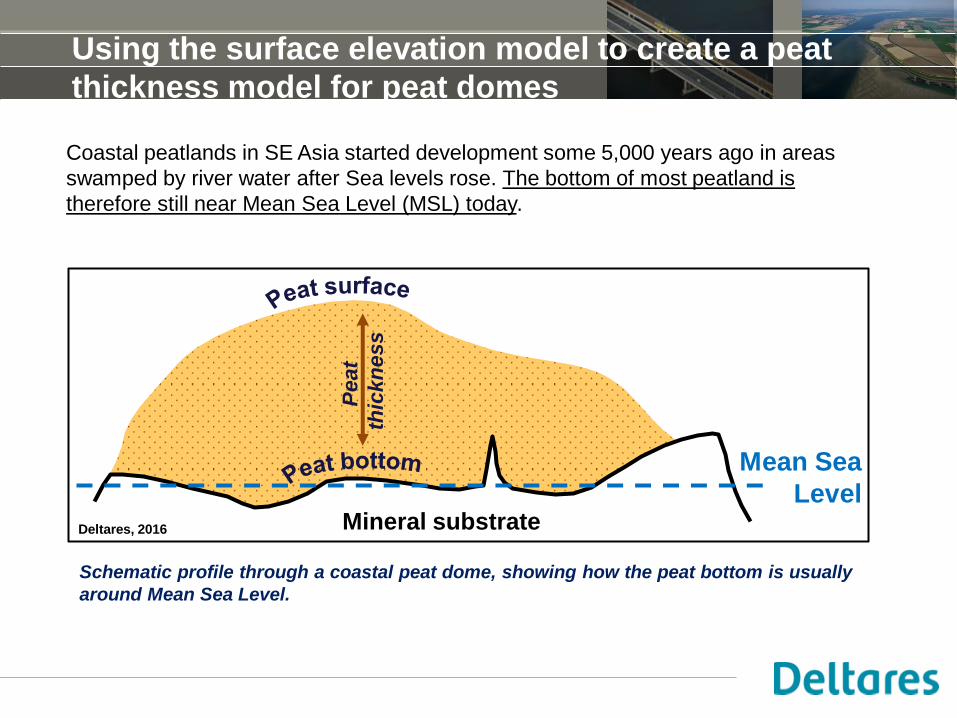
Schematic profile through a coastal peat dome, showing how the peat bottom is usually
around Mean Sea Level.
Deltares, 2016
Mean Sea
Level Mineral substrate
Peat
thic
kn
ess
Coastal peatlands in SE Asia started development some 5,000 years ago in areas
swamped by river water after Sea levels rose. The bottom of most peatland is
therefore still near Mean Sea Level (MSL) today.
Page 25
1 januari 2008
Using the surface elevation model to create a peat
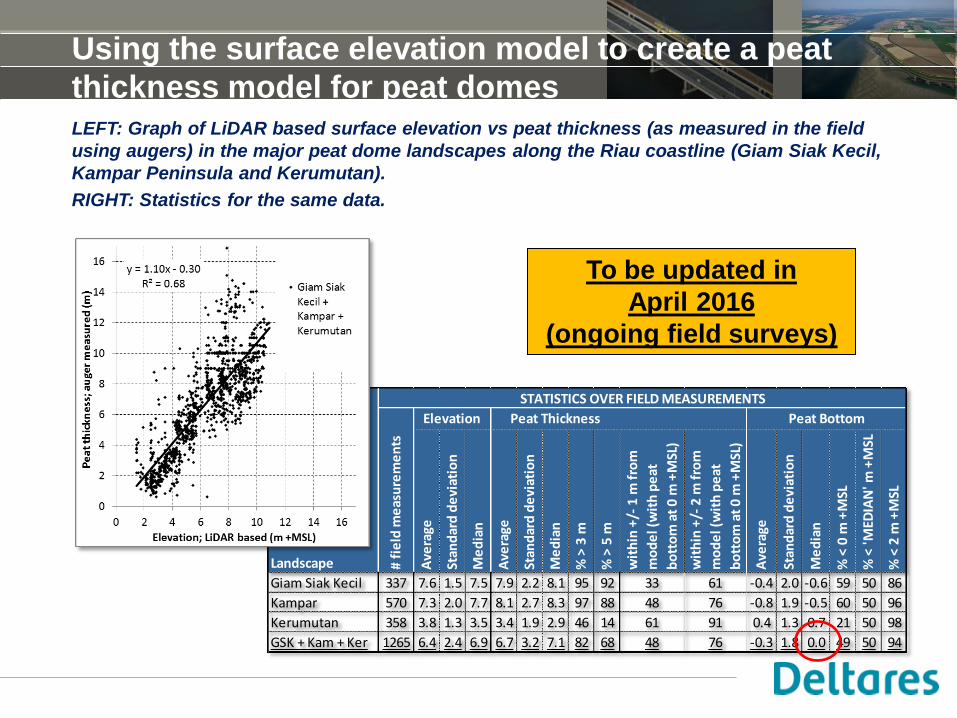
thickness model for peat domes LEFT: Graph of LiDAR based surface elevation vs peat thickness (as measured in the field
using augers) in the major peat dome landscapes along the Riau coastline (Giam Siak Kecil,
Kampar Peninsula and Kerumutan).
RIGHT: Statistics for the same data.
Landscape # f
ield
me
asu
rem
en
ts
Ave
rage
Stan
dar
d d
evi
atio
n
Me
dia
n
Ave
rage
Stan
dar
d d
evi
atio
n
Me
dia
n
% >
3 m
% >
5 m
wit
hin
+/-
1 m
fro
m
mo
de
l (w
ith
pe
at
bo
tto
m a
t 0
m +
MSL
)
wit
hin
+/-
2 m
fro
m
mo
de
l (w
ith
pe
at
bo
tto
m a
t 0
m +
MSL
)
Ave
rage
Stan
dar
d d
evi
atio
n
Me
dia
n
% <
0 m
+M
SL
% <
'MED
IAN
' m +
MSL
% <
2 m
+M
SL
Giam Siak Kecil 337 7.6 1.5 7.5 7.9 2.2 8.1 95 92 33 61 -0.4 2.0 -0.6 59 50 86
Kampar 570 7.3 2.0 7.7 8.1 2.7 8.3 97 88 48 76 -0.8 1.9 -0.5 60 50 96
Kerumutan 358 3.8 1.3 3.5 3.4 1.9 2.9 46 14 61 91 0.4 1.3 0.7 21 50 98
GSK + Kam + Ker 1265 6.4 2.4 6.9 6.7 3.2 7.1 82 68 48 76 -0.3 1.8 0.0 49 50 94
STATISTICS OVER FIELD MEASUREMENTS
Elevation Peat Thickness Peat Bottom
To be updated in
April 2016
(ongoing field surveys)
Page 26
1 januari 2008
Using the surface elevation model to create a peat
thickness model for peat domes
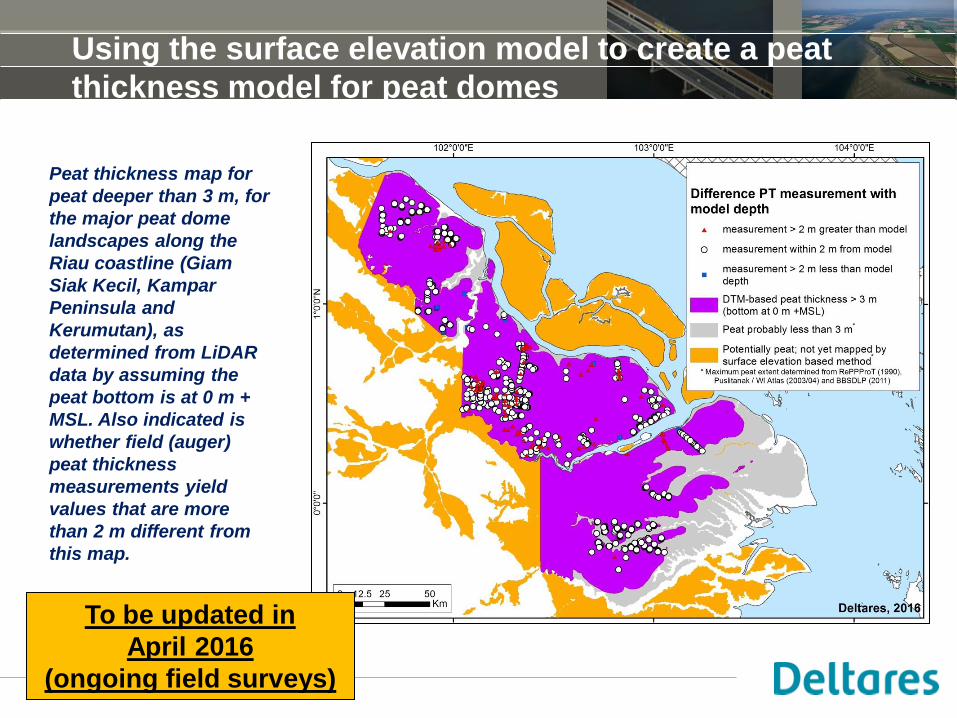
Peat thickness map for
peat deeper than 3 m, for
the major peat dome
landscapes along the
Riau coastline (Giam
Siak Kecil, Kampar
Peninsula and
Kerumutan), as
determined from LiDAR
data by assuming the
peat bottom is at 0 m +
MSL. Also indicated is
whether field (auger)
peat thickness
measurements yield
values that are more
than 2 m different from
this map.
To be updated in
April 2016
(ongoing field surveys)
Page 27
1 januari 2008
Limitations of peat thickness mapping using elevation
models The determination of peat thickness from LiDAR based elevation models has been
shown to work very well in areas where the peat surface is clearly dome-shaped.
However, the method does have the following limitations:
1. In some areas, the peat surface is not dome shaped, either naturally or because much peat was
already lost after drainage in recent decades. In such areas the peat is often shallow and the
relation between peat surface and peat thickness is less clear.
2. In other areas, especially further inland, the bottom of the peat is not near MSL and sometimes
not flat, as the peat has developed over a pre-existing landscape that was not a river floodplain or
coastal mangrove. In inland areas, too, the peat is often shallower.
3. In such areas as identified under [1] and [2], often areas with shallow peat, peat thickness
mapping using LiDAR is not accurate and other methods (especially ground augering) are required.
For Sumatra, we estimate this area to be in the order of 20-30% of the total peat area. Therefore,
we refer to the LiDAR based method as Coastal Peat Dome Mapping, rather than full Peatland
Mapping. We do not think that one single method can suffice to accurately map all peatland, in all
landscape settings and under all land uses. The LiDAR based method is therefore a contribution to
a set of methods that jointly can be applied to map all peatland, but it can not be the only method to
map all peatland.
A further limitation of elevation models derived from ‘strip’ LiDAR (i.e. not full coverage)
is that they are meant principally to identify patterns at the larger landscape scale. For
applications that require detailed elevation data, such as detailed water management
design in plantations with complex morphology due to surface subsidence, additional
full coverage LiDAR data may be required.
Page 28
1 januari 2008
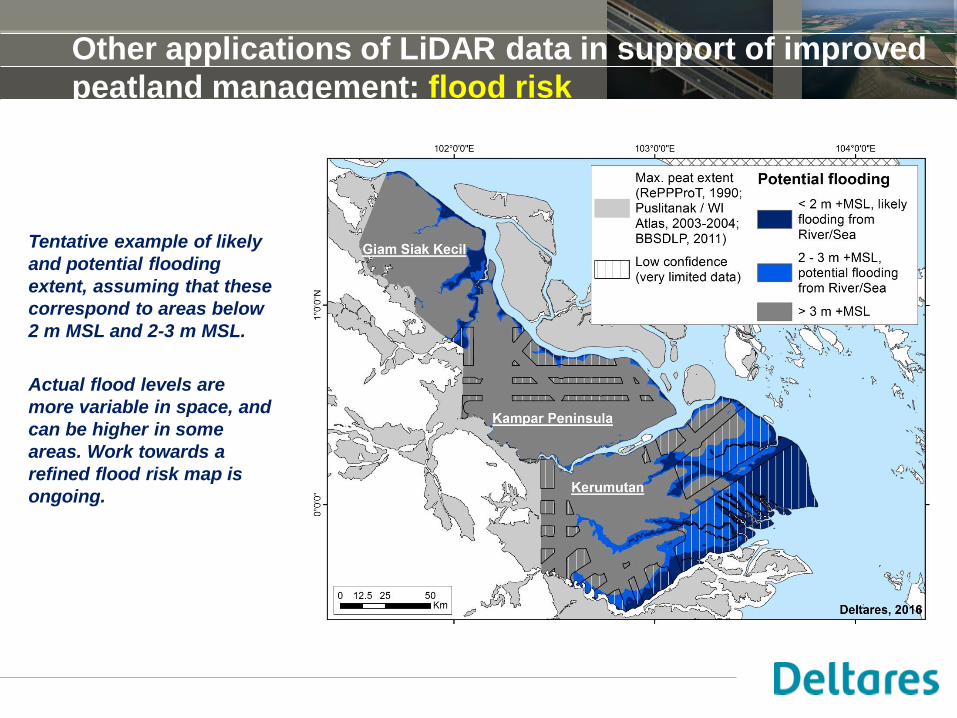
Other applications of LiDAR data in support of improved
peatland management: flood risk
Tentative example of likely
and potential flooding
extent, assuming that these
correspond to areas below
2 m MSL and 2-3 m MSL.
Actual flood levels are
more variable in space, and
can be higher in some
areas. Work towards a
refined flood risk map is
ongoing.
Page 29
1 januari 2008
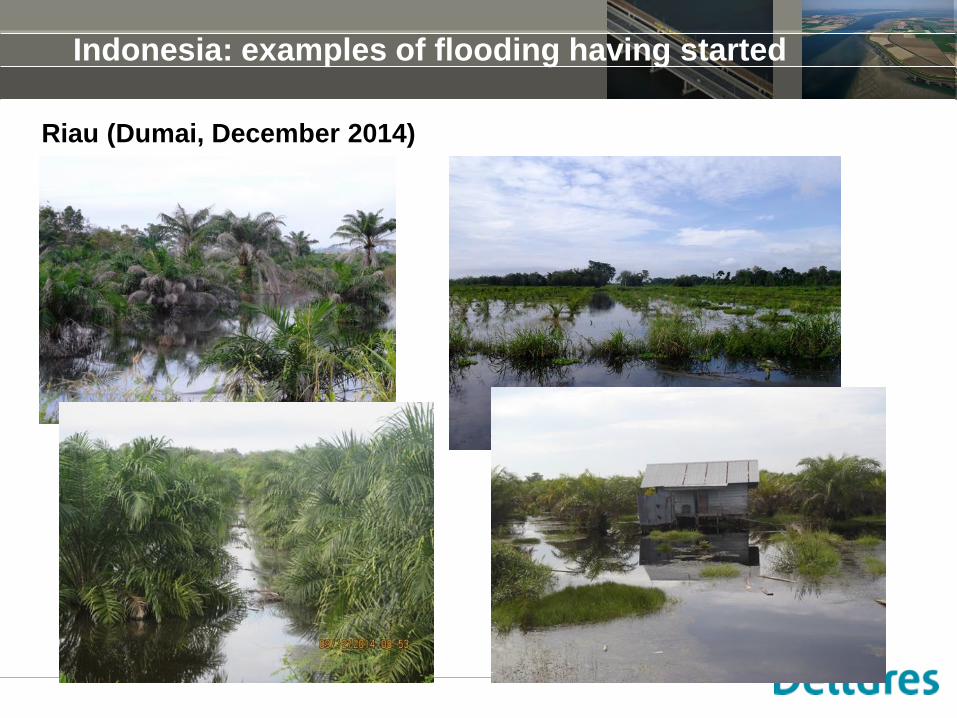
Riau (Dumai, December 2014)
Indonesia: examples of flooding having started
Page 30
1 januari 2008
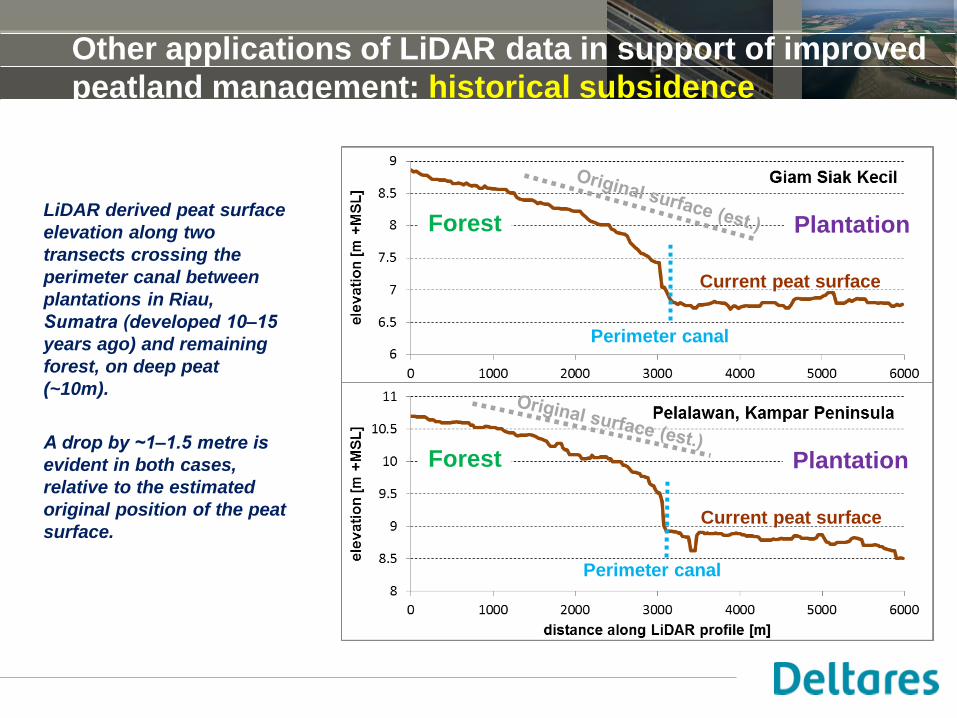
Other applications of LiDAR data in support of improved
peatland management: historical subsidence
LiDAR derived peat surface
elevation along two
transects crossing the
perimeter canal between
plantations in Riau,
Sumatra (developed 10‒15
years ago) and remaining
forest, on deep peat
(~10m).
A drop by ~1‒1.5 metre is
evident in both cases,
relative to the estimated
original position of the peat
surface.
Forest
Forest Plantation
Plantation
Perimeter canal
Perimeter canal
Current peat surface
Current peat surface
Page 31
1 januari 2008
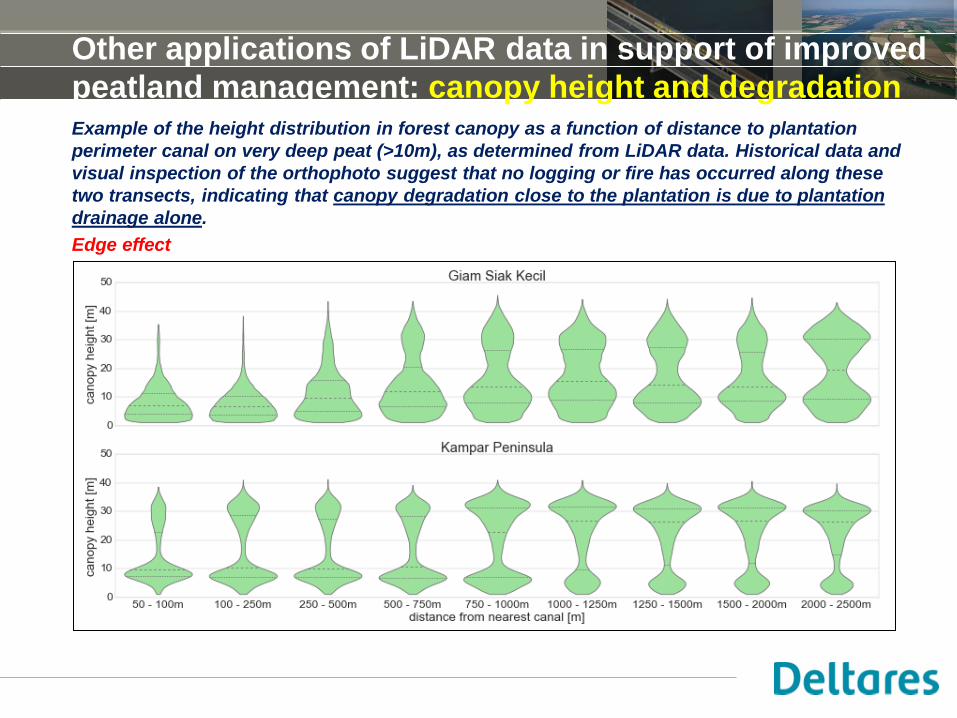
Other applications of LiDAR data in support of improved
peatland management: canopy height and degradation Example of the height distribution in forest canopy as a function of distance to plantation
perimeter canal on very deep peat (>10m), as determined from LiDAR data. Historical data and
visual inspection of the orthophoto suggest that no logging or fire has occurred along these
two transects, indicating that canopy degradation close to the plantation is due to plantation
drainage alone.
Edge effect
Page 32
1 januari 2008
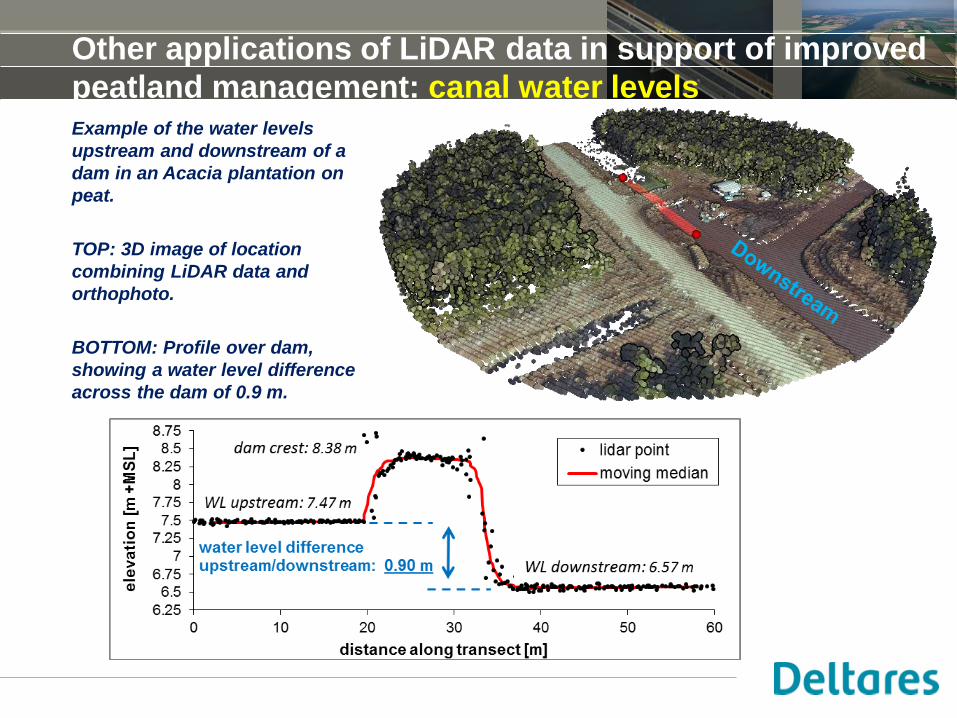
Other applications of LiDAR data in support of improved
peatland management: canal water levels Example of the water levels
upstream and downstream of a
dam in an Acacia plantation on
peat.
TOP: 3D image of location
combining LiDAR data and
orthophoto.
BOTTOM: Profile over dam,
showing a water level difference
across the dam of 0.9 m.
Page 33
1 januari 2008
Summary
Deltares, with partners in several projects, is pioneering the use of large-scale but
cost-effective LiDAR data collection in coastal lowlands, for spatial planning,
management of peatlands and modelling of flood risks.
We are applying new methods in Indonesia that reduce LiDAR cost by almost tenfold
(by not flying full coverage) while still yielding elevation models that are accurate
enough (90% within 0.5 m) for the purpose of landscape scale assessments of flood
risk, peat thickness and related parameters.
Peat thickness mapping applying this data is most accurate in peat domes where peat
thickness is over 3 metres; however for the lowest lying areas with shallow peat other
ground-based methods will be required for peat mapping.
Apart from information on surface elevation, landscape morphology and peat thickness
as determined from surface elevation models, LiDAR data may also be used for
measuring and monitoring flood risk, subsidence rates, degradation/growth conditions
in forest and plantations, and water levels in canals.
New projects are now being defined that will aim to create elevation models for
all coastal peat domes in Sumatra and Kalimantan.
Page 34
1 januari 2008
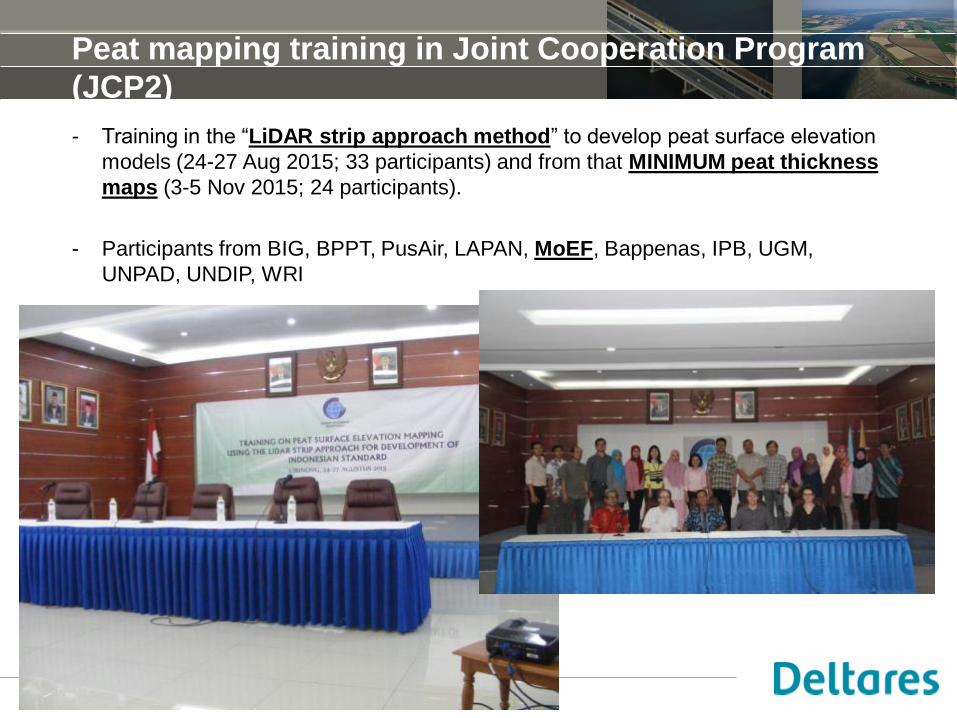
Peat mapping training in Joint Cooperation Program
(JCP2)
- Training in the “LiDAR strip approach method” to develop peat surface elevation
models (24-27 Aug 2015; 33 participants) and from that MINIMUM peat thickness
maps (3-5 Nov 2015; 24 participants).
- Participants from BIG, BPPT, PusAir, LAPAN, MoEF, Bappenas, IPB, UGM,
UNPAD, UNDIP, WRI
Page 35
1 januari 2008
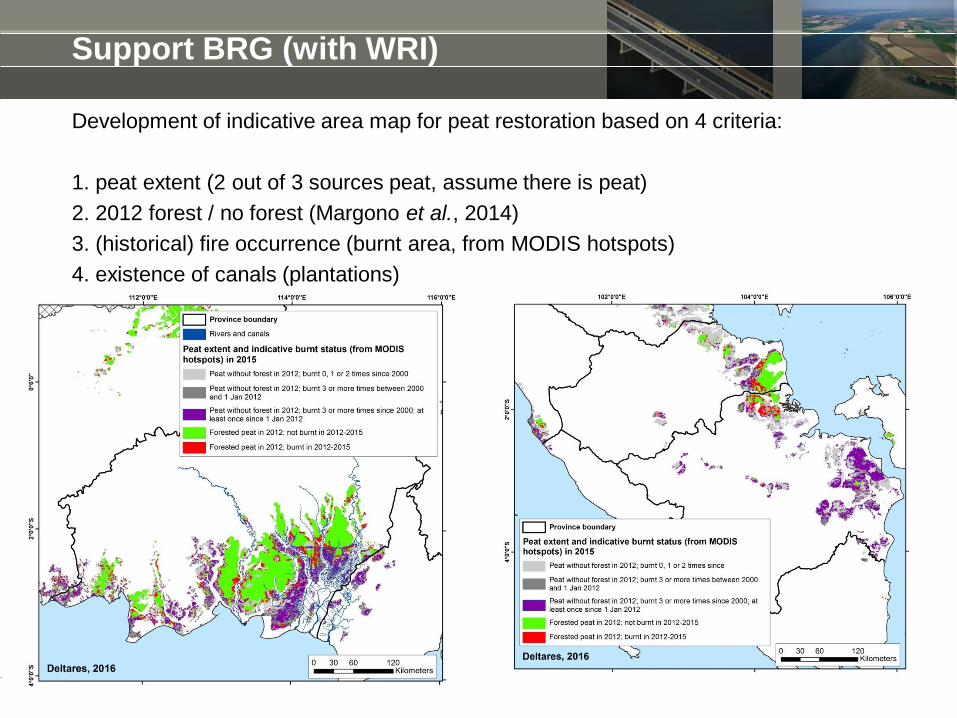
Support BRG (with WRI)
Development of indicative area map for peat restoration based on 4 criteria:
1. peat extent (2 out of 3 sources peat, assume there is peat)
2. 2012 forest / no forest (Margono et al., 2014)
3. (historical) fire occurrence (burnt area, from MODIS hotspots)
4. existence of canals (plantations)
Page 36
Terima kasih!
Semua jelas??? Any
questions???