The use of macroscopic modelling of intermetallic phases in aluminium alloys in the study of ferricyanide accelerated chromate conversion coatings L. Juffs a , A.E. Hughes b, * , S. Furman c , P.J.K. Paterson a a Department of Applied Physics, Royal Melbourne Institute of Technology, 124 La Trobe Street, Melbourne 3000, Australia b CSIRO Manufacturing Science and Technology, Private Bag 33, Clayton South MDC, Clayton, Victoria 3169, Australia c CSIRO Building Construction and Engineering, Highett Laboratories, P.O. Box 56, Highett, Victoria 3190, Australia Received 5 March 2001; accepted 28 October 2001 Abstract Intermetallic (IM) second phases of FeAl 3 , Cu 2 FeAl 7 , and CuAl 2 , were coupled to alu- minium for the macroscopic study of the deposition of chromate conversion coatings. Characterisation of the coating deposition was done using X-ray photoelectron spectroscopy, Rutherford backscattering spectroscopy, Auger electron spectroscopy, scanning electron mi- croscopy with X-ray analysis, and Fourier transform infrared spectroscopy. The coatings covering the IM phases were only one-tenth the thickness of the matrix, and contained higher levels of F, Al, and O. Cr, O, Fe, and N, indicative of a chromate conversion coating, were detected over the matrix. Over IM phases, decomposition of [Fe(CN) 6 ] 3=4, and fluoride ion attack were found to be responsible for reduced rates of deposition. Ó 2002 Elsevier Science Ltd. All rights reserved. Keywords: Chromate; Conversion coatings; Surface analysis; Intermetallic phases; Aluminium alloys; CuAl 2 ; Cu 2 FeAl 7 ; FeAl 3 www.elsevier.com/locate/corsci Corrosion Science 44 (2002) 1755–1781 * Corresponding author. Tel.: +61-3-95452777; fax: +61-3-95441128. E-mail address: [email protected] (A.E. Hughes). 0010-938X/02/$ - see front matter Ó 2002 Elsevier Science Ltd. All rights reserved. PII:S0010-938X(01)00181-0
Transcript
The use of macroscopic modelling ofintermetallic phases in aluminium alloys in
the study of ferricyanide acceleratedchromate conversion coatings
L. Juffs a, A.E. Hughes b,*, S. Furman c, P.J.K. Paterson a
a Department of Applied Physics, Royal Melbourne Institute of Technology, 124 La Trobe Street,
Melbourne 3000, Australiab CSIRO Manufacturing Science and Technology, Private Bag 33, Clayton South MDC, Clayton,
Victoria 3169, Australiac CSIRO Building Construction and Engineering, Highett Laboratories, P.O. Box 56, Highett,
Victoria 3190, Australia
Received 5 March 2001; accepted 28 October 2001
Abstract
Intermetallic (IM) second phases of FeAl3, Cu2FeAl7, and CuAl2, were coupled to alu-
minium for the macroscopic study of the deposition of chromate conversion coatings.
Characterisation of the coating deposition was done using X-ray photoelectron spectroscopy,
Rutherford backscattering spectroscopy, Auger electron spectroscopy, scanning electron mi-
croscopy with X-ray analysis, and Fourier transform infrared spectroscopy. The coatings
covering the IM phases were only one-tenth the thickness of the matrix, and contained higher
levels of F, Al, and O. Cr, O, Fe, and N, indicative of a chromate conversion coating, were
detected over the matrix. Over IM phases, decomposition of [Fe(CN)6]3�=4�, and fluoride ion
attack were found to be responsible for reduced rates of deposition. � 2002 Elsevier Science
0010-938X/02/$ - see front matter � 2002 Elsevier Science Ltd. All rights reserved.
PII: S0010-938X(01 )00181-0
1. Introduction
Aluminium alloys have complex variations in surface compositions due to thepresence of precipitated, secondary phase, intermetallic (IM) particles. These parti-cles come in a range of sizes from constituent particles (generally >1 lm), disperoids(0:01–0:1 lm) to hardening precipitates (<0.01 lm). The large IM (constituent)particles are important to consider when localised corrosion or the deposition ofsurface coatings is being investigated. The composition of the IM particles deter-mines the electrochemical nature, and thus a particle may be either cathodic oranodic to the alloy [1–3]. The presence of IM particles will cause lateral variationsin surface potential [4].Microscopic second phase IM particles are difficult to analyse individually, par-
ticularly when they are masked by the presence of a deposited coating. The use ofEDS [3–7], TEM [7–9] as well as surface sensitive techniques like Auger electronspectroscopy (AES) [10,14], have been applied to the study of microscopic phases.More recently, Raman and Fourier transform infrared spectroscopy (FTIR) havebeen used to study conversion coatings [15,16] and with some success at analysingdeposition onto IM phases [16]. Techniques such as X-ray photoelectron spectros-copy (XPS), however, which give useful chemical state information, do not have thespatial resolution to look at individual intermetallics [5,12–14]. Thus, microscopicparticles in alloys remain difficult to analyse individually by physicochemical andelectrochemical means. Consequently in this study, macroscopic IM phases havebeen manufactured and coupled to aluminium to simulate the reactions that occuron the microscopic IM phase/matrix couples. The macroscopic couples allow the useof XPS and Rutherford backscattering spectroscopy (RBS) to study surface com-position and oxidation states.Large-scale models of IM particles therefore provide a useful means to interpret
results from studies of microscopic galvanic couples. Macroscopic models usingsimple bimetallic couples in their construction (Al/Cu [6] and Cu/Sn [17]) have beenused previously to represent the galvanic coupling of materials. For example, FeAl3,Al6MnFe, and Al6Mn intermetallics have been used to study the effects of alkalineetching [18]. McGovern et al. [16] have studied chromate conversion coating depo-sition onto AlxCuyMgz.The macroscopic couples used in this study represent a single IM phase, to rep-
resent the IM particle, surrounded by a matrix of aluminium. These couples,therefore, are models for IM phases in aluminium alloys. The IM phases includeFeAl3, Cu2FeAl7, and CuAl2, all known to be cathodic to the aluminium matrix.CuAl2 is typically found in binary Al–Cu alloys or 2XXX series alloys with a low Mgcontent [1]. 2024-T3 sheet may contain some CuAl2, however, the presence of Mgmeans that CuMgAl2 is the predominant hardening precipitate and dispersoidparticle. Alloying elements mixed with Fe-impurity lead to a complex multiphasestructure, including the cathodic Cu2FeAl7 IM phase [3]. FeAl3 is a common con-stituent in 5005 and 7075 [1].Deposition of ferricyanide accelerated chromate conversion coating has been
chosen to demonstrate the usefulness of macroscopic couples. There are a large
1756 L. Juffs et al. / Corrosion Science 44 (2002) 1755–1781
number of papers in the literature dealing with the characterisation of depositedchromate conversion coatings. Although most of the previous work was conductedon 1100 (commercially pure aluminium), deposition of chromate conversion coatingsover the 2024-T3 alloy have also been investigated [5,10,15,16,19,20]. The rate of filmdeposition is greatest over the matrix, followed by copper-containing IM types forIM phases that are cathodic to the matrix. For anodic phases increasing Cu contentof AlxCuyMgz phases resulted in less deposition [16]. Reduced deposition rates havebeen observed over iron IM phases [10]. Various authors have also used electro-chemical techniques to determine the effects of chromate ions on the depositionprocess or for corrosion protection [21–25].Film growth proceeds by direct contact of the solution with the metal surface,
where aluminium oxide on the surface must be thinned to allow electron transferreactions to proceed. Fluorine species have been shown to etch and thin the alu-minium oxide, allowing the solution to contact the aluminium surface [11]. Fluorine-containing species, AlF3 and AlOF, are found to exist in high concentrations at theinterface between the conversion coating and the substrate, with small amountsuniformly distributed throughout [5,13]. The reaction involves the reduction ofCr(VI) to Cr(III) resulting in the deposition of hydrated chromium oxides on thesurface and the oxidation of aluminium metal, so that the overall reaction is de-scribed by Eq. (1) [11]:
As chromate conversion coating growth proceeds, more chromium species aredeposited and the thickness of the coating increases. A limiting thickness is reachedafter several minutes depending on bath chemistry [14].Ferricyanide species, added as accelerators, promote more coating growth, but
the coating still reaches a limiting thickness [5,10,13]. Solutions contain Fe in twochemical states, [Fe(II)(CN)6]
4� and [Fe(III)(CN)6]3� [10]. Treverton originally
proposed that ferricyanide acceleration was due to the competitive adsorptionof either ferri or ferrocyanide complexes (or both) compared to Cr2O
2�7 onto the
surface of the Cr(III) oxide gel that forms during the coating process thus leaving agreater amount of Cr2O
2�7 to react with the surface. More recently, a different picture
of the role of ferricyanide has emerged [15,16]. In this new model, the Fe(II)/Fe(III)couple acts as a catalyst being reduced from Fe(III) to Fe(II) via oxidisation ofAl(0) to Al (III) and oxidised from Fe(II) to Fe(III) via the reduction of Cr(VI) toCr(III).Thus this study aims to elaborate on the mechanism of deposition on both
cathodic IM phases and the anodic matrix. To achieve this aim, IM phaseswere manufactured in rods (5 mm diameter) and coupled with Al 1100 sheath withthe aim of examining the surface chemistry during accelerated conversion coating. Inthis preliminary work, the chromate conversion coatings were characterised usingXPS, RBS, AES, scanning electron microscopy (SEM) with X-ray analysis andFTIR.
L. Juffs et al. / Corrosion Science 44 (2002) 1755–1781 1757
2. Experimental
2.1. Sample preparation
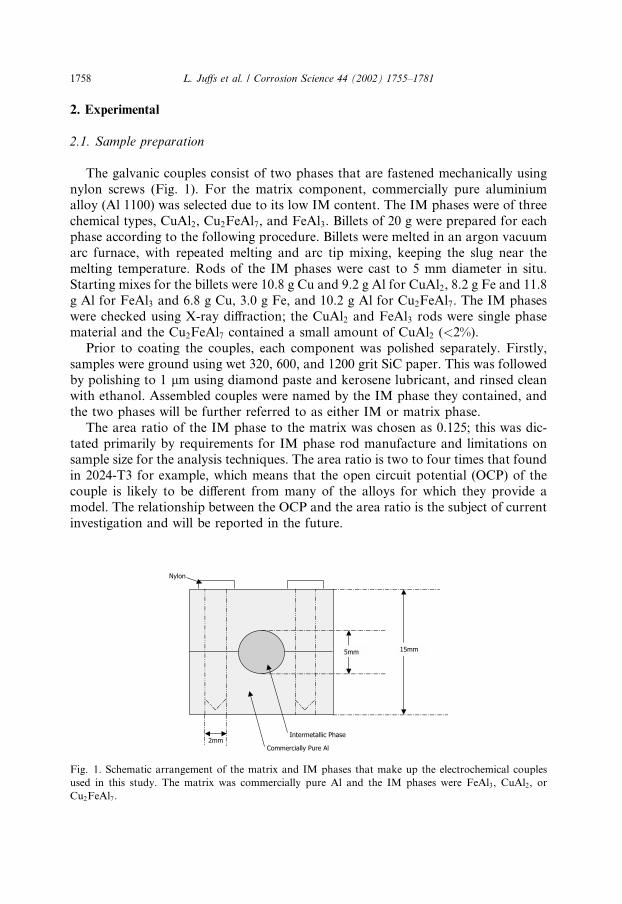
The galvanic couples consist of two phases that are fastened mechanically usingnylon screws (Fig. 1). For the matrix component, commercially pure aluminiumalloy (Al 1100) was selected due to its low IM content. The IM phases were of threechemical types, CuAl2, Cu2FeAl7, and FeAl3. Billets of 20 g were prepared for eachphase according to the following procedure. Billets were melted in an argon vacuumarc furnace, with repeated melting and arc tip mixing, keeping the slug near themelting temperature. Rods of the IM phases were cast to 5 mm diameter in situ.Starting mixes for the billets were 10.8 g Cu and 9.2 g Al for CuAl2, 8.2 g Fe and 11.8g Al for FeAl3 and 6.8 g Cu, 3.0 g Fe, and 10.2 g Al for Cu2FeAl7. The IM phaseswere checked using X-ray diffraction; the CuAl2 and FeAl3 rods were single phasematerial and the Cu2FeAl7 contained a small amount of CuAl2 (<2%).Prior to coating the couples, each component was polished separately. Firstly,
samples were ground using wet 320, 600, and 1200 grit SiC paper. This was followedby polishing to 1 lm using diamond paste and kerosene lubricant, and rinsed cleanwith ethanol. Assembled couples were named by the IM phase they contained, andthe two phases will be further referred to as either IM or matrix phase.The area ratio of the IM phase to the matrix was chosen as 0.125; this was dic-
tated primarily by requirements for IM phase rod manufacture and limitations onsample size for the analysis techniques. The area ratio is two to four times that foundin 2024-T3 for example, which means that the open circuit potential (OCP) of thecouple is likely to be different from many of the alloys for which they provide amodel. The relationship between the OCP and the area ratio is the subject of currentinvestigation and will be reported in the future.
Fig. 1. Schematic arrangement of the matrix and IM phases that make up the electrochemical couples
used in this study. The matrix was commercially pure Al and the IM phases were FeAl3, CuAl2, or
Cu2FeAl7.
1758 L. Juffs et al. / Corrosion Science 44 (2002) 1755–1781
The assembled couples were immersed in chromate solution for 75, 90 and 300 s atroom temperature. The chromate coating solution contained 4 g l�1 CrO3, 0.5 g l
�1
NaF, 1 g l�1 K2Fe(CN)6. All reagents were of analytical quality. During immersionthe solution was slowly agitated. Following the immersion, samples were promptlyrinsed in deionised water and allowed to dry in air.
3. Sample characterisation
3.1. Rutherford backscattering spectroscopy
RBS was performed using a General Ionex Tandem Accelerator using an ionbeam of 2 MeV He2þ at normal incidence. The backscattered particles were collectedat 170� to the incident beam. The spot size of the beam was approximately 4 mm2.The film thickness was determined by simulation modelling using RUMP. The en-ergy axis of each RBS spectrum was calibrated using deposited samples of Al2O3,CeO2, and a polished sample of high purity Cu. Quantification of the RBS intensitieswas done using known scattering cross-sections [26] or software simulations usingSIM subroutines within the RUMP package. The number density of Cr, O, and Fe inthe oxide surface is proportional to the number of counts detected for each peak, sonormalised counts have been calculated for this purpose.
3.2. Auger electron spectroscopy depth profiling
Depth profiles of the coatings were obtained using a Varian Auger Spectrometercontained in a UHV system with a base pressure of 5� 10�10 Torr. The analyseswere carried out with an electron beam energy of 5 keV energy and a beam current of5 lA. The cylindrical mirror analyser was scanned from 30 to 1500 eV for 30 s with amodulation of 5 eV peak to peak and an electron multiplier voltage of 2000 V. Thelock-in amplifier was operated with a sensitivity of 1 ms and a time constant of 125ms. Argon ion sputtering was carried out with a beam energy of 2 keV and beamcurrent of 90 nA. The film interface was taken to be at 50% of the maximum oxygenconcentration. Atomic species quantification was carried out on different spectrausing elemental sensitivity factors measured on the system. The depth scale wascalibrated using the coating depth determined by RBS.
3.3. X-ray photoelectron spectroscopy
The XPS was performed on a VG Scientific Microlab 310F. The unmonochro-mated X-ray source was Mg Ka with an energy of 1253.6 eV, operated at 15 kVexcitation voltage. The spectrometer was calibrated with a sputtered copper(99.999% pure) sample and deposited gold on silicon sample giving Cu 2p3=2, Cu
L. Juffs et al. / Corrosion Science 44 (2002) 1755–1781 1759
(KLL), Au 4f7=2, binding energies of 932.60, 334.8 eV (KE), and 84.06 eV respec-tively. The carbon 1s peak at 285 eV was used to correct binding energies for samplecharging. Samples were dismantled and each phase separately mounted for surfaceanalysis on aluminium stubs using double-sided adhesive conducting carbon tape.The spectral regions of C, O, Al, Cr, N, Fe, and F were scanned on the surface of thecoating.Gaussian/Lorentzian peaks (mixing ratio of 0.3) were fitted, after Shirley back-
ground subtraction, to spectra where the full width at half maximum height was toowide to have physical significance. Peaks fitted included Cr, Fe, O, N, and Al. TheAl 2p photoelectron peak was fitted with two peaks, Al metal at 72.9 eV and alu-minium oxide at 74 eV. Contribution to Al, due to overlap from the Cr 3s and/orCu 3p peaks, at 79 eV was easily separated by peak fitting and subtraction. TheFe 2p3=2 peak was fitted using three components, at 706.7, 708.5, and 709.6 eV. Thesepeaks correspond with Fe metal, Fe2þ and Fe3þ. The Cr 2p3=2 peak was used for Crquantification, with peak fitting of three peaks at 577.3 (Cr3þ in CrOOH), 578.9(Cr3þ in chromium ferricyanide), and 580.3 eV (Cr6þ in chromate) [13]. Both the Feand Cr binding energies are in agreement with previous analyses of acceleratedchromate conversion coatings [13]. Three chemical states of oxygen were evaluatedby peak fitting the O 1s spectra with peaks for oxygen anions (530.9 eV), hydroxidegroups (531.8 eV), and adsorbed waters (533.4 eV). Doublets were observed in theN1s regions, with components at 398 eV and a lesser component at 400 eV. Fordetermination of fluorine levels, the F 1s, at 684.5 eV was collected.
3.4. Scanning electron microscopy
SEM images were collected on a Phillips XL30. X-ray analysis were carried out ona Leica Thermal Field Emission SEM (360FE SEM) on couples mounted withdouble-sided conductive carbon tape. Specimens were imaged at 16 keV, and EDSmaps were obtained on a Link X2-II system. Broad non-background-subtractedEDS intensity maps were recorded to show the distribution of deposition for eachphase for elements, Fe, Cr, Cu, Al, K, O, and F. EDS spectra were used to confirmthat intensity variations were due to the presence of the respective elements ratherthan changes in the background intensity. Both Be and ultra-thin windows were usedfor elemental detection.
3.5. Fourier transform infrared spectroscopy
All FTIR spectra were collected using a Bruker Equinox 55 microscope with adiffuse reflectance accessory. Spectra were obtained by averaging 128 spectra with aresolution of 4 cm�1 and subtracting the background using Kubelka Munck method.A spectrum obtained from polished aluminium was used as the background spec-trum for both the matrix and an unchromated sample of the IM phase was used as abackground for the IM surfaces.
1760 L. Juffs et al. / Corrosion Science 44 (2002) 1755–1781
4. Results
4.1. Untreated couples
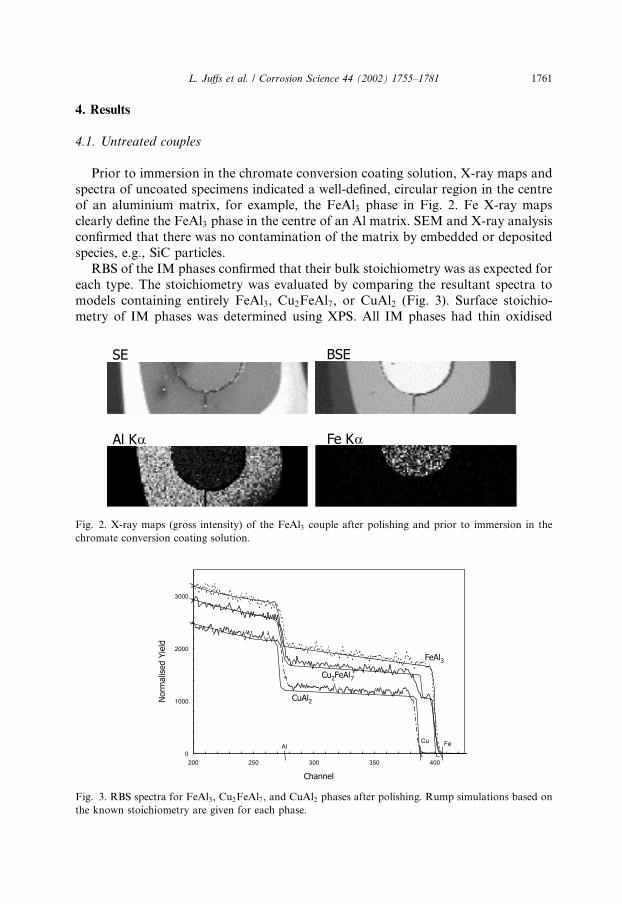
Prior to immersion in the chromate conversion coating solution, X-ray maps andspectra of uncoated specimens indicated a well-defined, circular region in the centreof an aluminium matrix, for example, the FeAl3 phase in Fig. 2. Fe X-ray mapsclearly define the FeAl3 phase in the centre of an Al matrix. SEM and X-ray analysisconfirmed that there was no contamination of the matrix by embedded or depositedspecies, e.g., SiC particles.RBS of the IM phases confirmed that their bulk stoichiometry was as expected for
each type. The stoichiometry was evaluated by comparing the resultant spectra tomodels containing entirely FeAl3, Cu2FeAl7, or CuAl2 (Fig. 3). Surface stoichio-metry of IM phases was determined using XPS. All IM phases had thin oxidised
Fig. 2. X-ray maps (gross intensity) of the FeAl3 couple after polishing and prior to immersion in the
chromate conversion coating solution.
Fig. 3. RBS spectra for FeAl3, Cu2FeAl7, and CuAl2 phases after polishing. Rump simulations based on
the known stoichiometry are given for each phase.
L. Juffs et al. / Corrosion Science 44 (2002) 1755–1781 1761
surface layers which contained carbon. For the FeAl3, Cu2FeAl7, and CuAl2 phases,the surface stoichiometries were FeAl2:2O1:7, Cu2:3FeAl14:5O4:3 and CuAl4:3O0:9 re-spectively. Thus, polishing resulted in Fe enrichment for FeAl3 whereas the Cu-containing IM phases had Al enrichment. Matrix phases prior to immersiondisplayed Al and O with some surface C contamination which could have arisenfrom the kerosene polishing medium or ethanol rinse. The RBS Al/O ratio was 0.7indicating that there was a thin Al oxide over the Al metal.
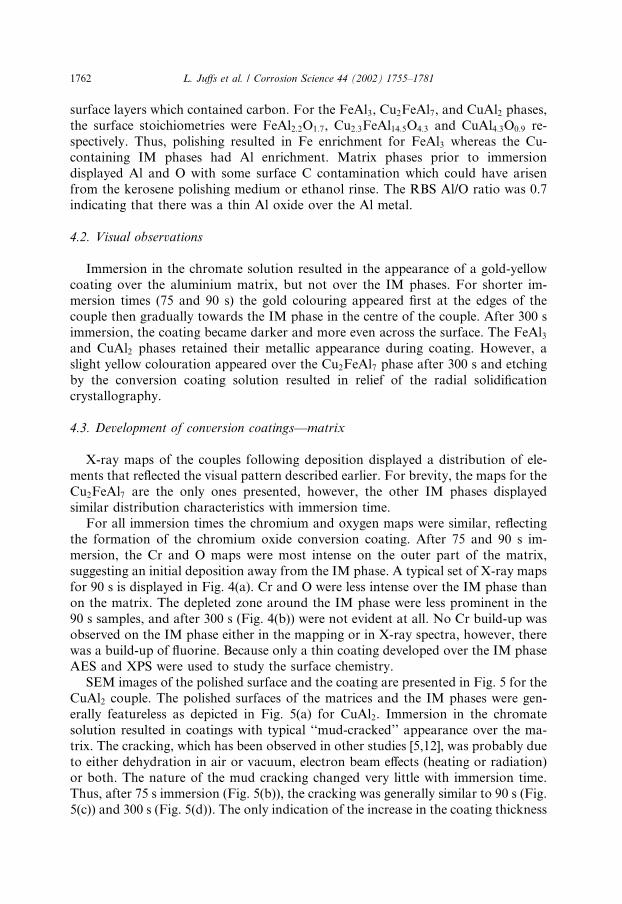
4.2. Visual observations
Immersion in the chromate solution resulted in the appearance of a gold-yellowcoating over the aluminium matrix, but not over the IM phases. For shorter im-mersion times (75 and 90 s) the gold colouring appeared first at the edges of thecouple then gradually towards the IM phase in the centre of the couple. After 300 simmersion, the coating became darker and more even across the surface. The FeAl3and CuAl2 phases retained their metallic appearance during coating. However, aslight yellow colouration appeared over the Cu2FeAl7 phase after 300 s and etchingby the conversion coating solution resulted in relief of the radial solidificationcrystallography.
4.3. Development of conversion coatings––matrix
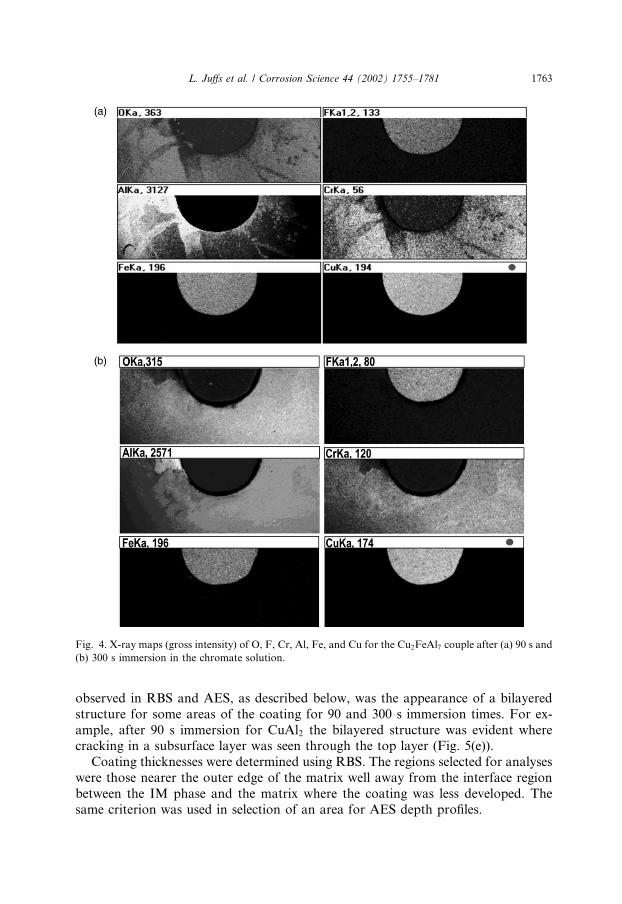
X-ray maps of the couples following deposition displayed a distribution of ele-ments that reflected the visual pattern described earlier. For brevity, the maps for theCu2FeAl7 are the only ones presented, however, the other IM phases displayedsimilar distribution characteristics with immersion time.For all immersion times the chromium and oxygen maps were similar, reflecting
the formation of the chromium oxide conversion coating. After 75 and 90 s im-mersion, the Cr and O maps were most intense on the outer part of the matrix,suggesting an initial deposition away from the IM phase. A typical set of X-ray mapsfor 90 s is displayed in Fig. 4(a). Cr and O were less intense over the IM phase thanon the matrix. The depleted zone around the IM phase were less prominent in the90 s samples, and after 300 s (Fig. 4(b)) were not evident at all. No Cr build-up wasobserved on the IM phase either in the mapping or in X-ray spectra, however, therewas a build-up of fluorine. Because only a thin coating developed over the IM phaseAES and XPS were used to study the surface chemistry.SEM images of the polished surface and the coating are presented in Fig. 5 for the
CuAl2 couple. The polished surfaces of the matrices and the IM phases were gen-erally featureless as depicted in Fig. 5(a) for CuAl2. Immersion in the chromatesolution resulted in coatings with typical ‘‘mud-cracked’’ appearance over the ma-trix. The cracking, which has been observed in other studies [5,12], was probably dueto either dehydration in air or vacuum, electron beam effects (heating or radiation)or both. The nature of the mud cracking changed very little with immersion time.Thus, after 75 s immersion (Fig. 5(b)), the cracking was generally similar to 90 s (Fig.5(c)) and 300 s (Fig. 5(d)). The only indication of the increase in the coating thickness
1762 L. Juffs et al. / Corrosion Science 44 (2002) 1755–1781
observed in RBS and AES, as described below, was the appearance of a bilayeredstructure for some areas of the coating for 90 and 300 s immersion times. For ex-ample, after 90 s immersion for CuAl2 the bilayered structure was evident wherecracking in a subsurface layer was seen through the top layer (Fig. 5(e)).Coating thicknesses were determined using RBS. The regions selected for analyses
were those nearer the outer edge of the matrix well away from the interface regionbetween the IM phase and the matrix where the coating was less developed. Thesame criterion was used in selection of an area for AES depth profiles.
Fig. 4. X-ray maps (gross intensity) of O, F, Cr, Al, Fe, and Cu for the Cu2FeAl7 couple after (a) 90 s and
(b) 300 s immersion in the chromate solution.
L. Juffs et al. / Corrosion Science 44 (2002) 1755–1781 1763
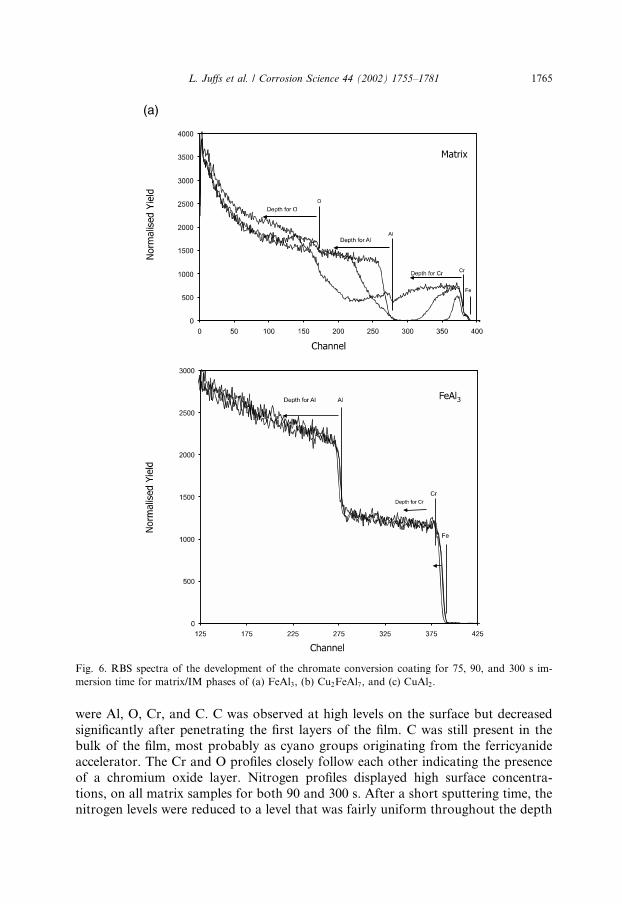
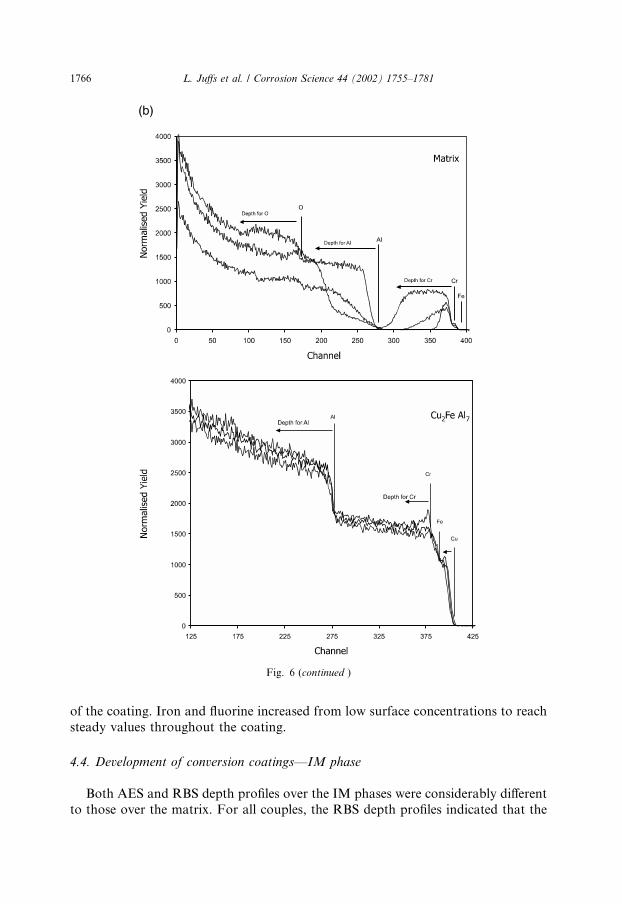
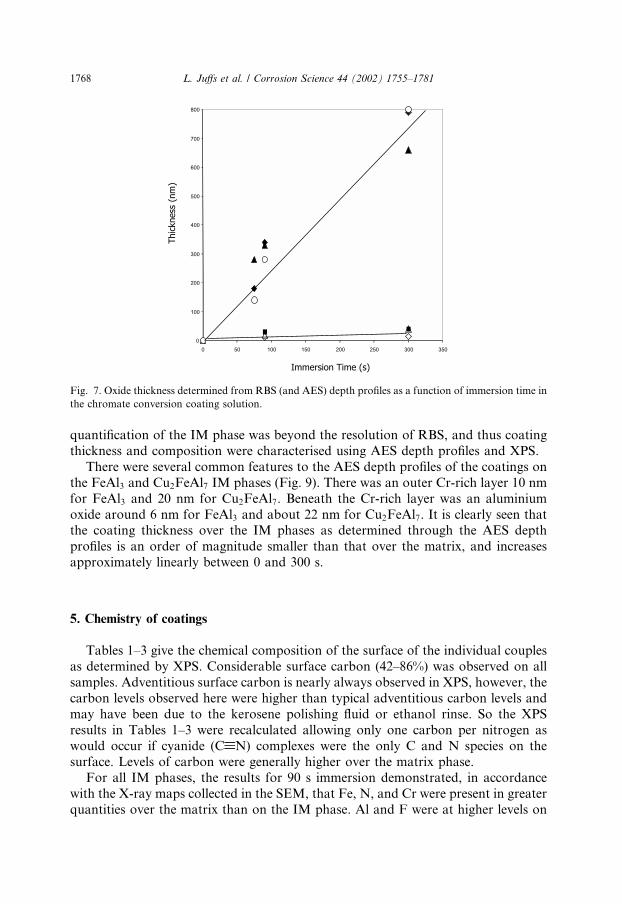
RBS spectra for all three couples as a function of immersion time are depicted inFig. 6. The presence of the conversion coating on the Al matrix was indicated by thedetection of the elements O, Cr, and Al which are labelled in the diagrams. The depthprofile of an element is given by the distribution at channel numbers below the el-emental position that indicates where the element would fall if it was at the surface.The build-up of the conversion coating over the matrix of all three couples wasevident from the Cr region (from channel 380 and below). For 75 s immersion, theCr profile was narrow but broadened after 90 s immersion and was a large flatplateau at 300 s. The coating thicknesses, determined through the width of the Crpeak, are displayed in Fig. 7. The coating thickness after 300 s immersion weretypically 660–800 nm.Typical Auger depth profiles for the matrix of the FeAl3, Cu2FeAl7, and CuAl2
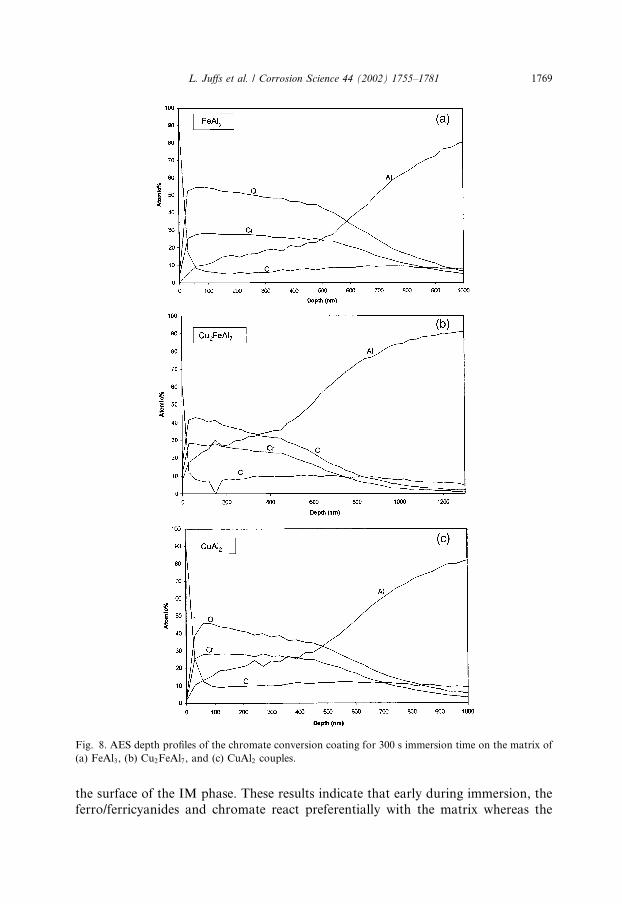
couples after 300 s immersion are depicted in Fig. 8(a)–(c). The prominent species
Fig. 5. SEM images of the matrix surface of CuAl2 after (a) polishing, (b) 75, (c) 90 and (d) 300 s im-
mersion in the chromate solution and (e) the surface of the matrix for the CuAl2 couple after 90 s im-
mersion, showing the bilayered structure.
1764 L. Juffs et al. / Corrosion Science 44 (2002) 1755–1781
were Al, O, Cr, and C. C was observed at high levels on the surface but decreasedsignificantly after penetrating the first layers of the film. C was still present in thebulk of the film, most probably as cyano groups originating from the ferricyanideaccelerator. The Cr and O profiles closely follow each other indicating the presenceof a chromium oxide layer. Nitrogen profiles displayed high surface concentra-tions, on all matrix samples for both 90 and 300 s. After a short sputtering time, thenitrogen levels were reduced to a level that was fairly uniform throughout the depth
Fig. 6. RBS spectra of the development of the chromate conversion coating for 75, 90, and 300 s im-
mersion time for matrix/IM phases of (a) FeAl3, (b) Cu2FeAl7, and (c) CuAl2.
L. Juffs et al. / Corrosion Science 44 (2002) 1755–1781 1765
of the coating. Iron and fluorine increased from low surface concentrations to reachsteady values throughout the coating.
4.4. Development of conversion coatings––IM phase
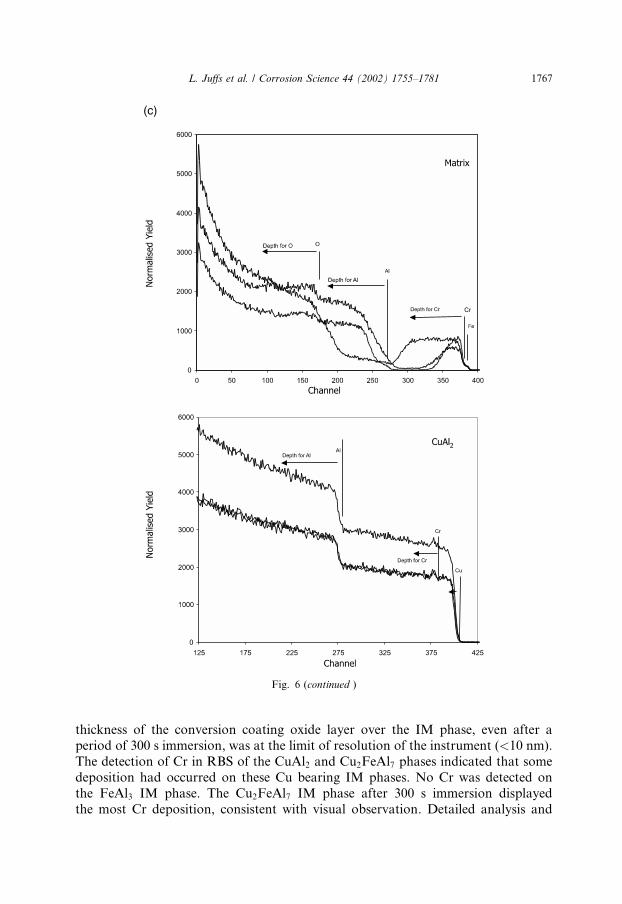
Both AES and RBS depth profiles over the IM phases were considerably differentto those over the matrix. For all couples, the RBS depth profiles indicated that the
Fig. 6 (continued )
1766 L. Juffs et al. / Corrosion Science 44 (2002) 1755–1781
thickness of the conversion coating oxide layer over the IM phase, even after aperiod of 300 s immersion, was at the limit of resolution of the instrument (<10 nm).The detection of Cr in RBS of the CuAl2 and Cu2FeAl7 phases indicated that somedeposition had occurred on these Cu bearing IM phases. No Cr was detected onthe FeAl3 IM phase. The Cu2FeAl7 IM phase after 300 s immersion displayedthe most Cr deposition, consistent with visual observation. Detailed analysis and
Fig. 6 (continued )
L. Juffs et al. / Corrosion Science 44 (2002) 1755–1781 1767
quantification of the IM phase was beyond the resolution of RBS, and thus coatingthickness and composition were characterised using AES depth profiles and XPS.There were several common features to the AES depth profiles of the coatings on
the FeAl3 and Cu2FeAl7 IM phases (Fig. 9). There was an outer Cr-rich layer 10 nmfor FeAl3 and 20 nm for Cu2FeAl7. Beneath the Cr-rich layer was an aluminiumoxide around 6 nm for FeAl3 and about 22 nm for Cu2FeAl7. It is clearly seen thatthe coating thickness over the IM phases as determined through the AES depthprofiles is an order of magnitude smaller than that over the matrix, and increasesapproximately linearly between 0 and 300 s.
5. Chemistry of coatings
Tables 1–3 give the chemical composition of the surface of the individual couplesas determined by XPS. Considerable surface carbon (42–86%) was observed on allsamples. Adventitious surface carbon is nearly always observed in XPS, however, thecarbon levels observed here were higher than typical adventitious carbon levels andmay have been due to the kerosene polishing fluid or ethanol rinse. So the XPSresults in Tables 1–3 were recalculated allowing only one carbon per nitrogen aswould occur if cyanide (CBN) complexes were the only C and N species on thesurface. Levels of carbon were generally higher over the matrix phase.For all IM phases, the results for 90 s immersion demonstrated, in accordance
with the X-ray maps collected in the SEM, that Fe, N, and Cr were present in greaterquantities over the matrix than on the IM phase. Al and F were at higher levels on
Fig. 7. Oxide thickness determined from RBS (and AES) depth profiles as a function of immersion time in
the chromate conversion coating solution.
1768 L. Juffs et al. / Corrosion Science 44 (2002) 1755–1781
the surface of the IM phase. These results indicate that early during immersion, theferro/ferricyanides and chromate react preferentially with the matrix whereas the
Fig. 8. AES depth profiles of the chromate conversion coating for 300 s immersion time on the matrix of
(a) FeAl3, (b) Cu2FeAl7, and (c) CuAl2 couples.
L. Juffs et al. / Corrosion Science 44 (2002) 1755–1781 1769
fluoride reacts with the intermetallic. With 300 s immersion the levels of all elements,with the exception of Al, were similar over the IM phase and the matrix. Apartfrom the matrix of FeAl3, the at.% of Al was reduced with immersion time for both
Fig. 9. AES depth profiles of the chromate conversion coating for 300 s immersion time on the inter-
metallic of (a) FeAl3, (b) CuAl2, and (c) Cu2FeAl7 couples.
1770 L. Juffs et al. / Corrosion Science 44 (2002) 1755–1781
the IM phase and the matrix, confirming that during deposition, the substrate wasbeing covered.Al metal and oxide peaks were detected using XPS over the IM phases indicating
thin oxide layers [27]. The matrix phases had no detectable levels of Al metal. For theFeAl3 phase high levels of Al metal were detected: 17% after 90 s and 23% after 300 s.These percentages correspond to oxide thicknesses of approximately 6–7 nm [27].The Cu2FeAl7 and CuAl2 phases had low aluminium metal levels. After 90 s, bothcouples had small amounts (�5%) of Al metal over each phase. After 300 s,
Table 1
XPS composition of the surface of FeAl3 (at.%)
Immersion time (s) Fe F Cr O N C Al
Matrix
0 – – – 39.3 – 33.8 26.9
90 2.3 0.5 10.4 43.0 20.6 20.6 2.6
300 1.3 1.4 7.2 47.7 14.8 14.8 12.8
FeAl3 phase0 20.5 – – 33.8 – – 45.7
90 1.1 3.6 4.6 50.0 7.1 7.1 17.1
300 1.3 4.0 7.0 49.1 11.7 11.7 15.3
Table 2
XPS composition of the surface of Cu2FeAl7 (at.%)
Immersion time (s) Fe F Cr O N C Al Cu
Matrix
0 – – – 39.3 – 33.8 26.9 –
90 2.5 1.6 9.3 40.0 20.3 20.3 6.0 –
300 1.2 3.9 8.6 57.5 13.3 13.3 2.5 –
Cu2FeAl7 phase0 4.5 – – 19.5 – – 65.6 10.4
90 1.0 3.9 5.9 51.3 3.8 3.8 30.0 0.4
300 1.6 3.3 8.4 47.1 14.6 14.6 10.4 –
Table 3
XPS composition of the surface of CuAl2 (at.%)
Immersion time (s) Fe F Cr O N C Al Cu
Matrix
0 – – – 39.3 – 33.8 26.9 –
90 2.3 0 9.7 38.7 19.8 19.8 9.7 –
300 1.3 2.5 8.3 47.6 17.0 17.0 6.3 –
CuAl2 phase0 – – – 14.3 – – 69.6 16.1
90 1.2 2.0 6.2 45.9 14.3 14.3 16.1 –
300 1.3 2.5 8.3 47.6 17.0 17.0 6.3 –
L. Juffs et al. / Corrosion Science 44 (2002) 1755–1781 1771
Cu2FeAl7 displayed no metallic Al, whereas CuAl2 maintained a low level, less than5%. When combined with depths determined by AES, which were generally a fewhundred nanometres, these results suggest that there may be considerable variationin oxide thickness over the IM phase.The at.% F was greater after 90 s immersion on the matrix than after 300 s im-
mersion suggesting the F� ions were involved in initially activating the surface butmay have less of a role to play at longer immersion times. On the IM phases thefluoride levels were much higher after 90 s immersion than on the matrix. These highlevels did not change much with longer immersion times. The higher levels of F� onthe IM phase and thin aluminium oxides suggest that surface oxide on areas of theIM phase were continually undergoing attack and probable dissolution.The Fe, N, and C levels present on the matrix and IM phases may be chemically
inter-related due to the presence of K3Fe(CN)6 in the coating solution. One com-plicating factor in determining the role of [Fe(CN)6]
3� during conversion coating isthe presence of Fe in two of the IM phases. However, comparison of the at.% Fe forthe two Fe-containing couples with the CuAl2 couple revealed almost identical levelsas a function of immersion time. Specifically, after 90 s immersion the matrix Felevels were between 2.3 and 2.5 at.% whereas on the IM phase they were between 1and 1.2 at %. After 300 s immersion the Fe levels were between 1.2 and 1.6 at.% forall surfaces. These results suggest that the Fe detected using XPS is coming from the[Fe(CN)6]
3�=4� complex and not from the Fe-containing couples. Further, the Febinding energies corresponded well with reported values for ferrocyanide and ferri-cyanide complexes, respectively [13], although this assignment cannot be treated asunique.Nitrogen was detected on all coated specimens and, as noted in the experimental
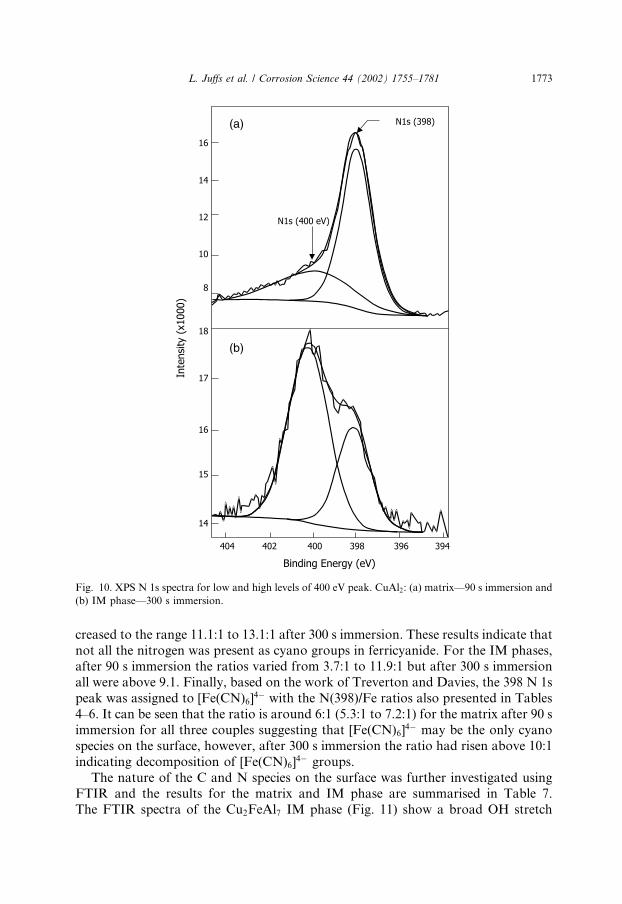
section, the N1s spectra were fitted with two peaks falling around 398 and 400 eV(Fig. 10). The presence of the former peak is consistent with ferrocyanide as assignedby Treverton and Davies [13]. The latter peak may be either due to the presence ofamine groups, since Hughes et al. [5] found that NHx groups fall above 399 eV,Berlin green, since this polymeric species has been reported in chromate conversioncoatings, or adsorbed cyano species. Amine groups might occur as a result of thedecomposition of the ferri/ferrocyanide during reaction at the surface or as a resultof decomposition under the X-ray source during XPS. However, since amine groupswere not observed using FTIR either on a freshly prepared coating or after XPSexperiments, it seems that the peak around 400 eV more likely arises from N insurface cyano groups.The amount of N present over the matrix was significantly greater than over the
IM phase. The quantity of N decreased over the matrix with time, but increased overthe IM phase of all three couples. Tables 4–6 indicate the relative percentages of eachcomponent for the matrix and IM phase of all couples. The peak at �398 eV wasgenerally the predominant species and constituted around 100% of the total N 1ssignal over the matrix after 300 s immersion. The 398 peak for the IM phases in-tensified in going from 90 s immersion to 300 s immersion, except for CuAl2. Alsoincluded in Tables 4–6 are the N/Fe ratios which, for ferricyanide, should be 6. Onthe matrix this ratio varied in the range 8.1:1 to 9.1:1 after 90 s immersion and in-
1772 L. Juffs et al. / Corrosion Science 44 (2002) 1755–1781
creased to the range 11.1:1 to 13.1:1 after 300 s immersion. These results indicate thatnot all the nitrogen was present as cyano groups in ferricyanide. For the IM phases,after 90 s immersion the ratios varied from 3.7:1 to 11.9:1 but after 300 s immersionall were above 9.1. Finally, based on the work of Treverton and Davies, the 398 N 1speak was assigned to [Fe(CN)6]
4� with the N(398)/Fe ratios also presented in Tables4–6. It can be seen that the ratio is around 6:1 (5.3:1 to 7.2:1) for the matrix after 90 simmersion for all three couples suggesting that [Fe(CN)6]
4� may be the only cyanospecies on the surface, however, after 300 s immersion the ratio had risen above 10:1indicating decomposition of [Fe(CN)6]
4� groups.The nature of the C and N species on the surface was further investigated using
FTIR and the results for the matrix and IM phase are summarised in Table 7.The FTIR spectra of the Cu2FeAl7 IM phase (Fig. 11) show a broad OH stretch
Fig. 10. XPS N 1s spectra for low and high levels of 400 eV peak. CuAl2: (a) matrix––90 s immersion and
(b) IM phase––300 s immersion.
L. Juffs et al. / Corrosion Science 44 (2002) 1755–1781 1773
(3502 cm�1), C–H stretches (2924 cm�1), a CBN stretch (2063 cm�1), H–O–H bendingof lattice water (1665 and 1602 cm�1), H2O bonded to tetrahedra and octahedral Al(1432 cm�1), Cr(VI)–O vibrations (812 and 903 cm�1) and polychromate Cr–Ostretches (1038, 1142 and 1224 cm�1) [28]. By contrast, the C–H stretches, thepolychromate stretch, and the H2O bonded to Al were not observed over the matrix
Table 4
Breakdown of N1s XP spectra into 398 and 400 eV components for FeAl3 treatments
Immersion time (s) % N1s N/Fe N/Fe based on % N in 398 eV peak
398 eV 400 eV
Matrix
0 – 20.5 – –
90 70 30 9.1 6.8
300 90 10 11.4 10.3
FeAl3 phase0 – – – –
90 44 56 6.8 3.0
300 77 23 9.2 7.1
Table 6
XPS composition of the surface of CuAl2 (at.%)
Immersion time (s) % N1s N/Fe N/Fe based on % N in 398 eV peak
398 eV 400 eV
Matrix
0 – – – –
90 88 18 8.8 7.2
300 100 0 13.1 13.1
CuAl2 phase0 – – – –
90 68 32 11.9 8.1
300 28 71 20.8 5.8
Table 5
XPS composition of the surface of Cu2FeAl7 (at.%)
Immersion time (s) % N1s N/Fe N/Fe based on % N in 398 eV peak
398 eV 400 eV
Matrix
0 – – – –
90 66 34 8.1 5.3
300 100 – 11.1 11.1
Cu2FeAl7 phase0 – – – –
90 78 22 3.7 2.8
300 96 4 9.1 8.7
1774 L. Juffs et al. / Corrosion Science 44 (2002) 1755–1781
(Fig. 11). The weak Fe–CN stretch was observed on the matrix but was not visible onthe IM phase. The CBN stretch was more intense on the matrix and shifted to ahigher frequency than on the IM phase (2090 cm�1) indicating a change in the cyanobonding. The intensity of the Cr(III)–OH stretch is much higher on the IM phasewhile the Cr(VI)–O stretch is approximately the same intensity on both samples.
6. Discussion
6.1. Development of the conversion coating on the matrix
There was a linear increase in the coating thickness (RBS) for the conversioncoatings developed over the matrix between 75 and 300 s immersion. These resultsagree with those of Kendig et al. [19], Drozda and Maleczki [29] and Hagans andHaas [10], who observed an increase in coating thickness (or coating weight) for thisrange of immersion times in accelerated solutions. At longer immersion times the
Table 7
Comparison of infrared absorbance frequencies (cm�1) on matrix and Cu2FeAl7
Matrix Intermetallic Tentative assignment
3338 3275 O–H stretch
2957–2858 CH3, CH2, C–H stretch
2090 2063 CBN stretch
1623 1665, 1602 HOH bending of lattice water
1432 H2O coordinated to condensed octahedral and
tetrahedral Al
1038, 1142, 1224 Polychromate Cr–O vibrations
816, 903 812, 903 Cr(VI)–O vibrations
593 Fe–CN vibration
528 528 Cr(III)–OH vibration
Fig. 11. FTIR spectra of the matrix and Cu2FeAl7 IM phase after 300 s immersion in chromate solution.
L. Juffs et al. / Corrosion Science 44 (2002) 1755–1781 1775
results of Kendig et al. [19] indicate that there may be a limiting thickness. A linearincrease in coating thickness for unaccelerated coating solutions was also observedby Hagans and Haas [10] for coatings deposited between 90 and 300 s. For unac-celerated coating solutions a limiting thickness of around 70 nm was reported byKatzman et al. [11]. Results to be reported by us also indicate a linear increase incoating weight with immersion time for times up to 300 s immersion for acceleratedsolutions [30].The actual thicknesses of the coatings presented in Fig. 7 are consistent with
those reported by Lytle et al. [31] and Zuzhan Yu et al. [32] but larger than the valuesreported by Hagans and Haas [10]. Coating weight and hence thickness has beenreported to vary with alloy composition with more pure Al alloys producing heav-ier coating weights [33,34]. Hence, the thicker coatings (larger coating’s weights)observed here compared to those of Hagan and Haas are probably due to the use ofAl 1100 alloy for the matrix in this work and 2024-T3 in the study of Hagan andHaas.In terms of composition of the coatings covering the matrices, all three couples
were similar after 90 s immersion with around 9–10 at.% Cr (XPS), in a mixture ofspecies. There were indications that ferrocyanide was incorporated into the coatings(XPS, FTIR) as well as cyano groups in other forms (high XPS N/Fe ratios). Thecomposition after 300 s immersion changed consistently from the 90s immersion forall three couples. The Cr levels were slightly lower (7–8.5 at.%) along with lowerlevels of cyano compounds and increased oxygen levels. These changes indicatesubtle but consistent changes in the nature of reactions at the surface; the ferricya-nide accelerator appears to play a lesser role and hydrated chromium oxide gelbecomes predominant. These compositions are again consistent with our previousresults [5] and other observations reported in the literature [32]. On the other hand,much higher Cr levels and lower N levels have been reported in a number of studies[10,31]. Lytle et al. [31] have attributed the presence of Al in XPS analyses to exposedIM compounds, however, the higher Al levels observed in this study are more likelydue to cracking in the coating which exposes the oxidised surface of the underlyingalloy since the IM number density is low for Al 1100.A major issue remaining with deposition of conversion coatings from accelerated
solutions is the role of ferricyanide which recent studies have illuminated [15,16]. Inearly work by Treverton and Davies [13], it was proposed, on the basis of XPSstudies, that ferricyanide adsorbs, in preference to chromate ions, onto the surface ofhydrated chromium oxide gel particles as they form at the surface. Thus, morechromate was available for reaction with the aluminium. CrFe(CN)6 andCr4[Fe(CN)6]3 were proposed as surface species by Treverton and Davies, the latterspecies providing evidence that Fe(III) may act as an oxidant during the depositionreaction. The presence of Cr4[Fe(CN)6]3 was also suggested from the M€oossbauerstudies of Drozda and Maleczki [29]. Clearly, from the mechanism proposed by Xiaand McCreery [15], Fe(III) does act as an oxidant and Fe(II) acts as a reducingagent. Thus, the presence of ferri or ferrocyanides in chromate conversion coatingsolutions explains why some reports show much more Cr(VI) in coatings depositedfrom non-accelerated solutions compared to accelerated solutions [35].
1776 L. Juffs et al. / Corrosion Science 44 (2002) 1755–1781
If Fe(II) is acting as a reducing agent for Cr(VI) then electron transfer must occurat some stage between ferricyanide and chromate and it is not unreasonable tosuggest that it occurs during complex formation on the surface. It is unlikely to occurin solution since an anionic complex such as [Fe(II)(CN6]
4� is unlikely to directlyreact with another anionic species such as Cr2O
2�7 . Thus, the surface provides a site
for these species to react. Adsorbed ferrocyanide and chromate (hydrogen bonded tosurface hydroxyl groups) are likely to have less charge leaving the free cyano groupsto act as a bridge to the Cr(VI) centre [36] thus providing a path for the reduction ofCr(VI) to Cr(III). This type of configuration may well explain the formation ofspecies such as Cr4[Fe(CN)6]3 which have been proposed by Treverton and Davies[13] to be incorporated into the conversion coating. Indeed, a high surface concen-tration of [Fe(CN)6]
4� might be expected if the aluminium is protected by the de-position of a conversion coating. The Cr 2p3=2 binding energy typical of chromiumferri or ferrocyanides falls in the region 578.0–578.5 eV similar to the middle Cr 2p3=2peak observed here. In addition, the Cr (middle peak)/Fe atomic ratio generally fellbetween 1 and 2.2 which, given the uncertainties in curve fitting, is in reasonableagreement with 1–1.3 expected for Cr[Fe(CN)6] and Cr4[Fe(CN)6]3 respectively. Thismeans that up to 50% of the Cr on the surface of the conversion coating may be tiedup in chromium ferri or ferrocyanides according to fitting results for the Cr 2p3=2XPS spectra (Table 8).It is difficult to observe species such as Cr[Fe(CN)6] and Cr4[Fe(CN)6]3 directly
using FTIR, since the assignment of infrared bands is not unambiguous. For ex-ample, the stretch frequency for the CBN bond falls at 2118, 2044, 2100, 2098, and2098 cm�1 for K3[Fe(CN)6] [15], K2[Fe(CN)6] [15], [Cu(II)]3[Fe(CN)6]2 [15],[Cu(II)]2[Fe(CN)6] [15], and Cr4[Fe(CN)6]3 [37], respectively, making it impossible todistinguish between the Cr and Cu ferro complexes. On the other hand, adsorbedferro and ferri complexes fall around 2065 cm�1. Similar CBN stretching at 2097cm�1 has been attributed to polymeric ferri/ferro (Berlin green) cyanides [15]. For acompound like Berlin green to form, some of the ferricyanide must decompose re-leasing Fe(III) and a N/Fe ratio of around 3 would be expected. Decompositionproducts were not observed over the matrix using FTIR. The only indication ofdecomposition came from the higher than expected XPS N/Fe ratios and a split inthe N1s peak suggesting the presence of cyano groups in a different chemical en-vironment from the ferri/ferrocyanides on the surface. Thus, the large N/Fe ratios(Tables 4–6) do not lend support to the concept that Berlin green is a major specieson the surface. Indeed, the expected ratio for N(398)/Fe of six was only observedafter 90 s immersion indicating that all the Fe on the surface was associated withferri/ferrocyanide. Thus, the XPS and FTIR results suggest that the surface cyanospecies are a mixture of Cr4[Fe(CN)6]3 and free cyano groups.
7. Development of the conversion coating on the IM phase
The bulk compositions of the IM phase as determined by RBS were consistentwith the IM stoichiometries. The surface composition of the IM phases, however,
L. Juffs et al. / Corrosion Science 44 (2002) 1755–1781 1777
showed oxidation and considerable Al-enrichment for the Cu-containing IMphases and Fe-enrichment for FeAl3. Hagans and Haas also observed aluminiumoxide layers on IM particles in the matrix of 2024-T3 alloy after various treatments[10]. In their case they observed Cu enrichment on the polished surface of the IMparticles.The reaction of the accelerated conversion coating solution with the IM phase was
quite different to that of the matrix. Coatings over the IM phases were around atenth of the thickness of the matrix with the thinnest coatings on FeAl3 and thickeston CuAl2. Coating composition suggested that the surface chemistry was signifi-cantly different from the matrix. Even after 90 s immersion AES depth profiles in-dicated that the surface layer had two regions: an outer region containing Cr and aninner region of aluminium oxide which varied in thickness according to the IM phasetype (Fig. 9). The generation of the aluminium oxide may be enhanced both byfluoride attack and by oxygen reduction reactions on the surface of the IM phase,which would make the surface conditions more alkaline and suitable for formationof hydrated aluminium oxides. Passivation of the IM phase surface may be furtherassisted by chromate adsorption onto the aluminium oxide or reaction near thesurface with Al3þ ions in solution
Table 8
Percentage of Cr and Fe species as a function of immersion time
Immersion
time (s)
% Cr 2p3=2 % Fe 2p3=2
577.3 eV 578.9 eV 580.3 eV Cr (578.9)/Fe (tot) Fe(II) Fe(III)
Matrix
FeAl390 42.1 45.3 12.6 2.1 98 2
300 44.2 29.1 26.1 1.6 63 37
Cu2FeAl790 17.2 26.1 56.7 1.0 34 66
300 43.1 48.7 8.2 3.4 52 48
CuAl290 65.7 28.5 5.8 1.2 89 11
300 40.1 35.1 24.8 2.2 52 48
IM phase
FeAl390 42.1 49.4 8.5 2.1 71 0
300 33.6 31.5 34.9 1.7 80 0
Cu2FeAl790 70.8 29.2 0.0 1.7 72 26
300 56.9 29.7 13.4 1.6 80 20
CuAl290 65.7 28.5 5.8 1.5 73 27
300 68.3 23.1 8.7 1.5 88 12
1778 L. Juffs et al. / Corrosion Science 44 (2002) 1755–1781
Adsorption of chromate onto hydrated aluminium oxides grown on Al has beenobserved by Hawkins et al. [38]. Once chromate adsorbs onto the surface it probablycompetes with oxygen reduction and reduces the cathodic activity of the IM phase.Reduction of ferricyanide to ferrocyanide would also compete with oxygen reduc-tion.While N and C were detected in the coating on the IM phase, their levels were
generally much lower than for the matrix, particularly after 90 s immersion. Thepresence of the C–H stretch in FTIR indicated that some of the cyano groups maydecompose on the IM phase into hydrocarbons.The proposed role of the Fe(II)/Fe(III) couple in the acceleration of the deposi-
tion of the conversion coating is to act as a catalyst for aluminium oxidation andCr(VI) reduction. This role may, however, be undermined by reduction of theferricyanide, not directly through Al oxidation but because it has absorbed on acathodic site. In the case of ferricyanide, it appears to adsorb onto the surface of theIM phase and is reduced to ferrocyanide (Fe(II) in XPS). The FTIR CBN stretch at2063 cm�1 indicates that the ferrocyanide is adsorbed without interaction, unlike thematrix. Similary, chromate reduction is not catalysed by ferro/ferricyanide couple,again, because of adsorption onto a cathodic site. If the ferri/ferro catalytic couple iscircumvented in this fashion, it is not surprising that the coating is much thinner overthe IM phase.It has been suggested that IM phases may be protected by CuFe(CN)6, however,
there was no evidence for the formation of these types of compounds, particularlygiven the lack of Cu detected during XPS.
8. Conclusions
Deposition mechanisms of chromate conversion coatings on aluminium alloysused in manufacturing were simulated by the use of macroscopic models of IMphases in aluminium alloys. The thickness and composition of chromate conversioncoatings deposited onto the matrix and IM phases were similar to studies carried outon real alloys. With the macroscopic couples, however, techniques not noted fortheir high spatial resolution, such as XPS, can be applied to determine the surfacecomposition and oxidation state of components of the IM phases.Coatings on the matrix of the couples were found to be more than 10 times thicker
than over the IM phase and increased linearly with immersion time. The coatingcomprised hydrated chromium oxide, ferrocyanide possibly Cr4[Fe(CN)6]3, cyanogroups and Cr(VI).Over the IM phase both chromate and ferricyanide are adsorbed onto the alu-
minium oxide layer, where they underwent reduction to Cr(III) and ferrocyanide
L. Juffs et al. / Corrosion Science 44 (2002) 1755–1781 1779
respectively due to the cathodic nature of the IM phase. The cathodic reduction ofCr(VI) prevents the oxidation of the ferrocyanide back to ferricyanide.
Acknowledgements
The authors would like thank Professor R. Buccheit and Drs. A. Davenport andR. Taylor for critical reading and of the manuscript prior to submission. The authorswould also like to thank Dr. J. Gorman with some interpretation of the RBS andXPS results.
References
[1] I.J. Polmear, Light Alloys, second ed., Edward Arnold, London, 1989, p. 36.
[2] R.G. Buchheit, J. Electrochem. Soc. 142 (11) (1995) 3994.
[3] R.G. Buchheit, R.P. Grant, P.F. Hlava, B. Mckenzie, G.L. Zender, J. Electrochem. Soc. 144 (8)