+ All Categories
Home > Documents > The Use of Management Control Systems in the Hospitality ...

The Use of Management Control Systems in the Hospitality ...

Date post: 02-Feb-2022
Category:
Upload: others
View: 3 times
Download: 0 times
Share this document with a friend
134
i 2011-06-25 School of Economics and Management Lund University Department of Business Administration The Use of Management Control Systems in the Hospitality Industry Supervisor: Per-Magnus Andersson Authors: Richard G. Sicari Fredrik J. Söderlund
Transcript

i

2011-06-25

School of Economics and Management

Lund University

Department of Business Administration

The Use of Management Control Systems

in the Hospitality Industry

Supervisor:

Per-Magnus Andersson

Authors:

Richard G. Sicari

Fredrik J. Söderlund

ii

Abstract Title: The Use of Management Control Systems in the Hospitality Industry

Seminar

Date: 2011-06-01

Course: BUSP02: Master Thesis in Accounting and Management Control

Authors: Richard G. Sicari and Fredrik J. Söderlund

Advisor: Per-Magnus Andersson

Key Words: Hospitality Industry, Management Control Systems, Performance Measurement,

Contingency Approach, Multiple Case Study

Purpose: The purpose of the thesis is to describe and analyze the use of management

control systems in the hospitality industry.

Methodology: The study is mainly a descriptive, multiple case study based on deductive

reasoning. However, explanatory elements occur. The nature of the study is to a

large extent qualitative and is primarily based on interviews and analysis of

current management control tools. The analytical strategy includes pattern

matching, explanation building and cross-case synthesis.

Theoretical

Perspectives: The main text editions included are Anthony and Govindarajan (2003 & 2007),

Lindvall (2001), Merchant and Van der Stede (2007) and Samuelsson (2004).

Furthermore, the use of management control systems in the hospitality industry is

examined using literature such as Harris (1995), as well as other articles.

Empirical

Foundation: There are four units of analysis included in this study: (1) BrewPub København; (2)

Färs & Frosta Sparbank Arena; (3) Kulturmejeriet and; (4) Scandic Hotels. This

organization is divided into three subunits; Scandic Kramer, Scandic Malmö City

and Scandic Star Lund. Each organization is described in terms of background,

situational factors, strategy & management philosophy, organizational structure

and their use of management control systems.

Research

Findings: The design and use of management control systems were found to be different in

each unit of analysis as the tools were tailored to the needs of the individual

organization. Overall, the systems designed in the units of analysis were consistent

to what has been presented in academic theory. The authors found there to be

four key contingency factors that affect the design of control systems. The factors

include strategy, size & structure, ownership and product life cycle.

iii

Preface

Many people have aided the writing of this study and for that we are very grateful. We would

especially like to thank Per-Magnus Andersson, our supervisor, for his extensive support, guidance

and patience throughout the process.

Without the generosity, hospitality (catchy?) and all the valuable input of the respondents, this study

would certainly not have been in its present shape. To all of you, thank you very much!

Finally, we would like to thank our families and friends for supporting us all those early mornings and

late nights throughout the spring of 2011.

We hope that you will enjoy reading this study and that it will inspire others to further research the

field of management control systems in hospitality.

Sincerely,

Richard G. Sicari Fredrik J. Söderlund

“Hospitality – the social settings in which acts of hospitality

and acts of hospitableness take place together with the

impacts of social forces on the production and

consumption of food, drink and accommodation”.

(Lashley and Morrison, 2000, p.5)

iv

Table of Contents

I. Introduction .......................................................................................................................................... 1

1.1 Background .............................................................................................................................. 1

1.2 Problem discussion .................................................................................................................. 2

1.3 Purpose .................................................................................................................................... 3

1.4 Research Question .................................................................................................................. 3

1.5 Delimitations ........................................................................................................................... 4

II. Methodology ....................................................................................................................................... 5

2.1 Research Strategy .................................................................................................................... 5

2.2 Research Design ...................................................................................................................... 6

2.2.1 Research Question.................................................................................................................. 6

2.2.2 Purpose ................................................................................................................................... 6

2.2.3 Units of analysis ...................................................................................................................... 7

2.2.4 Analytical Strategy and Technique ......................................................................................... 8

2.3 Criteria for Evaluation ............................................................................................................. 9

2.4 Sources of Evidence ............................................................................................................... 10

2.4.1 Documentation ..................................................................................................................... 10

2.4.2 Archival Records ................................................................................................................... 10

2.4.3 Interviews ............................................................................................................................. 11

2.4.4 Direct Observations .............................................................................................................. 13

2.5 Collection of Evidence ........................................................................................................... 13

2.6 Source and Research Design Criticism .................................................................................. 14

III. Theoretical Perspectives .................................................................................................................. 16

3.1 Contemporary Management Control Systems ......................................................................... 16

3.1.1 The Influence of Management Control Philosophy ............................................................. 17

3.1.2 The Influence of Organizational Strategy ............................................................................. 19

3.1.3 Organizational Structure: Responsibility Accounting ........................................................... 21

3.1.4 Management Control Tools .................................................................................................. 23

3.1.5 Reward Systems ................................................................................................................... 28

3.1.6 Informal Management Control Systems .............................................................................. 30

3.1.7 Control System Tightness ..................................................................................................... 30

3.1.8 The Contingency Approach .................................................................................................. 31

3.2 Characteristics of the Hospitality Industry .............................................................................. 33

3.2.1 The Service Industry ............................................................................................................. 33

v

3.2.2 The Hospitality Industry ....................................................................................................... 34

3.3 The Use of Management Control Systems in the Hospitality Industry ....................................... 37

3.3.1 Planning ................................................................................................................................ 38

3.3.2 Performance Measurement ................................................................................................. 38

3.3 Theoretical Summary .................................................................................................................. 42

IV. Empiricism ........................................................................................................................................ 43

4.1 BrewPub København ................................................................................................................ 43

4.1.1 Strategy & Management Philosophy .................................................................................... 43

4.1.2 Organizational Structure ...................................................................................................... 44

4.1.3 Management Control Systems ............................................................................................. 45

4.2 Färs & Frosta Sparbank Arena (FFSA) ....................................................................................... 49

4.2.1 Strategy and Management Philosophy ................................................................................ 50

4.2.2 Organizational Structure ...................................................................................................... 51

4.2.3 Management Control Systems ............................................................................................. 52

4.3 Kulturmejeriet ........................................................................................................................... 54

4.3.1 Strategy and Management Philosophy ................................................................................ 54

4.3.2 Organizational Structure ...................................................................................................... 55

4.3.3 Management Control Systems ............................................................................................. 57

4.4 Scandic Hotels ........................................................................................................................... 58

4.4.1 Corporate Strategy ............................................................................................................... 58

4.4.2 Scandic Region South Structure ........................................................................................... 59

4.4.3 Corporate Management Control Systems ............................................................................ 59

4.4(a) Scandic Kramer ..................................................................................................................... 62

4.4-A.1 Strategy and Management Philosophy ............................................................................. 63

4.4-A.2 Organizational Structure ................................................................................................... 63

4.4-A.3 Management Control Systems.......................................................................................... 64

4.4-B Scandic Malmo City ............................................................................................................... 65

4.4-B.1 Strategy and Management Philosophy ............................................................................. 66

4.4-B.2 Organizational Structure ................................................................................................... 66

4.4-B.3 Management Control Systems .......................................................................................... 67

4.4-C Scandic Star Lund .................................................................................................................. 68

4.4-C.1 Strategy and Management Philosophy ............................................................................. 68

4.4-C.2 Organizational Structure ................................................................................................... 69

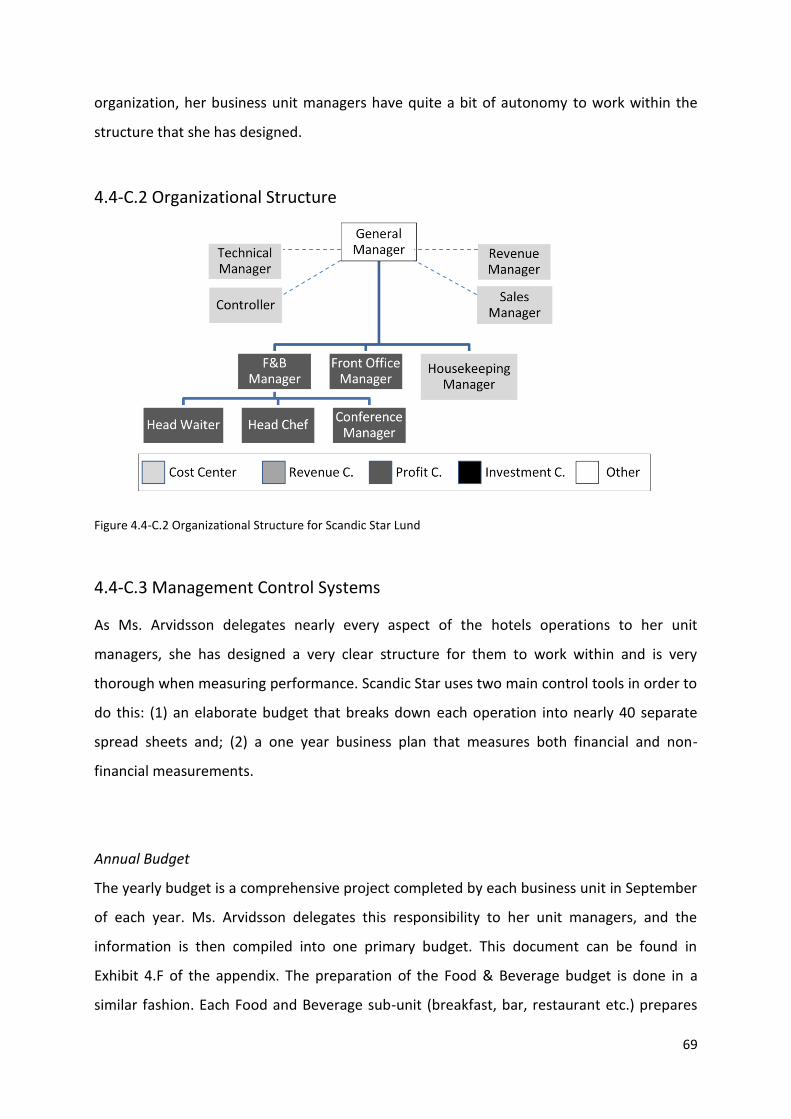
4.4-C.3 Management Control Systems .......................................................................................... 69

vi

V. Analysis .............................................................................................................................................. 72

5.1 Cross-Sectional Comparison ..................................................................................................... 72

5.1.1 Strategy and Management Philosophy ................................................................................ 72

5.1.2 Size and Organizational Structure ........................................................................................ 73

5.1.3 Management Control Systems ............................................................................................. 74

5.2 Contingency Factor Causality ................................................................................................... 79

5.2.1 Strategy ................................................................................................................................ 80

5.2.2 Organizational Size & Structure............................................................................................ 83

5.2.3 Ownership ............................................................................................................................ 85

5.2.4 Product Life Cycle ................................................................................................................. 87

5.3 Analytical Summary .................................................................................................................. 91

VI. Discussion ......................................................................................................................................... 92

6.1 Summary of Research Findings ................................................................................................. 92

7.1.1 The Use of Management Control Systems ........................................................................... 92

7.1.2 Research Findings Compared to Theoretical Perspectives .................................................. 93

7.1.2 The Affect of the Main Contingency Factors ........................................................................ 95

7.2 Recommendations of Management Control Systems................................................................. 96

7.2.1 Recommendations to Organizations Related to the Hospitality Industry............................ 97

7.2.2 Recommendations to the Case Organizations ..................................................................... 98

7.3 Recommendations for Future Research .................................................................................... 103

VIII. References .................................................................................................................................... 105

8.1 Literature ................................................................................................................................ 105

8.1.1 Text Editions ....................................................................................................................... 105

8.1.2 Journal Articles ................................................................................................................... 105

8.1.3 Electronic References ......................................................................................................... 106

8.2 Interviews .................................................................................................................................. 107

IX. Appendix ......................................................................................................................................... 108

1

I. Introduction

This chapter is introduced with a general discussion regarding the background of the study

and a brief description of the hospitality industry. Subsequently, the problem which brought

forth the authors’ interest in this field will be discussed. Thirdly, the study’s purpose and

research question will be presented and finally, the delimitations will be presented.

1.1 Background

The hospitality industry is composed by a number of sub-industries, including lodging,

dining, travel, health care, culture, sports and recreation. In Sweden, the hospitality industry

is growing rapidly, according to a report by the Swedish Agency for Economic and Regional

Growth/SCB (2008, p.7). In 2008, the tourism industry, of which the hospitality industry is a

sub-industry, generated revenues of 244 billion SEK. This figure represents a 53 percent

increase since the year 2000. In 2008, the proportion of the Swedish GDP attributed to the

tourism industry was nearly 3 percent. Of the total tourism industry turnover, dining and

housing accounted for roughly 32 percent whereas culture, sports and recreation accounted

for 5 percent. The number of employees in lodging, dining, culture, sports and recreation in

Sweden was roughly 185,000 in 2008.

According to the European Commission (2004, p.11), the European tourism industry is

heavily dominated by the hospitality industry in terms of numbers of enterprises. Some 97

percent of the enterprises are represented by restaurants, hotels and cafes, while tour

operators and travel agencies account for a large percentage of the remaining sectors.

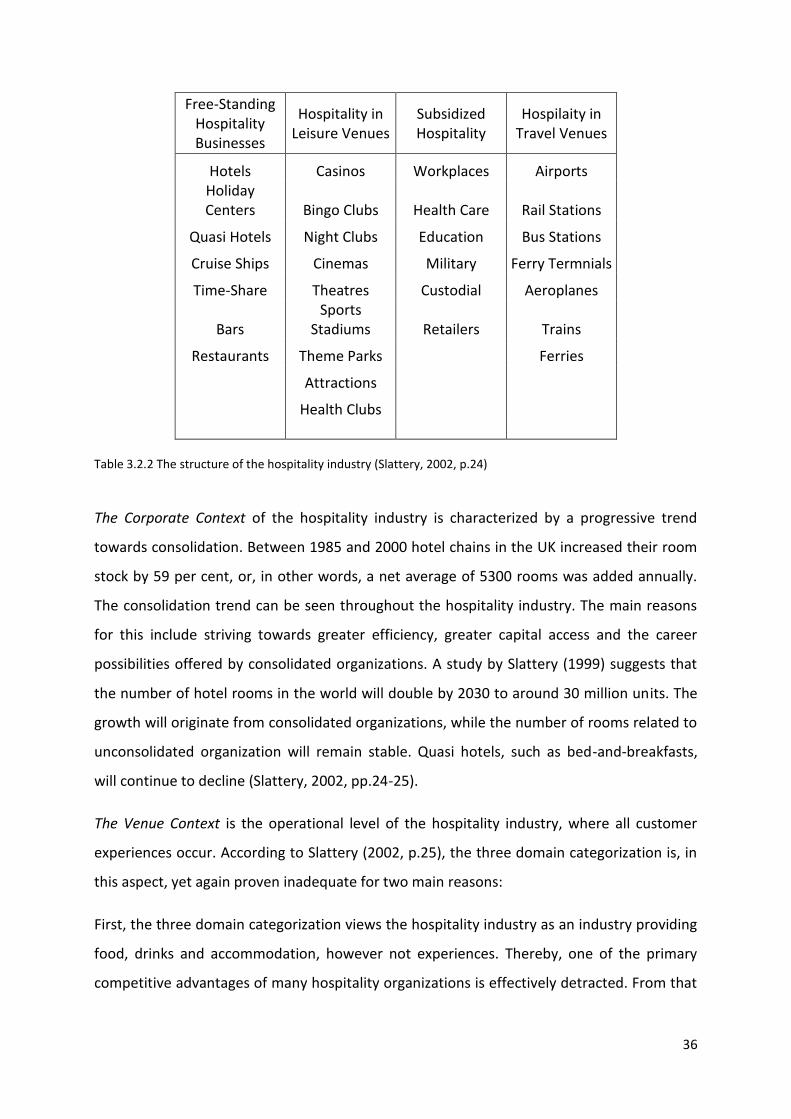
Slattery (2002), divides the hospitality industry into four categories; Free-Standing

Hospitality Businesses, Hospitality in Leisure Venues, Subsidized Hospitality and Hospitality in

Travel Venues. In this study, the hospitality industry is represented by a selection of four

organizations. These include BrewPub København, Färs & Frosta Sparbank Arena,

Kulturmejeriet and Scandic Hotels. As there are some internal differences between Scandic’s

individual hotels, three of their units will be further discussed separately. These subunits

include Scandic Kramer, Scandic Malmö City and Scandic Star Lund.

2

1.2 Problem discussion

Given the educational background of the authors, the choice of studying the field of

management control was made early on. The increased complexity of the business

landscape and the recent fluctuations in the world economy have, in the authors’ opinion,

required organizations to pay particular attention to issues in management control.

Therefore, the authors found that contemporary utilization of management control systems

would be an interesting field to study. The choice of industry, however, was less obvious.

The hospitality industry was chosen because of the relatively strong growth rate, compared

to the manufacturing industry in Sweden (Swedish Agency for Growth Policy Analysis, 2010,

p.7). Furthermore, one of the authors has a particularly strong interest in the hospitality

industry which the authors believe could be of value for the study.

The use of management control systems in the hospitality industry is a relatively unexplored

area of management control. While the hotel and restaurant industries are further explored,

research focused on culture, sports and recreation sectors are rarely addressed. This lack of

extended research in the hospitality industry has prompted the authors to further develop

research by attempting to describe the design and use of management control systems in

the hospitality industry. Furthermore, the authors wish to analyze how the design and use of

control tools compares to theory as well as how they can be explained.

The authors find the notion that management control systems in the hospitality industry are

relatively unexplored to be somewhat surprising due to the general increase of

organizational complexity of hospitality organizations. Diversified business strategies, such

as those seen in Las Vegas hotel venues, have become increasingly common in the

hospitality industry (Slattery, 2002, p.23). Therefore, the need for multiple business units to

delegate responsibility and accountability is amplified. In such organizational structures, the

importance and empirical use of management control systems is likely to increase (Anthony

and Govindarajan, 2003, pp.147-153). Furthermore, Brander Brown (2005, p.183) suggests

that the organizations’ abilities to manage variables such as environmental uncertainty,

diversity in customer demand and culture will have significant influence upon the success of

the organization.

3

A substantial amount of research has been conducted in the field of management control

systems. A number of leading international text edition, such as Anthony and Govindarajan

(2003 & 2007), and Merchant and Van der Stede (2007), will therefore be examined in this

study. The use of management control systems in the hospitality industry is covered in

study’s and publications such as Jones (1995), Brander Brown (1995) Schmidgall and

DeFranco (1998), Potter and Schmidgall (1999) and Phillips and Louvieris (2005).

The authors have now determined that the hospitality industry holds significant importance

for Sweden and for the European Union as a whole. Furthermore, as the complexity of the

industry is likely to increase, the need for management control systems will as well. In light

of this notion, the purpose of the study will be presented.

1.3 Purpose

Based on the problem discussion, the purpose of the study is to describe and analyze the use

of management control systems in the hospitality industry. The authors also aim to discuss

possible recommendations that can be made to organizations related to the hospitality

industry as well as to the organizations included in this study.

1.4 Research Question

Main research question

How are management control systems designed and used in the hospitality industry?

Supporting research questions

1. How are the management control systems designed and used in each unit of

analysis?

2. How does the empirical use and design of management control systems compare to

theory?

3. What are the main contingency factors related to the choice of management control

systems and how do they affect the management control systems?

4. Given the findings, what recommendations can be made to related organizations in

the hospitality industry and to the units of analysis?

4

1.5 Delimitations

The authors have limited the research of this study to the hospitality industry in Sweden and

Denmark by including four units of analysis, of which one is Danish. Furthermore, the use of

management control systems is the primary focus, meaning that the study will not include

analysis of financial reporting used for external purposes. However, in some cases, the

external financial reporting and the management control systems overlap and in those

cases, such information will be included. The study focuses on small organizations in the

hospitality industry; the number of employees in the units of analysis range from 5 to 43.

In the case of Scandic Hotels, the units of analysis are divided into three individual hotels.

However, due to the corporate influence, the authors believe that the units of analysis

cannot be analyzed in separation of the Scandic Group. Therefore, corporate control has

been included to a limited extent.

In the case of Färs & Frosta Sparbank Arena, where external organizations are used to

manage certain functions via contracts, these organizations have not been included in the

unit of analysis.

5

II. Methodology

In this chapter, the authors first introduce the research strategy chosen and the reasoning

behind this choice. Secondly, the research design will be presented in detail. Thereafter, the

criteria for evaluation, the sources of evidence and the collection process will be critically

reviewed. Finally, the authors will acknowledge the limitations of this study, to the best of

their abilities.

2.1 Research Strategy

Yin (2003, p.2) states that case studies allow the researcher to “retain the holistic and

meaningful characteristics of real-life events”. The possible applications of a case study

include; explain, describe, illustrate, explore and meta-evaluate. As the focus of this thesis is

to explain, describe and illustrate organizational and managerial systems, the case study as a

strategy is believed to be most suitable. The fact that our research question is a so called

“how” question, enhances the suitability of a case study even further. Yin (2003, p.13) states

that case studies are particularly suitable when the researcher aims to investigate a

contemporary phenomenon where the cause of the phenomenon is unclear. The authors

find this prerequisite to coincide with this study to a large extent.

In research there are two main methods of linking the theoretical perspectives with the

empiricism. These two methods are commonly known as deductive and inductive theory.

Applying an inductive research strategy, the researcher gathers data without a clear

theoretical framework to evaluate. Applying the deductive research method, the researcher

uses a theoretical framework as the starting point of the research. The hypothesis or the

research question, which is based on the theoretical framework, is confirmed or rejected.

Depending on the result of the research, a revision of the theory may be necessary (Bryman

and Bell, 2003, pp.7-12).

In this thesis, the process has largely been based on the deductive method. The theoretical

framework, as suggested by Bryman and Bell (2003, p.10), should be used to drive the

process of gathering empirical data. Such a description corresponds well to the working

6

process of this thesis. However, due to the fact that our research question is a “how”

question, a clear hypothesis and propositions to be tested were not formulated.

Research strategies are traditionally categorized as either qualitative or quantitative

(Bryman and Bell, 2003, p.25; Yin, 2003, p.15). Qualitative research strategies are often

characterized by an emphasis on words rather than numbers. (Bryman and Bell, 2003, p.25).

However, as explained by Yin (2003, p.15), case studies do not have to be based on either

qualitative or quantitative evidence. Our thesis is largely based on qualitative evidence

collected in interviews and will to a large extent be presented in a qualitative manner.

Nonetheless, quantitative evidence in the form of financial reports and control tools has also

been analyzed and will be presented in the appendix.

2.2 Research Design

A research design states the approach chosen by the authors to connect the research

question to the empiricism and finally to the conclusions. In other words it helps the authors

to get from here to there. The research design is meant to guide the authors in the process

of the research. A well constructed research design will help to avoid the collection of

evidence that, in the end, does not fit the research question. According to Yin (2003, pp. 19-

21), the five most important aspects to consider when designing a research study are:

2.2.1 Research Question

The research question of this thesis was discussed in section 2.1.

2.2.2 Purpose

Yin (2003, p.22) claims that formulating a set of propositions will help the study move in the

right direction. However, when a study is of a descriptive nature, as this one is, replacing the

propositions with a clear purpose can be suitable (Yin 2003, p.114). Furthermore, the

authors believe that this research design will enhance objectivity and flexibility as the study

develops.

7

2.2.3 Units of analysis

Four units of analysis (one including three sub-units) have been chosen for this study,

making it a multiple case study. The importance of clearly defining the case, on which the

study is based, is stressed by Yin (2003, p.24). The units of analysis of this study include:

BrewPub København, Copenhagen

Färs & Frosta Sparbank Arena (FFSA), Lund

Kulturmejeriet, Lund

Scandic Hotels

o Scandic Kramer, Malmö

o Scandic Malmö City, Malmö

o Scandic Star Lund, Lund

The authors believe that these four units of analysis will provide coverage of the hospitality

industry in Sweden and partially Denmark. The organizational structures of the units of

analysis are all based upon multiple business units. Such an organizational structure is likely

to require extensive use of management control systems to maintain control of the

operations, delegate responsibility, increase efficiency etc and hence, the relevance to this

study.

The four categories of the hospitality industry, according to Slattery (2002), are Free-

Standing Hospitality Businesses, Hospitality in Leisure Venues, Subsidized Hospitality and

Hospitality in Travel Venues (please see section 3.2.2 for further explanation of these

categories). How these categories are represented in this study is explained below.

Free-Standing Hospitality Businesses is represented in the study by BrewPub København and

Scandic Hotels. BrewPub København was chosen because of their diversification in terms of

homemade beer as well as traditional food. The multiple business unit structure that is used

to manage the brewery, the restaurant and the bar, is of special interest to the authors and

is likely to require extensive use of management control systems. The three Scandic Hotels,

who are part of Scandic Region South, of Sweden, were chosen because they offer

diversified services and focus on different customer demographics: (1) Scandic Star focuses

8

primarily on meetings and conferences; (2) Scandic Kramer gears its operations toward a

more luxurious stay and; (3) Scandic Malmö City is a young, turn-key hotel that offers rooms

at more economic rates.

Hospitality in Leisure Venues is represented in the study by FFSA as well as Kulturmejeriet.

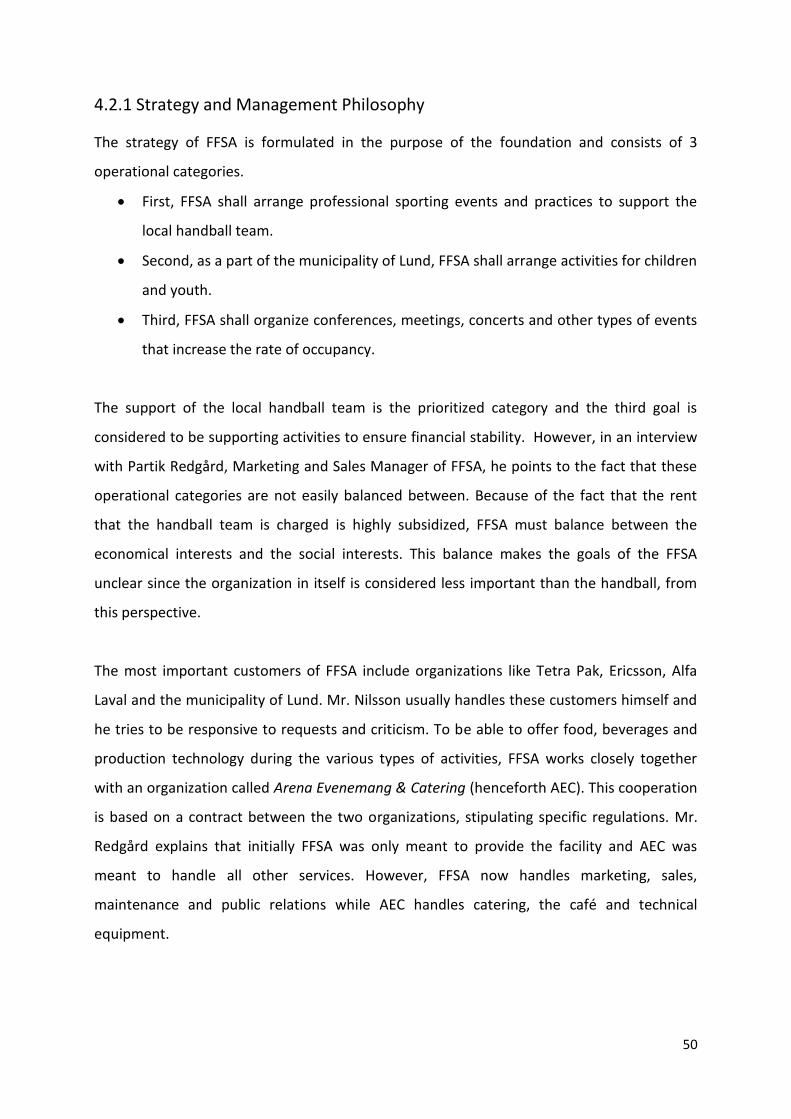
FFSA is an organization that offers diversified products, such as professional sports,

conferences, events, concerts and catering to a variety of different customers.

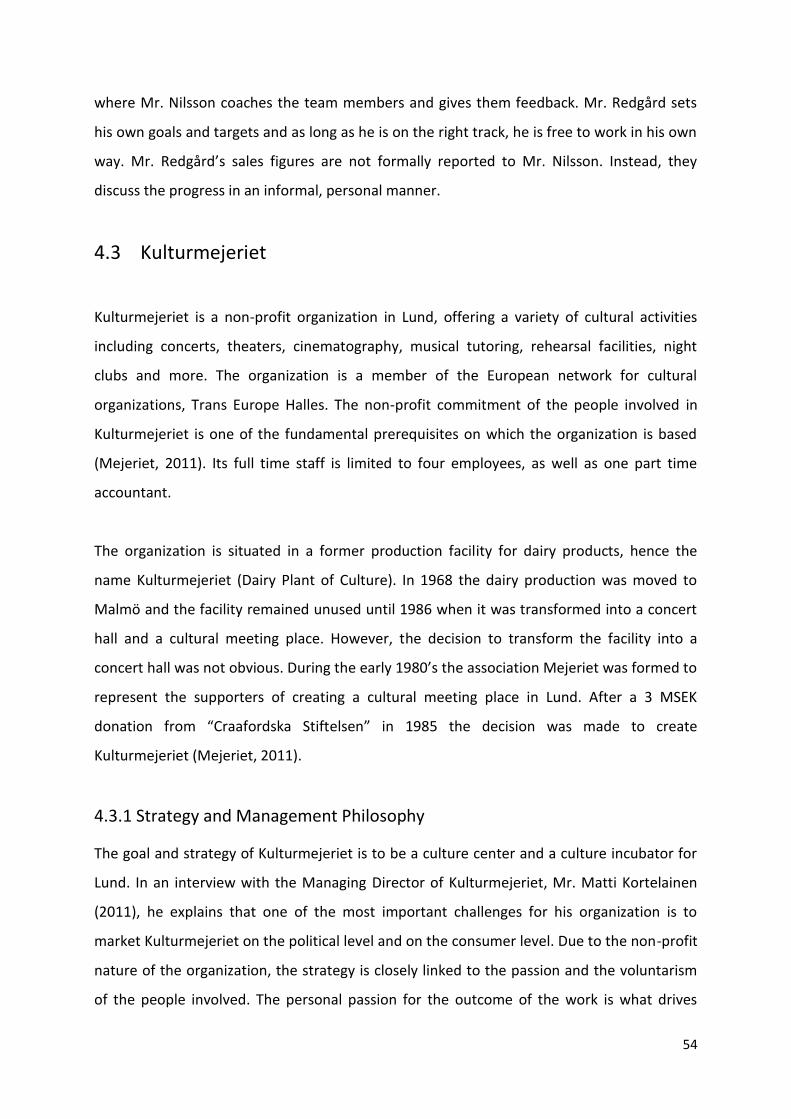
Kulturmejeriet is also related to this category. The umbrella organization Kulturmejeriet

offers a wide selection of diversified services such as concerts, theaters, cinematography,

and night clubs, among other forms of entertainment.

Subsidized Hospitality is represented by Kulturmejeriet as well as FFSA given the fact that

these organizations are partially funded by the Municipality of Lund and other non-profit

organizations.

Even though the hotel industry is represented in this study by Scandic Hotels and the hotel industry is

in fact closely related to the travel industry, the authors recognize the fact that Hospitality in Travel

Venues, as defined by Slattery (2002), is in fact not covered. However, it is the authors’ belief

that the business complexities requiring extensive use of management control systems (i.e. a

wide range of related and complementing services, integrated leisure, etc.), are primarily

found in the free-standing hospitality businesses and to a lesser extent in travel venues.

2.2.4 Analytical Strategy and Technique

Given the descriptive nature of this study, the general analytical strategy referred to as case

description, has been chosen (Yin, 2003, p.114). Such an approach, the authors believe, will

provide the study with a framework to examine the causal links involved in the choice of

management control systems and the effects of them.

The analytical technique referred to as cross-case synthesis, by Yin (2003, pp.133-137), will

by the primary technique used in this study. Such a technique is mostly relevant when

conducting a multiple case study as the findings can be analyzed in relation to each other.

9

The strength of the individual findings can therefore be further developed. In this study, the

authors will present the findings of the four individual case studies in combined tables,

thereby demonstrating possible similarities and differences. For this purpose, the theoretical

framework of management control systems by Samuelsson (2004, p.41) will be applied.

Given the fact that the study is based on four individual case studies, the analysis will be

argumentatively constructed, not numerical.

In addition, the techniques referred by Yin (2003, pp.116-120) as pattern matching and

explanation building will be applied. Pattern-matching is used to compare the findings of the

empirical research to the theoretical perspectives. Explanation building is a special type of

pattern matching concerned with explaining the empirical research findings. In this study,

explanation building will primarily be used in relation to the contingency approach.

2.3 Criteria for Evaluation

Reliability is a criterion of research concerned with whether the results of the study are

repeatable and replicable. This criterion is most important when evaluating quantitative

research models, making it less relevant for this study (Bryman and Bell, 2003, p.33).

However, it has been suggested that reliability, both internally and externally, can be

modified to suit qualitative research as well. Internal reliability is concerned with whether

the researchers involved in a study agree about what they observe. External reliability is a

challenging criterion since the social context in which the study was conducted is likely to

influence the results. Therefore, a researcher that seeks to replicate a study should strive to

take a similar social role to that of the original researcher (Bryman and Bell, 2003, p.288).

Validity is defined by Mason (1996, p.24) in Bryman and Bell (2003, p.287) as “whether you

are observing, identifying, or measuring what you say you are”. In qualitative research,

internal validity is concerned with the match of the observations of the study and the

theoretical framework. The validity is likely to be strengthened if the researcher is allowed to

participate in the social context of the organization of interest over a significant period of

time. Given the fact that this study has been conducted over a ten week period, the authors

recognize that a high level of congruence may not have been reached. External validity

10

concerns whether the results and findings of the study can be generalized or applied to

other social context or other organizations. Because of the influence of contextual factors,

this criterion is also challenging in qualitative research when they are based on case studies

(Bryman and Bell, 2003, p.288). The authors believe that the findings of this study can to a

certain degree qualify for theoretical generalizability, using the aforementioned cross-case

synthesis. Furthermore, the findings may to a limited extent be generalizable to

organizations in the hospitality industry or organizations looking to enter the hospitality

industry.

2.4 Sources of Evidence

Yin (2003, pp.85-97) states six sources of evidence, primarily used in case study research.

None of these sources is dominant but rather highly complementary; the researcher should

therefore strive to widen the scope of evidence collection. In this study, the authors have

primarily collected evidence in the form of documentation, archival records, interviews and

direct observations, however, not participant observations and physical artifacts. The

documents describing the management control tools currently being used in the units of

analysis were originally in either Swedish or Danish and therefore translated into English by

the Swedish author. The primary sources of evidence will be discussed below.

2.4.1 Documentation

Documentation of the following kinds has been collected:

Administrative Documents

o Internal records

o Financial reporting frameworks

o Budgets

Newspaper articles (limited extent)

2.4.2 Archival Records

Archival records of the following kinds have been collected:

Annual Reports

11

Organizational Records

o Organizational Charts

2.4.3 Interviews

The primary sources of evidence of this study are the interviews. Given the fact that the

study is a multiple case study and aims to conduct a cross-case synthesis, an interview

framework was developed which was flexibly used in all interviews. The interviews were all

conducted during the relatively short time-span of more or less one hour and therefore

required an interview protocol. This procedure is consistent with what Yin (2003, pp.89-92)

refers to as a focused interviews. A focused interview is semi-structured by nature, uses

open-ended questions and is conducted during a relatively short time-period. The authors

are aware of the fact that researchers engaged in focused interviews need to take certain

caution not to engage in leading questions due to the limited time-span and the relatively

set protocol. However, the authors believe that relatively open questions were posed and

that the respondents were given significant room for elaboration.

The choice of focused, semi-structured interviews is supported by Bryman and Bell (2003,

p.346) who state that researchers who have a clear research focus and a clear unit of

analysis is likely to select semi-structured interviews. Furthermore, if there are multiple

researchers involved in the interview process of the study, as in this case, semi-structured

interviews are preferred to increase the comparability. Finally, as previously mentioned, the

cross-case synthesis is facilitated by semi-structured interviews. The interview questionnaire

can be seen in the appendix.

The preparation process for the interviews included preparing an interview questionnaire,

based on the management control systems framework of Samuelsson (2004, p.41). This was

used to ensure that the maximum amount of factors influencing the management control

systems would be discussed during the interviews. This interview guide was sent to the

respondents one day in advance of each interview, giving them the opportunity to reflect

over the subjects of interests and prepare the data needed. The preparation also included

12

studying the units of analysis by information available through different kinds of media and

refreshing the author’s knowledge of the relevant management control systems.

All interviews were recorded to ensure a high level of accuracy and detail. None of the

respondents were at any time seen as uncomfortable by the fact that the conversation was

being recorded. The majority of the interviews were transcribed to facilitate the writing of

the empiricism of the findings. As some of the respondents were uncomfortable discussing

management control systems in English, some interviews were conducted in Swedish,

transcribed and finally translated into English by the Swedish author of this study.

Respondents were chosen based on their respective positions in the units of analysis.

Operational managers with direct insight into the daily use of management control systems

were the most desirable respondents. These interviews were complemented with interviews

with subordinates or colleagues to increase the quality of the evidence. The respondents

interviewed for this study include:

Mr. Jens Mortensen, Managing Director of BrewPub København

o Interviewed in Copenhagen on two separate occasions

o 20110328 by both authors

o 20110406 by RS

Mr. Berne Nilsson, CEO of Färs & Frosta Sparbank Arena

o Interviewed 20110406 in Lund by FS in Swedish

Mr. Patrik Redgård, Marketing & Sales Director of Färs & Frosta Sparbank Arena

o Interviewed 20110413 in Lund by FS in Swedish

Mr. Matti Kortelainen, Managing Director of Kulturmejeriet

o Interviewed 20110420 in Lund by both authors

Mr. Tomas Tegfors, General Manager of Scandic Kramer Malmö

o Interviewed 20110412 in Malmö by both authors

Ms. Anna Boudrie General Manager of Scandic Malmö City

o Interviewed 20110416 in Malmö by both authors

Ms. Helene Arvidsson, General Manager of Scandic Star Lund

o Interviewed 20110412 in Lund by both authors

13

Mr. Pontus Mark, Revenue Manager of Scandic Malmö Region

o Interviewed 20110428 in Malmö by both authors

2.4.4 Direct Observations

To a lesser extent, direct observations have been included as evidence of this study. The

interviews have all been conducted in the social contexts of the respective units of analysis,

exposing the authors to the social environment of the case organizations. However,

observational protocols have not been established in addition to the interview recordings

and transcriptions. Nonetheless, the authors believe that it is not unlikely that the

observations of the visits to the case organizations have influenced the impressions of the

management control systems, not least concerning the subject of management philosophy.

2.5 Collection of Evidence

When working with multiple sources of evidence, the researchers can strengthen the validity

and the reliability of the study by following three principles of collection of evidence. These

principles include using multiple sources of evidence, creating a case study database and

maintaining a chain of evidence (Yin, 2003, pp.97-106). The use of these principles in this

study will be discussed below.

One of the strengths of case studies in general is the possibility of taking many kinds of

evidence into consideration when analyzing the findings. Establishing convincing arguments

and conclusions can be facilitated by using multiple sources of evidence. From the beginning

of this study, it has been the authors’ intentions to broaden the scope of evidence collection.

It is the authors’ aim to use this evidence to conduct a so called data triangulation (Yin,

2003, pp.98-99). Using this method, multiple findings are used to support a believed fact.

A case study database was created as the idea for this study was born, in December 2010.

Since then, an evidentiary base has been built with all the evidence collected during the

process of writing this study. Evidence has been logged with date of collection, place of

collection and source. Furthermore, our study has gradually taken form in this database

during the past ten week period.

14

The third principle is closely related to second one, namely that of maintaining a chain of

evidence. As previously mentioned, all evidence has been logged in the case study database

as it has been collected.

2.6 Source and Research Design Criticism

As previously mentioned, the authors have strived to broaden the scope of evidence

collection throughout the process of this study. However, given the fact that the units of

analysis selected are all relatively small hospitality organizations, except for Scandic Hotels,

the primary sources of evidence have been interviews with and documents from the

organizations themselves. Therefore, the authors acknowledge the fact that the evidence

collected is potentially biased to a certain extent. The reason for the potential bias is further

explained below.

There are strengths but also several weaknesses included in conducting case studies based

on interviews. The weaknesses include: (1) the responses given by the respondent are

potentially biased without the researchers knowing; (2) the respondent may not respond

entirely accurate due to poor recall or unwillingness; (3) reflexivity, meaning that the

respondent could respond in certain way to please the researcher and; (4) the interview

questions could be poorly constructed or posed (Yin, 2003, p.86).

When using documents as evidence, the researcher must bear in mind that documents were

written for a specific organizational purpose. For this reason, the authors of this study have

maintained skepticism toward the information provided in the reports, budgets and records.

Despite this effort, the authors acknowledge that the relatively low number of sources is

negatively correlated with objectivity in research. Furthermore, due to confidentiality issues,

some documents, for example the business plans of Scandic Kramer and Scandic Malmö City

were not disclosed. This unfortunate fact has further complicated the analysis of this study.

Another limitation involves the fact that except for in Scandic and FFSA, only the Managing

Directors/General Managers were interviewed. The authors’ desire to conduct interviews on

further levels of the case organizations was partially hindered by the relatively short time

span of the study. The authors recognize that insights into the use of management control

15

systems would have been enhanced through further interviews, in particular concerning

such tools as informal control and organizational culture. Specific to Scandic Hotels, the

authors would like to point to the fact that no interviews were conducted with corporate

officers, as corporate is not considered to be part of the unit of analysis.

16

III. Theoretical Perspectives

In this chapter, the authors examine the main aspects of contemporary management control

systems using a number of leading Swedish and international text editions including Anthony

and Govindarajan (2003 & 2007), Hopper, et al. (2007), Lindvall (2001), Merchant and Van

der Stede (2007) and Samuelsson (2004). Secondly, the characteristics of businesses within

the hospitality industry are introduced. Finally, management control systems used in the

hospitality industry are examined using Brander Brown (1995), Jones (1995) and others. The

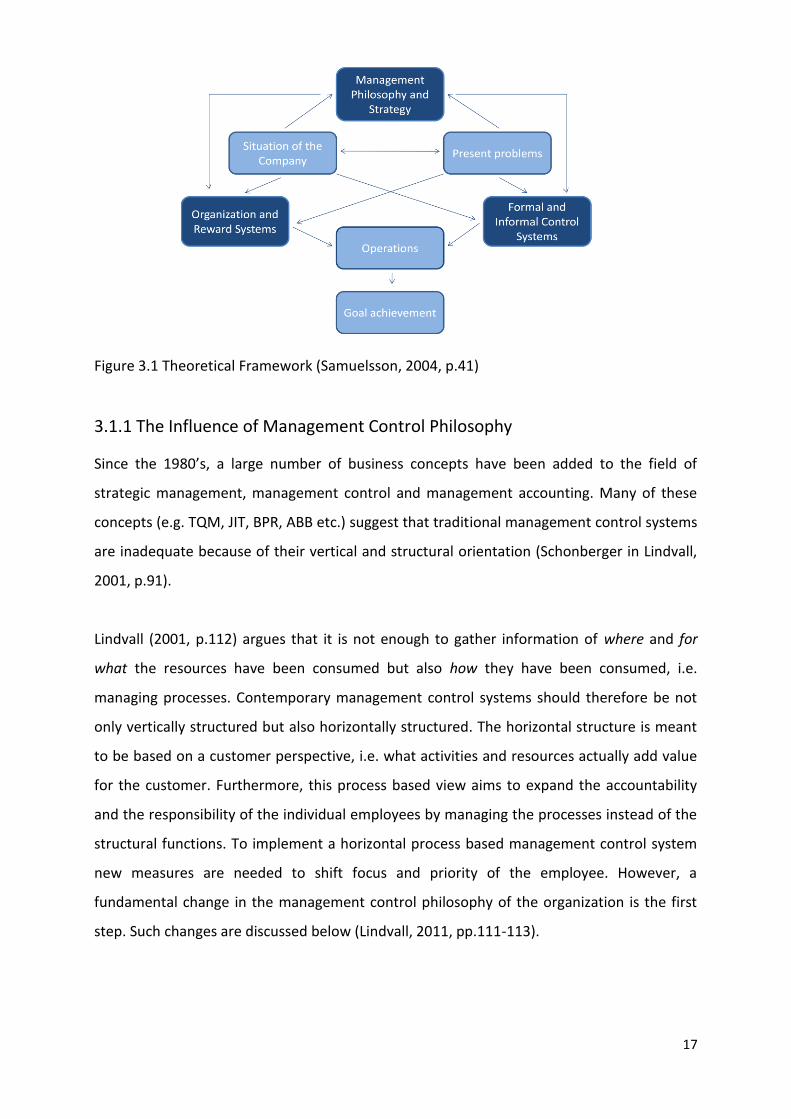
interconnection of the main parts of our theoretical perspectives is illustrated below.

Figure 3 Theoretical Interconnection (Sicari & Söderlund, 2011)

3.1 Contemporary Management Control Systems

Samuelsson (2004, p.41) describe the attributive factors of contemporary management

control systems using the illustration below. The darker frames represent the directly

controllable factors of the attributes (i.e. the management control systems), while the

lighter frames represent the contingency factors of the individual organization. Each aspect

of the management control systems will be discussed in greater detail in this chapter. The

contingency factors of each unit of analysis will be examined in the fourth chapter. In this

study, Samuelsson’s model has primarily served as a general theoretical framework in the

preparation process of the interview questionnaire and in the structuring of this study.

17

Figure 3.1 Theoretical Framework (Samuelsson, 2004, p.41)

3.1.1 The Influence of Management Control Philosophy

Since the 1980’s, a large number of business concepts have been added to the field of

strategic management, management control and management accounting. Many of these

concepts (e.g. TQM, JIT, BPR, ABB etc.) suggest that traditional management control systems

are inadequate because of their vertical and structural orientation (Schonberger in Lindvall,

2001, p.91).

Lindvall (2001, p.112) argues that it is not enough to gather information of where and for

what the resources have been consumed but also how they have been consumed, i.e.

managing processes. Contemporary management control systems should therefore be not

only vertically structured but also horizontally structured. The horizontal structure is meant

to be based on a customer perspective, i.e. what activities and resources actually add value

for the customer. Furthermore, this process based view aims to expand the accountability

and the responsibility of the individual employees by managing the processes instead of the

structural functions. To implement a horizontal process based management control system

new measures are needed to shift focus and priority of the employee. However, a

fundamental change in the management control philosophy of the organization is the first

step. Such changes are discussed below (Lindvall, 2011, pp.111-113).

18

Lindvall (2001, p.141) argues that contemporary management control philosophies have

caused organizations to move away from control and towards empowerment. In modern

organizations, the power distance between managers and their subordinates has decreased.

Traditionally, the managers were likely to control and limit the flow of information and make

decisions which were carried out by subordinates. An important principle of contemporary

management control theories is that the employee should be stimulated to participate in

decision making. In order to be able to participate and increase efficiency in the

organization, information must be made available to the subordinate.

As the complexity and the uncertainty of the business landscape increases, controlling the

work of the organization in detail becomes increasing difficult. Instead, Lindvall (2001, p.149)

suggests that the work should be controlled by setting goals and targets. A control

philosophy based on goals and targets will enable the group and the individual to take

greater responsibility to plan and execute the work needed. Furthermore, a greater sense of

freedom will follow as the manager’s interest in how the work is carried out is replaced with

an interest in the actual outcome.

Management control systems based on accounting information suffer from being focused on

historical data. The traditional way of handling problems is based on reactive management.

As a problem arises it is identified, analyzed and finally, corrective actions are taken.

Replacing reactive management with proactive management could enable organizations to

prevent the problem before it occurs. However, thoughts of proactive management

philosophies were introduced in the early 1980’s, indicating that such philosophies are not

easily implemented in practice. Modern information technology could facilitate the

implementation by enabling the organization to access real time customer feedback and

transfer this information backwards through the entire value chain. Other management

control tools such as rolling forecasts and planning for possible scenarios could also useful to

shift towards proactive management (Lindvall, 2001, pp.153-155).

Lindvall (2001, pp.162-165) argues that the modern business climate requires that

management control philosophies are value based rather than cost based. Traditionally, the

primary focus of management control systems has been on operational efficiency. Resource

19

consumption, cost structures and cost dynamics have been, and still are, of major interest.

However, as focus shifts towards the organization’s ability to create value operational

efficiency becomes inadequate. The correlation between resource consumption and value

creation is not always positive. Increased resource consumption does not necessarily

enhance the value creation. Therefore, the starting point of the organization’s control

philosophy must be the customer and not the internal operations. Such a starting point

would result in an increased focus on the market and the revenues.

3.1.2 The Influence of Organizational Strategy

Certain strategic factors influence the use of management controls systems more than

others. In this section, the authors examine selected factors that are believed to be

particularly relevant for this study. These factors include corporate and business unit

strategy, related diversification strategies and product life cycles.

Competitive Strategy

Competitive strategy is commonly discussed using Porter’s (1980) two widely accepted

generic strategies known as differentiation and cost leadership. These two strategies will

briefly be examined below.

When a product market is not price-sensitive or when it is saturated, a differentiated

business strategy can be an appropriate way for the organization to successfully distinguish

themselves from the competition. This can be done by focusing on the product offering,

innovation, and the brand; thereby creating something that is perceived as unique by the

customer.

The cost leadership strategy involves competing not on the grounds of unique products but

rather by low price, or low price in relation to perceive value of the product. To achieve cost

leadership the organization can take advantage of opportunities such as low operating costs,

supply chain management and economies of scale.

20

Raison d'être for Related Diversification Strategies

To compete in any industry in the long-term, it is necessary to establish a strategy that will

allow an organization to sustain an advantage over its competitors. Markides and Williamson

(1994, pp.149-150) argue that related diversification provides the potential for four different

types of competitive advantages.

Asset Amortization includes the potential to reap economies of scope from synergies across

different business units. For example, business units A and B use the same strategic asset to

produce different products for its market customer. Asset Improvement includes the

potential to use the core competencies or existing business processes in one business unit to

improve another existing business unit. Asset Creation includes the potential to use the good

business practices from an existing business unit to spin off a new business unit faster, or at

a lower cost having learned from the experiences of its existing unit. Asset Fission includes

the potential to learn from the experiences of developing a new business unit to improve the

business practices of an existing business unit.

Product Life Cycles

In the Harvard Business Review article Exploit the Product Life Cycle, Levitt (1965, pp.81-94)

categorize the four stages of the product life cycle into the following:

Market Development – This stage is characterized by high costs, low sales volumes, little

competition, low demand and low profitability.

Market Growth – In this stage, unit cost can be reduced with economies of scale and the

profitability usually increases. The market demand for the product is increased although

competition from new entrants threatens market share and lower price premiums.

Market Maturity – Further economies of scale and learning curve effects lower unit costs

further. The market is saturated and price levels are lowered further as the number of new

entrants has reached substantial amounts. Diversification and differentiation become

frequently employed strategies in order to maintain profitability. The overall industrial profit

begins to decline.

21

Market Decline – Sales volumes decline and fixed assets burden the cost structures of the

producers. Efficiency in terms of production and distribution becomes a frequently

employed strategy to battle decline of sales.

The Boston Consulting Group further developed this approach in 1968, in their work entitled

The Product Portfolio. (The Boston Consulting Group, 2011) A framework for analyzing an

organization’s set of products in four categories was developed. These categories are known

as:

Stars; high growth rate, high relative market share

o Hold; maintain product and invest

Cash cows; low growth rate, high relative market share

o Harvest; maintain product, minimize investments

Dogs; low growth rate, low relative market share

o Divest; discontinue product

Question marks; high growth rate, low relative market share

o Build; maintain product and invest with caution

3.1.3 Organizational Structure: Responsibility Accounting

As organizations become more and more complex, control from the top becomes

increasingly difficult. In these types of organizations it is necessary to form a hierarchy of

autonomous business units, assigning financial responsibility to measure their output.

Anthony and Govindarajan (2003, pp.147-153) describe how creating a network of business

units, known as responsibility centers, helps an organization achieve its goals and objectives.

Furthermore, they go on to define four types of responsibility centers classified as revenue

centers, expense centers, profit centers and investment centers. Essentially, the organization

becomes a collection of these different units, measured on performance targets that are

within their direct control.

Different Types of Responsibility Centers

Revenue centers are responsible for monetary output with no formal relation to its input. In

other words, these units have no authority to set prices or decide their labor costs, so they

22

can only be measured on how much revenue they are able to generate from their activities.

Typically, these centers are designed for marketing and sales units (Anthony and

Govindarajan, 2003, p.151).

As these units can be quite similar to independent companies, the decentralized decision-

making can lead to many advantages. For instance, the quality and speed of detailed

decisions are greatly increased due to a shorter chain of command, allowing senior

management to focus on the big picture. Profit-consciousness is also enhanced as managers

are much closer to their activities, giving them a greater understanding of each operation.

Furthermore, independence of the unit gives managers a great opportunity to train for high-

level jobs; they gain the experience of managing all functional areas in their profit center

(Anthony and Govindarajan, 2003, p.206).

With every advantage however, there are also disadvantages to designing business units as

profit centers. In certain organizations, establishing profit centers involves unnecessary labor

costs and might produce redundant information and record keeping. Decentralized decision-

making can also be seen as a disadvantage if the wrong person is put in charge of the

business unit. This may lead to a loss of power for top-management, reduced quality of

decisions, and communication issues - all of which will produce a negative result for the

organization as a whole (Anthony and Govindarajan, 2003, p.208).

The final type of responsibility centers is known as an investment centers. While they are

inherently the same as profit centers, they take into consideration the measurement and

management of the assets used to earn this profit using tools such as ROI and EVA. In an

ideal world for many businesses, receivables, inventories, working capital and fixed assets

employed in a profit center would be easily measureable. However there are a number of

considerations such as capital charges and depreciation that must be accounted for when

employing these assets in an organization (Anthony and Govindarajan, 2003, pp.286-295).

Choosing a Responsibility Center that Fits the Organization

If the decision is made to decentralize the organization into responsibility centers, managers

must then consider which type of center is best for each unit based on their activities. First

23

and foremost, senior management must decide whether or not unit managers should have

access to all relevant information to make an expense/revenue trade-off decision. That is,

should they have the authority to increase expenses in the expectation that they will be

increasing revenues by an even greater margin? If the answer is yes, creating a network of

profit centers may be the best option for the organization (Anthony and Govindarajan, 2003,

p.204).

Business unit authority is not the only factor that should be considered when deciding

whether or not to establish a business unit as a profit center. Anthony and Govindarajan

(2003, p.209) discuss two categories of constraints that must also be considered; those from

senior management and those regarding uniformity among the other business units. An

organization should be cautious to give a unit the independence of a profit center if its

autonomy would result in a change in organizational strategy, create issues with overall

uniformity, or result in a loss of economies due to decentralization. The same holds true if

the degree of integration between units is too strong. The organization should be hesitant to

establish a profit center if the business unit is jointly responsible for product, marketing, or

procurement decisions with other units. If the unit is free from the aforementioned

constraints, it may be in the organizations best interest to measure the unit on its individual

profit.

3.1.4 Management Control Tools

In the preceding section we discussed the different structural options for an organization to

decentralize its activities into individual responsibility centers. The following section will

outline the management control process and discuss different tools that can be used to plan

the future of the business before the year begins, followed by a description of the reports

used to help evaluate performance month to month, quarterly, or after the year

commences.

Strategic Plan

The first step in the management control process is the strategic plan. Anthony and

Govindarajan (2003, pp.349-352) describe this step as a formal statement of specific plans

24

that includes the new programs and projects that will be undertaken in the next three to five

years. It also includes an outline of the approximate amount of resources that will be

allocated to each new program.

In essence, the strategic plan is the long-range framework for which the one year budget will

be developed. In order for management to confidently commit to budgeted resources for

the coming year, they need to have a clear idea of the organization’s direction in the next

several years. Furthermore, the process of creating the plan, more than the plan itself, forces

managers to think long-term and aligns the strategies of business unit managers with the

strategy of the entire organization.

One-Year Business Plan

The one year business plan can often be used to compliment the budget. As the budget is

strictly a financial tool, the business plan takes into account many non-financial goals that

the organization wishes to achieve within the upcoming year. It should be noted that this

plan is different than the long-term strategic plan which is vague in its targets. The one year

business plan helps an organization achieve specific goals. Some of the non-financial targets

included in the one year business plan often regard employee and customer satisfaction

(Anthony and Govindarajan, 2003, p.480).

Capital Budget

The capital budget involves planning for specific projects that will be implemented within

the next few years and will require a significant amount of resources. The capital budget

generally requires much more planning and detail than does the strategic plan. Much of the

discussion involved in the capital budget regards the allocation of capital resources and the

costs that will be incurred in doing so. Corporate officers and shareholders are often heavily

involved in this process as it is greatly affected by the organizations track record, arguing

skill, and political power (Merchant and Van der Stede, 2007, p. 332).

Operating Budget

The chief tool used for effective short-term planning in many organizations is the one year

operating budget. It generally includes the revenues and expenses planned for the current

25

year, broken into multiple categories for detailed review. The budget is commonly expressed

in monetary terms and is a commitment made by all managers to accept the responsibility of

achieving the budgeted objectives. One of the key activities involved in the budgeting

process is that of forecasting future revenues and costs. Anthony and Govindarajan (2003,

p.411) outline four main purposes for the budget:

to fine-tune the strategic plan

to assist in the coordination of organizational activities; each unit should participate

in the preparation of their portion of the budget

to make clear the responsibilities and goals of each responsibility center

to create a basis for performance evaluation; it becomes a benchmark for which

actual performance will be judged

Budgeted Cash Flow Statement

The budgeted cash flow statement aims to anticipate how much cash is needed during the

period. It indicates both the inflow and outflow of anticipated cash movements during the

period (usually by quarter). Furthermore, as a basis for planning lines of credit and short-

term borrowing, the treasurer should anticipate this statement month to month (Anthony

and Govindarajan, 2007, p. 386).

Rolling Forecast

In the Harvard Business Review article Who Needs Budgets? Hope and Fraser (2003, pp.108-

115) state that the use of rolling forecast is different compared to the use of traditional

budgets in three main ways. Firstly, the budget’s end date is set to that of the end of the

fiscal year while the rolling forecast’s is constantly pushed forward in time. Secondly, the

rolling forecast is usually constructed in as a simplistic version of the more complex budget.

It is not uncommon for the forecast to contain only a few selected performance

measurements and therefore, it is a less time consuming procedure to produce the report.

Thirdly, and perhaps most important, is the probability that the rolling forecast is more

accurate than the budget. This is related to two underlying reasons: (1) the frequent updates

of the forecast make the input more relevant for decision making as changes in customer

demand and economic climate is taken into effect and; (2) the dysfunctional behavior of the

26

budget process can be avoided as the rolling forecasts are usually not related the reward

systems.

Benchmarking

Benchmarking is an important part of most organizations’ budgeting, planning as well as

performance evaluation process. In many cases the target setting is internally based,

creating incentives for continues improvements over short-term as well as long term time

frames. When the target setting is based on internal data, the process is commonly referred

to as internal benchmarking. The unit of comparison can either be a similar or identical

department compared in real time, or the unit of comparison can be the department itself

but to a past time frame. External benchmarking is commonly conducted towards

organizations perceived as best-in-industry or best-in-class. Examples of aspects that can be

included in a benchmark index includes: product or service performance, activities or

processes, specific outcomes or any number of relative performance measurements

(Merchant and Van der Stede, 2007, pp.334-335).

Performance Measurements

Once the budget has been prepared and reviewed, it is necessary to make a monthly (or

quarterly) analysis of the differences between actual and budgeted revenues and expenses

in each category. Moreover, it is necessary to use these variances as indicators that

something is wrong; then analyze and identify the causes and possible solutions to these

problems. Whether revenues are too high or too low, Anthony and Govindarajan (2003, p.

471) present one cardinal principle in analyzing formal financial reports, “The monthly profit

report should contain no major surprises.”

Furthermore, as organizations move toward decentralization and structure their

organization into separate business units, it becomes necessary to evaluate these units

individually. This evaluation can be done by measuring their costs, revenues, or profits

depending on the design of the responsibility center. Merchant and Van der Stede (2007, p.

440) suggest common methods to evaluate business units by profit is done in two basic

ways: using residual measures (also known as accounting profit measures such as net

income, operating profit or earnings before interest and tax (EBIT) or; by using ratio

27

measures (or accounting return measures such as return on income (ROI) and return on

equity (ROE).

Anthony and Govindarajan (2007, p.195) add another measurement to the list presented by

Merchant and Van der Stede (2007). This measurement, known as the contribution margin,

measures the spread between revenues and variable costs. The second method of

evaluation takes into account the cost of capital. Anthony and Govindarajan (2007 p.271)

state that focusing on financial measurements without considering the cost of assets

employed is an inadequate basis for control. Therefore, when the cost of capital is

significant, the latter group of evaluation method can be seen as superior.

Finally, it should be noted that precise and timely measurement (weekly or monthly) of

responsibility centers is an effective way for top management to be hands off, allow a

considerable amount of autonomy, but still maintain control as they can objectively evaluate

each unit (Merchant and Van der Stede, 2007, p.440).

Non-Financial Measures

Solely analyzing financial performance based on budgetary commitments is not enough to

fully measure organizational performance; organizations must also implement additional

performance measurement reports that include long-term value drivers and non-financial

measurements. Furthermore, when choosing which metrics to include in these reports more

is not always better. It is important to focus on the key value creating activities and closely

monitor their performance (Anthony and Govindarajan, 2007, p.464).

The Balanced Scorecard

The balanced scorecard, first introduced by Kaplan and Norton (1992, pp.71-79) is a

management control framework designed to identify the financial and non-financial KPI’s of

the organization. The original framework was based on four perspectives that enable

managers and employees to track the performance on various levels of the organization (see

Figure 3.1.4). By limiting the number of measures to the most essential, the balance

scorecard prevents an overload of information. Furthermore, by considering all four

perspectives in the decision process, sub optimization is less likely to occur among the

28

business units. It’s close link to strategy and the fact that the framework is clear and simple

has made the balanced scorecard a relatively popular performance measurement tool. Other

advantages of the balanced scorecard include the ability to determine cause-and-effect

relationships of organizational initiatives and issues, the fact that it can be used on all levels

of the organization and that trade-offs become explicit (Hopper, et al., 2007, pp.175-179).

Critics of the balanced scorecard argue that it is inadequate to include the customer

perspective but leave out other stakeholders such as employees and suppliers. The

framework has also been accused of being an overly simplistic representation of the

organization’s performance. Furthermore, research has not been able to determine if the

balance scorecard really leads to positive effects for the organization (Hopper, et al., 2007,

pp.189-190).

Figure 3.1.4 The Balanced Scorecard (Kaplan and Norton, 1992, p.74)

3.1.5 Reward Systems

In an effort to summarize research on reward systems as a management control tool,

Samuelsson (2004 pp. 137-138), lists a number of findings:

Individuals are to a greater degree motivated by the possibility of being rewarded

than the risk of being penalized.

Monetary reward systems are important but at a certain level, non-monetary reward

systems become more important.

The behavior of individuals is controlled by what gets measured.

29

The reward system should be designed in a way that maximizes the possibility for the

individual to influence the outcome.

There is wide consensus that it is profitable for organizations to engage in activities

that stimulates the motivation of the individual.

Figure 3.1.5 The four dimensions of Reward Systems (Samuelsson, 2004, p.139)

The Purpose of Reward Systems as a management control tool is to create employee

motivation and thereby an efficient organization. To ensure that the employee’s motivation

is in line with what the organization wants to achieve, it is highly important to design the

reward system in a way that creates goal congruence (Samuelsson, 2004, pp.140-145).

The Basis for Rewards consists mainly of financial targets and measures. However, an

increase in non-financial measurements as a basis was seen as organizations started

implementing the balanced scorecard. The selected measures that the rewards are based on

are to a large extent prioritized by the employee. Therefore, these measures must be chosen

with care due to the fact that they most likely will determine the future focus of the

organization. Furthermore, the individual must be able to influence the outcome of these

measures. This cannot be said about stock price development as a measure (Samuelsson,

2004, pp.146-151).

The Forms of Rewards in an organization should be based on the situation of the

organization. A number of factors have to be considered in order to optimize the utility of

the rewards. Examples of such factors include; competition for competence, employee

Purpose of Rewards • Management control • Motivate performance • Recruit and maintain human capital

Basis for Rewards • Financial and non-financial

measurements • Individuals, groups, units etc. • Performance evaluation and influence

Forms of Rewards • Monetary compensation • Non-monetary compensation • Ownership shares

Recipients of Rewards • Individuals, groups, managers,

organizations • Aspects of Fairness • Information and Communication

30

motivation, value creation, ownership structure, tax and industry praxis (Samuelsson, 2004,

pp.151-162).

The Recipients of Rewards in monetary forms are in most cases managers. These rewards are

justified with the opinion that rewards are needed on the management level to stimulate

appropriate performance and maintain competence. The broad usage of reward systems on

the management level indicates that such systems will remain popular. Furthermore, a

harmonization among the industrialized countries concerning reward systems can now be

seen, even though the market for CEO’s is hardly harmonized but, in fact, highly

geographically fragmented (Samuelsson, 2004, pp.146-151).

However, not only managers receive rewards. In Sweden it is becoming more common that

the entire organization can receive rewards when the organization performs well. Such

aspects of fairness are important in order to maintain employee motivation, despite the fact

that fairness is a highly subjective subject. Furthermore, when designing reward systems,

aspects such as information and communication have to be considered. The informal signals

that are communicated through the rewards system can influence employee performance.

Furthermore, the reward system should be designed as simple as possible to increase

understanding and ability to give feedback (Samuelsson, 2004, pp.163-169).

3.1.6 Informal Management Control Systems

When measuring output is unambiguous, it is less challenging to manage using formal

control techniques. However, measuring output is not always black and white, requiring

managers to measure the behavior process, watching employees at all times to monitor

their efficiency. As this can be daunting and time consuming for managers, contemporary

management control systems have evolved to include informal mechanisms such as culture,

values, relationships and trust (Ouchi 1979, pp.843-845).

3.1.7 Control System Tightness

According to Merchant and Van der Stede (2007, pp.118-130) the tightness of an

organization’s control system may refer to a number of aspects. One frequently discussed

31

aspect of tightness of that of results control. Another aspect referred to as action control,

involves frequent performance evaluation and budget review routines, commonly linked to

the reward systems of the managers involved in the process. Thirdly, a combination of

multiple forms of control can be used to achieve a greater tightness in the control system.

Finally, tight personnel and cultural control can be suitable for voluntary organizations.

Merchant and Van det Stede stress the importance of establishing clear organizational

objectives before implementing tight control systems. Furthermore, tight control systems

are hardly suitable for all organizations. Organizations exposed to unstable markets may find

the need to provide their manager with enough flexibility and empowerment to successfully

handle the everyday business decisions (i.e. loose control systems). In such situation, tight

control systems may result in significant side effect such as decreasing sales, increasing costs

and recruiting difficulties.

3.1.8 The Contingency Approach

In her work on management control in hospitality industry, Brander Brown (1995, pp.189-

192) holds a general discussion on the so called contingency approach. This theory states

that one system is not generally applicable to all organizations. Rather, the system, in this

case the management control system, should take the organizational context into account

and thereby provide a better match. Abernethy and Stoelwinder (1991) as cited in Brander

Brown (1995, p.191) conclude that an organization will perform more efficiently, if the

management control systems are properly matched to the contingency factors. An overview

of these factors, as discussed by Brander Brown (1995), can be seen in the figure below.

Figure 3.1.8 Contingencies and control (Brander Brown, 1995, p.190)

32

Below, a selection of contextual factors and their implications will be presented (Brander

Brown, 1995, pp.190-191).

The Environment contains factors such as risk, uncertainty, competition, political and social

dynamics.

In a liberal environment, tight management control system is likely the most

appropriate.

In a rough environment, loose management control is likely the most appropriate

The Culture contains factors such as values, beliefs and norms.

Failure to take culture into account when designing the management control system

can cause resistance and eventually failure from realizing the organizational

objectives.

The Organizational Size can influence the management control systems in many ways.

Organizations generally delegate responsibility and accountability as they grow.

Large organizations generally apply formalized and administrative management

control systems, which in fact is linked to better performance. In smaller

organizations, informal and personal control is likely to more appropriate.

Organizational Structures included alternatives such as centralization and decentralization,

vertical and horizontal and functional and geographical.

If responsibility centers are in use, effective management control systems should

reflect their interdependencies.

As interdependencies increase, flexible management control systems are preferred in

relation to formal, tight control systems.

Technology contains factors such as volume and variety of activities, degree of automation

and routineness.

Research suggest that the more automated the operations are, the more formalized

the management control systems should be.

33

Strategy includes both differentiation and low cost.

Differentiation requires increased customer relationship management, frequent use

of non-financial performance measures as well as intensive coordination and

collaboration among business units.

Cost leadership requires the organization to tighten its cost control, minimize

operational costs and establishing a routinized task environment (Anthony &

Govindarajan, 2007, p.68 & Merchant & Van der Stede, 2007, p.727)

3.2 Characteristics of the Hospitality Industry

In order to understand the characteristics of organizations engaged in the hospitality

industry, the authors believe that it is necessary to break the subject into two separate

sections. This is related to the fact that the hospitality industry is a sub-industry of the more

general service industry. Therefore, the prerequisites and the context of the service industry

will first be examined. Secondly, the characteristics and research concerning the hospitality

industry will be examined.

3.2.1 The Service Industry

Organizations in the service industry face different challenges than manufacturing

organizations in many ways. Samuelsson (2004, p.789) mention four features of service

organizations that are important to consider:

The service is often produced and consumed at the same time

The buyer and/or the customer is often involved in the production process

Services are processes that largely consist of interactions among individuals

It is often problematic to describe and demonstrate services before the purchase

Anthony and Govindarajan (2003, pp.684-685), complement the reasoning by discussing four

other features:

The absence of inventory buffer causes service organizations to be more sensitive to

fluctuations in sales volume. The products that remain unsold cannot be recreated or

sold in the future. Therefore, minimizing the unused capacity is a key challenge.

Service organizations usually meet this challenge in two ways. The first way includes

34

marketing and price adjustments to attract customers in the off seasons. The second

way is to create labor flexibility by occupying employees with training or time off

during off seasons.

The difficulty in controlling quality is a specific issue in service organizations, in

contrast to manufacturing organizations. Consequently, services are usually

evaluated in subjective manners as it is problematic to evaluate the service before it

is produced and consumed.

The labor intensity of service organizations cannot be reduced by replacement with

fixed assets.

Multi-unit organizations are common in the service industry. Examples of such

organizations include hotels, restaurant chains and gas stations. This feature enables

the organizations to effectively benchmark internally. However, in many cases, the

business units differ in product mix and market prerequisites which complicate

benchmarking.

3.2.2 The Hospitality Industry

As mentioned in the introduction of this study, the European hospitality industry is

dominated by SME’s (European Commission, 2004, p.11). This fact is likely to have significant

effects on the choice of management control systems, something which will be discussed in

more detail throughout the remainder of this study.

The Three Domain Categorization

Several conceptual publications concerning hospitality management were published in the

UK around the year 2000, including Brotherton (1999), Lashley (2000) and Lashley and

Morrison (2000). These studies mutually categorize the basis for understanding the

hospitality industry into the domains, referred to as the social domain, the private domain

and the commercial domain.

Lashley (2000, p.5) defines the social domain as:

“…social settings in which acts of hospitality and acts of hospitableness

take place together with the impact of social forces on the production

and consumption of food/drink/and accommodation.”

35

Lashley and Morrison (2000, p.39) define the private domain as:

“…the giving of food, drink and sometimes accommodation to people

who are not regular members of a household.”

Lashley and Morrison (2000, p.12) state that the commercial domain includes:

“…acts of hospitality [that] are entertained for calculative purposes:

the business lunch, or the office Christmas party are not primarily

redistributive or undertake for reasons which primarily value

generosity and good behavior as a host.”

The Contextual Approach

In his article Finding the Hospitality Industry, Slattery (2002, pp.19-28) criticizes the

aforementioned three-domain categorization of the hospitality industry for a number of

reasons. First and foremost, Slattery claims that such a categorization degrades the

hospitality industry because it does not regard the industrial contexts and the essential

features needed to understand the industry. Slattery therefore suggests that in order to

understand the hospitality industry, a contextual approach is needed. The three contexts

suggested are the industry context, the corporate context and the venue context. These

contexts will be examined below.

The industry context contains the entire hospitality industry which includes a large variety of

organizations not necessarily primarily engaged in hospitality. The structure of the industry

can be seen in table 3.2.2 below. Organizations such as hotel resorts, theme parks or cruise

organizations often offer a substantial amount of services related to the core competencies.

Slattery uses the major Las Vegas hotel venues as examples and argues that the three

domain categorization is inadequate because the variety of services provided by these

venues hardly fall within the scope of the three domain categorization. In such venues,

leisure (i.e. gambling, musical performances etc.) is increasingly integrated into the

organizations and complements the hospitality. This is explained by an increased diversity in

customer demand. Therefore, Slattery argues, a conceptual framework of the industry

context should also provide the scope for a wider range of activities (Slattery, 2002, pp.23-

24).

36

Free-Standing Hospitality Businesses

Hospitality in Leisure Venues

Subsidized Hospitality

Hospilaity in Travel Venues

Hotels Casinos Workplaces Airports Holiday Centers Bingo Clubs Health Care Rail Stations

Quasi Hotels Night Clubs Education Bus Stations

Cruise Ships Cinemas Military Ferry Termnials

Time-Share Theatres Custodial Aeroplanes

Bars Sports

Stadiums Retailers Trains

Restaurants Theme Parks

Ferries

Attractions

Health Clubs

Table 3.2.2 The structure of the hospitality industry (Slattery, 2002, p.24)

The Corporate Context of the hospitality industry is characterized by a progressive trend

towards consolidation. Between 1985 and 2000 hotel chains in the UK increased their room

stock by 59 per cent, or, in other words, a net average of 5300 rooms was added annually.

The consolidation trend can be seen throughout the hospitality industry. The main reasons

for this include striving towards greater efficiency, greater capital access and the career

possibilities offered by consolidated organizations. A study by Slattery (1999) suggests that

the number of hotel rooms in the world will double by 2030 to around 30 million units. The

growth will originate from consolidated organizations, while the number of rooms related to

unconsolidated organization will remain stable. Quasi hotels, such as bed-and-breakfasts,

will continue to decline (Slattery, 2002, pp.24-25).

The Venue Context is the operational level of the hospitality industry, where all customer

experiences occur. According to Slattery (2002, p.25), the three domain categorization is, in

this aspect, yet again proven inadequate for two main reasons:

First, the three domain categorization views the hospitality industry as an industry providing

food, drinks and accommodation, however not experiences. Thereby, one of the primary

competitive advantages of many hospitality organizations is effectively detracted. From that

37

point of view, a restaurant is essentially compared to a grocery store and therefore, the

surcharges of the restaurant cannot be justified.

Second, such a simplistic view of the hospitality industry rather retracts restaurants and bars

in the value chain to the level of retailers. However, it is not uncommon for restaurants and

bars to serve as retailers and hospitality organizations simultaneously and they are, in fact,

part of the distribution system. In the UK, the larger brewing companies are often vertically

integrated organizations, structured around a producer, a wholesaler and a retailer. The

pubs became regarded as retailers rather than hospitality venues and declined more than

any other hospitality business during the twentieth century.

Slattery (2002, p.25) argue that two factors main factors differentiate hospitality venues

from retailers. First, “hospitality customers consume with the venue” and second, retail

customers “consume [the product] on their own terms without any involvement of the

retailer.

3.3 The Use of Management Control Systems in the Hospitality

Industry

Based on previous research of the hospitality industry, it is notable that many organizations

in this are small to medium sized enterprises and therefore, applying management control

systems designed for large organizations is not always applicable. Furthermore, the

increased amount of customer interaction compared to other industries creates the need for

managers to have a more heightened focus on customer relationships. One of the main

articles used for the basis of this section was conducted by Phillips and Louvieris (2005). By a

multiple case study, the authors researched 10 UK based SMEs in the hospitality industry

that had won accolades either nationally or regionally. By using this approach, they aimed to

understand how management control systems were being used in highly successful

organizations in the industry.

Theories mentioned in this section are specific to the hospitality, anything not mentioned

can be assumed to be the same as general theory described in section 3.1.

38

3.3.1 Planning

Operating Budget

Organizations in the hospitality commonly utilize tools of financial evaluation. Furthermore,

it has become quite common to use digitalization aids such as point of sale systems to collect

and analyze relevant information as they feel timeliness and accuracy are key to success. The

main areas of daily financial evaluation in these organizations include cash flow, profit

performance, and labor costs. The labor intensity, as explained in section 3.2, makes the use

of labor related performance measurements highly important for organizations in the

hospitality industry. This is generally done by forecasting these figures using the

aforementioned digitization programs, and compiling the information into an operational

budget which is regularly evaluated (Phillips and Louvieris, 2005, p. 205).

In a literature review presented in the Cornell Hospitality Quarterly in 2010, the authors

discuss a study conducted by Schmidgall and DeFranco (1998) on budgeting practices in the

lodging industry. It was also found that the operating budgets are commonly used in the

hospitality industry, yet they are not commonly flexible; most of the respondents did not

adjust their budget during the period (Schmidgall and DeFranco, 1998 cited in Hesford and

Potter, 2010, p. 507).

3.3.2 Performance Measurement

In their paper Hospitality management accounting, Potter and Schmidgall (1999, pp.393-

396) discuss the importance of, and the issues related to, performance measurement in the

hospitality industry. First, as in any industry, performance measurements serve the purpose

of implementing strategy, focus the organization on value based management (if applied)

and focus on shareholder value creation. Secondly, and increasingly specific for the

hospitality industry, is the importance of performance measurements as a basis for manager

compensation. Therefore, the outcome of the manager’s effort must be reflected in the

manager’s compensation. However, caution should be taken to prevent dysfunctional

behavior in terms of manipulation. Thirdly, and highly specific to the hospitality industry, is

the importance of performance measurements related to human resource management.

According to Potter and Schmidgall (1999, p.393), performance measurements of human

resource management stimulate appropriate behavior and learning, if used in a sound

39

manner. To achieve such goals it is important that the measure is concerned with activities

that are considered to be of strategic importance for the organization. Furthermore, the

employee’s understandability of the measure and the responsiveness of the measure are

factors to consider upon selection.

When evaluating separate business units, Geller and Schmidgall (1980 cited in Potter and

Schmidgall 1999, p.390) go on to make another interesting claim in regards to organizations

operating in the hospitality industry – overhead expenses are not allocated to individual

business units though they indirectly benefit them. Therefore, if efforts were made to

determine a reasonable and fair basis for assigning these overhead costs, it may increase the

efficiency in how unit managers use these resources. That being said however, Anthony and

Govindarajan (2007, p. 271) make one exception to the allocation of overhead costs when

assigning responsibility to individual business units; in certain service organizations, in which

the cost of capital is insignificant, it may not be beneficial to assign these costs to improve

efficiency.

In the US, the Hospitality Financial and Technology Professionals (HFTP) first published a

uniform system of accounts for the hospitality industry in the 1920s. The 9th revised edition

was published in 1996 and included the following breakdowns of Lodging, Restaurants and

Clubs. (Potter and Schmidgall, 1999, p.388):

A study by Kwansa and Schmidgall (1999) suggested that compliance with the uniform

system of accounts was not widespread. Instead, a variety of financial performance

measurements are applied in the hospitality industry. Examples of such measurements were

discussed in the previously mentioned study by Schmidgall and DeFranco (1998) on the

lodging industry. In their findings, the authors present revenue per available room (RevPAR),

net income, operating profit, and EBITDA.

40

Potter and Schmidgall (1999, pp.393-394) quote The Securities and Exchange Commission's

critical view on alternative performance measurements:

“Until new and uniform measurement principles are developed and

approved for an industry, the presentation of measures of

performance other than net income should be approached with

extreme caution.” (Potter and Schmidgall, 1999, pp.393-394)

Jones (2005, p.164) stresses the notion that as information on performance becomes more

accessible through digitization, the importance of the manager’s selection increases. For

hotels, which often measure substantial amounts of performance variables, such selection

processes become particularly important.

Benchmarking

Many hospitality firms use benchmarking as a performance measurement tool to evaluate

changing market conditions in their area. By evaluating the organizations performance

against comparable competitors in the area, it can give valuable insights to inefficiencies

within firm.

Non-Financial Performance Measurement

Non-Financial performance measurement in hospitality was cited by an overwhelming

number of executives as key to success in the articles reviewed by Hesford and Potter (2010,

p. 507). These non-financial measurements include employee attitudes, guest satisfaction,

and superior product as most critical to success. The two former measurements are most

commonly monitored in this industry. These measurements are related to the prerequisites

of the service industry, discussed in section 3.2. Measuring employee attitude and efficiency

is done in a two ways; both quantitatively and qualitatively. Quantitatively, it is often

measured in wages paid as a percentage of revenue. Qualitatively, regular performance

evaluations are done by management appraisals, peer assessments, and customer

evaluations (Phillips and Louvieris, 2005, pp. 206-207).

Customer relationship management is essential to success in the hospitality industry.

Common techniques to manage customer relationships include building customer profiles,

communicating with customers to establish loyalty, and measuring their level of satisfaction

(Phillips and Louvieris, 2005, pp. 206-207). Customer profiling allows organizations to

41

understand who their customers are, and what they desire. The organization should be

aware of how much their typical customer earns in a year, where they come from, and what

they expect from their visit. Face-to-face interaction between staff and customer helps

create loyalty and allows the staff to get immediate and accurate feedback. Though this is

more of an informal technique to manage customer relationships, it is an extremely

important aspect of customer management.

Measuring customer satisfaction formally is also commonly done in the hospitality industry.

This is done using mystery customers, focus groups, comment cards and/or formal surveys.

Once this information is collected, it is common for these organizations to develop targets

and goals for its staff to focus on. The reports highlight problem areas (as well as success

areas), making it easier to communicate what steps need to be taken to improve the

customer’s experience (Phillips and Louvieris, 2005, p.206).

The Balanced Scorecard

Phillips and Louvieris (2005, p. 201) found that none of the organizations studied used the

balanced scorecard as a management control tool; however, the elements of the tool

(though slightly altered from originally presented by Kaplan and Norton (1992)) were found

to be used in each organization’s performance measurement. The four elements are as

follows: (1) the use of budgetary control in an effort to increase total revenue; (2) customer

relationship management; (3) strategic management vis-à-vis the internal business

processes and; (4) collaboration to drive innovation and learning.

Phillips and Louvieris (2005, p.208) do however offer certain criticisms of hospitality

organizations in regards their use of balanced scorecard elements in their management

control systems. They suggest that in order for them to improve, these organizations should

take a more balanced approached to the above-mentioned theories. Often they are too

focused on budgetary control and lack enough attention on customer relationship

management. Moreover, many organizations that use digitization aids to retrieve and

analyze information are not fully integrated. They operate with a combination of electronic

systems and paper and pencil, vastly slowing down the speed and accuracy of analysis.

42

3.3 Theoretical Summary

As contemporary management control systems differ from what has been traditionally used,

many theories have been examined to better describe the design and use of these control

systems. The main theories are as follows:

Proactive and Reactive Leadership Performance Measurements

Value and Cost Based Management Business Unit Performance

Diversification Non-Financial Measures

Porters Generic Strategies Customer Relationship Management

Responsibility Centers Employee Morale

Strategic Plan Reward Systems

Capital Budget Balanced Scorecard

Operating Budget Informal Control

Forecasting Control Tightness

Digital Data Collection and Analysis Contingency Approach

Benchmarking

It should be noted that the authors felt it appropriate to add product market and product

life-cycle as contingency factors to help explain the design of management control systems.

Characteristics of these theories that are specific to the hospitality industry include:

A strong customer focus Non-financial measures

The labor intensity Informal control

Benchmarking Loose control

43

IV. Empiricism

In this chapter the authors present the findings from the four individual units of analysis

included in this study. Each organization is described in terms of background, situational

factors, strategy & management philosophy, organizational structure and management

control systems. It should be noted that the use of management control tools varies in each

unit of analysis. Therefore, the absence of discussion of certain control tools should be

interpreted as though they are presently not used.

4.1 BrewPub København

BrewPub København is a restaurant and pub with its own on site microbrewery located in

the center of Copenhagen. This young, highly rated pub benefits from heavy foot traffic due

to its great location; it lies just off a main square (Rådhuspladsen) and is a stone’s throw

from Tivoli. In the summer months, the large patio allows the pub to double in size but still

keeps its warm and relaxed feel. Though food revenues are nearly equal to what the pub

makes on alcohol, the wide selection of both draft and bottled beers is undoubtedly their

focus. The brewpub employs 24 people and is owned by five shareholders; of whom one is

also the managing director.

4.1.1 Strategy & Management Philosophy

Since it opened in September 2004, BrewPub København's main goal has been to eliminate

debt capital by operating an interesting and successful business. To achieve this goal, they

aim to offer quality beer and food. Mr. Jens Mortensen (2011), the managing director of the

brewpub, believes that to solidify the organization it is necessary to control the costs in

every aspect of its operations. However, he says he understands that cost control must be

achieved without sacrificing quality. He also keeps a keen focus on on-time deliveries within

the supply chain. Another important aspect to their strategy, according to Mr. Mortensen, is

to identify and retain key customers. To achieve this goal, the brewpub has created a "Brew

Club" to reward regular customers with discounts and a more personal experience. The pub

has also established what he refers to as "Relationship Marketing" with local tourism

businesses as another strategy to attract customers.

44

The management team and shareholders regularly discuss the medium to long-term plans

and goals of the brewpub as it is still young and developing awareness. These plans include

contracting their recipes to large breweries capable of producing enough for distribution as

well as expanding the brand name to cities such as Malmo, Århus, and Oslo. Mr. Mortensen

believes these long term strategies will open up new streams of revenue and help spread the

BrewPub København name.

Mr. Mortensen is a proactive leader. He believes in the value of team orientation and

requests that both his business unit managers and lower level employees make immediate

decisions as situations arise. He believes this will yield the best outcomes for the

organization. It is also his belief that giving up control and delegating responsibilities to each

business unit will teach them to be self-reliant as they learn from mistakes and develop the

skills needed to make key decisions. For this philosophy to be effective, communication and

trust are at the very core of the brewpub's management control.

4.1.2 Organizational Structure

To support this proactive leadership style, the organization has been split into three separate

units, each with its respective business unit manager. The brewery and kitchen can be seen

as production units, while the restaurant/bar is the organization’s sales unit. Mr. Mortensen,

along with the master brewer and head chef, regularly communicate to make sure each unit

contributes to the overall goals of the brewpub. Figure 4.1.2 gives a visual representation of

how the organization is structured.

Figure 4.1.2 Organizational Structure of BrewPub København (Sicari and Söderlund, 2011)

45

Though the flow of communication is very open, each unit works independently in regards to

their own operations. Procurement of raw materials (food, grain, hops, cleaning supplies,

etc.) is handled by each business unit manager and evaluated every third month for price

changes, quality, quantity, and on-time deliveries. Staffing and employee management is

also done independently as there is little personnel movement across business units.

Moreover, each manager is responsible for scheduling the appropriate amount of labor

hours as it has a large effect on their individual contribution margin.

4.1.3 Management Control Systems

Annual Budget

BrewPub København prepares a yearly operating budget (covering the calendar year,

beginning on the 1st of January) as their main performance evaluation tool.

Each business unit manager is heavily involved in the budget preparation process which

begins in September and is completed before their busy season in November. Internal

benchmarking is the first step in planning their resources for the upcoming year. Initially,

they look at what they did in past years during the same time period as a jumping off point

to prepare the budget. However as it is equally important to understand how external forces

affect sales, the management team then makes adjustments to their projections based on

the current economic climate. For example, the brewpub expected a decrease in sales in

2010 as the industry as a whole saw a sales decrease of 10.15%.

As shown in Exhibit 1.A of the appendix, the yearly budget is extremely elaborate. First, the

budget aims to project both monthly and yearly revenues for all direct goods sold both

internally and externally. These projected revenues are broken down into categories such as

meat, fish, and vegetables as well as beer, wine, and spirits. Subsequently, the process is

repeated to anticipate the cost of these goods, further broken down into the raw materials

used to produce them. Also included in the budget are separate sections for indirect costs,

marketing costs, administrative expenses and rent & utilities. The next section of the budget

breaks down each labor cost expected for the upcoming year; this includes not only salaries

and wages, but other labor costs such as sick pay, holiday pay, and bonuses. Finally, the

46

budget breaks down the financial and capital expenses expected for the year. Included in

this report is depreciation on fixed assets and different categories of interest expense.

Performance Measurements

Accompanying the yearly budget are two monthly financial performance reports which are

designed for separate purposes: (1) to evaluate the performance of each business unit based

on contribution margin; (2) to help communicate the organizations performance with the

shareholders. This second report, though designed as an external financial report, is also

used internally by the unit managers as a control tool.

The first financial evaluation report is prepared monthly for the pub’s business unit

managers. The main goal is to evaluate how each business unit is contributing to the success

of the business. Just as the budget is broken down into different categories, this report does

the same. For a detailed view of each category, see Exhibit 1.B in the appendix.

In addition to evaluating each unit’s contribution, the report is also used to measure

employee efficiency. The key performance indicator used to measure employee efficiency is

“Labor Cost as a Percent of Revenue.” This ratio is separated to measure each business unit

separately. For example, if Mr. Mortensen calculates that it takes more working hours than

anticipated to produce the same revenue in the kitchen, steps must be taken to improve

efficiency in that unit.

Finally, the report is also used as an indicator that something irregular might be occurring

within day to day operations. If actual costs or revenues are not in line with what has been

budgeted, it should raise a flag that something could be wrong and it must be evaluated

further. However, the financial report is broken down both by month, as well as by year to

date. So if, for example, the cost of wine is exceptionally high for the month of May but on

target for the rest of the year, that may indicate that a large shipment was purchased that

month, but overall it is fine for the year. On the other hand, an irregular contribution margin

gives a different indication than an irregular cost. A contribution margin that is too high

might mean that the customer may be getting a smaller portion than they should be; a

margin that is too low may indicate employee theft.

47

The second monthly report is designed for the shareholders and creditors but also used for

business unit managers as an internal control tool (shown as Exhibit 1.C in the appendix). It

is much less detailed than the report designed for the unit managers, but it paints a very

clear picture of how the brewpub is performing financially. It begins by presenting their

actual income statement compared against what they had budgeted to earn. This

information is again broken down for both the individual month, and for year to date. It is

also compared against the figures from the previous year. Following the statement of

income, the report measures efficiency in labor hour worked for each unit and presents the

gross profit earned from both the kitchen and restaurant.

Non-Financial Measurements

Measuring customer feedback can be difficult according to Mr. Mortensen. “From a scientific

point of view, I feel customer surveys are not very accurate because we just get the answers

we want to hear, and little more.” Instead, the pub uses “secret shoppers” a few times a

year, requesting that they fill out a detailed questionnaire.

Customer complaints, though seemingly detrimental to the business, are an important

measure of customer satisfaction and ultimately yield positive results for the brewpub.

Complaints are an indication that poor business practices need to be corrected; servers are

instructed to take immediate action to accommodate the unsatisfied customer by offering a

free beer or coffee. In certain circumstances the server is to use their discretion if further

action is required. The brewpub managers require that this activity is recorded so the

problem can be addressed and prevented from happening again.

Servers are the primary quality control agents; it is required of our wait staff to refuse to sell

bad dishes that they receive from the kitchen. Each server is also trained to detect the most

common beer failures. At the start of every day, each server is required to taste each beer

from every tap for imperfections. Off-tastes may be caused by a problem with the tap lines

or with the individual kegs. If there is a problem with the beer they are instructed to mark

the keg and it reevaluated later in the day.

48

Reward Systems and Informal Control

The brewpub works with employee incentives as a corrective action to discrepancies found

in the financial report. However, the main goal in using incentives is not only to reduce costs;

it is more important to correct employee behavior. For example, they have recently

introduced a bonus system in the kitchen. The monthly report shows that the cost of gas is

more or less the same in January as it is in December. However based on the sales revenue

in each period, they had budgeted for a much smaller amount in January than they actually

used. They figure that if their cooks turned off burners when they’re not being used, it

should be possible to decrease the cost of gas by at least 20 percent. To correct this

behavior, the pub agreed to give the kitchen staff a percentage of the savings in the form of

gifts and coupons if they are able to hit the target.

Mr. Mortensen believes that incentive plans must be equally distributed across each

business unit. In an effort to increase sales, the wait staff is encouraged to push a special

“welcome drink” to each customer as they arrive. To facilitate this effort, the brewpub offers

5 crowns to the server for every welcome drink they sell. It may not be much, but since they

began this incentive plan they have seen a dramatic increase in welcome drinks sold.

It is widely understood by every employee that a new bonus system will be implemented

each month. Furthermore, their input is a very important part of how the bonus is received.

As taxes make it a disincentive to receive rewards in cash, the pub offers a number of

options for employees to choose from including cinema and arena coupons, among others.

By including them in this decision, the managers believe the incentives become more

valuable.

Mr. Mortensen meets individually with each staff member at least twice a year. Though it is

quite time consuming, he feels it is effective to evaluate employee morale and help

operations run more smoothly. “The meetings are very informal, not in a controlling manner,

just a discussion about how things are going and how they feel about working here.” He also

works behind the bar once or twice a month to get another perspective of how things are

running.

49

Mr. Mortensen believes there is a good balance between control and trust at BrewPub

København as he feels it is necessary to trust his employees in order to establish a

comfortable working atmosphere that revolves around teamwork. However he says he is not

naïve; the use of financial reports, as discussed above, makes it quite easy to detect

employee theft in the event that contribution margins are out of the ordinary.

4.2 Färs & Frosta Sparbank Arena (FFSA)

Färs & Frosta Sparbank Arena is a newly constructed arena located in the southern part of

Lund, Sweden. The construction was completed in September of 2008 and has since been

used mainly for professional handball but also for concerts, conferences, and cultural

venues. FFSA, which is a non-profit organization, consists of a main hall with room for 3,000

spectators and surrounding buildings with an ice skating rink and a smaller athletics hall.

(Färs & Frosta Sparbank, 2008).

The arena is owned by a holding real estate company which is controlled by the municipality

of Lund together with a private real estate organization called Paulssons Fastigheter. The

holding company leases the arena to a foundation whose function is to operate FFSA. The

board of the foundation consists of three representatives from the municipality and two

representatives from private real estate organizations. The internal organization employees

only five people, however during events this number is vastly increased. The additional staff

is managed by various forms of external agreements. In an interview with Berne Nilsson,

CEO of FFSA, he claims that this relatively complex ownership structure was created mainly

for two reasons; tax purposes and to increase the speed of decision making. Distancing the

operative decision making from the political bureaucracy was therefore necessary. In just

over 2 years, Paulssons Fastigheter will convey their control of the foundation and FFSA will

be completely controlled by the municipality of Lund.

In 2010, FFSA generated revenues of 7 MSEK and costs of 14 MSEK. The operating loss is

funded by the municipality of Lund.

50

4.2.1 Strategy and Management Philosophy

The strategy of FFSA is formulated in the purpose of the foundation and consists of 3

operational categories.

First, FFSA shall arrange professional sporting events and practices to support the

local handball team.

Second, as a part of the municipality of Lund, FFSA shall arrange activities for children

and youth.

Third, FFSA shall organize conferences, meetings, concerts and other types of events

that increase the rate of occupancy.

The support of the local handball team is the prioritized category and the third goal is

considered to be supporting activities to ensure financial stability. However, in an interview

with Partik Redgård, Marketing and Sales Manager of FFSA, he points to the fact that these

operational categories are not easily balanced between. Because of the fact that the rent

that the handball team is charged is highly subsidized, FFSA must balance between the

economical interests and the social interests. This balance makes the goals of the FFSA

unclear since the organization in itself is considered less important than the handball, from

this perspective.

The most important customers of FFSA include organizations like Tetra Pak, Ericsson, Alfa

Laval and the municipality of Lund. Mr. Nilsson usually handles these customers himself and

he tries to be responsive to requests and criticism. To be able to offer food, beverages and

production technology during the various types of activities, FFSA works closely together

with an organization called Arena Evenemang & Catering (henceforth AEC). This cooperation

is based on a contract between the two organizations, stipulating specific regulations. Mr.

Redgård explains that initially FFSA was only meant to provide the facility and AEC was

meant to handle all other services. However, FFSA now handles marketing, sales,

maintenance and public relations while AEC handles catering, the café and technical

equipment.

51

According to Mr. Redgård, the strategy of FFSA is modified on a daily basis. Because of the

novelty of the organization, the owners and the management were not sure of what could

be expected of the arena. The three categories of activities were implemented from day

one. However, the appropriate relativity of the three was not clear. Therefore, the strategy

is still not entirely confirmed but rather flexible to the outcome.

The management philosophy of Mr. Nilsson is characterized by informal, personal

interaction with his employees, fundamentally based on trust. He believes in empowering

his employees and thereby giving them authority do their job to the best of their abilities.

However, Mr. Nilsson also stresses the importance of responsibility and accountability. His

employees must understand the prerequisites and the conditions of the FFSA.

4.2.2 Organizational Structure

The organization of FFSA consists of five full time employees who are responsible for the

daily operations. Other functions such as cleaning, food and beverages and caretaking are

organized by contracts. The agreement between FFSA and AEC is based on a fixed monthly

rate and a variable rate depending on the sales. The contract explicitly controls the opening

hours, the offerings and the level of service required from AEC. Because of the fact that AEC

is dependent on the activities arranged in the arena, the management of both organizations

work closely together.

Figure 4.2.2 Organizational Structure

of FFSA (Sicari and Söderlund, 2011)

52

4.2.3 Management Control Systems

Benchmarking

Benchmarking is primarily done internally, against past years. However, the first couple of

years resulted in some unexpected costs which made benchmarking less effective. Mr.

Nilsson believes that in five years benchmarking will be a better tool for FFSA because of the

increased predictability of the operations.

External benchmarking against regional competitors is also used to some extent. However,

Mr. Nilsson believes that such benchmarking can be problematic because of the different

prerequisites of each arena. Generally, the municipalities in which the competitors are

located support the arenas financially. According to Mr. Nilsson, there is not a single arena in

Sweden that breaks even. Therefore, external benchmarking becomes less relevant and

effective.

Annual Budget

The one year budget is the main control tool of FFSA (please see Exhibit 2.A in the appendix).

According to Mr. Nilsson, the entire staff is involved in the process of creating the budget.

However, Mr. Nilsson together with the accountant has the main responsibility. Once the

budget is completed, it is broken down into the respective areas of responsibility.

Discretionary expenses such as accounting and human resources are not allocated

downwards in the organization but are accounted for as a lump sum.

The process of constructing next year’s budget is initiated after the summer. The estimations

are based on what kind of activities that have been planned for the coming year. Thereafter,

Mr. Nilsson presents the budget for the foundation, giving them the opportunity to criticize

the estimations. Evaluations of the budget are conducted quarterly in connection with the

foundation meeting. However, an explicit, written budget is not constructed during this

process. Instead, the quarterly profit and loss statement is used for this purpose.

53

The yearly budget is solely based on the FFSA and does not include AEC. However, the

revenues originating from the AEC amount to roughly 7 % of the total revenues of FFSA.

Therefore, when FFSA does not attract enough activities, the financial impact is amplified

because of the loss of the sales related revenues from AEC.

In addition to the operating budget discussed above, FFSA also uses a cash flow analysis. A

capital budget has not yet been developed because of the novelty of the arena. In 2012,

when investments are likely to become necessary, Mr. Nilsson plans to develop one.

Due to the fact that FFSA has been operational for 2 years, Mr. Nilsson has recently begun

working with forecasts. In the start up phase of the arena, forecasts were problematic to use

because of the difficulty to estimate costs, revenues and customer profitability. Today,

however, Mr. Nilsson says that he has an understanding of the business and what can be

expected. During 2009 and 2010 the forecast have been relatively accurate and constant in

terms of revenues. The forecast for 2011 was initially positive but the outcome was lower

than expected. According to Mr. Nilsson, the handball world championships did not generate

the expected revenues and some planned concerts have been postponed.

Non-Financial Measurements

Mr. Nilsson considers the number of spectators to be the most important non-financial

measurement. Furthermore, it is important for FFSA to show that a substantial width of

activities is being arranged in the arena. Customer satisfaction is measured by AEC as their

employees handle most of the customer interaction. The activities themselves are

problematic to evaluate because of the subjectivity involved.

Reward Systems and Informal Control

FFSA does not utilize any formal forms of reward systems. Mr. Nilsson does however believe

in the importance of informal reward such as company parties etc.

Mr. Nilsson considers himself to be a hands-on leader of his team. He trusts his employees

to a large extent and avoids using rules and guidelines. Mr. Redgård explains that informal

control is significantly used in FFSA. He states that the team has frequent informal meetings

54

where Mr. Nilsson coaches the team members and gives them feedback. Mr. Redgård sets

his own goals and targets and as long as he is on the right track, he is free to work in his own

way. Mr. Redgård’s sales figures are not formally reported to Mr. Nilsson. Instead, they

discuss the progress in an informal, personal manner.

4.3 Kulturmejeriet

Kulturmejeriet is a non-profit organization in Lund, offering a variety of cultural activities

including concerts, theaters, cinematography, musical tutoring, rehearsal facilities, night

clubs and more. The organization is a member of the European network for cultural

organizations, Trans Europe Halles. The non-profit commitment of the people involved in

Kulturmejeriet is one of the fundamental prerequisites on which the organization is based

(Mejeriet, 2011). Its full time staff is limited to four employees, as well as one part time

accountant.

The organization is situated in a former production facility for dairy products, hence the

name Kulturmejeriet (Dairy Plant of Culture). In 1968 the dairy production was moved to

Malmö and the facility remained unused until 1986 when it was transformed into a concert

hall and a cultural meeting place. However, the decision to transform the facility into a

concert hall was not obvious. During the early 1980’s the association Mejeriet was formed to

represent the supporters of creating a cultural meeting place in Lund. After a 3 MSEK

donation from “Craafordska Stiftelsen” in 1985 the decision was made to create

Kulturmejeriet (Mejeriet, 2011).

4.3.1 Strategy and Management Philosophy

The goal and strategy of Kulturmejeriet is to be a culture center and a culture incubator for

Lund. In an interview with the Managing Director of Kulturmejeriet, Mr. Matti Kortelainen

(2011), he explains that one of the most important challenges for his organization is to

market Kulturmejeriet on the political level and on the consumer level. Due to the non-profit

nature of the organization, the strategy is closely linked to the passion and the voluntarism

of the people involved. The personal passion for the outcome of the work is what drives

55

Kulturmejeriet forward. The strategy in terms of content is to offer alternative productions,

rather than mainstream productions.

Except for revenues generated from the activities, Kulturmejeriet is also funded by the Arch

council of Sweden and the municipality of Lund. The main financial objective is therefore not

to make a profit but to maintain a stable financial state of operations. This includes risk

assessment of the various concerts selected to be included in the offering. Furthermore, a

personal goal of Mr. Kortelainen is that everyone involved should be able to receive a decent

salary. According to Mr. Kortelainen, there is no possibility to earn money in the Swedish

cultural business which he feels makes tools of financial analysis less relevant. The member

associations all have independent strategies of content and financial performance.

Mr. Kortelainen describes his management philosophy as one based largely on trust. In the

culture business, a management control system should not be based on control but rather

encouragement and empowerment. This view differs, according to Mr. Kortelainen, from the

general view in traditional business where a greater degree of control could be necessary.

Communication, openness, feedback and trust are the main ingredients in the management

philosophy of Mr. Kortelainen.

4.3.2 Organizational Structure

Kulturmejeriet is an umbrella organization with six independent member associations. The

umbrella organization, which is the organization of which Mr. Kortelainen is Managing

Director, only controls the building in which the organization is situated and the corporate

brand. The content offered, however, is controlled by the member organizations. The

independence of these organizations varies. For example one of the associations,

Månteatern, does not arrange any of the content associated with Kulturmejeriet.

Furthermore, they receive separate funding from the municipality of Lund. Their

involvement in Kulturmejeriet is not much more than a formality, originally for political

reasons. The umbrella organization is the main unit of analysis. However, the association

Repeater has been included to provide insight into the operational management control

56

systems used on the association level. The bar, which is owned and controlled by an

external organization, will not be included in this study.

A peculiarity which influences the daily work of Mr. Kortelainen is that the managers of the

member organizations are also active board members of the umbrella organization

Kulturmejeriet. This structure causes the managers of the associations to partially act as Mr.

Kortelainen’s employees and partially as his governing board members. The board consists

of two representatives from each member association. According to Mr. Kortelainen, a

restructuring of the organization due to the aforementioned potential for conflict, has been

discussed and is being considered. Such a change would involve creating one business unit

responsible for the content at Kulturmejeriet and appointing external board members.

According to Mr. Kortelainen, a formal operative structure has been created. However, from

his perspective, this structure is more of a formality than an actual control system. The

organization is rather characterized by an informal power structure among the member

associations. This structure is made explicit in the planning and coordination of the activities,

even though the content coordinator is officially responsible for this process. Certain

activities are considered more important than others, giving them first priority in the

planning process. Furthermore, the associations Repeater and Plektrum combined, account

for roughly 80 % of the content, giving them the highest priority.

Figure 4.3.2 Organizational Structure of

Kulturmejeriet (Sicari and Söderlund, 2011)

57

4.3.3 Management Control Systems

Annual Budget

On the umbrella organization level, the budget is the main control tool (please see Exhibit

3.A of the appendix). The process is managed by Mr. Kortelainen together with the

accountant. The Marketing and Information Coordinator, the Technical Manager and the IT

Officer are also included in the handling of their respective budgets. The janitor creates a

budget solely based on past experience. It is not a periodically limited process but rather a

continuant process due to the political influence. However, certain focus is placed into the

budgeting process at the end of each calendar year, preparing for the start of the new

budget year. At this time, the budget is also presented to the board of Kulturmejeriet.

Budget feedback is conducted monthly by Mr. Kortelainen and more thoroughly every

quarter. Given the non-profit nature of the organization, cost awareness is consistently

taken into consideration when planning the activities. The estimations included in the

budget process are primarily based on political decisions, internal benchmarking against past

years and planning of future needs (Kortelainen, 2011).

According to Mr. Kortelainen, allocation of the public grants is an issue in the organization.

This is closely related to the aforementioned governance issue of the board members being

association managers. Because of the strong self-interest and bias involved in the work of

the board, fund allocation is hardly handled objectively.

On the association level, the managers of the associations construct their own operational

budgets. Mr. Jakob Svensson, the Concert Manager for Repeater, budgets for each planned

concert and club event in detail (please see Exhibit 3.B of the appendix). Since there is

considerable risk involved of not attracting enough audience, the focus of the budget is to

break even. Even though the ticket prices are meant to cover all expenses, according to Mr.

Kortelainen, the potential for profit lies not in the ticket sales but in the sales generated in

the bar. The member associations do not pay Kulturmejeriet for the use of the facility.

However, they are accountable for the variable costs such as technical production costs.

58

Capital budgeting for Kulturmejeriet is mainly handled by the city of Lund, due to the fact

that the house is owned by the municipality. Therefore, major investments, such as new

technical equipment, renovations etc. are handled by the city of Lund. Smaller investments

are handled by Mr. Kortelainen, using a cash flow analysis. A cash flow analysis is perceived

to be better suited for Kulturmejeriet because of the unpredictability of the smaller

investments.

Reward Systems and Informal Control

Informal controls are substantially used in Kulturmejeriet. As previously mentioned, Mr.

Kortelainen is convinced that frequent communication and employee feedback is the key to

running a successful cultural organization. Reward systems are seldom used except for in the

form of giving the employees some extra free time when possible.

4.4 Scandic Hotels

Scandic Hotels is an international hotel chain currently operating 160 hotels in 9 countries

across Northern Europe and employs nearly 6,600 people. Their primary focus is in the

Nordic countries (especially Sweden), where it owns and operates the majority of its hotels

and has become the leading hotel chain in the region. In 2007, Scandic was acquired by EQT

Partners (a private equity firm) and since tightened the control of its day to day operations

(Scandic Fact Sheet, 2008). According to Mr. Thomas Tegfors (2011), the General Manager

for Scandic Kramer, in the short time since the acquisition, improved efficiency is noticeable

in Scandic’s operation.

4.4.1 Corporate Strategy

Scandic’s corporate strategy aims to offer easy and accessible accommodation in a relaxed

setting for its guests while being conscious about the community and the environment. To

accomplish this, the Scandic group sets out to achieve three specific goals: economic, ethical

and ecological. Furthermore, they are focused on rapid growth, looking to expand their

portfolio of hotels to more than 200 within the next few years (Scandic Fact Sheet, p.17).

59

4.4.2 Scandic Region South Structure

As the focus of this case study is on three hotels included in Scandic Region South, Figure

4.4.2 has been provided to give the reader a visual of the organizational structure in this

region.

Figure 4.4.2 Organizational Structure for Scandic Region South

Mr. Joakim Elveroth, the district director of Region South, oversees eleven hotels in the

region. The individual hotels in the region operate independantly of one another and report

to Mr. Elveroth. It should be noted that the “Other Region South Hotels” represent all other

hotels in the region and in are actuality independent of one another. The authors have

grouped them into one box in the organizational structure for simplicity purposes. The sales

unit and revenue management unit are independent of each hotel and serve separate

purposes. The sales unit aims to attract and focus on key customers, while the a team of

revenue mangers benchmark each hotel against their competition and forecast sales.

4.4.3 Corporate Management Control Systems

Annual Budget

The main control tool used in each hotel in Region South is the yearly budget. Each hotel

prepares its own budget and it is approved by the corporate office. The individual budgets

will be examined more closely in the following sections as they are designed differently by

each respective General Manager. Throughout the year, the budget is then adjusted

quarterly to provide an updated sales forecast for the remainder of the year (the adjusted

budgets will be henceforth be entitled BRM 1, 2 and 3).

60

The One-Year Business Plan

The one year business plan is also required to be submitted to the corporate office as a

means to plan non-financial goals. Each hotel prepares their business plans individually.

Therefore, the structure and use of the plan is quite different from hotel to hotel. In general,

each branch aims to achieve four to five goals per year, complimented with a number of

targets to support each primary goal. The one year business plans will also be viewed in

more detail as we examine the individual hotels below.

Performance Measurements

Accompanying the annual budgets, each hotel compiles weekly sales reports that are sent to

the head office to evaluate their performance. According to Mr. Tegfors, these reports are

their most beneficial tools as it is easy to see, with just a glance, how each hotel is

performing. Some of the key performance indicators presented in these reports include the

number of rooms sold and the average rate at which they were sold, what discounts were

given, and the labor hours attributed to each unit. Moreover, the most important measure

included in these sales reports, according to each of the Scandic General Managers, is sales

per labor hour worked. The model for these weekly reports can be found in Exhibit 4.A in the

appendix.

A second performance measurement report is used to measure growth and can be found in

Exhibit 4.B in the appendix. In the left hand column, each hotel reports its revenues and

profits, compared against what they had expected as well as what they generated in the

previous year. The same measurement is completed for a number of key performance

indicators. In the right hand column, growth is measured in key areas. First, the hotel reports

the actual movement (up or down) in their figures, followed by the target growth in each

category.

Benchmarking

There are five Revenue Managers working for the eleven hotels in Region South. Their

primary purpose is to forecast the expected daily demand to ensure that discounts are only

being given when the anticipated demand is low. This is done using a number of internet

61

data tools as well as by benchmarking both internally (against the previous year’s sales

reports) and externally (against five similar hotels in the city known as the comparable set,

or “com-set”). Mr. Pontus Mark (2011), a Revenue Manager in the city of Malmo, sat down

with the authors on April 28th, 2011 to explain exactly how this is done. The models and

spread sheets used by each Revenue Manager are shown in Exhibit 4.C of the appendix.

The primary web based program used by the Revenue Managers to compile sales data is

called “Ideas.” After being fed sales data for an extended period of time (Scandic has been

compiling data for 5 years), this revenue management system is “taught” to produce sales

reports containing the anticipated market segments that will be staying at the hotel on any

given day. The market segments are divided into guest categories such as corporate, leisure

travels, qualified discounts, meetings, internal employees and contracts. According to Mr.

Mark, this program is able to produce five detailed reports per day in the time it would take

the average person over a week to do by hand. More information about the “ideas” program

can be found on their website (Ideas, 2011).

Mr. Mark states that it is also important for the Revenue Managers to keep up on current

events as influxes to their area can provide significant spikes in demand. When a large event

is anticipated to fill the hotel, he feels that he would not be creating value for the hotel by

offering a large amount of discounts to qualified customers. During these periods, he feels

rooms should be filled by customers that do not qualify for discounts. This will, in turn, raise

overall revenues.

The key performance measurement used to benchmark is known as Revenue per Available

Room (RevPAR). By internally comparing the RevPAR against historical data from a similar

day of the week, at a similar time of the year, it can give a good indication as to how the

hotel is currently performing. As previously discussed, the external benchmarking is done

against the hotel’s “com-set.” This information is produced by a company called STR Global.

Scandic’s goal is to outperform its competitors; they use an index figure of 1 as a basis to do

this. If they performing better than their competitors the index figure is above 1, if they are

not performing as well the index figure is below 1.

62

Non-Financial Measurements

In an effort to improve employee satisfaction, Scandic issues a yearly anonymous survey to

each employee called “Voice” with approximately 200 questions about how they view the

management of the hotel. Included in this survey are questions about goals, strategies and

their overall job satisfaction (Thomas Tegfors, 2011).

Reward systems are also in place for salespersons and General Managers. The salespersons

receive rewards based on a scaling system tied to sales revenue and other non-financial

targets. The General Managers earn rewards when certain KPI targets are met. At the

individual hotel level, rewards are left up to the General Managers and these will be

discussed below.

Customer satisfaction is measured quarterly using a questionnaire called Scandic Guest

Survey (SGS). In addition, comment cards are placed on the beds of each room to receive

immediate feedback. Based on the both the survey and comment cards, targets are then set

and measured in the yearly business plan to improve the areas that are not up to Scandic

standards. These reports are standardized across all hotels therefore customer satisfaction

will not be discussed in the individual case studies.

4.4(a) Scandic Kramer

Although the above-mentioned control systems are standardized across the Scandic brand

name, each hotel aims toward different customer demographics and are in different product

life cycles. These circumstances require the management control systems within each

branch to be quite different. In the following section, we will look at the strategies for

Scandic Kramer, Malmo City, and Star Lund and view how this shapes their internal

management control systems.

Scandic Kramer is an historic 19th century hotel located in the heart of Malmo, Sweden,

employing 34 full-time people. At full capacity, its guests fill 113 rooms and have access to a

restaurant and bar, gym and sauna. This four star hotel was originally established by Fritz

and Kramer in 1877, boasting a rich history and legacy. In recent years however, its allure as

63

a posh hotel as slipped to a certain degree as the hotel has aged. Furthermore, the bars and

restaurants in the surrounding area have increased their market share, putting pressure on

Scandic Kramer to improve its operations.

4.4-A.1 Strategy and Management Philosophy

Mr. Tegfors aims to restore the Kramer reputation. He has recently accepted the position as

General Manager after working for four years as a Scandic Food & Beverage Manager. Given

this experience, his primary focus is on elevating the perception of the restaurant and bar

and improving the way it operates. In addition, he wants to renovate many of the run-down

rooms and put money into upgrading the “soft values” of the entire hotel i.e. adding flowers,

and buying new furniture for the patio and lobby. Finally, he aims to improve Kramer’s

conference business. To do this he has spent a significant amount of money on new

furniture and fixtures in the meeting halls.

Mr. Tegfors is a proactive leader. He delegates the tasks of each responsibility center to his

unit managers and communicates their progress regularly. He feels that each unit

understands his strategy and they are focused on setting goals within their unit to achieve

the strategy at hand.

4.4-A.2 Organizational Structure

Figure 4.4-A.2 Organizational Structure for Scandic Kramer

64

4.4-A.3 Management Control Systems

Annual Budget

The model for the Scandic Kramer’s yearly budget for both the housing and food and

beverage units can be found in Exhibit 4.D of the appendix. The preparation process begins

with each business unit manager preparing their respective budgets to be approved by Mr.

Tegfors. When he feels the figures are accurately projected, he sends the preliminary version

to corporate. It is quite common for them to inflate projections as a means to set difficult

targets which they will then aim to achieve. Mr. Tegfors believes that if the budgeted

projections are just out of reach, it will keep each unit from being complacent; they will

always need to strive to improve. When reevaluating the budget at the end of each quarter,

BRM 1, 2, and 3 are much more accurate as to what they can expect to achieve.

One-Year Business Plan

Mr. Tegfors was reluctant to release the one year business plan as much of the targets are

confidential and he has recently been put in charge of Scandic Kramer.

Performance Measurement

The yearly budget is evaluated daily, using the financial report shown in Exhibit 4.E of the

appendix. The report begins by evaluating how each revenue unit is performing. The housing

unit reports how many beds and rooms were sold, attributing the revenues received from

these sales. The Food and Beverage unit measures the revenue received from each of its

many sub-units and compares it to what was forecasted. For the information to be useful on

a daily basis, the report also shows the accumulated outcomes for the month and in a similar

fashion, compares these outcomes to what was budgeted against both the yearly budget

and the BRM. The data is then totaled, using total occupancy, average room rate (ARR), and

RevPAR as the KPI’s for its revenue measurement.

The next section of the daily financial performance report is based on measuring labor

hours. As Mr. Tegfors feels controlling labor hours is a key to success, he believes this section

is very important. The outcome of labor hours is measured using the same method as is

done for revenue management, broken down into each sub-unit. Finally, a summary of the

65

KPI’s are reported. Again, as Mr. Tegfors feels the cost of labor is an important measurement

of efficiency, sales per hour in each unit is the chief measurement in this section.

Reward Systems and Informal Control

Mr. Tegfors regularly uses competitions as a means to reward his employees and increase

efficiency. For example, he will check the number of dishes sold over a certain time period in

the previous year and set a new target for his Food & Beverage unit to strive for. If they are

able to reach that target, he rewards that unit with bottles of wine, cinema tickets, or

coupons for restaurants. These rewards for these competitions are budgeted for, and spread

evenly across each business unit.

Mr. Tegfors’ leadership philosophy has a great deal of effect on the informal controls used in

Scandic Kramer. As he believes strongly in communication and empowerment, a great deal

of trust is put in his unit managers to achieve the results the hotel is looking for. The above-

mentioned controls are used to support the trust he has in his team, but he believes

communication outweighs any of the control systems they have in place.

4.4-B Scandic Malmo City

Scandic Malmo City opened in 2010 as a turn-key, tenant hotel. Its capacity is much larger

than both Scandic Star and Scandic Kramer, offering 243 rooms and employing 18 full-time

employees. Its small staff size is due to the fact that it outsources its housekeeping unit; a

fact that will be discussed further below. Its guests have access to a state of the art gym,

large restaurant and bar, and its central location offers an excellent opportunity to rent a

bike and see the city sites in close proximity. Given its means of acquisition, the hotel

opened within five days of being purchased. Furthermore its unique acquirement provides

an interesting case compared to the other Scandic hotels; as the hotel is leased, the

building’s tenant has significant power in regards to furniture, equipment, and the building

itself.

66

4.4-B.1 Strategy and Management Philosophy

Given the youth of Malmo City, it yields different needs and objectives than the other hotels

examined in this report. First and foremost, spreading awareness that the hotel is open and

running is the chief goal of the hotel. Furthermore Ms. Anna Boudrie (2011), the General

Manager, believes that the control systems and culture implemented in the early stages of

the business will have a great effect on its future. Therefore, solidifying the hotel’s

operations and establishing a culture that revolves around efficiency and team work is also

among their core strategies.

Ms. Boudrie is a reactive leader. Due to the fact that the hotel is so new, there is not much

information available for her to anticipate problems. Therefore, she is very hands-on and

active to solve problems after they occur. She believes that the corporate office of Scandic

places certain leaders in power of hotel branches that have different needs. Until Malmo

City becomes more established, she feels it is necessary to apply this tight style of

leadership. Moreover, at an older and more proven hotel, employees have been working in

the organization for longer and can lead new employees by setting examples. As this is not

the case at Malmo City, she feels tight controls and behavioral measurements are necessary.

4.4-B.2 Organizational Structure

The most notable structural difference between Malmo City and most other Scandic hotels is

that they have outsourced their housekeeping unit. This, much like other aspects that are

unique to Malmo City, is because of how new the hotel is. According to Ms. Boudrie, the

decision to outsource housekeeping is due to the fact that there are large fluctuations in

demand from day to day. When the occupancy rate is low, there are not nearly as many

rooms to clean and it would be wasteful to retain a full time cleaning unit.

67

Figure 4.4-B.2 Organizational Structure for Malmo City

4.4-B.3 Management Control Systems

Annual Budget and Performance Measurement

Many of the technical management control systems for Malmo City, namely the yearly

budget and financial reports, have been adopted from Scandic Kramer. Therefore, in an

effort to make this study more reader friendly, we will refer you to the Kramer management

control system section for more information. The Kramer models are also applicable for

Malmo city, and can be found in Exhibits 4.D and 4.E of the appendix.

One-Year Business Plan

The one-year business plan for Malmo City is still a work in progress. Ms. Boudrie is currently

working with her business unit managers to establish goals for the second half of the year.

Reward Systems and Informal Control

Ms. Boudrie does not implement individual incentives for her employees. As a reward to her

employees when the entire hotel has been performing well, she has parties at the hotel or

schedules trips to Copenhagen for the entire staff.

The employees at Malmo City know that Ms. Boudrie expects her employees to work across

business unit borders and help each other when the hotel is busy; to establish this culture

she leads by example. If the hotel is busy, she will serve customers at the bar or check clients

68

in to their rooms. She believes that when her employees see that she is helping out each

unit, they will know to do the same. As a behavior measurement she sits in an office that is

close to all the action during the day. This way she can tightly monitor her staff and feels

they work more efficiently when she is around.

4.4-C Scandic Star Lund

Scandic Star is Southern Sweden’s most complete conference and congress venue. The hotel

has 22 different meeting rooms with capacities ranging from as small as 8 and as large as

550. At full capacity, Scandic Star can accommodate 528 guests in their 196 rooms and

employs 43 people. Located 2.5 kilometers from the city center of Sweden’s ancient

university city, Lund, Scandic Star’s facilities consist of a large informal restaurant and bar, a

24 hour snack lounge, its own gym as well as an indoor pool and sauna. As it was established

in 1991, its smooth operations are often used as a benchmark for which other Scandic Hotels

aim toward achieving.

4.4-C.1 Strategy and Management Philosophy

According to Ms. Helene Arvidsson (2011), Scandic Star’s General Manager, each year the

hotel aims to achieve five new goals that are decided upon in October of the previous year.

She and her management team work together to decide which areas of operation can be

approved upon. It is her belief that the process of developing these goals is just as beneficial

as the achieving the goals they decide upon. The team takes a lot of time to thoroughly

evaluate both the good and bad aspects of their hotel management.

Ms. Arvidsson is a proactive leader; her management philosophy is based on establishing a

learning culture. Within this culture she coaches her team members to make decisions and

test new solutions to problems that arise. For this philosophy to be effective, team members

must be willing to make mistakes and learn from them. She also believes the organization

should be as flat as possible by delegating responsibility to her unit managers; she stresses

that her business unit managers do the same with their employees. In such a flat

69

organization, her business unit managers have quite a bit of autonomy to work within the

structure that she has designed.

4.4-C.2 Organizational Structure

Figure 4.4-C.2 Organizational Structure for Scandic Star Lund

4.4-C.3 Management Control Systems

As Ms. Arvidsson delegates nearly every aspect of the hotels operations to her unit

managers, she has designed a very clear structure for them to work within and is very

thorough when measuring performance. Scandic Star uses two main control tools in order to

do this: (1) an elaborate budget that breaks down each operation into nearly 40 separate

spread sheets and; (2) a one year business plan that measures both financial and non-

financial measurements.

Annual Budget

The yearly budget is a comprehensive project completed by each business unit in September

of each year. Ms. Arvidsson delegates this responsibility to her unit managers, and the

information is then compiled into one primary budget. This document can be found in

Exhibit 4.F of the appendix. The preparation of the Food & Beverage budget is done in a

similar fashion. Each Food and Beverage sub-unit (breakfast, bar, restaurant etc.) prepares

70

their own respective budgets, then the information is amassed into one document by the

unit manager. This budget can also be found in the appendix in Exhibit 4.G. As many of these

sub-unit budgets are formatted to look quite similar to the Food & Beverage budget, we

have simplified their presentation for the reader into the following table.

Housing Food & Beverage Shared Operations

Hotel Cost Specification F&B Specification Specification of Hours Worked

Rooms Revenue Shop BRM 3 - 2010

Housing Revenue Forecast Conferences Budget 2011 vs. BRM 3 - 2010

Housing Breakfast Administrative Costs

Reception Lobby Bar Data and IT

Booking Bar 1 and Bar 2 Marketing

Room Cleaning Restaurants 1-4 Human Resources

Banquet 1 and 2 Facilities Cleaning

Chef Property

Dishes Non-Operating Costs

Shared Restaurant

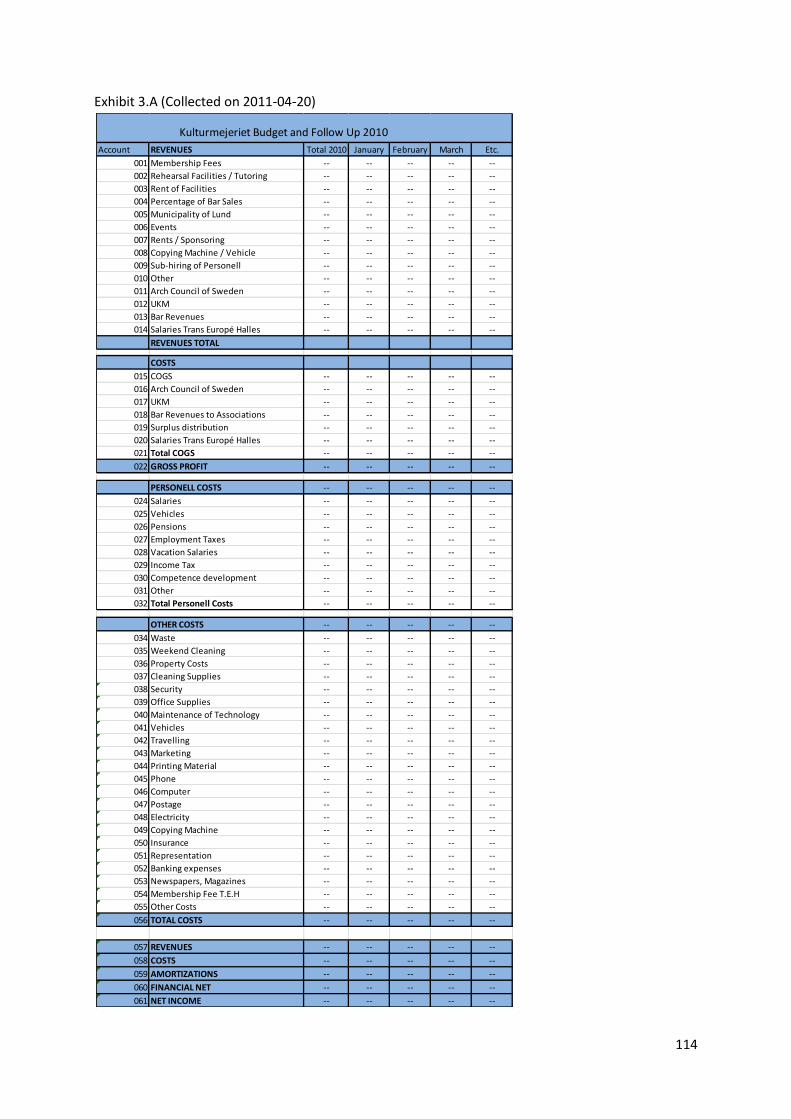
Table 4.4-C.3 Summary of Subunit Budgets (Sicari and Soderlund, 2011)

The One-Year Business Plan

Each year, Scandic Star sets out to accomplish five goals (both financial and non-financial)

that aim to improve hotel operations – this is done in two steps. First, at the beginning of the

year, each employee is given a comprehensive packet that fully explains each objective. The

goals are then accompanied with a number of targets and key performance measurements

that will help the employees achieve these objectives. As a follow up, to make sure strides

are being taken to accomplish these goals, Ms. Arvidsson has developed a monthly scorecard

to measure how well each of these targets are being met. The scorecard can be found in

Exhibit 4.H of the appendix. A minus sign (-) means they need to focus more on this area, a

plus sign (+) signals that the target is being reached for that month. For example, one of the

goals for 2011 is to “Challenge Ourselves and Each Other to Optimize Revenues.” Seven

financial and non-financial targets are set and measured to help optimize these revenues

such as “Meeting Room Occupancy,” “EBITDA,” and “Electricity per Guest.” Another example

of a goal for 2011 is in regards to quality control; the goal is that “Our guest should

Experience an Even and High Level of Service on All Days of the Week.” The targets

71

measured to help achieve this goal include two customer satisfaction surveys as well as

implementing at least four customer suggestions.

Reward Systems and Informal Control

Employees are rewarded at staff meetings four or five times a year. Ms. Arvidsson feels that

rewarding employees in a public setting allows them to feel appreciated in front of their

peers as well as sets an example for the other employees. These rewards range from small

tokens of thanks to large awards.

Scandic Star Lund has a code of conduct that is focused on when hiring and training. Each

year the employees are reminded of how they should conduct themselves while at work.

This is reinforced in the yearly business plan mentioned above.

72

V. Analysis

This chapter will be introduced with a cross-sectional comparison of each unit of analysis. The authors

will then analyze the possible underlying contingency factors affecting the analytical units’ choice of

management control systems using the explanation building approach. Throughout this section, a

pattern-matching technique will be used to compare how the design and use of management control

systems in the organizations studied links to theoretical research in the area of management control.

5.1 Cross-Sectional Comparison

In this section, the design and use of management control systems of each unit analysis will

be compared against one another. The authors begin by comparing each organization’s

strategy and structure. As these are different in each unit of analysis, their management

control systems have been designed differently to reflect their individual strategies. The

tables that follow present the different tools used in the organizations studied. Following

each table is a comparison to current theoretical research in management control.

5.1.1 Strategy and Management Philosophy

Table 5.1.1(1) Organizational Strategy (Sicari and Söderlund, 2011)

Anthony and Govindarajan (2003) stress that the assignment of responsibility into

organizational subunits must reflect the organizations strategy; as each unit of analysis is

diversified into more than one market segment, each has set up responsibility centers as a

means to control the organization. Furthermore, it was found that the management control

system of each unit of analysis was effected by both Levitt’s (1965) theory on the product

life cycle as well as the Boston Consulting Group’s (1968) theory of product life cycle. Finally,

Porter’s (1980) widely accepted strategies of differentiation or cost leadership have also

been found to affect the management control systems of each unit of analysis. How these

effects were manifested will be analyzed in section 5.2.1.

Organizational Strategy BPK FFSA KM Kramer Malmo City Star Lund

Diversification

Market State Maturity Maturity Maturity Growth Growth Growth

Product Life Cycle Question Mark Non-Profit Non-Profit Cash Cow Question Mark Cash Cow

Differentiation

Cost Leader

73

Table 5.1.1(2) Management Philosophy (Sicari and Söderlund, 2011)

As reactive leadership philosophies rely to a large extent on historic data, fixing problems

after they occur, it is a very hands on approach that requires managers to be very active in

each activity. Lindvall (2001) discusses how a proactive leadership gives organizations the

ability to delegate tasks and responsibilities to lower units in the organization, anticipate

future problems and motivates employees to solve problems on their own. The authors have

found both styles of leadership to be present in the units of analysis. Scandic Malmo City and

Kulturmejeriet do not conform to this theory as they engage in reactive management

philosophies.

Lindvall (2001) argues that management control systems should not only be vertically

structured, but horizontally structured as well. This would require employees to be held

more accountable to manage the customer process, shifting the responsibility of the

employee. The authors have found varying consistencies to this theory in the units of

analysis. Each organization has been divided into separate functions, however an argument

can be made for BrewPub København that the customer experience is the main focus of its

servers; they cater to customer requests while performing quality checks on both the food

and the beer. That being said however, their organization is still seen as mainly vertical in

nature as can be seen in the table below.

5.1.2 Size and Organizational Structure

Table 5.1.2 Organizational Structure (Sicari and Söderlund, 2011)

Philosphy BPK FFSA KM Kramer Malmo City Star Lund

Proactive Leadership

Reactive Leadership

Value Based

Cost Based

Size and Structure BPK FFSA KM Kramer Malmo City Star Lund

Employees 24 5+ 5 ; 40+ 34+ 18+ 43+

Cost Centers

Revenue Centers

Profit Centers

Investment Centers

74

As organizations diversify their strategy there is a need to separate the organization into

multiple business units, Anthony and Govindarajan (2003) stress the need to assign financial

responsibility to each center in order to measure their outputs. The authors have found this

theory to be consistent in the four of the six units of analysis as these organizations have

divided themselves into a number of responsibility centers. However, in the case of FFSA and

Kulturmejeriet, their diversified strategy is implemented through the use of contracts

independent partnerships, respectively. How these individual centers are measured (both in

theory and in the units of analysis) will be discussed in the ratio measures section below.

5.1.3 Management Control Systems

Table 5.1.3(1) Planning (Sicari and Söderlund, 2011)

There is a wide range of consistency to theory in regards to planning tools. Merchant and

Van der Stede (2007) claim benchmarking both internally and externally are an important

part of most organizations budgeting, planning and performance evaluation. The authors

have found this to be true as each organization benchmarks internally in order to prepare

their operational budget, while four of the six externally benchmark. However,

inconsistencies have been found to Anthony and Govindarajan’s (2003) claim that

organizations prepare a formal strategic plan and/or capital budget – none of the

organizations studied use these tools. It should be noted that Anthony and Govindarajan

(2003) also discuss that it may be unnecessary for the smaller organizations (Kulturmejeriet

and FFSA) to formulate a strategic plan.

Conflicting results are also found in the use of digitization aids for forecasting and data

analysis. Phillips and Louvieris (2005) assert that it is common for hospitality organizations to

use digitization aids to collect data, but analyze the data manually. This is found to be true

Planning BPK FFSA KM Kramer Malmo City Star Lund

Strategic Plan

One Year Business Plan

Capital Budget

Operating Budget

Budgeted Cash Flow Statement

Forecasting

Digital Data Collection

Digital Data Analysis

Internal Benchmarking

External Bernchmarking

75

for BrewPub København; however the Scandic Hotels have fully integrated their data

analysis (using internet software called “Ideas”), while neither FFSA or Kulturmejeriet use

nearly no digitization aids at all.

Table 5.1.3(2) Operating Budget (Sicari and Söderlund, 2011)

Each of the organizations studied, with the exception of FFSA, prepare an annual operating

budget. This is consistent with the widely accepted theory presented by Phillips and

Louvieris (2005). It should be noted that Mr. Nilsson, CEO of FFSA, uses the quarterly profit

and loss statements to benchmark as if it was the operating budget.

On the other hand, an inconsistency can be found with a theory from Schmidgall and

DeFranco (1998). They suggest that organizations in the hospitality industry do not

commonly adjust the annual budget during the period however; all three Scandic Hotels

adjust their budgets quarterly.

Performance Measurement

Table 5.1.3(3) Performance Measurement (Sicari and Söderlund, 2011)

Anthony and Govindarajan (2003) stress that frequent reporting is a critical success factor as

timely information is important for evaluation; citing that weekly or monthly measurements

are common - the authors have again found varying degrees of consistency. BrewPub

København and Kulturmejeriet are consistent as they report monthly. However, each

Scandic Hotel breaks the norm by reporting daily while FFSA is also inconsistent as they

report quarterly.

Operating Budget BPK FFSA KM Kramer Malmo City Star Lund

Revenue

Cost of Goods Sold

Indirect Costs

Marketing Costs

Rent and Utilities

Labor Costs

Depreciation/Ammoritization

Financial Net

Budget Adjustments Quarterly Quarterly Quarterly

Performance Measurement BPK FFSA KM Kramer Malmo City Star Lund

Daily Reporting

Monthly Reporting

Quarterly Reporting

76

Residual Measures

Table 5.1.3(4) Residual Measures (Sicari and Söderlund, 2011)

Merchant and Van der Stede (2007) suggest that it is common for organizations to use

residual measures when evaluating business units. The authors have found this to be

consistent as each company uses a number of different measures. Conversely, Potter and

Schmidgall (1999) have discussed that it is uncommon for organizations in the hospitality

industry to use net income as an internal evaluation tool. However, FFSA, Kulturmejeriet,

and Scandic Star Lund report net income internally, while the remaining companies use gross

profit or EBIT as their chief profitability measurement.

Ratio Measures

Table 5.1.3(5) Ratio Measures (Sicari and Söderlund, 2011)

Merchant and Van der Stede (2007) also suggest that organizations commonly use ratio

measures to evaluate their individual business units. The authors have found this to be true

in all organizations with the exception of FFSA and Kulturmejeriet.

The authors have also found the theory by Potter and Schmidgall (1999) to be fully

supported in regards to business unit evaluation. They note that it is uncommon to attribute

overhead costs to business units; organizations generally only evaluate units based only on

their direct costs. Specifically, Anthony and Govindarajan (2003) state that evaluating

Residual Measures BPK FFSA KM Kramer Malmo City Star Lund

Total Revenue

Renue per Unit

Operating Income

Gross Profit

Net Income

EBITDA

EBITDA per Unit

Ratio Measures BPK FFSA KM Kramer Malmo City Star Lund

Profit Margin

Unit Profit Margin

Unit Profit Margin (Inc. OH)

Contribution Margin

Labor Cost as a % of Revenue

Unit Labor Cost as a % of Revenue

Marketing Cost as a % of Revenue

Sales per Hour (F&B) N/A N/A

Revenue per Avail. Room N/A N/A N/A

Average Room Rate N/A N/A N/A

77

business units without considering the cost of assets employed is an inadequate basis for

control. However, except in the service industry where the amount of capital can be

insignificant. These facts have been found to be consistent for all units of analysis with the

exception of BrewPub København; the capital cost on their brewing equipment is significant.

Finally, many studies based on the hotel industry have cited revenue per available room

(RevPAR), and average room rate (ARR) to be commonly used; each of the Scandic Hotels fit

this mold.

Non-Financial Measures

Table 5.1.3(6) Non-Financial Measures (Sicari and Söderlund, 2011)

Four significant theories are addressed in the preceding table; all of which focus directly on

the hospitality industry. First, Hesford and Potter (2010) cite that an overwhelming number

of executives view non-financial measurements as key to success. This theory is confirmed

by each of our companies, though Kulturmejeriet uses only one non-financial measurement.

Secondly, Phillips and Louvieris (2005) claim there is an increased focus on customer

relationships in the hospitality industry. This is also found to be consistent in all but one

organization (Kulturmejeriet). Thirdly, employee morale was also discussed as a common

measurement in Phillips and Louvieris (2005) which was found to be consistent in four of the

six organizations. Finally, Phillips and Louvieris (2005) address one more common non-

financial measurement – employee efficiency. This theory, much like the others regarding

non-financial measures, was found to be consistent as every manager in the study stressed

Non-Financial Measures BPK FFSA KM Kramer Malmo City Star Lund

Customer Satisfaction

No. Cust. Suggestions Implim.

Conference Evaluations N/A N/A N/A

Quality Control

Employee Morale

Number of Guests

Number of Rooms N/A N/A N/A

Meeting Occupancy N/A N/A N/A

Occupancy % N/A N/A N/A

Cleaned Rooms per Hour N/A N/A N/A

Sold Rooms per Hour N/A N/A N/A

Breakfast Guests per Hour N/A N/A N/A

Labor Hours per Unit

Total Labor Hours

Sick Leave

Energy per Guest Night

Employee Turnover

78

the importance of controlling labor hours, while four of the six organizations measure labor

hours in relation to revenues per unit.

Balanced Scorecard

Table 5.1.3(8) Balanced Scorecard (Sicari and Söderlund, 2011)

Phillips and Louvieris (2005) found, using a multiple case study of elite hospitality

organizations, that the organizations did not use the balanced scorecard directly, however

elements of the balanced scorecard are measured in each of the organizations they studied.

This was found to be consistent with this study as none of the organizations studied directly

use the balanced scorecard but half of them contained some of the elements in their control

systems.

Reward Systems

Table 5.1.3(7) Reward Systems (Sicari and Söderlund, 2011)

The use of employee reward systems in each organization is consistent with that of theory

presented by Phillips and Louvieris (2005). Four of the six organizations use formal reward

systems to motivate employees, while the remaining two use informal incentives.

Furthermore, Samuelsson (2004) discusses the basis for which incentives are rewarded citing

both financial and non-financial targets. Three of the six organizations use both types of

targets.

Balanced Scorecard BPK FFSA KM Kramer Malmo City Star Lund

Full Compliance

Contains Some Elements

No Compliance

Reward Systems BPK FFSA KM Kramer Malmo City Star Lund

Based on Financial

Based on Non-Financial

Financial Reward

Non-Financial Reward

Informal Reward

79

Informal Control

Table 5.1.3(9) Informal Control (Sicari and Söderlund, 2011)

According to Brander Brown (1995), small organizations tend to use trust as an informal

control because of managers frequent day to day interactions with subordinates. This is true

for five of the six organizations. Brander Brown (1995) also discusses how a lack of

understanding culture can cause resistance and failure of organizational objectives. It cannot

be said with certainty that the units of analysis have made this connection.

Control Tightness

Table 5.1.3(10) Control Tightness (Sicari and Söderlund, 2011)

The control tightness found in the units of analysis is consistent in nature to what was

described by Merchant and Van der Stede (2007). They outline many forms of tightness,

however what is notable is the fact that establishing tight control is not suitable for all

organizations. Organizations that are operating in unstable markets, such as in the case of

FFSA where they are newly established in a saturated market and have little forecasting

abilities, need to provide the freedom of flexibility and empowerment in order to handle

everyday business decisions. Furthermore, Merchant and Van der Stede (2007) go on to say

that the control tightness must be established after establishing clear goals and objectives.

In regards to the remaining units of analysis, the varying degrees of tightness have been

established as best fit for the strategy each organization implements.

5.2 Contingency Factor Causality

In this section the authors will analyze the possible underlying explanations to the choice of

management control systems of each individual organization. The causal links between

contingency factors and the operational controls will be discussed in terms of strategy,

organizational size and structure, ownership and product life cycle. These factors were

Informal Control BPK FFSA KM Kramer Malmo City Star Lund

Culture

Trust

Behavior

Control Tightness BPK FFSA KM Kramer Malmo City Star Lund

Loose (1) - Tight (5) 5 1 1 4 3 5

80

chosen by the authors as they felt each were to be influential on the choice of management

control system.

5.2.1 Strategy

The organizations of this study are primarily engaged in four strategic activities: conference,

lodging, leisure and dining. Each individual organization’s product offering is focused on two,

or in some cases three activities and can therefore be viewed as having a diversification

strategy.

BrewPub København’s primary activity is dining, offering homemade beer and wide

selection of dishes.

FFSA is engaged in three strategic activities; leisure, conference and dining, of which

leisure and mainly handball, is the primary.

Kulturmejeriet has focused on two main activities, namely leisure and dining. The

primary activity should be considered leisure as dining is mainly represented by the

so called “jazz brunches”.

Scandic Hotel Kramer is engaged in the three strategies activities of conference,

lodging and dining, however, less focused on conference.

Scandic Malmö City is engaged in the three strategies activities of conference,

lodging and dining, however, primarily focused on lodging.

Scandic Star Lund is engaged in the three strategies activities of conference, lodging

and dining, however, primarily focused on conference.

The strategic offerings of all organization are illustrated in the figure on the next page.

81

Figure 5.2.1 Strategic focus of product portfolios (Sicari and Söderlund, 2011)

The diversification strategy of each organization (with the exception of FFSA and

Kulturmejeriet) is reflected in the decentralized structure, based on various forms of

responsibility centers. In terms of control tools, there is a causal link between the

diversification and the significant amount of performance measurements relating to

responsibility center performance, as suggested by Merchant and Van der Stede (2007).

An exception is made for both FFSA and Kulturmejeriet as their structure is centralized,

allowing the diversified strategy to be carried out using contracts and independent

partnerships, respectively. As the link between this diversification strategy and business

structures and controls have been identified collectively for units of analysis, the following

sections will focus on how each organizations competitive strategies affect their

management control systems.

BrewPub København

As the brewpub has implemented a differentiation strategy, a link can be seen to the use of

non-financial measurements as well as the use of customer relationship management

controls.

82

Furthermore, the value based management philosophy of BrewPub København can also be

causally linked to the use of non-financial performance measurements. In addition, its use of

reward systems is also inherently connected.

Färs & Frosta Sparbank Arena

The Swedish arena market, and particularly that of south Sweden, is highly saturated. This

fact is in turn reflected in the FFSA strategy to be a cost leader and supported by the

implementation of a control system that is overwhelmingly cost focused (lacking the support

of significant number of non-financial measures). From the main customer’s perspective,

namely that of the local handball team, FFSA offers a significantly subsidized product.

Kulturmejeriet

Kulturmejeriet has implemented a differentiated strategy, attracting artists and musicians

who are hardly considered to be main stream. Such a strategy would imply the use of a

number of non-financial measures and customer relationship management control. As both

of these tools are of limited use in the organization, the authors have not been able to find a

causal link in this organization.

Scandic Hotel Kramer

Scandic Hotel Kramer is essentially value based and differentiated in its pursuit of the

premium segment of the hotel market. This is reflected in the substantial use of non-

financial performance measurements and its customer focus.

Scandic Malmö City

Although the management philosophy of Scandic Hotel Malmö City should be seen as more

cost based than that of Scandic Hotel Kramer as well as having a cost leader strategy,

differences in the management control systems relating to this difference were not found.

This lack of differences is most likely linked to the ownership structure (see section 5.2.3 for

further elaboration regarding this).

83

Scandic Star Lund

Although Scandic Star Lund has implemented the aforementioned diversification strategy, it

is primarily focused on conferences. The conference facility of Scandic Star Lund is the hotels

main competitive advantage. Based on that notion, the generic strategy of Scandic Star Lund

should be seen as that of differentiation. This strategy is reflected in the management

control systems by a significant amount of non-financial performance measurements.

5.2.2 Organizational Size & Structure

BrewPub København

Although BrewPub København only consists of 24 employees, the management control

systems should, as previously mentioned, be considered to be tight which lacks a causal link.

Moreover, the systems are further tightened through the use of informal controls by the

Managing Director. These informal controls are most likely facilitated by the small size of the

organization, as suggested by Brander Brown (1995). In addition, the small size could be

linked to the Managing Director’s choice to utilize monthly and quarterly reporting.

To ensure maintained overall control of the diversified business units, an extensive

performance measurement system as well as profit centers and cost centers have been

implemented. The performance measurements are to a significant extent based on

contribution margins. Therefore, it can be said that they are consistent with the notion of

Brander Brown (1995) that if responsibility centers are in use, the management control

systems should reflect their interdependencies.

Färs & Frosta Sparbank Arena

There are a number of planning tools that have not been found to be used in FFSA which

include the strategic plan, the one year business plan, the rolling forecast or the capital

budget used. The lack of these planning tools is likely to be partially explained by the youth

of the organization but mainly because of its modest size. The modest size allows the

Managing Director to rely on personal interactions with his employees to a large extent, as

described by Brander Brown (1995).

84

The reward system of FFSA is, as previously mentioned, hardly to be viewed as systems. This

notion also corresponds with Brander Brown’s (1995) suggestion that smaller organizations

commonly utilize informal control systems, thereby including rewards.

Kulturmejeriet

As in the case of FFSA, the management control systems of Kulturmejeriet are highly

informal and based on personal interactions as well as informal communication. The modest

organizational size is likely to be one of the main contingency factors related to such a

structure. Other factors associated with size include the informal use of rewards, the lack of

planning tools and loose control.

Scandic Hotels

Given that all three Scandic Hotel are roughly the same size and similarly structured, their

size and structure will be analyzed in one section.

The three Scandic Hotels represent the largest organizations of this study and have also

implemented the most sophistical management control systems. This is consistent with

Brander Brown’s (1995) notion that larger organizations generally apply more formalized

and administrative management control systems. Furthermore, the Scandic Hotels are

frequent users of responsibility centers which become increasingly important with increased

size due to the benefits of delegating responsibility and accountability. Informal control is

used to some extent in Scandic Hotels. However, Brander Brown’s (1995) discussion on large

organizations including the lesser use of informal control is not directly applicable given that

the individual Scandic Hotels are business units with 18-43 full time employees, part of a

larger organization.

The organizational structure of Scandic Malmö City is distinguished from the two other

Scandic hotels due to the outsourced housekeeping department. Consequently, the number

of employees is significantly lower. A causal link can therefore be recognized between the

smaller organizational size and the General Managers use of behavior control. However, the

behavior control is most likely also linked to the youth of the organization.

85

The relationship between organizational size and the number of performance

measurements used in each organization is illustrated in the figure below. Some correlation

was found, as shown by the dotted line.

Figure 5.2.2 The relationship between organizational size and the number of performance measurements

(Sicari and Söderlund, 2011)

5.2.3 Ownership

BrewPub København

The BrewPub København’s five owners request substantial financial reporting. This fact is

reflected in their internal control systems as they have elaborate management control

system and, in particular, an extensive number of performance measurements. The owners

are to be regarded as active and knowledgeable owners in the field of business

administration. Such a factor may also contribute to the extensive use of management

control tools. Furthermore, as the Managing Director holds a share of ownership, this

suggests that he himself has incentives to implement tight cost control. However, following

the same logic, the authors would be inclined to presume that planning tools such as the

strategic plan, the one year business plan and rolling forecasts would be in use, although

they are not.

86

Färs & Frosta Sparbank Arena

The political influence and the non-profit nature of FFSA are reflected in the management

control systems of the organization in a couple of ways. Firstly, when compared to the for-

profit organizations in this study, FFSA and Kulturmejeriet, use substantially fewer planning

tools. For example, the absence of all planning tools except for the limited use of

benchmarking can likely be linked to the political governance as well as the non-profit

nature. Secondly, rewards systems are used to a very limited extend. Thirdly, the overall

tightness of the control is at the lowest possible level. Finally, the fact that the FFSA is a non-

profit organization is likely to decrease the need for formalized control systems as the social

interest is prioritized instead of the economical.

Moreover, the fact that the objectives of FFSA are regulated in the purpose of the

foundation poses operational restrictions. FFSA is forced to offer subsidized products to

selected customers causing the organization to suffer operating losses of around 7 MSEK

during the last couple of years. A strategic refocusing is however not an option which leaves

FFSA with the option of minimizing variable cost. This cost based focus, also corresponding

to the generic strategy of cost leader, is causally linked to the choice of performance

measurements. A clear preponderance of cost based performance measurements can be

seen in comparison to revenue based.

Kulturmejeriet

The ownership structure of Kulturmejeriet is similar to that of FFSA. Both organizations share

a political influence and a non-profit nature. As in the case of FFSA, this is reflected in the

management control systems of the organization in a couple of ways. Firstly, the only

planning tools used in the organization are the operating budget and, to a limited extent,

benchmarking. This can likely be linked to the political governance as well as the non-profit

nature. Secondly, as in the case of FFSA, rewards systems are used to a very limited extent

and the overall tightness of the control.

The governance of Kulturmejeriet is characterized by the peculiarity that the association

managers are also the board members. This structure mainly complicates the budget

87

process as the board members’ approval of the budget is necessary in the fund allocation

process and they often act in self-interest.

Scandic Hotels

The private equity ownership of Scandic Hotel through EQT Partners has mainly expanded

the use of management control systems and increased the frequency of reporting. Daily

reporting is now standard across the Scandic Group. Compared to the other organizations

included in this study, Scandic Hotels’ management control systems are overwhelmingly

extensive. Furthermore, the uniformity of the management control systems has been

significantly increased.

The relationship between organizational funding and the control tightness is illustrated in

the figure below. Some correlation was found, as shown by the dotted line.

Figure 5.2.3 The relationship between organizational funding and the control tightness (Sicari and Söderlund,

2011)

5.2.4 Product Life Cycle

The authors’ wish to make clear that they are aware of the fact that the product portfolio

matrix is intended for analyzing the relative performance of a set of products in an

organization’s portfolio. Nevertheless, it is the authors’ belief that the product portfolio

matrix can be used in this study to make a couple of central observations in regards to the

use of management control systems. In this section, the organizations will be analyzed in

88

pairs due to their many similarities. The non-profit nature of FFSA and Kulturmejeriet

excludes them from this part of the analysis. An overview of the matrix can be seen below.

Figure 5.2.4 The product portfolio matrix applied to BrewPub København and Scandic Hotels A, B and C (Sicari

and Söderlund, 2011)

The Question Marks: BrewPub København & Scandic Malmö City

Given that both BrewPub København and Scandic Malmö City were recently established

within the last few years, these organizations should be considered to be question marks.

The market awareness is an issue for Scandic Malmö City causing a relatively low cash

generation. The brewpub has been in business a few years longer and has had the

opportunity to establish a substantial customer base. The management control systems of

BrewPub København and Scandic Malmö City have some similarities which most likely can be

traced back to the shared prerequisite of being question marks. These will be further

explained below.

There is likely to be a causal link between the youth of the organizations and the magnitude

of the reporting. This prerequisite is reflected in the management control systems of both

89

organizations in terms of extensive use of performance measurements and responsibility

centers.

Due to their question mark statuses, both organizations’ business models are exposed to a

significant amount of risk, in relation to the other organizations of the study. Although

Brander Brown (1995) does not explicitly state that increased exposure to risk causes tighter

control, the authors find it reasonable to, in this case, suggest a possibility for a causal link

between these two factors.

Both organizations’ are actively working to expand their customer awareness. According to

the respondents, the relative importance of employee competence and high customer

service standards are crucial in such a process. Therefore, both organizations devote

substantial time and resources to finding and training employees. Furthermore, once an

appropriate employee has been selected, behavior control is used as the output of an

interaction with a customer is problematic to measure. This is consistent with Ouchi’s theory

of informal control mechanisms.

A causal link is suggested between a question mark organization and the tightness of their

control. Furthermore, in the case of Scandic Malmö City, the reactive management

philosophy is most likely linked to the youth of the organization. As the organization

solidifies, it is likely than the control systems will develop and become more comprehensive

over time.

The Cash Cows: Scandic Hotel Kramer & Scandic Star Lund

Given the maturity (i.e. the low growth rate) as well as the substantial customer bases (i.e.

the high market share) of both Scandic Hotel Kramer and Scandic Star Lund, these

organizations should be considered to be cash cows. As in the previous section, the

management philosophies and the management control systems of Scandic Hotel Kramer

and Scandic Star Lund have some similarities which most likely can be traced back to the

shared prerequisite of being cash cows. These will be further explained below.

90

Both Scandic Hotel Kramer and Scandic Star Lund are well known and well established

hotels, thereby being exposed to a relatively low business risk and uncertainty. This notion is

reflected in the management philosophies of both General Managers as they are firm

believers of trust and empowerment of their employees. However, the authors found no

correlation between low business risk and looser control. Instead, both Scandic Hotel Kramer

and Scandic Star Lund utilize a broad combination of controls, namely planning tools,

performance measurements, reward systems and informal cultural control. This broad

combination is likely primarily explained by the corporate influence and the maturity of the

organizations (for further analysis of ownership, see section 5.2.3).

The harvest feature of the cash cow category causes a low likeliness of investments into the

both Scandic Hotel Kramer and Scandic Star Lund. In Scandic Hotel Kramer the previous lack

of investment is obvious as the General Manager is presently working on restoring the past

reputation as one of Malmö’s premium hotels. As investment appraisals normally are based

upon operational performance measures, it is not unlikely that the General Managers have

incentives to utilize extensive management control tools for such a purpose.

In markets and in organizations with low growth rate, the relative importance of operational

efficiency increases. There is no doubt that this view is shared by Scandic Hotel Kramer and

Scandic Star Lund. Efficiency is measured in a number of financial as well as non-financial

manners.

Related to the cash cow category is the probability that the organization is further mature. In

terms of management control systems, this is reflected in terms of strong organizational

cultures, trust, routineness of activities and a well-developed set of performance

measurements. In summary, this is what Merchant and Van der Stede (2007) refer to as a

multiple forms of control, in their work on control system tightness. More or less, all these

elements are found in the management control systems of Scandic Hotel Kramer and

Scandic Star Lund.

As discussed in section 4.4.3, there is a clear causality between the hotel industry context of

Scandic Hotels and the use of external benchmarking. Furthermore, the industry context can

91

provide an alternative explanation to the extensive use of performance measurements. This

corresponds with Jones’ (2005) notion that hotels generally use substantial amounts of

performance measurements.

5.3 Analytical Summary

The design and use of management control systems are different in each organization as the

tools used to implement strategy are tailored to the needs of individual organizations. The

main tools found in management control systems include a number of planning tools, both

financial and non-financial performance measurements, reward systems, and informal

control tools. Overall, the systems designed in the units of analysis are consistent to what

has been presented in academic theory. Any discrepancies that have been found may be due

to the small sample size of the study.

The authors found there to be four key contingency factors that affect the design of control

systems. An organization that aims to apply a differentiation strategy requires control tools

that ensure quality and improved customer service while it is essential to use tight control

tools to minimize costs to support a cost leader strategy. As organizations grow in size and

become more and more decentralized, the need for formal control tools become

increasingly important compared to a smaller, centralized organization where personal

interactions are frequent. A noticeable difference in control systems can also be seen

between the loose controls of organizations funded by municipalities compared to the

tighter control of those managed by private owners. This is especially true when the owners

are actively invested in the organizations success. Finally, the product life cycle also has a

perceived effect on the design and use of management control systems. Organizations that

are newly founded and characterized as question marks tend to have tight control tools with

reactive, highly involved managers. Cash cows on the other hand, have developed a

comprehensive system with many cultural controls in their organizations requiring much less

involvement from senior management. Many of the activities are delegated to unit

managers and are controlled by a wide range of performance measurements.

92

VI. Discussion

In this chapter, the authors will first present a summary of the research findings. Second,

possible recommendations that can be made to organizations related to the hospitality

industry and to the organizations of this study will be discussed. Given the fact that this

study is based on organizations in Sweden and Denmark, the discussion is likely to be most

relevant for organizations in the same region. The chapter will be concluded with a general

discussion regarding recommendations for future research.

6.1 Summary of Research Findings

It has been the purpose of this research study to explain the design and use of management

control systems in the hospitality industry. In an effort to reach this goal, empirical research

was first gathered by means of a multiple case study. These findings were then compared to

what has been claimed in management control theory. Finally, the authors have made an

effort to better understand what contingency factors are relevant when the case

organizations design their management control systems, and what effects these factors have

had on the individual systems. The main research findings are as follows.

7.1.1 The Use of Management Control Systems

As a general pattern, the authors have found that many different control tools are used in

each unit of analysis. The most important planning and evaluation tool, used by nearly all the

organizations analyzed, is the operational budget. This tool is prepared annually using

forecasting methods such as internal and external benchmarking. Furthermore, four of the

six organizations use digitization aids to help compile the data in a timely and accurate

manner.

Many financial performance measurements are used in each organization. A short list of the

residual measures commonly used include total revenue, operating income, gross profit and

earnings before interest, taxes, depreciation and amortization (EBITDA). Furthermore, half of

the organizations analyzed use net income as an internal measurement. Additionally, half of

the organizations also use ratio measures to evaluate performance. Examples of these ratios

93

include profit margin, labor and marketing costs as a percentage of revenue. Specific to the

hotels, revenue per available room and average room rate are also measured. Moreover, the

same organizations that use ratio measures also evaluate the performance of individual

business units using contribution margin and/or unit profit margin. They do not however,

assign overhead costs to their business units, which generally is not common across the

hospitality industry.

All units of analysis use non-financial measurements when evaluating the organizations

performance. As customer focus is of increased importance in the hospitality industry, all but

one organization undertakes customer relationship management to improve customer

retention and quality of service. The same is true in regards to their staff and labor costs; as

it is also of increased importance, four of the six organizations measure labor hours per unit

as well as evaluate employee morale by conducting individual appraisals. Finally, in turning

the focus of non-financial measures on the hotel sector, a number of measures are used

including occupancy percentage as well as cleaned and sold rooms per hour.

Another management control tool used by each organization is reward systems. Four of the

six organizations use formal reward systems based on both financial and non-financial

targets, while the remaining two use some informal rewards to motivate employees.

Finally, the use of informal controls is present in each unit of analysis. The organizations

have established a culture (or are currently in the process of establishing a culture) as a

means to control employees. Tenured employees tend to understand the system of

operations and allow new hires to learn from the senior employees. Moreover, varying

degrees of trust is used in every unit of analysis. The organizations’ managers that have a

low level of trust compensate with light to heavy behavior measures to ensure efficiency.

7.1.2 Research Findings Compared to Theoretical Perspectives

The authors have found that the management control tools used in the units of analysis are

generally consistent to what has been suggested in academic theory. Given the limited

sample size of the study, inconsistencies do not disprove any of the theoretical claims. On

94

the contrary, the consistencies that were found lend to only strengthen them. Had the study

included more units of analysis, a stronger argument might have been made in connection

to theory as a larger sample size increases the validity of the findings.

The following theoretical perspectives have been found to be supported by the research

findings:

Schmidgall and DeFranco (1998) discuss that operating budgets are commonly used

in the hospitality industry

Merchant and Van der Stede (2007) claim benchmarking is an important part of most

organizations budgeting, planning, and performance evaluation

Anthony and Govindarajan (2003) stress that frequent reporting is a critical success

factor as timely and accurate information is important for evaluation

Merchant and Van der Stede (2007) suggest that it is common to use both residual

and ratio measures to evaluate individual business units

Hesford and Potter (2010) cite that an overwhelming number of executives in the

hospitality industry use non-financial measurements in performance evaluation

Samuelsson (2004) asserts that organizations use both financial and non-financial

targets as a basis of evaluation to reward employees

Potter and Schmidgall (1999) note that when evaluating individual business units, is

uncommon to allocate overhead costs as a basis for evaluation

Notable inconsistencies with the theoretical perspectives include the following:

Anthony and Govindarajan (2003) claim that it is common for organizations to

develop a capital budget in the planning process

Schmidgall and De Franco (1998) suggest that organizations in the hospitality

industry do not commonly adjust their budgets during the operating period

95

7.1.2 The Affect of the Main Contingency Factors

Strategy

Certain control tools have been found to be preferred over others in relation to the

organization’s strategy.

In the organizations with diversified strategies the use of performance

measurements related to business unit performance was found to be more frequent

Less diversification was found to lead to less comprehensive management control

systems

The strategy of differentiation and value based management was found to increase

the use of non-financial performance measurement, particularly customer focused

performance measurements.

Limited financial resources were found to increase the relative amount of cost items

in the budget

The hotel industry context was found to be linked to the use of external

benchmarking

Size & Structure

Increased size was found to be positively correlated with increased control tightness

Increased size was found to be positively correlated with increased number of

performance measurements

Increased size was found to be positively correlated with increased number of

planning tools

The smaller organizations of the study tended to utilize looser control and rely on

personal interactions as means of control to a greater extent

The number of business units of the organizations was found to be positively

correlated with the number of performance measurements related to business unit

performance

In the smaller organizations, non-financial reward systems were found to be more

commonly used

96

Ownership

Active owners with invested interest and business knowledge were found to add

more performance measurements and tighter control

Municipal funding was found to decrease the number of performance

measurements, cause looser control and grant limited use of reward systems

The organizations that are part of a larger organization were found to use additional

performance measurements related to business unit control

Product Life Cycle

The question marks were found to utilize substantial amounts of performance

measurements as well as tight control

Behavior control with an increased focus on employee efficiency and morale, was

also linked to the status of question mark

Unsurprisingly, the organizational culture was found to be less influential in the

question marks

The cash cows were found to utilize significant employee trust and empowerment

The low growth was found to yield a need for operational efficiency, reflected in the

performance measurements

Tight and extensive management control tools were found to be used in the cash

cows

The organizational culture was found to be relatively influential in the cash cows

7.2 Recommendations of Management Control Systems

As discussed in chapter two, the authors are aware of the limited possibilities of

generalization due to the nature of the study. However, in this section, a general discussion

will be held concerning the potential usefulness of the findings of the study. This discussion

will be divided into two parts. First, the authors will discuss possible recommendations to

organizations related to the hospitality industry. Secondly, possible recommendations for

the organizations included in this study will be presented.

97

7.2.1 Recommendations to Organizations Related to the Hospitality Industry

As suggested throughout this study, the management control systems of any organizations

are bound to be linked to the contingency factors. Failure to take such factors into account

may keep the organization from realizing its objectives. Therefore, it is only natural to base

discussion regarding recommendations around the four contingency factors discussed in the

previous chapter.

Strategy

The authors recommend that organizations with diversified organizational structures, should

implement performance measurements related to the performance of the individual

business units. Such performance measurements are likely to increase the performance

incentives of unit managers, as well as clearly allocate responsibility and accountability.

An organization pursuing the strategy of differentiation is recommended to pay particular

attention to non-financial measurements. Such reasoning is based on the notion that

profitability in the hospitality industry is based on a prioritized customer focus and not the

internal operations. However, the importance of cost measurements in the management

control systems must not be neglected.

In particular, cost measurements must not be neglected if the organization is pursuing the

strategy of cost leader. In such a circumstance it is recommended to pay particular attention

to the budget and cost measurements such as efficiency as the importance of the internal

operations are increased.

Size & Structure

For a small organization looking to enter the hospitality industry or adapt its management

control systems, the authors’ recommendation is to implement relatively loose control.

Moreover, given the limited size managers should rely on frequent personal interactions

instead of formalized control tools such as business unit performance measurements.

Planning tools such as the strategic plan and forecasts are not recommended if reliable

estimates cannot be made.

98

As, tighter control have been found to be more frequently used in the larger organizations,

and is supported in theory, such a recommendation is natural. Formal control systems are

likely needed as management increases its scope of responsibility. Larger organizations are

furthermore recommended to structure the organization according to separate business

units to delegate responsibility and accountability.

Ownership

Non-profit organizations are recommended to rely on looser control as employee

empowerment is likely to be a more efficient incentive. This is linked to the fundamental

incentives that attract employees to the organization.

Profit driven organization are recommended to implement additional performance

measurements and tighter control.

Product Life Cycle

Question marks are recommended to implement a comprehensive management control

system as well as tight control. This is primarily linked to the youth of the organization and

the relatively high exposure to business risk. The manager should also focus on developing

the organizational culture as a complementary control tool.

Cash cows are recommended to gradually loosen the control and rely more on employee

trust and empowerment. This is primarily linked to the maturity of the organization and the

relatively low exposure to business risk.

Dogs – Inconclusive

Stars – Inconclusive

7.2.2 Recommendations to the Case Organizations

This section will be introduced with recommendations that can be distinguished as general

to the organizations included in this study. Secondly, the recommendations to the individual

organizations will be presented. Some recommendations can be distinguished as general to

99

the three Scandic Hotels and will therefore be presented collectively. Finally,

recommendations to the individual Scandic Hotels will be presented.

General Recommendations

Except for the Scandic Star Lund’s partial use of the balanced scorecard, none of the

organizations have implemented this tool even though one of its main advantages is that of

linking the organizations strategy with management control system. The authors believe that

defining and limiting the number of performance measurements to those most important,

would be a constructive exercise for the organizations of this study. This is particularly

relevant for Scandic Hotel Kramer, Scandic Malmö City and BrewPub København as these

organizations do not presently use the balanced scorecard but use significant amounts of

performance measurements. Furthermore, the process of developing the scorecard itself,

can help the organizations discover ways to improve.

As the organizations of this study are relatively small, the budgeting process is likely to be a

time consuming process in relation to the total time available. Rolling forecasts are however

simplistic in their nature and do not consume as much time as the budget. The authors do

not propose substituting the budget, merely complementing it with a tool that allows them

to update the planning more frequently in regards to changes in customer demand and

economic climate.

Concerning the allocation of overhead costs, the authors recommend that such efforts

should be made only if a reasonable and fair basis for assigning these overhead costs can be

determined. The incentives for the business unit managers to increase the efficiency of

resources consumption could thereby be increased.

As all organizations included in the study are vertically and functionally structured, the

authors recommend a further devolvement of the process perspective of management

control. A vertical structure is most likely needed, although the horizontal, customer based

perspective would emphasize the value adding activities. The recommendation is therefore

to manage the processes instead of the structural functions, starting with process view

measurements.

100

The absence of inventory buffers, as described in section 3.2, significantly increases the

importance of planning. To assist and facilitate the planning process the authors recommend

that digitization tools are implemented.

Given the fact that production and consumption of services generally occur at the same

time, the importance of human resource management is, as mentioned in section 3.2

significantly increased in the hospitality industry. The authors therefore recommend that the

organizations pay particular attention to quality control, a factor which can be difficult to

measure.

BrewPub København

Given the size, stability and strategy of BrewPub København the authors recommend

constructing a formal strategic plan, a one year business plan and a capital budget. The

strategic plan would provide the brewpub with a clear idea of the organization’s direction in

the next couple of years. Differing from the long-term strategic plan, the one year business

plan would assist the brewpub in achieving specific non-financial goals during the coming

year. The capital budget would facilitate the brewpub’s ability to plan for specific projects

that will be implemented within the next few years and will require a significant amount of

resources.

As the possibilities for external benchmarking in the restaurant industry are extensive, the

authors recommend that the brewpub take advantage of this possibility to create incentives

for continuous improvement.

When evaluating the brewery unit, the authors recommend that the cost of capital be taken

into account. Such an adjustment would likely provide the business unit managers with

additional incentives to increase operational efficiency.

To provide the Managing Director with information concerning how much cash is needed

during the period, the authors recommend a budgeted cash flow statement. Furthermore,

lines of credit and short-term borrowing can be planned using this tool.

101

A further recommendation of the authors’ includes fully integrating the point-of-sales

system into the forecasting. Such a technicality would simplify the procedure and enhance

the accuracy. Finally, as the original budget is prepared well in advance of the fiscal year,

quarterly budget adjustments would provide management with more accurate updates.

Färs & Frosta Sparbank Arena

The authors’ main recommendation concerning FFSA is to construct an operating budget.

Such a tool would allow FFSA to fine-tune the strategic objectives and assist in the

coordination of the organization. Furthermore, the responsibilities and goals of each

business unit would be clarified. Finally, the basis for performance evaluation would be

spelled out.

Connected to the operating budget is the recommendation to utilize monthly reporting and

construct a budgeted cash flow statement. Such tools will facilitate the planning of how

much cash is needed during the period. Furthermore, using the budgeted cash flow

statement, lines of credit and short-term borrowing can be planned.

As the need for investment in the facilities is likely to increase during the coming years, the

authors’ recommendation is to construct a capital budget. This tool would facilitate the

ability to plan for specific projects that will be implemented within the next few years and

will require a significant amount of resources.

Related to the general recommendation of process focused management control systems, is

the implementation of a customer relationship management system. A first step toward

such a system would involve implementing performance measurements related to the

customer perspective at FFSA. Furthermore, it is recommended that performance

measurements such as labor cost as percentage of revenue, total labor hours as well as labor

per unit are implemented.

Kulturmejeriet

The authors’ main recommendation for Kulturmejeriet involves reorganizing the board. The

fact that the association managers are active board members has been shown to have

102

negative effects such as fund allocation issues, as they work in self interest. Therefore, the

authors recommend that the bias be reduced through appointment of external board

members.

Kulturmejeriet is also recommended to increase their focus on the customer perspective of

their business. The authors suggest that this should be done by implementation of non-

financial measurements such as customer satisfaction and quality control. Finally, the

authors recommend that measurements such as labor cost as a percentage of revenues and

total labor hours be added.

Scandic Hotels General Recommendations

General to the three Scandic Hotels, the authors recommend implementation of the

strategic plan. This tool would likely provide the hotels with a clear idea of the organization’s

direction in the next years as well as outline the approximate amount of resources that will

be needed in each hotel.

Scandic Hotel Kramer & Scandic Malmö City

For Scandic Hotel Kramer and Scandic Malmö City the authors recommend implementation

of performance measurements such as net income, sick leave and employee turnover.

Furthermore, inspired by Scandic Star Lund, conference evaluations are recommended to

stimulate continuous improvement. To ensure follow up of the evaluations and the guest

suggestions, a measurement of improvement implementation is recommended.

Given the occurrence of behavior control I Scandic Malmö City, the authors recommend a

gradual move towards empowerment, trust and rewards as the management control

systems come in place and the organization matures. This is linked to the finding of

Samuelsson (2004), stating that individuals are further motivated by the possibility of being

rewarded than the risk of being penalized.

Scandic Star Lund

It should be stressed that the management control systems of Scandic Star Lund are likely

the most comprehensive of the ones included in this study. In light of this, the authors

103

recommend that the number of non-financial measurements is reduced to provide a

clarified focused of the truly important ones. This is related to Jones’ (2005) work on the

increasing importance of information selection and to the work of Kaplan and Norton (1992)

concerning the potential overload of information. As the balanced scorecard is essentially

used, this tool can favorably be used to provide guidance in this reduction process.

7.3 Recommendations for Future Research

During the process of this study a number of possibilities for future research have been

identified. In this section, the authors present a summary of the most significant.

Although text editions such as Harris (1995) offer an extensive coverage of management

control systems in the hospitality industry, systematic research of what performance

measurements are actually being used by organizations in the hospitality industry were not

found.

Research concerning what management control systems are used in different sectors of the

hospitality industry is rare. Although the hotel industry is relatively well covered, the

restaurant industry was found to be significantly less covered. Research related to leisure,

sport and recreation was found to be covered minimally.

The analysis of this study indicated that the product life cycle of the organization had

significant influence on the management control systems. The authors found no research

related to this subject, indicating a strong potential for future research.

It has become increasingly common for hotels to be owned by hotel investment

corporations. This ownership structure was represented in this study by Scandic Hotels. As

the ownership is distanced from the operations, possibilities arise for future studies of the

importance of management controls systems in such settings.

104

As this study has shown, informal control is preferably used in the hospitality industry.

However, research exploring the particular field of hospitality was not found, indicating a

potential for future research.

As discussed by Phillips & Louvieris (2005) and others, the implementation of the balanced

scorecard in the hospitality industry is often fragmented rather than complete. To further

explain the causality of such implementations, additional deductive studies based on the

balanced scorecard approach can therefore be recommended.

In the organizations included in this study the process based view of management control

was not used. The authors suggest that future research of how resources are consumed in

the hospitality industry would further enhance the process based view in this field.

As Kaplan and Norton (1992) suggest, the links between financial and non-financial

measurements of performance can be clarified using the balanced scorecard. The authors

recommend future research on how the context of the hospitality industry affects these

links.

105

VIII. References

8.1 Literature

8.1.1 Text Editions

Anthony, R. N. and Govindarajan, V., 2007. Management Control Systems. 12th international ed. Singapore: McGraw-Hill. Anthony, R. N. and Govindarajan, V., 2003. Management Control Systems. 11th international ed. Singapore: McGraw-Hill. Brander Brown, J., 1995. Management Control in The Hospitality Industry: Behavioural Implications. In: Harris, P., ed. 1995. Accounting and Finance for the International Hospitality Industry. Oxford: Butterworth-Heinemann. Ch. 10. Bryman, A. and Bell, E., 2003. Business Research Methods. Oxford: Oxford University Press. Hopper, T. Northcott, D. and Scapens, R. eds., 2007. Issues in Management Accounting. 3rd ed. Harlow: Pearson Education. Jones, T. A., 1995. Identifying managers’ information needs in hotel companies. In: Harris, P., ed. 1995. Accounting and Finance for the International Hospitality Industry. Oxford: Butterworth-Heinemann. Ch. 9. Lashley, C. and Morrison, A., 2000. In Search of Hospitality: Theoretical Perspectives and Debates. Oxford: Butterworth Heinemann. Lindvall, J., 2001. Versamhetsstyrning. Lund: Studentlitteratur. Merchant, K. A. and Van der Stede, W. A., 2007. Management Control Systems: Performance Measurement, Evaluation & Incentives. 2nd ed. Harlow: Pearson Education. Porter, M.E., 1980. Competitive Strategy. New York: Free Press. Samuelsson, L. A. ed., 2004. Controllerhandboken. 8th ed. Uppsala: Teknikföretagen and Industrilitteratur AB. Yin, R. K., 2003. Case Study Research: Design and Methods. Thousand Oaks, CA: Sage Publications.

8.1.2 Journal Articles

Brotherton, B., 1999. Towards a definitive view of the nature of hospitality and hospitality management. International Journal of Contemporary Hospitality Management, 11(2), pp.165-17. Hesford, J. W. and Potter, G., 2010. : A Review with Suggestions for Future Research Cornell Quarterly Accounting Research in the. Cornell Hospitality Quarterly, 51(4), pp.503-512.

106

Hope, J. and Fraser, R., 2003. Who Needs Budgets?. Harvard Business Review [serial online]. 81(2), pp.108-115. Retrieved from: Business Source Complete. Kaplan, R. S. and Norton, D. P., 1992. The Balanced Scorecard - Measures That Drive Performance. Harvard Business Review, 70(1), pp.71-79. Retrieved from EBSCOhost.

Kwansa, F., Schmidgall, R.S., 1999. The USALI: Its Development, Function, Acceptance and Usage. Working paper, University of Delaware and Michigan State University.

Lashley, C., 2000. In search of hospitality: towards a theoretical framework. International Journal of Hospitality Management, 19(1), pp.3-15. Levitt, T., 1965. Exploit the Product Life Cycle. Harvard Business Review, 43(6), pp.81-94. Retrieved from EBSCOhost. Markides, C. C., and Williamson, P. J., 1994. Related Diversification, Core Competences and Corporate Performance. Strategic Management Journal, 15, pp.149-165. Retrieved from EBSCOhost. Ouchi, W. G., 1979. A Conceptual Framework For the Design of Organizational Control Mechanisms. Management Science, 25(9), pp.833-848. Retrieved from EBSCOhost. Phillips, P. and Louvieris, P., 2005. Performance Measurement Systems in Tourism, Hospitality, and Leisure Small Medium-Sized Enterprises: A Balanced Scorecard Approach. Journal of Travel Research, (44), pp.201-211. Potter, G and Schmidgall, R. S. 1999. Hospitality management accounting: Current Problems and Future Opportunities. International Journal of Hospitality Management, (18), pp.387-400. Slattery, P., 2002. Finding the Hospitality Industry. Journal of Hospitality, Leisure, Sport & Tourism Education, 1(1), pp.19-28. Retrieved from EBSCOhost.

Schmidgall, R. S., DeFranco, A. L., 1998. Budgeting and Forecasting : Current Practice in the Lodging Industry. Budgeting and Forecasting: Current Practice in the Lodging Industry, (39), pp.39-45.

8.1.3 Electronic References

Färs & Frosta Sparbank, 2008. [online] Available at: <http://www.fofsparbankarena.se> [Accessed 2011-04-25]. KulturMejeriet, 2011. Föreningen. [online] Available at: <http://www.kulturmejeriet.se/index.php/om-mejeriet/foreningen/> [Accessed 2011-04-29]. Scandic Hotels, 2008. Scandic Fact Sheet. [online] Available at: <http://www.scandichotels.com/Global/Fact%20sheets/Fact%20sheet%20about%20Scandic%20ENG.pdf> /> [Accessed 2011-04-22].

107

Ideas, 2011. Software & Services. [online] Available at: <http://www.ideas.com/index.php/software-services/software/> [Accessed 2011-05-15]. The Boston Consulting Group, 2011. The Star, the Dog, the Cow and the Question Mark. [online] Available at: <http://www.bcg.com/about_bcg/history/history_1968.aspx> [Accessed 2011-05-02].

The European Commision, 2004. The European Tourism Industry. [online] Available at: <http://ec.europa.eu/enterprise/sectors/tourism/documents/studies/index_en.htm> [Accessed 2011-05-22]. Swedish Agency for Economic and Regional Growth/SCB, 2008. Årsbokslut för svensk turism och turistnäring. [online] Available at: <http://publikationer.tillvaxtverket.se/ProductView.aspx?ID=1047> [Accessed 2011-05-22] Swedish Agency for Growth Policy Analysis, 2010. Tjänstesektorns storlek. Working Paper/PM. [online] Available at: <http://www.tillvaxtanalys.se/sv/publikationer/working_paper-pm/article0018.html> <Accessed 2011-05-10>

8.2 Interviews

Mr. Jens Mortensen, Managing Director of BrewPub Kobenhavn, 20110328 and 20110406 Mr. Berne Nilsson, CEO of Färs & Frosta Sparbank Arena, 20110406 Mr. Patrik Redgård, Marketing & Sales Director of Färs & Frosta Sparbank Arena, 20110413 Mr. Matti Kortelainen, Managing Director of Kulturmejeriet, 20110420 Mr. Tomas Tegfors, General Manager of Scandic Kramer Malmö, 20110412 and 20110508 Ms. Anna Boudrie General Manager of Scandic Malmö City, 20110416 Ms. Helene Arvidsson, General Manager of Scandic Star Lund, 20110412 Mr. Pontus Mark, Revenue Manager of Scandic Malmö Region, 20110428

108

IX. Appendix

(Documents originally Swedish/Danish. Translated by Soderlund, 2011) Exhibit 1.A (Collected on 2011-05-11)

Revenue Date:

Version:

Season: -- -- -- --

Jan Feb March April May June July Aug Sept Oct Nov Dec Total

Figures 2010 Ex. VAT -- -- -- -- -- -- -- -- -- -- -- -- --

Account REVENUE Share T/O

001 Food -- -- -- -- -- -- -- -- -- -- -- -- -- --

002 Beer- License Bottle -- -- -- -- -- -- -- -- -- -- -- -- -- --

003 Beer- Bottle- Own Brew -- -- -- -- -- -- -- -- -- -- -- -- -- --

004 Beer- Draft- Own Brew -- -- -- -- -- -- -- -- -- -- -- -- -- --

005 Beer- Bottle- Contract -- -- -- -- -- -- -- -- -- -- -- -- -- --

006 Beer- Draft- Contract -- -- -- -- -- -- -- -- -- -- -- -- -- --

007 Beer Cocktails -- -- -- -- -- -- -- -- -- -- -- -- -- --

008 Wine -- -- -- -- -- -- -- -- -- -- -- -- -- --

009 Water -- -- -- -- -- -- -- -- -- -- -- -- -- --

010 Water- Own Production -- -- -- -- -- -- -- -- -- -- -- -- -- --

011 Coffee -- -- -- -- -- -- -- -- -- -- -- -- -- --

012 Spirits -- -- -- -- -- -- -- -- -- -- -- -- -- --

013 Brewpub Cider -- -- -- -- -- -- -- -- -- -- -- -- -- --

014 Tour Tasting -- -- -- -- -- -- -- -- -- -- -- -- -- --

015 Drinks -- -- -- -- -- -- -- -- -- -- -- -- -- --

016 Turnover Miscellaneous -- -- -- -- -- -- -- -- -- -- -- -- -- --

017 External Sales- BP Draft -- -- -- -- -- -- -- -- -- -- -- -- -- --

018 Discounts Granted -- -- -- -- -- -- -- -- -- -- -- -- -- --

019 Voucher -- -- -- -- -- -- -- -- -- -- -- -- -- --

020 Commissions -- -- -- -- -- -- -- -- -- -- -- -- -- --

021 Cash Discrepancies -- -- -- -- -- -- -- -- -- -- -- -- -- --

REVENUE TOTAL 100% -- -- -- -- -- -- -- -- -- -- -- -- --

Jan Feb March April May June July Aug Sept Oct Nov Dec Total

Figures 2010 Ex. VAT -- -- -- -- -- -- -- -- -- -- -- -- --

Account Cost of Goods Sold Share T/O

201 Kitchen- Meat -- -- -- -- -- -- -- -- -- -- -- -- -- --

202 Kitchen- Fish -- -- -- -- -- -- -- -- -- -- -- -- -- --

203 Kitchen- Vegetables -- -- -- -- -- -- -- -- -- -- -- -- -- --

204 Kitchen- Other -- -- -- -- -- -- -- -- -- -- -- -- -- --

205 Beer- License Brew -- -- -- -- -- -- -- -- -- -- -- -- -- --

206 Beer- Bottle- Own Brew -- -- -- -- -- -- -- -- -- -- -- -- -- --

207 Beer- Draft- Own Brew -- -- -- -- -- -- -- -- -- -- -- -- -- --

208 Beer- Draft- Contract -- -- -- -- -- -- -- -- -- -- -- -- -- --

209 Beer- Bottle- Contract -- -- -- -- -- -- -- -- -- -- -- -- -- --

210 Beer- Kegs- Own Brew -- -- -- -- -- -- -- -- -- -- -- -- -- --

211 Beer- Kegs- Contract -- -- -- -- -- -- -- -- -- -- -- -- -- --

212 Recycling- Keg -- -- -- -- -- -- -- -- -- -- -- -- -- --

213 Recycling- Bottles -- -- -- -- -- -- -- -- -- -- -- -- -- --

214 Wine -- -- -- -- -- -- -- -- -- -- -- -- -- --

215 Water- Own Production -- -- -- -- -- -- -- -- -- -- -- -- -- --

216 Juice -- -- -- -- -- -- -- -- -- -- -- -- -- --

217 Coffee -- -- -- -- -- -- -- -- -- -- -- -- -- --

218 Sugar, Candy -- -- -- -- -- -- -- -- -- -- -- -- -- --

219 Spirits -- -- -- -- -- -- -- -- -- -- -- -- -- --

220 Raw Mat.- Hops -- -- -- -- -- -- -- -- -- -- -- -- -- --

221 Raw Mat.- Malt -- -- -- -- -- -- -- -- -- -- -- -- -- --

222 Raw Mat.- Yeast -- -- -- -- -- -- -- -- -- -- -- -- -- --

223 Raw Mat.- Salt -- -- -- -- -- -- -- -- -- -- -- -- -- --

224 Raw Mat.- Sugar -- -- -- -- -- -- -- -- -- -- -- -- -- --

225 Raw Mat.- Cider -- -- -- -- -- -- -- -- -- -- -- -- -- --

226 Beer Tax -- -- -- -- -- -- -- -- -- -- -- -- -- --

TOTAL Cost of Goods Sold 100% -- -- -- -- -- -- -- -- -- -- -- -- --

Cost of Goods Sold

Revenue

Easter 2011

1

06/01 2011Price Changes:

Beer

Price Changes:

Menu

New

Margin

Brewpub KobenhavnBudget 2011

New

MarginAdjusted Adjusted

109

Exhibit 1.A (Continued)

Jan Feb March April May June July Aug Sept Oct Nov Dec Total

-- -- -- -- -- -- -- -- -- -- -- -- --

Account Indirect Costs Share T/O

301 Linen -- -- -- -- -- -- -- -- -- -- -- -- -- --

302 Light and Lamp Oil -- -- -- -- -- -- -- -- -- -- -- -- -- --

303 Flowers -- -- -- -- -- -- -- -- -- -- -- -- -- --

304 Napkins -- -- -- -- -- -- -- -- -- -- -- -- -- --

305 Cleaning Supplies -- -- -- -- -- -- -- -- -- -- -- -- -- --

306 Laboratory Equipment -- -- -- -- -- -- -- -- -- -- -- -- -- --

307 Carbon Dioxide -- -- -- -- -- -- -- -- -- -- -- -- -- --

308 Gas for kitchen and patio -- -- -- -- -- -- -- -- -- -- -- -- -- --

309 Miscellaneous Consump. -- -- -- -- -- -- -- -- -- -- -- -- -- --

310 Loss- Beer -- -- -- -- -- -- -- -- -- -- -- -- -- --

311 Loss- Wine -- -- -- -- -- -- -- -- -- -- -- -- -- --

312 Loss- Kitchen mistakes -- -- -- -- -- -- -- -- -- -- -- -- -- --

313 Loss- Server mistakes -- -- -- -- -- -- -- -- -- -- -- -- -- --

TOTAL Indirect Costs 100% -- -- -- -- -- -- -- -- -- -- -- -- --

Indirect Costs as a % of Rev. --

Jan Feb March April May June July Aug Sept Oct Nov Dec Total

-- -- -- -- -- -- -- -- -- -- -- -- --

Account Marketing Costs Share T/O

401 Ads and Comm. -- -- -- -- -- -- -- -- -- -- -- -- -- --

402 Discounts- Ads and Comm. -- -- -- -- -- -- -- -- -- -- -- -- -- --

403 Direct Selling Costs -- -- -- -- -- -- -- -- -- -- -- -- -- --

404 Entertainment -- -- -- -- -- -- -- -- -- -- -- -- -- --

405 Restoration Visit -- -- -- -- -- -- -- -- -- -- -- -- -- --

406 Gifts and Flowers -- -- -- -- -- -- -- -- -- -- -- -- -- --

407 Beer Festival -- -- -- -- -- -- -- -- -- -- -- -- -- --

408 Decoration -- -- -- -- -- -- -- -- -- -- -- -- -- --

409 Packaging -- -- -- -- -- -- -- -- -- -- -- -- -- --

410 Representation -- -- -- -- -- -- -- -- -- -- -- -- -- --

TOTAL Marketing Costs 100% -- -- -- -- -- -- -- -- -- -- -- -- --

Marketing as a % of Rev. --

Jan Feb March April May June July Aug Sept Oct Nov Dec Total

-- -- -- -- -- -- -- -- -- -- -- -- --

Account Rent and Utilities Share T/O

501 Rents -- -- -- -- -- -- -- -- -- -- -- -- -- --

502 Common Costs -- -- -- -- -- -- -- -- -- -- -- -- -- --

503 Common Costs (Prev. Yr) -- -- -- -- -- -- -- -- -- -- -- -- -- --

504 Rent- Remote Warehouse -- -- -- -- -- -- -- -- -- -- -- -- -- --

505 Heating -- -- -- -- -- -- -- -- -- -- -- -- -- --

506 Heating (Prev. Yr) -- -- -- -- -- -- -- -- -- -- -- -- -- --

507 Gas -- -- -- -- -- -- -- -- -- -- -- -- -- --

508 Electricity -- -- -- -- -- -- -- -- -- -- -- -- -- --

509 Electricity (Prev. Yr) -- -- -- -- -- -- -- -- -- -- -- -- -- --

510 Water -- -- -- -- -- -- -- -- -- -- -- -- -- --

511 Furniture -- -- -- -- -- -- -- -- -- -- -- -- -- --

512 Renovation and Mainten. -- -- -- -- -- -- -- -- -- -- -- -- -- --

513 Cleaning -- -- -- -- -- -- -- -- -- -- -- -- -- --

514 Micellaneous -- -- -- -- -- -- -- -- -- -- -- -- -- --

TOTAL Rent and Util. 100% -- -- -- -- -- -- -- -- -- -- -- -- --

Rent and Util. as a % of Rev. --

Jan Feb March April May June July Aug Sept Oct Nov Dec Total

-- -- -- -- -- -- -- -- -- -- -- -- --

Account Labor Costs Share T/O

701 Executive Salaries -- -- -- -- -- -- -- -- -- -- -- -- -- --

702 Consulting -- -- -- -- -- -- -- -- -- -- -- -- -- --

703 Sick Pay -- -- -- -- -- -- -- -- -- -- -- -- -- --

704 Bonus -- -- -- -- -- -- -- -- -- -- -- -- -- --

705 Holiday Pay -- -- -- -- -- -- -- -- -- -- -- -- -- --

706 Directors Fees -- -- -- -- -- -- -- -- -- -- -- -- -- --

707 Pension -- -- -- -- -- -- -- -- -- -- -- -- -- --

708 Workwear -- -- -- -- -- -- -- -- -- -- -- -- -- --

709 Staff Costs -- -- -- -- -- -- -- -- -- -- -- -- -- --

710 Transport and Parking -- -- -- -- -- -- -- -- -- -- -- -- -- --

711 Meal Program -- -- -- -- -- -- -- -- -- -- -- -- -- --

712 Distribution Wages -- -- -- -- -- -- -- -- -- -- -- -- --

713 Restaurant Wages -- -- -- -- -- -- -- -- -- -- -- -- --

714 Brewers Wages -- -- -- -- -- -- -- -- -- -- -- -- --

715 Kitchen Wages -- -- -- -- -- -- -- -- -- -- -- -- --

TOTAL Labor Costs 100% -- -- -- -- -- -- -- -- -- -- -- -- --

Labor Costs as a % of Rev. --

Rent and UtilitiesFigures 2010 Exc. VAT

Labor CostsFigures 2010 Exc. VAT

Figures 2010 Exc. VAT

Indirect Costs

Marketing CostsFigures 2010 Exc. VAT

110

Exhibit 1.A (Continued)

Jan Feb March April May June July Aug Sept Oct Nov Dec Total

-- -- -- -- -- -- -- -- -- -- -- -- --

Account Depreciation Share T/O

801 Depreciation Brewery -- -- -- -- -- -- -- -- -- -- -- -- -- --

802 Depreciation Furniture -- -- -- -- -- -- -- -- -- -- -- -- -- --

803 Depreciation Kitchen -- -- -- -- -- -- -- -- -- -- -- -- -- --

804 Amoritization Goodwill -- -- -- -- -- -- -- -- -- -- -- -- -- --

805 Depretiation Other -- -- -- -- -- -- -- -- -- -- -- -- -- --

TOTAL Depreciation 100% -- -- -- -- -- -- -- -- -- -- -- -- --

Jan Feb March April May June July Aug Sept Oct Nov Dec Total

-- -- -- -- -- -- -- -- -- -- -- -- --

Account Financial Income Share T/O

901 Interest Income Banking -- -- -- -- -- -- -- -- -- -- -- -- -- --

902 Interest Receivable -- -- -- -- -- -- -- -- -- -- -- -- -- --

903 Fee Foreign Cards -- -- -- -- -- -- -- -- -- -- -- -- -- --

904 Creditor Cash Rebates -- -- -- -- -- -- -- -- -- -- -- -- -- --

905 Capital Gains -- -- -- -- -- -- -- -- -- -- -- -- -- --

Total Financial Income 100% -- -- -- -- -- -- -- -- -- -- -- -- --

Account Financial Expenses Share T/O

111 Interest Expense Overdraft -- -- -- -- -- -- -- -- -- -- -- -- -- --

112 Interest Pay Foreign Exch. -- -- -- -- -- -- -- -- -- -- -- -- -- --

113 Interest Costs EUR Loan -- -- -- -- -- -- -- -- -- -- -- -- -- --

114 Creditor Interest -- -- -- -- -- -- -- -- -- -- -- -- -- --

115 Losses on Bad Debts -- -- -- -- -- -- -- -- -- -- -- -- -- --

116 Fees Otherwise -- -- -- -- -- -- -- -- -- -- -- -- -- --

117 Registration Costs -- -- -- -- -- -- -- -- -- -- -- -- -- --

118 Capital Losses -- -- -- -- -- -- -- -- -- -- -- -- -- --

119 Interest- Shareholder -- -- -- -- -- -- -- -- -- -- -- -- -- --

Total Financial Expenses 100% -- -- -- -- -- -- -- -- -- -- -- -- --

Net Financial --

DepreciationFigures 2010 Exc. VAT

Net Financial Gains and LossesFigures 2010 Exc. VAT

111

Exhibit 1.B (Collected on 2011-05-11)

Excl. VAT

Ratio: Actual Budgeted Deviation Actual Budgeted Deviation

Entire BrewPub:

Kitchen: Actual Budgeted Deviation Actual Budgeted Deviation

Total Costs Food: -- -- -- -- -- --

Supplies Total: -- -- -- -- -- --

Kitchen Contribution: -- -- -- -- -- --

Percentage Per Group:

Meat -- -- -- -- -- --

Fish -- -- -- -- -- --

Vegetables -- -- -- -- -- --

Other -- -- -- -- -- --

Kitchen Beer Use -- -- -- -- -- --

Restaurant/Bar: Actual Budgeted Deviation Actual Budgeted Deviation

Revenue Total -- -- -- -- -- --

Revenue Breakdown %

Beer- Draft- Own Brew -- -- -- -- -- --

Beer- Draft- Ext. Brew -- -- -- -- -- --

Beer- Bottles- Ext. Brew -- -- -- -- -- --

Beer Cocktails -- -- -- -- -- --

Wine -- -- -- -- -- --

Water/Coke/Other Ext. -- -- -- -- -- --

Water Own -- -- -- -- -- --

Coffee -- -- -- -- -- --

Spirits -- -- -- -- -- --

Cider- Own Brew -- -- -- -- -- --

Tour/Tasting -- -- -- -- -- --

Turnover Miscellaneous -- -- -- -- -- --

External Sales -- -- -- -- -- --

Cash Discrepincies -- -- -- -- -- --

Labor Cost as % of Rev. Actual Budgeted Deviation Actual Budgeted Deviation

Labor Cost as a % of Kitchen Rev. -- -- -- -- -- --

Labor Cost as a % of Total Rev. -- -- -- -- -- --

Labor Cost as a % of Beverage Rev. -- -- -- -- -- --

Labor Cost as a % of Total Rev. -- -- -- -- -- --

YTDMonth: January

Year: 2011KPI Report

112

Exhibit 1.C (Collected on 2011-05-11)

Excl. VAT

Actual Budgeted Deviation Actual Budgeted Deviation

Revenue: -- -- -- -- -- --

Deviation % -- -- -- -- -- --

Costs:

Cost of Goods Sold -- -- -- -- -- --

Gross Profit: -- -- -- -- -- --

Profit Magin -- -- -- -- -- --

Expenses:

Marketing

Marketing Costs -- -- -- -- -- --

Marketing as a % of Sales -- -- -- -- -- --

Indirect Costs

Local Costs -- -- -- -- -- --

Administrative Expenses -- -- -- -- -- --

Staff Costs -- -- -- -- -- --

Total Costs -- -- -- -- -- --

EBIT -- -- -- -- -- --

EBIT % -- -- -- -- -- --

Efficiency: Revenue Per Hour Worked

Total

Server

Kitchen

Week Scheduled Actual Deviation Scheduled Actual Deviation

1 -- -- -- -- -- --

2 -- -- -- -- -- --

3 -- -- -- -- -- --

4 -- -- -- -- -- --

5 -- -- -- -- -- --

Total -- -- -- -- -- --

Variance % for the month:

Year to Date

Variance % YTD

Gross Profit- Kitchen

Total Revenues

Cost of Goods Sold

Costs of Goods Sold (50%)

Salary

Gross Profit- Kitchen

Gross Profit- Restaurant

Total Revenues

Cost of Goods Sold

Costs of Goods Sold (50%)

Salary (Including Brewery)

Gross Profit- Restaurant

Monthly Report Year: 2011Month: January YTD

Revenue Rise/Fall from 2010-1011Month: January YTD

----

2010 2011 Increase/Decrease %

-- -- --

--

----

--

--

--

Labor Cost in Accordance to Budgeted Hours (Schedule vs. Actual) Kitchen and Restaurant

Kitchen Restaurant

--

--

--

--

--

--

January YTD

January YTD

-- --

-- --

----

-- --

----

-- --

-- --

-- --

-- --

-- --

113

Exhibit 2.A (Collected on 2011-04-26)

Sales, 25 % VAT --

Sales, Non VAT --

Contribution FoF Sparbank Foundation --

Revenues Rent Boxes --

Operational Contribution --

Ticket Sales --

Rent of Facilities, Non VAT --

Rent of Facilities, 25 % VAT --

Rent of Facilities, 6 % VAT --

Handball Worldcup 2011 --

Internet Subscription --

Net Revenues --

Total Revenues --

COGS --

Event costs --

Goods and Material --

Handball Worldcup 2011 --

Total COGS --

Cost of Facilities --

Rent of Facilities --

Electricity --

Utilities --

Service of Facility --

Cleaning --

Reparations of Facilities --

Other Costs of Facilities --

Heating --

Leasing of Fixed Assets --

Inventory Consumption --

Software --

Material Consumption --

Reparations of Inventories --

Petrol for Vehicles --

Insurance and Tax for Vehicles --

Leasing Vehicles --

Other Vehicle Costs --

Travel Costs --

PR and Marketing --

Advetisements --

Credit Card Fees --

Representation --

Office Supplies --

Telephone --

Computer Communications --

Post --

Company Insurance --

Survellaince and Alarm System --

Auditor Fees --

Second Auditor --

Accounting Services --

Cunsulting Services --

Banking Services --

Other External Services --

Newspapers, Magazines --

Total External Costs --

Salaries --

Pensions --

Social Fees --

Unemployment Insurance --

Life Insurance --

Human Resources --

Other Personell Costs --

Contributions --

Total Persononell Costs --

Operating Income --

Financial Entries --

Interest Accounts Payable --

Total Financial Entries --

Total Revenues --

Total Costs --

Net Income --

Personell Costs

Profit & Loss FFSA 2001 1st Quarter

External Costs

Costs

Revenues

114

Exhibit 3.A (Collected on 2011-04-20)

Account REVENUES Total 2010 January February March Etc.

001 Membership Fees -- -- -- -- --

002 Rehearsal Facilities / Tutoring -- -- -- -- --

003 Rent of Facilities -- -- -- -- --

004 Percentage of Bar Sales -- -- -- -- --

005 Municipality of Lund -- -- -- -- --

006 Events -- -- -- -- --

007 Rents / Sponsoring -- -- -- -- --

008 Copying Machine / Vehicle -- -- -- -- --

009 Sub-hiring of Personell -- -- -- -- --

010 Other -- -- -- -- --

011 Arch Council of Sweden -- -- -- -- --

012 UKM -- -- -- -- --

013 Bar Revenues -- -- -- -- --

014 Salaries Trans Europé Halles -- -- -- -- --

REVENUES TOTAL

COSTS

015 COGS -- -- -- -- --

016 Arch Council of Sweden -- -- -- -- --

017 UKM -- -- -- -- --

018 Bar Revenues to Associations -- -- -- -- --

019 Surplus distribution -- -- -- -- --

020 Salaries Trans Europé Halles -- -- -- -- --

021 Total COGS -- -- -- -- --

022 GROSS PROFIT -- -- -- -- --

PERSONELL COSTS -- -- -- -- --

024 Salaries -- -- -- -- --

025 Vehicles -- -- -- -- --

026 Pensions -- -- -- -- --

027 Employment Taxes -- -- -- -- --

028 Vacation Salaries -- -- -- -- --

029 Income Tax -- -- -- -- --

030 Competence development -- -- -- -- --

031 Other -- -- -- -- --

032 Total Personell Costs -- -- -- -- --

OTHER COSTS -- -- -- -- --

034 Waste -- -- -- -- --

035 Weekend Cleaning -- -- -- -- --

036 Property Costs -- -- -- -- --

037 Cleaning Supplies -- -- -- -- --

038 Security -- -- -- -- --

039 Office Supplies -- -- -- -- --

040 Maintenance of Technology -- -- -- -- --

041 Vehicles -- -- -- -- --

042 Travelling -- -- -- -- --

043 Marketing -- -- -- -- --

044 Printing Material -- -- -- -- --

045 Phone -- -- -- -- --

046 Computer -- -- -- -- --

047 Postage -- -- -- -- --

048 Electricity -- -- -- -- --

049 Copying Machine -- -- -- -- --

050 Insurance -- -- -- -- --

051 Representation -- -- -- -- --

052 Banking expenses -- -- -- -- --

053 Newspapers, Magazines -- -- -- -- --

054 Membership Fee T.E.H -- -- -- -- --

055 Other Costs -- -- -- -- --

056 TOTAL COSTS -- -- -- -- --

057 REVENUES -- -- -- -- --

058 COSTS -- -- -- -- --

059 AMORTIZATIONS -- -- -- -- --

060 FINANCIAL NET -- -- -- -- --

061 NET INCOME -- -- -- -- --

Kulturmejeriet Budget and Follow Up 2010

115

Exhibit 3.B (Collected on 2011-04-20)

ARTIST: --

DATE: --

VENUE: --

CITY: Lund

CAPACITY: 900

TICKET PRICE: --

SEK + presale 230

SEK. Ticket system fee 12

SEK. STIM (PRS), 6,42 % 10.81

NET TICKET PRICE: 207.19

NET POTENTIAL: 186471

EXPENSES:

HALL RENT 0

HALL STAFF (6) 0

PA & LIGHT 0

TECHNICIANS: 7500

SECURITY: 10000

BOX OFFICE 0

HALL MANAGER: 2500

TECHNICAL ASSISTANT: 0

TICKET PRINT: 0

ARTWORK: 0

ADVERTISING: 5000

POSTER PRINT: 0

FLYER PRINT: 0

POSTER HANGING: 1000

FLYER DISTRIBUTION: 0

DINNER & CATERING: 5000

ARTIST FEE: 75000

SEK. VAT 25% 0

SUPPORT ACTS / DJ: 0

TRANSPORTS: 0

HOTEL: 10000

ADMINISTRATION: 0

MISCELLANEOUS: 0

TOTAL: 116000

BREAK EVEN: 560

TICKETS SOLD: 782

INCOME: 162022.58

EXPENSES: 116000

SUMMARY: 46023

Kulturmejeriet Event Budgeting (Fictional Numbers)

116

Exhibit 4.A (Collected on 2011-05-15)

117

Exhibit 4.B (Collected on 2011-05-15)

Actual Plan Previous Year Actual Revenue Movement --

Net Revenue -- -- --

Rooms Net Revenue -- -- -- Actual Movement in Rooms --

Other Net Revenue -- -- -- Actual Movement in F&B --

Total Rooms Dept. [NR] -- -- -- Actual Movement in Other Revenue --

Other F&B Revenue -- -- -- Actual Movement in Other Overhead --

Sundry Food (Room Hire [NR] -- -- -- Actual Movement in Gross Op. Prof. --

Total Food, Beverages, Sundry[NR] -- -- -- Actual GOP Conversion % --

Total Other [R] -- -- --

Total Net Revenue [NR] -- -- -- Target Movement in ARR --

Target Movement in OCC --

Total Rooms Dept. [DP] -- -- -- Target Movement in Other Rooms --

Total Food, Beverage, Sundry [DP] -- -- -- Target Movement in Total Rooms --

Total Other -- -- --

Departmental Proft -- -- -- Target Movement in Room Hire --

Target Movement in Other F&B --

Overhead Costs -- -- -- Target Movement in Total F&B --

Overhead Payroll -- -- --

Gross Operating Profit -- -- -- Target Movement in Other Revenue --

Gross Operating Profit % -- -- --

Target Movement in GOP --

Key Performance Indicators

Available Rooms -- -- -- Rooms/Surplus/Shortfall --

Total Occupied Rooms -- -- -- F&B Surplus/Shortfall --

Revenue KPIs -- -- -- Overhead Surplus/Shortfall --

OCC% -- -- -- Total Surplus/Shortfall --

Total Average Room Rate -- -- --

RevPAR -- -- -- Target GOP Conversion % --

Different vs Actual GOP Conversion --

Scandic

118

Exhibit 4.C (Collected on 2011-04-28)

119

Exhibit 4.C (Continued)

No. of

rooms

31 28 31 30

JAN D if f vs PLA N FEB D if f vs PLA N MAR D if f vs PLA N APR (Cont.) D if f vs PLA N

Revenue

Disc. Cust. No Refund -- -- -- -- -- -- -- --

Corporate -- -- -- -- -- -- -- --

Disc. Cust, Refund -- -- -- -- -- -- -- --

Non Tourist -- -- -- -- -- -- -- --

Tourist- Travel Agency -- -- -- -- -- -- -- --

Contracts -- -- -- -- -- -- -- --

Meetings -- -- -- -- -- -- -- --

Internal Employees -- -- -- -- -- -- -- --

Total revenue -- -- -- -- -- -- -- --

Rented Rooms -- -- -- --

Disc. Cust. No Refund -- -- -- --

Corporate -- -- -- --

Disc. Cust, Refund -- -- -- --

Non Tourist -- -- -- --

Tourist- Travel Agency -- -- -- --

Contracts -- -- -- --

Meetings -- -- -- --

Internal Employees -- -- -- --

Total rented rooms -- -- -- -- -- -- -- --

Available rooms 7,533 6,804 7,533 7,290

Roomrate -- -- -- --

Disc. Cust. No Refund -- -- -- --

Corporate -- -- -- --

Disc. Cust. Refund -- -- -- --

Non Tourist -- -- -- --

Tourist- Travel Agency -- -- -- --

Contracts -- -- -- --

Meetings -- -- -- --

Internal Employees -- -- -- --

ARR -- -- -- -- -- -- -- --

Occupancy % % % % % % % % %

RevPAR % % % % % % % %

Business Mix %

Disc. Cust. No Refund -- -- -- -- -- -- -- --

Corporate -- -- -- -- -- -- -- --

Disc. Cust. Refund -- -- -- -- -- -- -- --

Non Tourist -- -- -- -- -- -- -- --

Tourist- Travel Agency -- -- -- -- -- -- -- --

Contracts -- -- -- -- -- -- -- --

Meetings -- -- -- -- -- -- -- --

Internal Employees -- -- -- -- -- -- -- --

Total SUM SUM SUM SUM SUM SUM SUM SUM

No. of Guests -- -- -- -- -- -- -- --

No. of Free Nights -- -- -- -- -- -- -- --

Loyalty Redemptions TSEK-- -- -- -- -- -- -- --

Scandic--

OUTCOMEPlan 2011

Room Revenue

120

Exhibit 4.D (Collected on 2011-05-15)

Housing

Forecast 1-Jan 2-Jan 3-Jan 4-Jan ..…-Jan

Housing Sales -- -- -- -- -- -- -- -- --

Rented Rooms -- -- -- -- -- -- -- -- --

REVPAR -- -- -- -- -- -- -- -- --

Occupancy -- -- -- -- -- -- -- -- --

Number of Guests -- -- -- -- -- -- -- -- --

Available Rooms -- -- -- -- -- -- -- -- --

Outcome

Housing Sales -- -- -- -- -- -- -- -- --

Rented Rooms -- -- -- -- -- -- -- -- --

REVPAR -- -- -- -- -- -- -- -- --

Occupancy -- -- -- -- -- -- -- -- --

Number of Guests -- -- -- -- -- -- -- -- --

Available Rooms -- -- -- -- -- -- -- -- --

Statistics REVPAR -- -- -- -- -- -- -- -- --

Deviation

Housing Sales -- -- -- -- -- -- -- -- --

Rented Rooms -- -- -- -- -- -- -- -- --

REVPAR -- -- -- -- -- -- -- -- --

Occupancy -- -- -- -- -- -- -- -- --

Number of Guests -- -- -- -- -- -- -- -- --

Available Rooms -- -- -- -- -- -- -- -- --

Discounts

Forecast -- -- -- -- -- -- -- -- --

Outcome -- -- -- -- -- -- -- -- --

Hours

Front Desk 1-Jan 2-Jan 3-Jan 4-Jan ..…-Jan

Forecast Front Desk Manager -- -- -- -- -- -- -- -- --

Forecast Front Desk Day -- -- -- -- -- -- -- -- --

Forecast Front Desk Night -- -- -- -- -- -- -- -- --

Forecast Total -- -- -- -- -- -- -- -- --

Forecast Rold Rooms / worked hour -- -- -- -- -- -- -- -- --

Outcome Front Desk Manager -- -- -- -- -- -- -- -- --

Outcome Front Desk Day -- -- -- -- -- -- -- -- --

Outcome Front Desk Night -- -- -- -- -- -- -- -- --

Outcome Total -- -- -- -- -- -- -- -- --

Outcome Rold Rooms / worked hour -- -- -- -- -- -- -- -- --

Booking

RevMan 16hx14% -- -- -- -- -- -- -- -- --

Booking 47hx17% -- -- -- -- -- -- -- -- --

Forecast Total -- -- -- -- -- -- -- -- --

Revman -- -- -- -- -- -- -- -- --

Booking -- -- -- -- -- -- -- -- --

Outcome Total -- -- -- -- -- -- -- -- --

Housekeeping

Room cleaning -- -- -- -- -- -- -- -- --

Special cleaning -- -- -- -- -- -- -- -- --

Facility cleaning -- -- -- -- -- -- -- -- --

Manager+assistant+other -- -- -- -- -- -- -- -- --

Forecast Total -- -- -- -- -- -- -- -- --

Cleaned Rooms/h -- -- -- -- -- -- -- -- --

Room cleaning -- -- -- -- -- -- -- -- --

Special cleaning -- -- -- -- -- -- -- -- --

Facility cleaning -- -- -- -- -- -- -- -- --

Manager+assistant+other -- -- -- -- -- -- -- -- --

Outcome Total -- -- -- -- -- -- -- -- --

Cleaned Rooms/h -- -- -- -- -- -- -- -- --

DateTotal BRM1 BRM2 BRM3

Date

Scandic Kramer Internal Daily Control

OutcomeBudgetBRM1Total

121

Exhibit 4.D (Continued)

1-Jan 2-Jan 3-Jan 4-Jan ..…-Jan

CONFERENCE

Forecast Conference F&B -- -- -- -- -- -- -- -- --

Forecast Rent -- -- -- -- -- -- -- -- --

Forecast Discounts -- -- -- -- -- -- -- -- --

Forecast Conference -- -- -- -- -- -- -- -- --

Outcome Conference F&B -- -- -- -- -- -- -- -- --

Outcome Rent -- -- -- -- -- -- -- -- --

Outcome Conference -- -- -- -- -- -- -- -- --

Hours -- -- -- -- -- -- -- -- --

Forecast Hosts/Hostesses -- -- -- -- -- -- -- -- --

Forecast China & Glassware -- -- -- -- -- -- -- -- --

Forecast Conference -- -- -- -- -- -- -- -- --

Sales/worked hour -- -- -- -- -- -- -- -- --

Outcome Hosts/Hostesses -- -- -- -- -- -- -- -- --

Outcome China & Glassware -- -- -- -- -- -- -- -- --

Outcome Conference -- -- -- -- -- -- -- -- --

Sales/worked hour -- -- -- -- -- -- -- -- --

BREAKFAST

Forecast Sales -- -- -- -- -- -- -- -- --

Outcome Sales -- -- -- -- -- -- -- -- --

Hours -- -- -- -- -- -- -- -- --

Forecast Hours -- -- -- -- -- -- -- -- --

Forecast No. Of Guests -- -- -- -- -- -- -- -- --

Served Guests/hour -- -- -- -- -- -- -- -- --

Oucome Hours -- -- -- -- -- -- -- -- --

Oucome No. Of Guests -- -- -- -- -- -- -- -- --

Served Guests/hour -- -- -- -- -- -- -- -- --

REASTAURANT 1

Forecast Sales -- -- -- -- -- -- -- -- --

Outcome Sales -- -- -- -- -- -- -- -- --

Hours -- -- -- -- -- -- -- -- --

Forecast -- -- -- -- -- -- -- -- --

Sales/worked hour -- -- -- -- -- -- -- -- --

Outcome -- -- -- -- -- -- -- -- --

Sales/worked hour -- -- -- -- -- -- -- -- --

KITCHEN

Forecast Sales F&B -- -- -- -- -- -- -- -- --

Outcome Sales F&B -- -- -- -- -- -- -- -- --

Hours -- -- -- -- -- -- -- -- --

Forecast -- -- -- -- -- -- -- -- --

Sales/worked hour -- -- -- -- -- -- -- -- --

Outcome -- -- -- -- -- -- -- -- --

Sales/worked hour -- -- -- -- -- -- -- -- --

Restaurant Manager

Forecast Hours -- -- -- -- -- -- -- -- --

Outcome Hours -- -- -- -- -- -- -- -- --

Scandic Kramer Internal Daily Control

Total BRM1 Budget OutcomeDate

Food & Beverage

122

Exhibit 4.E (Collected on 2011-05-15)

Day X

Deviation from

Forecast

Outcome

MTD

Forecast

MTD

Outcome+

Forecast Budget BRM1 2010

Deviation

Budget

Deviation

BRM1

Deviation

2010

Rented Rooms -- -- -- -- -- -- -- -- -- -- --

Rented Beds -- -- -- -- -- -- -- -- -- -- --

Revenues -- -- -- -- -- -- -- -- -- -- --

Housing -- -- -- -- -- -- -- -- -- -- --

Discounts -- -- -- -- -- -- -- -- -- -- --

Housing Total -- -- -- -- -- -- -- -- -- -- --

Shop -- -- -- -- -- -- -- -- -- -- --

Conferens -- -- -- -- -- -- -- -- -- -- --

Rent of Facilities -- -- -- -- -- -- -- -- -- -- --

Mini Bar -- -- -- -- -- -- -- -- -- -- --

Breakfast -- -- -- -- -- -- -- -- -- -- --

Restaurant 1 -- -- -- -- -- -- -- -- -- -- --

Restaurant 2 -- -- -- -- -- -- -- -- -- -- --

Restaurant 3 -- -- -- -- -- -- -- -- -- -- --

Restaurant 4 -- -- -- -- -- -- -- -- -- -- --

Banquette -- -- -- -- -- -- -- -- -- -- --

Bar -- -- -- -- -- -- -- -- -- -- --

Restaurant Discounts -- -- -- -- -- -- -- -- -- -- --

Restaurant Total -- -- -- -- -- -- -- -- -- -- --

Other Total -- -- -- -- -- -- -- -- -- -- --

Revenues Total -- -- -- -- -- -- -- -- -- -- --

KPI's -- -- -- -- -- -- -- -- -- -- --

Occupancy -- -- -- -- -- -- -- -- -- -- --

ARR -- -- -- -- -- -- -- -- -- -- --

REVPAR -- -- -- -- -- -- -- -- -- -- --

Day X

Deviation from

Forecast

Outcome

MTD

Forecast

MTD

Outcome+

Forecast Budget BRM1 2010

Deviation

Budget

Deviation

BRM1

Deviation

2010

Front Desk -- -- -- -- -- -- -- -- -- -- --

Bookings -- -- -- -- -- -- -- -- -- -- --

Houskeeping -- -- -- -- -- -- -- -- -- -- --

of which room cleaning -- -- -- -- -- -- -- -- -- -- --

Housing Total -- -- -- -- -- -- -- -- -- -- --

Conference -- -- -- -- -- -- -- -- -- -- --

Breakfast -- -- -- -- -- -- -- -- -- -- --

Mini Bar -- -- -- -- -- -- -- -- -- -- --

Restaurant 1 -- -- -- -- -- -- -- -- -- -- --

Restaurant 2 -- -- -- -- -- -- -- -- -- -- --

Restaurant 3 -- -- -- -- -- -- -- -- -- -- --

Restaurant 4 -- -- -- -- -- -- -- -- -- -- --

Banquette -- -- -- -- -- -- -- -- -- -- --

Bar -- -- -- -- -- -- -- -- -- -- --

Restaurant Discounts -- -- -- -- -- -- -- -- -- -- --

Restaurant Total -- -- -- -- -- -- -- -- -- -- --

Other Total -- -- -- -- -- -- -- -- -- -- --

Revenues Total -- -- -- -- -- -- -- -- -- -- --

Kitchen -- -- -- -- -- -- -- -- -- -- --

Dishes -- -- -- -- -- -- -- -- -- -- --

F&B Manager -- -- -- -- -- -- -- -- -- -- --

Total F&B -- -- -- -- -- -- -- -- -- -- --

Cleaning of Facilities -- -- -- -- -- -- -- -- -- -- --

Administrations -- -- -- -- -- -- -- -- -- -- --

Marketing Sales -- -- -- -- -- -- -- -- -- -- --

Property -- -- -- -- -- -- -- -- -- -- --

Total Other -- -- -- -- -- -- -- -- -- -- --

TOTAL -- -- -- -- -- -- -- -- -- -- --

Day X

Deviation from

Forecast

Outcome

MTD

Forecast

MTD

Outcome+

Forecast Budget BRM1 2010

Deviation

Budget

Deviation

BRM1

Deviation

2010

Sold rooms/hour -- -- -- -- -- -- -- -- -- -- --

Front Desk -- -- -- -- -- -- -- -- -- -- --

Booking -- -- -- -- -- -- -- -- -- -- --

Cleaned rooms/hour -- -- -- -- -- -- -- -- -- -- --

Sales/hour Housing -- -- -- -- -- -- -- -- -- -- --

Breakfast guests/hour -- -- -- -- -- -- -- -- -- -- --

Sales/hour -- -- -- -- -- -- -- -- -- -- --

Conference -- -- -- -- -- -- -- -- -- -- --

Breakfast -- -- -- -- -- -- -- -- -- -- --

Mini Bar -- -- -- -- -- -- -- -- -- -- --

Restaurant 1 -- -- -- -- -- -- -- -- -- -- --

Restaurant 2 -- -- -- -- -- -- -- -- -- -- --

Restaurant 3 -- -- -- -- -- -- -- -- -- -- --

Restaurant 4 -- -- -- -- -- -- -- -- -- -- --

Restaurant Discounts -- -- -- -- -- -- -- -- -- -- --

Banquette -- -- -- -- -- -- -- -- -- -- --

Bar -- -- -- -- -- -- -- -- -- -- --

Kitchen + Dishes -- -- -- -- -- -- -- -- -- -- --

Sales/hour F&B -- -- -- -- -- -- -- -- -- -- --

Sales/hour TOTAL -- -- -- -- -- -- -- -- -- -- --

Daily Financial Performance Scandic Kramer

Day Report

Hours

KPI'sAccumulated April

Accumulated April

Accumulated April

123

Exhibit 4.F (Collected on 2011-04-17)

SCANDIC HOTELS AB

Region South Sweden

JAN FEB MARCH APRIL MAY JUNE, JULY… TOTAL

Sales Housing -- -- -- -- -- -- --Discounts -- -- -- -- -- -- --

Reparations -- -- -- -- -- -- --Rent of Facilities -- -- -- -- -- -- --

Other -- -- -- -- -- -- --Total -- -- -- -- -- -- --

COGS Restaurant -- -- -- -- -- -- --Other -- -- -- -- -- -- --Gross Profit -- -- -- -- -- -- --Total % -- -- -- -- -- -- --

Restaurant % -- -- -- -- -- -- --Salaries Housing -- -- -- -- -- -- --

Restaurant -- -- -- -- -- -- --Other -- -- -- -- -- -- --Total -- -- -- -- -- -- --

% -- -- -- -- -- -- --Costs Housing -- -- -- -- -- -- --

Reparations -- -- -- -- -- -- --Other -- -- -- -- -- -- --

Total -- -- -- -- -- -- --% -- -- -- -- -- -- --

Dept. Contribution Hosuing -- -- -- -- -- -- --% -- -- -- -- -- -- --

Dept. Contribution Restaurant -- -- -- -- -- -- --% -- -- -- -- -- -- --

Total Dept. Contribution -- -- -- -- -- -- --% -- -- -- -- -- -- --

Salaries Dept. 30+31+33 -- -- -- -- -- -- --Salaries Dept. 32 -- -- -- -- -- -- --

Salaries Dept. 38 -- -- -- -- -- -- --Total Salaries -- -- -- -- -- -- --

Costs Dept. 30+31+33 -- -- -- -- -- -- --Costs Dept. 32 -- -- -- -- -- -- --

Costs Dept. 38 -- -- -- -- -- -- --Total Shared Costs -- -- -- -- -- -- --Operating Income -- -- -- -- -- -- --% -- -- -- -- -- -- --

Rent -- -- -- -- -- -- --% -- -- -- -- -- -- --Property Tax -- -- -- -- -- -- --

Amortizations -- -- -- -- -- -- --Other Dept. 39 -- -- -- -- -- -- --

Net Income -- -- -- -- -- -- --% -- -- -- -- -- -- --

EBITDA -- -- -- -- -- -- --Rented Rooms -- -- -- -- -- -- --

Available Rooms -- -- -- -- -- -- --Occupancy % -- -- -- -- -- -- --

Roomrate -- -- -- -- -- -- --REVPAR -- -- -- -- -- -- --Number of Guests -- -- -- -- -- -- --Hours Housing -- -- -- -- -- -- --

Hours Reparations -- -- -- -- -- -- --Hours Other -- -- -- -- -- -- --

Hours Shared -- -- -- -- -- -- --Hours Total -- -- -- -- -- -- --

Sales/Hour -- -- -- -- -- -- --Salary/Hour -- -- -- -- -- -- --

Scandic Star Lund Budget 2011

124

Exhibit 4.G (Collected on 2011-04-17)

Sales Jan Feb Mar April May June, July…. TOTAL

Food -- -- -- -- -- -- --

Coffee -- -- -- -- -- -- --

Cold Beverages -- -- -- -- -- -- --

Strong beer -- -- -- -- -- -- --

Wine -- -- -- -- -- -- --

Sprits -- -- -- -- -- -- --

Shop -- -- -- -- -- -- --

Rent of Facilities -- -- -- -- -- -- --

Discounts -- -- -- -- -- -- --

Sales per Worked Hour -- -- -- -- -- -- --

Gross margin % Jan Feb Mar Apr Maj Jun TOTAL

Food -- -- -- -- -- -- --

Coffee -- -- -- -- -- -- --

Cold Beverages -- -- -- -- -- -- --

Strong beer -- -- -- -- -- -- --

Wine -- -- -- -- -- -- --

Sprits -- -- -- -- -- -- --

Shop -- -- -- -- -- -- --

Rent of Facilities -- -- -- -- -- -- --

Gross Profit Jan Feb Mar Apr Maj Jun TOTAL

Food -- -- -- -- -- -- --

Coffee -- -- -- -- -- -- --

Cold Beverages -- -- -- -- -- -- --

Strong beer -- -- -- -- -- -- --

Wine -- -- -- -- -- -- --

Sprits -- -- -- -- -- -- --

Shop -- -- -- -- -- -- --

Rent of Facilities -- -- -- -- -- -- --

Working Hours -- -- -- -- -- -- --

Payroll / Working Hour -- -- -- -- -- -- --

Payroll (kSEK) -- -- -- -- -- -- --

Expenditure kSEK Jan Feb Mar Apr Maj Jun TOTAL

Electricity & Cleaning -- -- -- -- -- -- --

Laundry -- -- -- -- -- -- --

Consumption Supplies -- -- -- -- -- -- --

Reparation & Maintanence -- -- -- -- -- -- --

Service Contracts -- -- -- -- -- -- --

Transports -- -- -- -- -- -- --

Travelling -- -- -- -- -- -- --

Marketing -- -- -- -- -- -- --

Cost of Sales -- -- -- -- -- -- --

Office Supplies -- -- -- -- -- -- --

Telephone & Postage -- -- -- -- -- -- --

Costs of Risks -- -- -- -- -- -- --

Other External Services -- -- -- -- -- -- --

Music & Entertainment -- -- -- -- -- -- --

Other External Costs -- -- -- -- -- -- --

Barter Benefits -- -- -- -- -- -- --

Other Personell Costs -- -- -- -- -- -- --

Rent of Invetory -- -- -- -- -- -- --

Other Costs -- -- -- -- -- -- --

Total Costs -- -- -- -- -- -- --

Dep Profit -- -- -- -- -- -- --

DP % -- -- -- -- -- -- --

BUDGET PER OUTLET F&B TOTAL

125

Exhibit 4.G (Continued)

F&B TOTAL Jan Feb Mar Apr Maj Jun TOTAL

-- -- -- -- -- -- --

Sales -- -- -- -- -- -- --

Discounts -- -- -- -- -- -- --

Cost of sales -- -- -- -- -- -- --

Payroll -- -- -- -- -- -- --

Expenditure -- -- -- -- -- -- --

Dep Profit

Net Sales / Outlet

11 Shop -- -- -- -- -- -- --

12 Conference -- -- -- -- -- -- --

14 Mini Bar -- -- -- -- -- -- --

15 Breakfast -- -- -- -- -- -- --

16 Lobby Bar -- -- -- -- -- -- --

17 Bar 1 -- -- -- -- -- -- --

18 Bar 2 -- -- -- -- -- -- --

20 Restaurang 1 -- -- -- -- -- -- --

21 Restaurang 2 -- -- -- -- -- -- --

22 Restaurang 3 -- -- -- -- -- -- --

23 Restaurang 4 -- -- -- -- -- -- --

24 Banquette 1 -- -- -- -- -- -- --

25 Banquette 2 -- -- -- -- -- -- --

28 Room Service -- -- -- -- -- -- --

SUMMA -- -- -- -- -- -- --

RESTAURATION -- -- -- -- -- -- --

RENT OF FACILITIES -- -- -- -- -- -- --

126

Exhibit 4.H (Collected on 2011-04-12)

127

Exhibit 5. General Interview Structure

1. Management Philosophy and Strategy Who owns the company?

o How does that affect strategy and management?

What is your leadership philosophy? o Proactive vs. Reactive?

What is your strategy? o How do you make sure that the strategy is understood by the entire organization?

Which are you main goals? o E.g. Profitability (ROE), Financial (CF, Solidity, Liquidity) o Non-Financial, Operations, Production o Owner related, Quality, Customer, Environmental, Market related

How do you balance between control and trust?

How are you planning for changes in the future?

In today’s economy, resource constraints are leading to new and stimulating business practices that are innovative and help cut costs. What have you been doing to survive in today’s economy?

2. Organization Structure and Reward Systems How is the organization structured?

o Function? Division? Matrix? (Samuelsson Chapter 3) o Cost Centers/Profit Centers/Investment Centers? o How are responsibility, accountability and decisions allocated? (Anthony p. 209)

To what degree are the business units independent? o How do you maintain overall control?

In what areas do you maintain control? Is certain uniformity required across certain units? All units? Is the competition for funding? Marketing funding Products decisions

o Are you losing economies of scale from the decentralization? How do you prevent sub-optimization between the business units? Procurement- what suppliers are we going to use? Can there be coordination in

purchasing the same products for different units or streamlining orders with the same supplier?

How do you balance manager autonomy while still relying on them to stay within the realm of the overall strategy? (AG p. 208)

o How do you assure that managers are producing the best services for the company, regardless of how difficult and expensive they are to offer?

Do you use Transfer Pricing? How? Why (not)? o How are expenses and revenues generated from each transaction? (p. 245) o Who sets transfer prices? Unilateral decision? Collective?

How? How often do you reevaluate transfer prices?

o If not purchased from the business unit, do your unit managers have the option of purchasing/selling with/to outside sources?

How do you work with employee incentives? Extrinsic vs. Intrinsic? (Samuelsson p. 138)

How do you measure the effectiveness of your incentive plans? (CRCA, 2003) o Informal opinion gathering? Formal, quantitative, qualitative? Something else?

Are your incentive plans evenly distributed between units? Departments?

How do you set the targets for the business units? o Based on contribution margin, direct profit or controllable profit or internal or external

benchmarking o Are the targets adjusted for down-cycles or off-seasons?

How do you prevent short sightedness by managers?

128

How do you make sure that the performance guidelines are clear? Do your employees completely understand their targets, rewards, and consequences?

3. Formal and Informal Management Control Systems What are your main control tools?

o KPI’s: Profitability, Risk (operational vs. financial), Residual Measurements o Budget, Balanced Scorecard

What are your KPI’s? o How many KPI’s do you use? o Which ones are most important? o Financial and Non-Financial Measures? o Do you measure customer satisfaction? How? o Identification of your most important customers? KAM’s? o Do you measure green initiatives? How? o How do you assure quality control? (Anthony p. 211)

How do you measure efficiency in the operations? o Profitability per product? Per category of products? Per employee?

How do you make forecasts? o How do you estimate the profit potential for your one year budget? o How do you forecast the estimates of revenues? Expenses? Cash flow?

How is your budgeting process structured? o How often do you create a budget? Yearly? Rolling? o Separate per BU or consolidated statements?

How active are you in the budget creation process? o Bottom up or Top down? o How do you communicate between unit managers in budget creation? o Who is involved in the process?

Do you have more than just an operating budget? o Capital Budget (major investment)? o Budgeted Balance Sheet? o Budgetary CF statements? (line of credit and short-term borrowing)

How do you go about budgeting for discretionary expense services such as accounting, legal, industrial relations, public relations, human resources, research and development operations and marketing activities? (AG p. 153)

o Benchmarking against past years? Against competitors? o What are the consequences or rewards for staying within/without the budget?

How do you handle dysfunctional behavior in the budget process?

Budget feedback o How strict are you on budgetary control? o How often do you evaluate your sales figures and expenses? Weekly? Monthly? Quarterly?

Do you use Cash Management?

Do you use Working Capital Management?

Is your management control system structural or process oriented? Why? o ABC, lean production?

Informal Control o How do you manage your Intellectual Capital? o Do you use a Code of Conduct? o Have you formulated shared norms and values? o Corporate Culture?


Recommended