ASIAN JOURNAL OF CIVIL ENGINEERING (BHRC) VOL. 15, NO. 1 (2014) PAGES 79-93
THE USE OF THE DREUX-GORISSE METHOD IN THE PREPARATION OF CONCRETE MIXES: AN AUTOMATIC
APPROACH
S. Yousfi1, L. Nouri1, M. Saidani2 and H. Hadjab3 1University of Boumerdes, Faculty of Engineering, Algeria.
2Coventry University, Faculty of Engineering and Computing, Priory Street, Coventry CV1 5FB, UK.
3University of Science and Technology Houari Boumediene, Faculty of Civil Engineering, BP 32 Bab Ezzouar, El Alia, Algiers, Algeria.
Received: 15 December 2012; Accepted: 10 April 2013
ABSTRACT Following a comparative study of a number of representative methods for the preparation of a concrete mix, the present paper presents the results one of such methods, namely that of Dreux-Gorisse. This method combines a graphical approach with an analytical one, alongside the use of established correction tables. This study therefore proposes to present the various stages necessary for preparation of a concrete mix using the Dreux-Gorisse method in an automatic way. The purpose of this automation is to enable the preparation of a variety of mixes, taking into account the presence of several parameters. This approach allows obtaining mixes in a comprehensive manner, which eventually can lead to a comparison with other methods for the preparation of concrete mixes.
In old times people used to build with stone, cooked bricks, earth blended in the straw, wood as well as with other more or less known materials. But almost one and a half century ago, a new era started with the invention of concrete. Since, this material became the object of numerous studies, always with the intention of improving its strength, ductility, workability and economy. All research carried out pointed out to the fact that concrete introduced vast technical and economic possibilities in comparison with other materials, such as stone, wood
E-mail address of the corresponding author: [email protected] (M. Saidani)
S. Yousfi, L. Nouri, M. Saidani and H. Hadjab
80
or even steel. In what follows, definitions of some of the main properties of this material are given,
according to different authors, e.g. Refs. [1-2]. There are a number of definitions, but they to join each other.
Concrete is a mixture of very different constituents: liquid (water), active powder (sociable) and solid inert (aggregates: big wholesale trade sands down: gravels or crushed stones). This mixture is dosed in order to acquire at the time of the implementation a proper consistency, and after hardening requested qualities, according to which the desired concrete composition is obtained [1-2]. These qualities are:
• strength (principally the compressive strength); • deformability; • workability at the time of the implementation. As there are several methods of concrete mixing, the authors attempted to cover the most
popular ones with the aim of broadening the investigation. Methods initially covered include those reported in references [3-7]. The authors made the decision to only concentrate on the method of Dreux-Gorisse, as it was found to be the most user friendly.
The study of the composition of a concrete mix consists in defining the optimum mixture of the aggregates as well as the proportions in cement and water, and this with the intention of accomplishing the desired concrete qualities. In talking about the qualities of concrete, it is worth mentioning the definition given by Gorisse-Dreux [6-7]:
“The study of a concrete mix consists almost always in searching jointly two essential qualities, which are mutually linked and on whom they depend. These two qualities are: strength and workability”. The chosen Dreux-Gorisse composition methods lead to volumic or weighted contents of binders and granulates. In the present work, the weighted contents have been used. The passage from one content to another may be carried out by the knowledge of apparent density granulates used in bulk.
Methods presented by Gorisse-Dreux are said to be in «continuous granularity» or in « discontinuous granularity ».When concrete granulometric analysis allows the drawing of an uninterrupted curve that starts from the smallest cement grain to the biggest gravel grain, going through all the intermediate grains sizes, the composition is said to be “continuous granularity”. In the other hand, when the granular curve shows a stage where there is a lack of intermediate elements, the composition is said to be “discontinuous granularity”. Both cases present advantages and disadvantages and depend on the size of the granulates which constitute the composition. So, the continuous granularity allows acquiring more plastic concretes with a good workability. Conversely, the discontinuous granularity gives concretes with a maximum of large size granulates (gravels) and a minimum of small size granulates (sand), leading in general to a better compressive strength in respect to the continuous granularity but this result is reached to the detriment of the workability that is one of the two main concrete qualities. The concrete composition methods, in their diversities, are only approaching the true compositions, since these are always corrected in situ.
Every method for obtaining a concrete mix has its hypotheses, its advantages and its disadvantages. There are empirical methods, such as ACI [8], Dreux-Gorisse [6-7], experimental methods, BARON-LESAGE [9], and theoretical methods, Auchatraire [10].
THE USE OF THE DREUX-GORISSE METHOD IN THE PREPARATION...
81
These formulations are quite lengthy and laborious to use. In the present study, the authors developed algorithms and a computer program with the
intention of arriving at the required optimum concrete mix as quickly as possible. These programs also allow the possibility of a multitude of formulations in an automated and a rather short period of time.
The choice in presenting the data and results in a table form greatly simplifies the operator task. If one or several characteristics of a concrete mix are changed (eg. proportion of cement, consistency, strength etc.), the new mix is worked out automatically and at ease.
The authors worked out the programming of several methods, but the most arduous proved to be that of Dreux-Gorisse, because it calls upon other programs, among others, that of the particle size curve of reference.
2. DREUX-GORISSE METHOD
It is a very practical and simplified method, consisting of the following stages: 2.1 Basic data. 2.1.1 Nature of structure The knowledge of structure nature is necessary. It would be necessary to know if structure is massive or high, if it is thin or thick, or if it is heavily reinforced or not. The position of the reinforcement in the most reinforced zones must be known as well. 2.1.2 Required strength In general, the compressive strength at 28 days is sought. This latter is greater than the nominal strength ’m .If an overage variation coefficient of 20 % is accepted, it will be possible to adopt the approximate rule for the compressive strength:
= m +15%.
2.1.3 Required consistency or workability This property is defined, in general, by the required plasticity measured using the well established Abrams cone test. The consistency depends on the structure type, the concreting difficulty and on the clamping means as it is shown in Table 1.
Table 1: Relationship between consistency, concrete clamping, Abrams cone collapse and number of impacts of the C.E.S test
Consistency Clamping Collapse A in cm Number of
impacts N C.E.S test.
Very firm concrete Powerful vibration 0 to 2 >60
Firm concrete Good vibration 3 to 5 30 to 50
Plastic concrete Common vibration 6 to 9 15 to 25
Soft concrete Stitching 10 to 13 10 to 15
Liquid concrete Light stitching 14 <10
S. Yousfi, L. Nouri, M. Saidani and H. Hadjab
82
2.2 Aggregates maximum dimension The determination of the aggregates maximum dimension D (Dmax) depends on the characteristics of the structure part to be concreted and the environment aggressiveness as is shown in Table 2.
Table 2: Maximum aggregates diameter according to the parts to be concreted characteristics
characteristics of the structure part to be concreted Sieve diameter D
e h : reinforcement horizontal
spacing e h /1.5
e v : reinforcement vertical
spacing e v
c: spacing between
reinforcement and formwork
very aggressive environment c4cm
<c
slightly aggressive environment: c3cm
lowly aggressive environment: c2cm
not aggressive environment: c1cm
r: reinforcement radius rolled aggregates 1.4 r
crushed aggregates 1.2 r
ab/r = 2(a+b)
h= height or minima thickness h m /5
2.3 Cement content The cement content differs from the aggregates content. The cement/water ratio (C/W) is approximately evaluated using the overage strength
and the required plasticity through the following formula.
= G c
’(C/E – 0.5) (1) Where
: is the required overage compressive strength at 28 days (expressed in bars).
c: is the true cement class at 28 days (expressed in bars)
a
b
THE USE OF THE DREUX-GORISSE METHOD IN THE PREPARATION...
83
C: is then cement content (expressed in kg / m3) W: is the total water content in dry materials (expressed in litre for a cubic metre) G: is the granular coefficient with values are given in table 3 according to the aggregates
quality and dimensions.
Table 3: Approximate values of the granular coefficient G
aggregates quality
Aggregates dimension D
fine: D16 mm medium: 25D40mm coarse: D63 mm
very good 0.55 0.6 0.65
good, common 0.45 0.5 0.55
fairly good 0.35 0.4 0.45
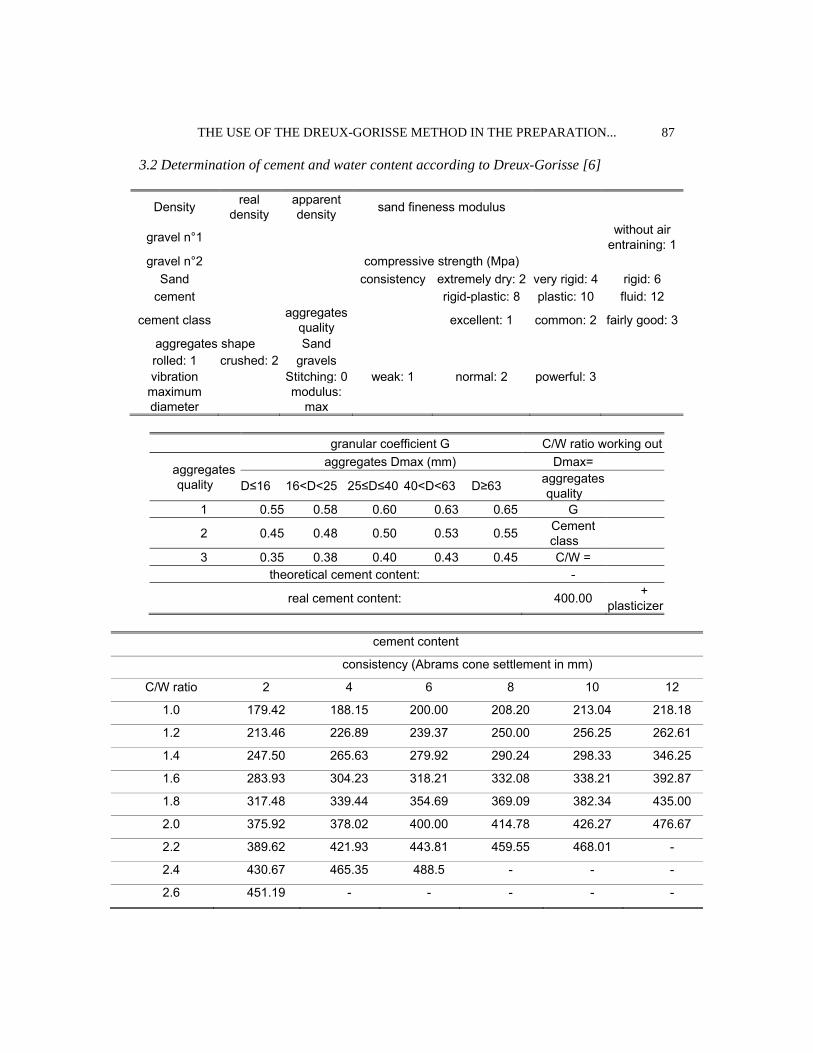
Knowing the report C/W ratio and the desired workability, considered as a basic data, the cement content can be approximately evaluated by using the chart (Dreux, 1981) depicted in Figure 1.
Figure 1. Chart giving approximate cement content to use in respect to the required C/W ratio
and the workability (cone collapse). [6]
S. Yousfi, L. Nouri, M. Saidani and H. Hadjab
84
2.4 Water content The choice of the cement content C and the C/W ratio values lead obviously to water content which value is only approximate. This latter will be adjusted subsequently through plasticity and workability tests.
W = C / (C/W).
2.5. Aggregates 2.5.1 Aggregates quality Gravels must be of good mineralogical quality, hard and very clean. Sand must also be clean, its required fineness modulus value must range from 2.2 to 2.8 and its corresponding granulometric curve must be compared with the optimum distribution as depicted in Figure 2.
S A N D S P E A ‐ G R A V E L S P E B B L E S
1 0 0 F I N E M E D I U M C O A R S E F I N E M E D I U M C O A R S E F I N E M E D I U M C O A R S E 1 0 0
9 0 9 0
8 0 8 0
7 0 C 7 0
6 0 6 0
5 0 5 0
A s p i n d l e s f i n e n e s s m o d u l u s
4 0 4 0
p r e f e r e n t i a l A 2 , 2 0 t o 2 , 8 0
3 0 3 0
t o o t h i n B 1 , 8 0 t o 2 , 2 0
2 0 B 2 0
t o o c o a r s e C 2 , 8 0 t o 3 , 2 0
1 0 1 0
0 0
M O D U L u s 2 0 2 1 2 2 2 3 2 4 2 5 2 6 2 7 2 8 2 9 3 0 3 1 3 2 3 3 3 4 3 5 3 6 3 7 3 8 3 9 4 0 4 1 4 2 4 3 4 4 4 5 4 6 4 7 4 8 4 9 5 0
Figure 2. Proposed distribution curves for concrete sands granularity [6].
2.5.2. Granular reference curve and aggregates content On a granulometric analysis graph, a reference composition AOB is drawn. The point B (at 100%) corresponds to the dimension D of the greatest aggregate. The breaking point A is defined by the following coordinates in abscissa (from the dimension D sieve):
If D 20 mm, the abscissa is D/2 If D>20 mm, the abscissa is located in the middle of the "gravel segment" limited by
modulus 38 (corresponding to 5mm) and the corresponding modulus to D, at:
Y=50- D +K (2) Where K is a corrective term which depends on the cement content, the clamping
effectiveness, the rolled or crushed aggregates shape (the sand influence is especially preponderant) and also on the sand fineness modulus.
THE USE OF THE DREUX-GORISSE METHOD IN THE PREPARATION...
85
The granular reference curve OAB must be drawn on the same graph as the granulometric curves of the components aggregates. Then, the dividing lines between each aggregates type are drawn. This is carried out by joining the point at 95 % of the granular curve of the first aggregates type to the point at 5 % of the granular curve of the following aggregates type and so on.
Consequently, the percentage in net volume of each of the aggregates g1, g2, g3 etc... is read on the reference curve at the dividing lines crossing point. As C is the cement content, the cement grains net volume is:
c= C/ c (3)
where c is the cement grains specific mass equals to 3.1 (which is the overage value
habitually accepted). The net volume of all the aggregates is:
V=1000 -c (4) where is the compactness coefficient. The net volumes of each of the aggregates are then:
v1g1V,v2g2V,v3g3V (5) If the specific masses of each of this aggregate are respectively 1, 2, 3, the masses of each
of them will be:
p1=v1 1,p2=v2 2,p3=v3 3 (6) and the total aggregates mass will be:
G=p1+p2+p3 (7)
2.7. Compactness Coefficient The compactness coefficient is calculated as the absolute volumes of the solid materials VM divided by the total volume of implemented fresh concrete i.e. one metre cubed. That is:
=VM (in litres)/1000 (8)
VM=Vg+Vs+Vc (9)
is given according to the consistency, the clamping and the dimension D [6]. As the concrete composition methods are widely dependent on empirical results, their
programming is often reduced to predefined tables taking into account implementation parameters.
It seems wise to avoid a sequential treatment, which would be only weighting down the
S. Yousfi, L. Nouri, M. Saidani and H. Hadjab
86
program analysis without bringing any real effective benefit, to the advantage of a pseudo-parallel treatment in a worksheet form where data and results are gathered in a same simpler and more intuitive table to be exploited than a values list even structured.
This Dreux-Gorisse method is not easy to program because it requires a prior treatment from the granulometric curves of the concrete different components. This prior treatment consists in preparing the characteristic points which are necessary for the determination of the reference curve. The method combines a graphical and an analytical treatment associated with a consultation of correction table. Figures 3 to 4 form a series of flowcharts that must be treated in parallel.
For the program user, it is sufficient just to fill the worksheet boxes corresponding to the materials used. To make the program working, the granulometric curve worksheet must be fully and correctly completed. The program user must also indicate the following values:
-sand fineness modulus value -compressive strength value (in MPa) -required consistency value In case where there is no air entraining, the value one ‘1’ must appear in the
corresponding worksheet box. It must be checked that the aggregates and cement apparent and real densities have been
indicated. Besides that, information about the following items must be added: The cement class: in the present work, as there is a great number of compositions,
only cement class 32.5 has been studied. The aggregates quality: for practical reason, the aggregates quality has been indexed
which allows a qualities numbering leading to an easy data. The aggregates shape (rolled or crushed): the values 1 and 2 that correspond
respectively to the sand and the gravels are entered in the worksheet boxes. The vibrations: the required vibration number is affected to the corresponding
worksheet box. The program output is given in a table where the obtained results are the different
components contents of the required concrete.
5. APPLICATION
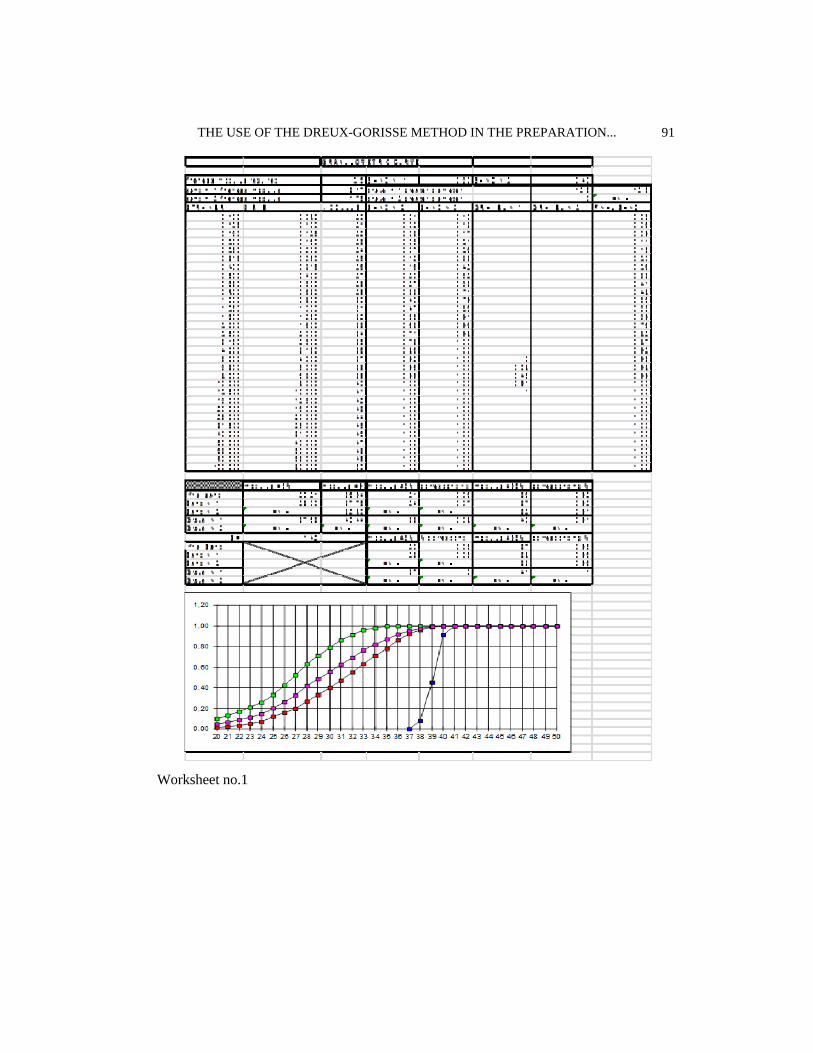
In order to illustrate the concrete mixture program elaborated in the present work, data has been introduced in the worksheets (worksheet n°1 and worksheet n°2) joined to this paper. As may be seen, the concrete mixture results investigated appear on the same table as data previously introduced.
THE USE OF THE DREUX-GORISSE METHOD IN THE PREPARATION...
91
Worksheet no.1
S. Yousfi, L. Nouri, M. Saidani and H. Hadjab
92
Worksheet no.2
THE USE OF THE DREUX-GORISSE METHOD IN THE PREPARATION...
93
6. CONCLUSIONS
The present automatisation of obtaining adequate concrete mix is seen to be effective and user-friendly and very easy to use.
Indeed, in order to obtain the requested mixture, it is sufficient to mention the required characteristics (such as: fineness modulus, consistency, strength, etc.). This method allows achieving a great number of concrete mixtures, thus leading to a global insight of their variation. Moreover, the acquired programming results can be used as concrete mix design charts.
In the present work, the cement Portland artificial 32.5 classes has been used. Nevertheless, other cements or cement classes can be used as data with no difficulties.
One of the aims of the present study is to simplify the task of those who are interested in concrete formulations according to Dreux-Gorisse method.
Finally, it is hoped that the proposed automatization will allow a saving in the time taken in the determination of the concrete mixture.
REFERENCES
1. Venuat M. La pratique des ciments, mortiers et bétons, Le Moniteur, 1989. 2. Venuat M. La pratique des ciments, mortiers et bétons, Le Moniteur, 1976. 3. Faury J. Le béton: Influence de ses Constituants Inertes. Règles à Adopter pour sa
Meilleure Composition. Sa Confection et son Transport sur les Chantiers. Dunod, Deuxième edition, Paris, 1944.
4. Vallette R. Manuel de composition des bétons, Eyrolles, 1969. 5. Joisel A. Composition des bétons hydrauliques, droites de références, S.T.A.R, Juin
1969. 6. Dreux G. Nouveau guide du béton, 3ème édition, Eyrolles, Paris, 1981. 7. Dreux G, Festa J. Nouveau guide du béton et de ses constituants, Eyrolles, Paris, 1998. 8. Neville AM. Propriétés des bétons, Eyrolles, Paris, 2000. 9. Baron J, Olivier JP. Les bétons :bases et données pour leur formulation, Eyrolles, 1997. 10. Auchatraire A. Découvrir et bien utiliser Excel sur macintosh, P.S.I, France, 1989.


![Assessment of the Long-term Performance of SCC ... · same strength classes as the SCC, the OC formulation was realised using the Dreux-Gorisse method [18]. Table 2 gives the mixture](https://static.documents.pub/doc/80x56/5e8dcdffd118b958f465725a/assessment-of-the-long-term-performance-of-scc-same-strength-classes-as-the.jpg)


![bec.uac.bj · 2018-12-20 · according to Dreux-Gorisse method [10] where we want to make a plast concrete for the achievement of the beams with a maximal dimension Dmax=31,50 mm](https://static.documents.pub/doc/80x56/5e81442f7a84bb56bb7e0c75/becuacbj-2018-12-20-according-to-dreux-gorisse-method-10-where-we-want-to.jpg)


