The value of information for the accessibility to concurrent transit system services
S. Carrese, S. Gori, L. Mannini & M. Nigro Department of Engineering, Roma Tre University, Italy
Abstract
The accessibility to different transport systems is an essential variable for the modal choice, and not only for the choice between public and private transport, but also between concurrent transit systems. The study would like to identify and quantify the value of information (VOI) in the accessibility to concurrent transit services. In particular, the type of information considered and assessed is both en-route and pre-trip information provided to user who has to choose between the concurrent transit services available. A methodology will be presented in order to identify and quantify the VOI, based on the development of behavioral models that make use of random utility theory. These models have been calibrated and validated using two different samples of data collected by a Revealed Preference (RP) survey to 200 users choosing between the different transit services available connecting Fiumicino Airport to the city center of Rome (Termini Station) in Italy. The proposed methodology is based on the development of behavioral models that make use of random utility theory. In particular two types of discrete choice models belonging to the family of random utility models are proposed: Multinomial Logit model (ML) and Nested Logit model (NL). Keywords: value of information, transit accessibility, random utility theory, Revealed Preference survey, Multinomial Logit model, Nested Logit model.
1 Introduction
Currently the public transport system is not competitive with private transport: specifically, it happens in urban areas, where the continuous spread of residences and activities have increased the length and the complexity of trips [1], but also
in extra-urban areas where the access/egress phase to/from the public transport system is poorly organized. In fact, the public transport, in order to compete with the car, that is a service with high accessibility, should ensure good “door to door” travel time and it can be achieved only if high standards of accessibility to the service are guaranteed. The accessibility to the public transport system is an essential variable for the modal choice, not only for the choice between public and private transport, but also between concurrent public transport systems: a high capacity/high speed transit service may be loser in comparison with a standard bus service, if the accessibility of the former is heavily penalized respect to the latter. The accessibility is defined as a quantity that allows to correlate the activities system with the transport system [2, 3]; measures usually adopted to describe the accessibility are the service frequency, the hours of the service, the service coverage, the travel time components and the demographic data. There are also additional elements, which may contribute to determining the accessibility of a public transport system such as comfort, affordability (the fare) and reliability of the service [4]. In literature, information is reported as the main variable in affecting travel behaviour; in case of private transport different studies exist about the impact of information on route choices (impact of Route Guidance Systems or Variable Message Signs, [5, 6]), with the aim of using information to alleviate traffic congestion [7–9]. In the case of public transport, the impact of information on waiting time at bus stops or metro stations is usually underlined [10], as its capability to contribute to guarantee a better balance between transit and private cars mode choice [11, 12]). Recent studies address quantitative methods for estimating the value of information from ITS in the case of freight distribution [13]. Anyway, it looks like advertising methods and the effects of different kinds of advertising have been missing in the quantification of the transit system accessibility by transport engineering, leaving engineering management or social psychology to address this issue [14–16]. This study arises in this context with the objective to identify and quantify the impact that information has in terms of accessibility to the transit service. The types of information considered and assessed are those provided to the user who has to choose between concurrent public transport systems; moreover, they will be both en-route information and pre-trip information. A methodology will be presented in order to identify and quantify the value of information (VOI), based on the development of behavioral models that make use of random utility theory. In particular, the VOI is computed as the relative value of some service information attributes respect to a constant utility. For this purpose, Multinomial and Nested Logit models are introduced. These models have been calibrated and validated using two different samples of data collected by a RP survey to 200 users choosing between the different transit services available connecting Fiumicino Airport to the city center of Rome (Termini Station) in Italy.
The proposed methodology is based on the development of behavioral models that make use of random utility theory. In particular, two types of discrete choice models belonging to the family of random utility models are proposed: Multinomial Logit model (ML) and Nested Logit model (NL). Logit models have been widely adopted in literature for the calibration of mode choice models with alternatives related to different transport modes, but they have been adopted more recently also for “within mode” models [17]. The specific selection of ML and NL derives from the structure itself of the two families of models, which can be well adapted to represent the choice context of a decision-maker with respect to concurrent transit services. The utility function defined for each alternative j of the choice context described by ML or NL [18] is generally expressed as a function Vj(Xkj) of attributes Xkj relative to the alternative and the decision-maker, as:
Vj=∑k βk Xkj (1)
Each attribute Xkj is multiplied for a coefficient βk, so giving a certain weight to each term inside the utility function: in these terms, finding the coefficients βk well adapts to the goal of the study, i.e. to quantify the value of some attributes related to information respect to the other attributes, including accessibility attributes, that determine the choice between concurrent transit services. Once defined the type of model (ML or NL) and once defined all the attributes to be insert inside the utility functions, the calibration of the model gives rise to the values of the coefficients βk. The calibration of random utility models can be conducted through the maximum likelihood approach, where the likelihood function L(β) can be defined as the product of the probabilities of choosing the actual user's choice:
L(β) = ∏i pi[j(i)] (2)
β*=argmax L(β) (3)
In order to better define the attributes inside the utility functions and to collect data for the calibration and validation of the models, the first step has been to perform a survey of revealed preferences (RP) to users choosing between concurrent transit systems. For these reasons, a case study has been considered: the case of concurrent transit services that directly connect Fiumicino Airport to the city center of Rome (Termini Station) in Italy. This survey lead to collect data about the attributes that affect the choice between the concurrent transit services, either quantitative attributes (components of travel time, service frequency, monetary cost, etc.) and qualitative attributes (as a judgment of the level of information in the terminal, etc.), as well as the actual user’s choice.
In particular, the attributes have been divided into two macro classes: 1) attributes related to the service features and 2) attributes related to the service information. Details of the RP survey and the derived two macro classes of attributes have been reported in section 3, after the explanation of the case study.
3 Case study
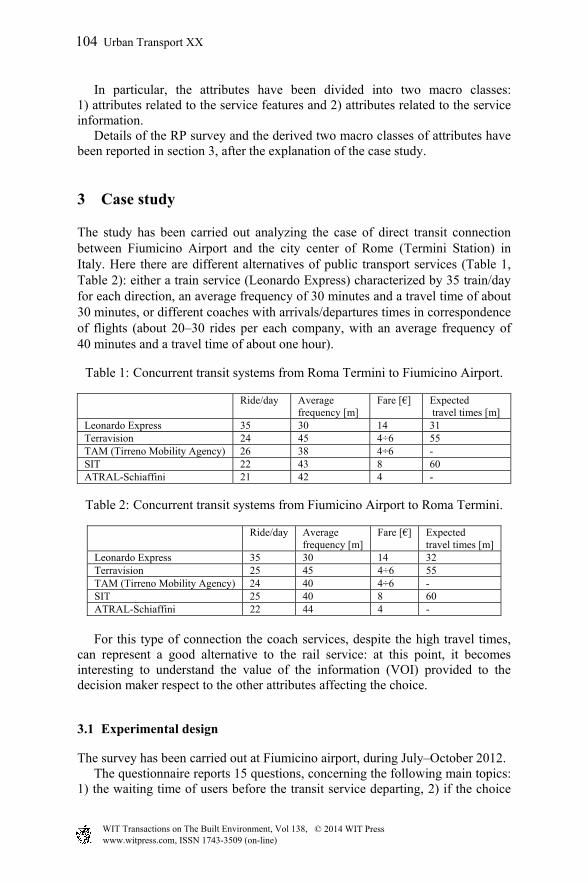
The study has been carried out analyzing the case of direct transit connection between Fiumicino Airport and the city center of Rome (Termini Station) in Italy. Here there are different alternatives of public transport services (Table 1, Table 2): either a train service (Leonardo Express) characterized by 35 train/day for each direction, an average frequency of 30 minutes and a travel time of about 30 minutes, or different coaches with arrivals/departures times in correspondence of flights (about 20–30 rides per each company, with an average frequency of 40 minutes and a travel time of about one hour).
Table 1: Concurrent transit systems from Roma Termini to Fiumicino Airport.
For this type of connection the coach services, despite the high travel times, can represent a good alternative to the rail service: at this point, it becomes interesting to understand the value of the information (VOI) provided to the decision maker respect to the other attributes affecting the choice.
3.1 Experimental design
The survey has been carried out at Fiumicino airport, during July–October 2012. The questionnaire reports 15 questions, concerning the following main topics: 1) the waiting time of users before the transit service departing, 2) if the choice
to take a service is made before arriving at the airport, 3) if users had information on that transit service during the flight, 4) the knowledge of the users about the different transit alternatives from the airport to the city center, 5) the level of information at the airport (advertising, billboards, kiosks, etc..), and finally 6) the reasons of a specific transit service choice. The sample is equal to about 200 users; the typical user is a “young user” (37 years old on average) and specifically, more than half ranges from 26 to 45 years old (58.5%), only the 8.4% is over 55. About the 63% of the sample is constituted by medium–high level professionals (managers, free-lances, businessmen, employees). The main results obtained by the survey are reported below:
the train (Leonardo Express) is the most used transit mode (modal shift of 65% for the train and 35% for the coach services);
inside the coach services, the most chosen is Terravision (51%), followed by TAM (26%), SIT (13%) and, finally, Schiaffini (10%);
the waiting time of users before the transit service departing is equal to 16 minutes on average, taking into account that the train service has a regular headway (30 minutes), while the coaches have different departing times during the day in order to follow the demand;
the 68% of the sample chooses the transport company before arriving at the airport (pre-trip choice). However, this data is strongly influenced by the train users; in fact analyzing separately the users of coaches from those of train, the results is that the coach users have mainly chosen the service at the airport (68% on-trip), while the 87% of train users mainly pre-trip (87%);
concerning the information on flight, the 90% of the sample has not received any information on the flight and the result is the same analyzing separately the two type of users (coaches and train users);
the 80% of users who has chosen to travel with a coach service, has declared to know the other coach companies, while the 76% of the same users has declared to not know the Leonardo Express train service;
concerning the users who have chosen the train service, the 67% has declared to know the four coach services as an alternative to reach the city center;
about the level of the information given in the airport, the 14% of the sample judges it as very high, the 33% as high, the 38% as medium, the 10% as low and the 5% as non-existent;
the reasons of a specific transit service choice can be summarized mainly in the a-priori knowledge (57%) and in the advertising in the airport (43%); one of the main reason to choose one coach respect to another (47%) is the information on the departure time (first departure – first chosen), followed by the first advertising seen (29%, first seen – first chosen). Finally one of the main reasons to choose the train respect to the coach is the comfort.
4 Behavioural models to evaluate the influence of information
Using the data derived from the survey and the methodology reported above, the study follows evaluating the impact of both the quality and the quantity of information given to the users in order to choose between concurrent transit services.
waitingtimeji [min] the time that user i must wait before the service j departing
traveltimej [min] the travel time of service j from Fiumicino Airport to Termini station
fareji [€] the fare that user i must pay to use the service j
comfortji Cont. it is a judgment (ranging from 0 to 2) expressed by each user on how comfortable is the service j
Service
information
LoIji Cont. Level of Information; it is a judgment (ranging from 0 to 9) expressed by each user i on how clear and useful are the information received from billboards, kiosks etc. in the airport about the service j
lightsponsorj Cont. number of flight companies that sponsor the service j during the flight
InfoPreTripji binary a dummy variable (0.1) that suggests if the user i made the choice of the service j before starting the trip;
InfoFlightji binary a dummy variable (0.1), that suggests if the user i has received a sponsorship on the service j during the flight. It differs from lightsponsorj, as it is a own user variable, while the last one is a own service variable
knowconcurrentji binary a dummy variable (0.1), that suggests if the user i is aware of all the transport services concurrent to j in the airport terminal
billboardsj binary a dummy variable (0.1) that indicates the presence or absence of billboards of service j in the airport terminal. It differs from LoIji, because LoIji is a judgement of the user i about the level of total information in the airport related to service j
As already said, different types of models have been calibrated in order to reach the previous objective: ML models, considering the independence of each alternative, and NL models considering a first level related to the choice of coach
or train and a second level related to the choose between different coaches services. Biogeme software has been adopted for calibration [19]. The attributes adopted to describe the utility functions of the models derive from the survey and they have been divided into two macro classes, as reported in Table 3: 1) attributes related to the service features and 2) attributes related to the service information.
4.1 Multinomial Logit models (ML)
The Multinomial Logit (ML) models are the first family of models analyzed, where the modal choice is between five alternatives (1 train – Leonardo Express – and 4 coaches). Totally, four different ML models have been calibrated with statistical significance of the results, where mainly the differences are in the attributes adopted to describe the five alternatives. The four models assume the following functional form for the computation of the utility V for the alternative j by user i:
ML1: Vi
j = βw.t.waiting timeij + βf farei
j + βf.s.flight sponsorij + βLOILOIi
j + CSAjASAj
ML2: Vij = βw.t.waiting timei
j + βf fareij + βt.t.traveltimei
j + βLOILOIij + CSAjASAj
ML3: Vij = βf farei
j +βLOILOIij +βccomforti
j + CSAjASAj
ML4: βw.t.waiting timeij +βf.s.flight sponsori
j + βLOILOIij + βI.P.T.InfoPreTripi
j
+ CSAjASAj
where CSAjASAj represents all the value of utility that the attributes cannot explain.
The β coefficients are the weights of each attribute and they are obtained as a result of the calibration of each model with the maximum likelihood approach. General results of the four ML are reported in Table 4. The ML4 is the best model in terms of sample reconstitution (81%) and the values of the β coefficients with their statistical significance are reported in Table 5. The student T test has been carried out with a significance of 5%.
The Nested Logit (NL) models are the second family of models analyzed, where the modal choice is between the usual five alternatives (1 train – Leonardo Express – and 4 coaches). Also in this case, four different NL models have been calibrated with statistical significance of the results:
Apart from NL1, where the attributes are exactly the same adopted in ML3, the other calibrated NL models report some new attributes, in particular: InfoFlighti
j, knowconcurrij and billboardsj.
General results of the four NL are reported in Table 6: except for NL2, the other NL models report similar or greater values of ρ2 and sample reconstitution respect to the ML models. The NL4 is the best model in terms of sample
reconstitution (83%) and the values of the β coefficients with their statistical significance are reported in Table 7. The student T test has been carried out with a significance of 5%.
All the four models ML contain the attribute Level of Information (LoIji), so
permitting to quantify the VOI given at the final airport by billboards, kiosks etc. respect to the other attributes in the choice between concurrent transit systems; moreover the last model (ML4) permits to quantify also the value of pre-trip information (containingtheattributeInfoPreTripj
i) and the value of information given during the flight (containing the attribute lightsponsorj). In particular, the VOI is computed as the relative value of the different information attributes respect to the constant utility for the different models. Results (Table 8) show how the VOI is quite similar for ML1 (25%) and ML3 (28%), while for ML2 and ML4 it decreases respectively to 12% and 8%. ML4 is the most accurate between the Multinomial models due to its capacity to reproduce the choices of the sample; however in this case it seems that the main variable is not the quality and quantity of information, but the remaining attribute that is the waiting time. So, if ML4 is considered as the reference model between the ML models, it is possible to fix the VOI to the 8%, with a greater weight of the information given pre-trip, followed by the information at the arrival airport and finally by the information during the flight. Passing to the NL models, with the presence of new attributes in the NL models and their different structure respect to ML, new and interesting results can be reported (Table 9) in terms of the VOI. The weight of information in NL ranges in fact from the 46% to the 83%. Moreover, about the different types of information, it seems that usually a low weight is assumed by the information perceived/received by the user during the flight (InfoFlight and Flight sponsor), as well as the presence of billboards inside the airport terminal.
Table 8: Value of information in the four ML models.
Value of information [%] LoI InfoPreTrip Flight sponsor Total Value [%] ML1 25 - - 25ML2 12 - - 12ML3 28 - - 28ML4 3 4 1 8
Instead, it is the global perception that the user has about all the information received in the airport (LoI) to have a strong influence in the choice (weight ranging from 27% to 46%), as well as the information received pre-trip (34%).
Table 9: Value of information in the four NL models.
Value of information [%]
LoI InfoPreTrip Flight sponsor
InfoFlight KnowConcurrent Billboards Total Value [%]
The structure of the NL can be considered most representative of the real choice context with respect to the ML: in fact in our case study the user makes a first choice between train and coach and, if the choice is the coach, she/he has to choose between different coach companies. ML well adapts to choice contexts with not dependent alternatives (for example if in our case, the train is not available) and it has been treated only for completeness of the study. At the end, if a VOI has to be derived, the most adequate in this case is the one derived by NL4, so by a nested logit structure and, between the NL models, by the one with the most high sample reconstitution. With NL4, the VOI reaches the weight of 83% respect to the 17% assumed by the attributes related to the service features.
5 Conclusions
Usually the information is reported as a main variable in affecting travel behaviour. Anyway, it looks like advertising methods and the effects of different kinds of advertising have been missing in the quantification of the transit system accessibility. This study arises in this context with the objective to identify and quantify the impact that the information have in terms of accessibility to the transit service. The type of information considered and assessed are those provided to the user who has to choose between concurrent public transport systems; moreover they will be both en-route information and pre-trip information. A methodology has been presented in order to identify and quantify this value of information, based on the development of behavioral models that make use of random utility theory. These models have been calibrated and validated using data collected by a RP survey to 200 users choosing between the different transit services available connecting Fiumicino Airport to the city center of Rome (Termini Station) in Italy. The result is that the value of information reaches the weight of 83% respect to the 17% assumed by the attributes related to the service features. About the different types of information, it seems that usually a low weight is assumed by
the information perceived/received by the user during the flight, as well as the presence of billboards inside the airport terminal. Instead, it is the global perception that the user has about all the information received in the airport to have a strong influence in the choice, as well as the information received pre-trip. These are fundamental results for all the subjects involved (in the case study, for example, the airport operators, the flight companies and the concurrent transit companies), because it underlines the importance of the given and perceived information and moreover it quantify this importance; on the other side the result obtained is fundamental also for transport planners and engineers, who should take into account information attributes in order to correctly depict their models. Further developments of the study will be oriented to understand the relations between given and perceived information by the users, to develop the same methodology to other cases of study and to try to apply different methods to quantify the value of information in order to generalize the result obtained in this work.
References
[1] Gori, S., Nigro, M., Petrelli M. (2012). The Impact of Land Use characteristics for Sustainable Mobility: the case study of Rome. EUROPEAN Transport Research Review: An Open Access Journal, DOI 10.1007/s12544-012-0077-6
[2] Cascetta, E. (2009). Transportation Systems Analysis: Models and Applications. Springer-Verlag GmbH
[3] Al Mamun M.S. and Lownes N.E. (2011). A Composite Index of Public Transit Accessibility. Journal of Public Transportation, Vol. 14, No. 2, 2011
[4] D’Acierno, L., Gallo, M., Montella, B. & Placido, A., Analysis of the interaction between travel demand and rail capacity constraints. WIT Transactions on the Built Environment, 128, pp. 197–207, 2012
[5] Adler, J.L. (2001). Investigating the learning effects of route guidance and traffic advisories on route choice behavior. Transportation Research Part C, 9 (2001) 1–14
[6] Levinson, D. (2003). The value of advanced traveller information systems for route choice. Transportation Research Part C 11 (2003) 75–87
[7] Lai, K., Wong W. (1998). Driver comprehension and behaviour in response to traffic information. Urban Transport IV. C.A. BORREGO University of Averio Portugal & L.J. SUCHAROV Wessex Institute of Technology United Kingdom
[8] Hato, E., Asakura, Y., Kashiwadani, M., Katsuki S. (1999). The simulation study of traffic information strategies using the computer for data collection on drivers' responses to AXIS. Urban Transport V. L. J. SUCHAROV, Wessex Institute of Technology, United Kingdom
[9] Stathopoulos, A., Tsekeris, T. (2009). Economy of information in congested transport systems, IET Intell. Transp. Syst., 2009, Vol. 3, Iss. 3, pp. 336–344, doi: 10.1049/iet-its.2008.0061
[10] Dziekan, K., Kottenhoff, K. (2007). Dynamic at-stop real-time information displays for public transport: effects on customers. Transportation Research Part A, 41 (2007) 489–501
[11] Uster, G., Juguet, S., Talon, G. (2009). The Viatic Concept – Information Technology for Intelligent Travellers. 9th International Conference on Intelligent Transport Systems Telecommunications, (ITST), 2009
[12] Caspar, G. Chorus, E.J., Molin, E., Van Wee, B., Arentze, T.A., Timmermans, H.J.P. (2006). Responses to Transit Information among Car-drivers: Regret-based Models and Simulations, Transportation Planning and Technology, August 2006, Vol. 29, No. 4, pp. 249–271
[13] Flamini, M., Pacciarelli, D., Nigro M. (2011). Assessing the value of information for retail distribution of perishable goods. EUROPEAN Transport Research Review: An Open Access Journal, July 2011, Volume 3, Issue 2, pp 103–112, DOI 10.1007/s12544-011-0051-8
[14] Dudley Dewhirst, H., Arvey, R.D., Brown, E.M. (1978). Satisfaction and Performance in Research and Development Tasks as Related to Information Accessibility. IEEE Transactions On Engineering Management, vol. EM-25, no. 3, august 1978
[15] Shi, X., Li, D., Zhu, H., Zhang, W. (2007). Research on Supply Chain Information Classification Based on Information Value and Information Sensitivity, Proceedings of the Fourth IEEE Conference on Service Systems and Service Management
[16] Verplanken, B., Aarts, H., Van Knippenberg, A. (1997) Habit, information acquisition and the process of making modal choices, European Journal of Social Psychology, 27(5), pp. 539–560
[17] Eboli, L., Mazzulla, G. (2008). Willingness to pay of public transport users for improvement in service quality. European Transport, 38 (2008): 107–118
[18] Ben Akiva M., Lerman S. (1985). Discrete Choice Analysis: Theory and Application to Travel Demand. MIT Press, Cambridge, Mass
[19] Bierlaire, M. (2003). BIOGEME: A free package for the estimation of discrete choice models , Proceedings of the 3rd Swiss Transportation Research Conference, Ascona, Switzerland