The value of non monetary-based retail promotions: Comparing an in- store experiment to simulated purchasing Armando Maria Corsi Ehrenberg-Bass Institute of Marketing Science [email protected]Simone Mueller Loose MAPP – Department of Business Administration Ehrenberg-Bass Institute of Marketing Science [email protected]Larry Lockshin Ehrenberg-Bass Institute of Marketing Science [email protected]Purpose: Price discounts in the retail sector are the norm rather than an exception. However, price promotions have several negative impacts on brands. Less attention has been devoted to non-monetary promotions (e.g. shelf talkers, in-store displays). The aim of this work is to fill this gap, by showing the effects of non-monetary promotions in store and the relationship with the way consumers react to analogous non-monetary promotions on-line. Design: The study comprised three main stages: a) the selection and pre-test of the promotional material with a representative sample of the Australian wine drinking population; b) an in-store experiment with an Australian wine retailer across 62 stores located in New South Wales, Queensland and Victoria, and c) an online discrete choice experiment to test the effects of the same stimuli used in the in-store experiment on consumers’ simulated purchases. Findings: The in-store analysis confirmed that the closer an advertising message is to a product, the higher is the impact on consumers’ choices. In particular, the study found that regional messages had a larger effect compared to the environmental message. Secondly, verbal shelf talkers tend to have a bigger effect than visual ones. Third, banners are only useful to promote environmentally friendly wines. In addition, it was possible to observe substitution effects between wines showing a shelf talker and control wines. The online choice experiment confirmed to have a high external validity to predict effects of in-store promotion campaigns. They are a particularly suitable market research method to pre-test promotional campaigns. Key words: non-monetary promotions, in-store, on-line, discrete choice experiment, wine
Transcript
The value of non monetary-based retail promotions: Comparing an in-store experiment to simulated purchasing
Purpose: Price discounts in the retail sector are the norm rather than an exception. However, price promotions have several negative impacts on brands. Less attention has been devoted to non-monetary promotions (e.g. shelf talkers, in-store displays). The aim of this work is to fill this gap, by showing the effects of non-monetary promotions in store and the relationship with the way consumers react to analogous non-monetary promotions on-line. Design: The study comprised three main stages: a) the selection and pre-test of the promotional material with a representative sample of the Australian wine drinking population; b) an in-store experiment with an Australian wine retailer across 62 stores located in New South Wales, Queensland and Victoria, and c) an online discrete choice experiment to test the effects of the same stimuli used in the in-store experiment on consumers’ simulated purchases. Findings: The in-store analysis confirmed that the closer an advertising message is to a product, the higher is the impact on consumers’ choices. In particular, the study found that regional messages had a larger effect compared to the environmental message. Secondly, verbal shelf talkers tend to have a bigger effect than visual ones. Third, banners are only useful to promote environmentally friendly wines. In addition, it was possible to observe substitution effects between wines showing a shelf talker and control wines. The online choice experiment confirmed to have a high external validity to predict effects of in-store promotion campaigns. They are a particularly suitable market research method to pre-test promotional campaigns. Key words: non-monetary promotions, in-store, on-line, discrete choice experiment, wine
1
1 Introduction & Literature Review Price discounts in the retail sector are the norm rather than an exception. Although figures vary between markets and retail outlets, much of the off-premise wine market is sold under different forms of monetary-based promotions (e.g. percentage discount, buy-one-get-one-free). A recent study by Jones et al. (2011) on the nature and effects of point-of-sale promotion on alcoholic beverages in Australia, showed that wine has the highest number of unique promotions (41%), followed by spirits, beer and RTDs. In particular, wine was most commonly promoted using discounts (71%), followed by other monetary promotions, such as free gift with purchase (18%). These promotions are most commonly located on the shelf (90%). Promotions are used by retailers to encourage the trial or use of products or services (Keller, 2002). They are classified by researchers in different ways: active vs. passive, in-store vs. out-of-store, price vs. non price (also called monetary vs. non-monetary) promotions (Barat and Paswan, 2005), depending on the objective of the research. In the present work, we focus on the effect of two different non-monetary promotions, as recent studies suggest a lack of research in this area (Yi and Yoo, 2011). Moreover, in a world where retailers are cutting wine producers’ margins with their fierce price discounts (The Age, 2012), it is fundamental for the wine industry to explore alternative ways to incentivise consumers to buy a product, with no reduction in producers’ margins.
1.1 Monetary promotions The most common type of monetary promotions include discounts, coupons, and rebates (Chandon et al., 2000). Price promotions seem to be effective for traffic generation (Grewal et al., 1998) and in a few studies they had a short-term positive effect on brand performance (Doob et al., 1969, Dodson et al., 1978, Chakraborty and Cole, 1991). However, in the majority of studies discounts tended to have a negative impact on quality perception (Blattberg and Neslin, 1990), had very short-term sales effects (Darke and Chung, 2005, Palazon and Delgado-Ballester, 2009) and no long-term sales effects (Doob et al., 1969, Dodson et al., 1978, Guadagni and Little, 1983, Kahn and Louie, 1990, Mela et al., 1997, Raghubir and Corfman, 1999). In addition, discounts do not usually expand category demand (Huang and Dawes, 2007); they erode reference prices (Kumar et al., 1998), and can hurt profits (Jedidi et al., 1999). Australian wine retailers seem to focus heavily on monetary-based promotions. The latest figures from Euromonitor International (2012) show that, despite the wine sector’s efforts to encourage the premiumisation of the Australian wine industry by focusing on higher priced wines, unit prices for wine in Australia declined by 1% from 2011 to 2012. In addition, wine retailers offer a growing range of private labels, with Coles and Woolworths (75% market share combined) shelving more than 100 different wines produced under their umbrella, but not labelled as private label wines. IBIS World forecasts overall that private label brands will increase in value by 50% (IBIS WORLD, 2012). These factors show the need for other ways to attract consumer sales dollars besides price discounting.
1.2 Non-monetary promotions Non-monetary promotions are represented by store flyers, in-store displays, shelf talkers and other methods of drawing consumer attention to specific products, which do not involve some forms of price rebate to stimulate consumers to buy a brand (Pauler and Dick, 2006). Compared to price promotions, non-monetary promotions have a more positive long-term effect on brand
2
performance (Yi and Yoo, 2011, Aaker, 1991). For example, Sinha and Smith (2000) show that consumers perceive a non-monetary promotion framed as a gain (e.g. buy-one-get-one-free) better than a straight discount framed as a reduced loss (e.g. buy 2 for 1, or 50% off). Yi and Yoo (2011) note that non-monetary promotions seem to elicit a more favourable attitude towards brands than monetary promotions, but these effects vary in relation to consumers’ deal proneness. High deal prone consumers react less to non-price promotions than do low-deal prone consumers. 1.3 Regional vs. environmental information Previous research has shown the importance of region of origin in choosing wines, especially those above AUD$15 or equivalent (Atkin and Johnson, 2010, Lockshin et al., 2006, Perrouty et al., 2006). Wine Australia has been promoting the concept of regionality for the last three years, with its “regional heroes” and “Australian A+” domestic promotions (Wine Australia, 2012). Region was chosen as one of the non-monetary factors with the greatest influence on consumer choice after price.
Less emphasis has been put so far on wine environmental friendliness, but there is evidence that some consumer segments are willing to spend more for organic/sustainable wines than standard ones (Mueller-Loose and Lockshin, 2013, Mueller-Loose and Remaud, 2011, Remaud et al., 2008). One of the most frequent explanations is that consumers are not willing to trade-off the quality of a wine, for the sake of having an environmentally friendly one. Consumers will consider an environmentally friendly wine at the same price as regular wines (Lockshin and Corsi, 2013). With particular relation to Australia, the recent launch of environmental certification programs, such as EntWine Australia, could lead towards an increase in awareness and appreciation of environmentally friendly wines. ‘Environmentally friendly’ was chosen as the contrasting and likely less important factor in wine choice for this experiment.
1.4 Visual vs. verbal information One of the issues in presenting information is whether to present it in graphical or in written format. Mueller et al. (2010a) showed that consumers processed graphical information better and more completely than verbal information. Recent research in food packaging also showed that graphical logo presentations were more effective in a choice experiment than using only words as long as the consumers were familiar with the logo (Janssen and Hamm, 2012). Part of the goal of this project was to test potential new logos for the promotion of regional Australian wines and environmentally friendly grape growing and wine making practices, so new logos with word descriptions were compared to descriptions without any logos. 1.5 Presence vs. absence of banners at the entrance of the store
As noted above, most retail promotions are based at the shelf (Jones et al., 2011). A smaller number of promotions and consumer attention devices are positioned in front of the store or as consumers walk into a store (Sorensen, 2009). Banners or signage at the front of the store is similar in conception to the use of information provision in choice experiments, where some respondents are provided with product information in an experimental design before viewing the choice experiment. Little research has been conducted on the effectiveness of front of store banners on consumer purchases.
3
1.6 Can choice experiments validly predict the effect of in-store experiments? One of the major issues in conducting real in-store research is the difficulty of gaining retailer access and permission to make changes to actual shelves in enough stores to run an experiment. This means that other methods have been used to predict real world outcomes, without the cost and difficulty of manipulating in-store experiments. In order to be useful, new methods have to prove external validity for real people in real markets to be of value to product developers (Cardello, 2005, Grunert, 2003, Louviere, 1988). Nevertheless, so far only limited insights are available for the predictive ability of different marketing research methods. On-line choice experiments have been used as a proxy for actual experiments, as they are able to validly predict market success (Winer, 1999, Lynch, 1999, Laurent, 2000, Chandon et al., 2005). Discrete choice experiments have been found to some predictive ability for consumers’ real market behaviour (Lusk and Schroeder, 2004, Louviere, 1988). Successful prediction of consumer choices have covered a wide range of different choice situations and choice complexities, including supermarket purchases (Chang et al., 2009), respondents’ transportation mode choices (Currim, 1981), recreation choice behaviour (Louviere and Timmermans, 1992) and food choice behaviour (Mueller et al., 2010b, Grunert et al., 2009). Recently, choice experiments were utilised to predict the impact of retail shelf information on consumer choice (Mueller et al., 2009), but only scanner data on overall sales was validated. To date it is unknown to what degree predictions from shelf simulation choice experiments are predictive for real market experiments where the same manipulations are compared.
1.7 Research questions The overall impetus for this research was to test the efficacy of non-monetary promotions for increasing the sales of Australian wines in Australia. Two contrasting promotional messages were chosen with the help of Wine Australia and the Winemaker’s Federation of Australia: regionality and environmental friendliness. These messages would be placed onto ‘shelf talkers’, which are promotional messages on the shelf below the product where price discounts are normally displayed. In addition, the use of a banner at the entrance of the store was compared to no banner to see if this extra reminder added to the efficacy of the shelf talker promotions. In light of these considerations, this research aims to test the following research questions: RQ1.1 Do in-store non-monetary promotions increase sales of wines?
RQ1.2 Which combinations of promotional message, verbal versus verbal + logo with or without a banner generate the highest sales increase in-store?
RQ2.1 Do simulated (online) non-monetary promotions increase sales of wines? RQ2.2 Which combinations of promotional message, verbal versus verbal + logo with or
without a banner generate the highest sales increase in a simulated online experiment? RQ3 To what degree can online discrete choice experiments predict in-store retail
promotions? 2 Materials and methods The study comprised three main stages: the selection and pre-test of the promotional messages and logos, the in-store experiment and the online discrete choice experiment.
4
2.1 Selection and pre-test of promotional messages and logos First, the researchers developed possible communication campaigns for the promotion of wine regionality and environmental friendliness with Wine Australia and the Winemakers Federation of Australia. An independent graphic designer designed the logos. The process led to the selection of six logos (three per type of communication) and 26 slogans (thirteen per type), which were then evaluated by 822 respondents socio-demographically representative of the population of Australian red wine drinkers (RoyMorgan, 2006). A Best-Worst experiment measuring the preferences for the slogans resulted in “Australian Regions – discover your own backyard” being selected as the most liked regional slogan, and “Wine, Naturally” selected as the most liked environmental slogan.
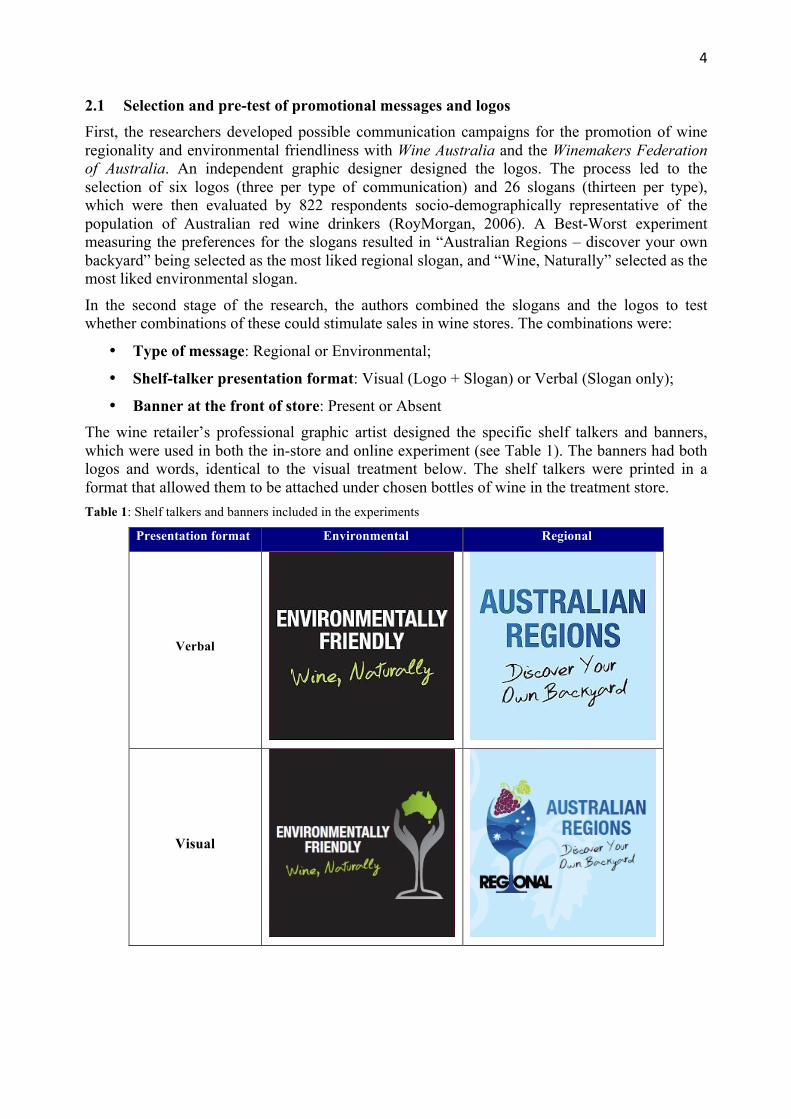
In the second stage of the research, the authors combined the slogans and the logos to test whether combinations of these could stimulate sales in wine stores. The combinations were:
• Banner at the front of store: Present or Absent The wine retailer’s professional graphic artist designed the specific shelf talkers and banners, which were used in both the in-store and online experiment (see Table 1). The banners had both logos and words, identical to the visual treatment below. The shelf talkers were printed in a format that allowed them to be attached under chosen bottles of wine in the treatment store. Table 1: Shelf talkers and banners included in the experiments
Presentation format Environmental Regional
Verbal
Visual
5
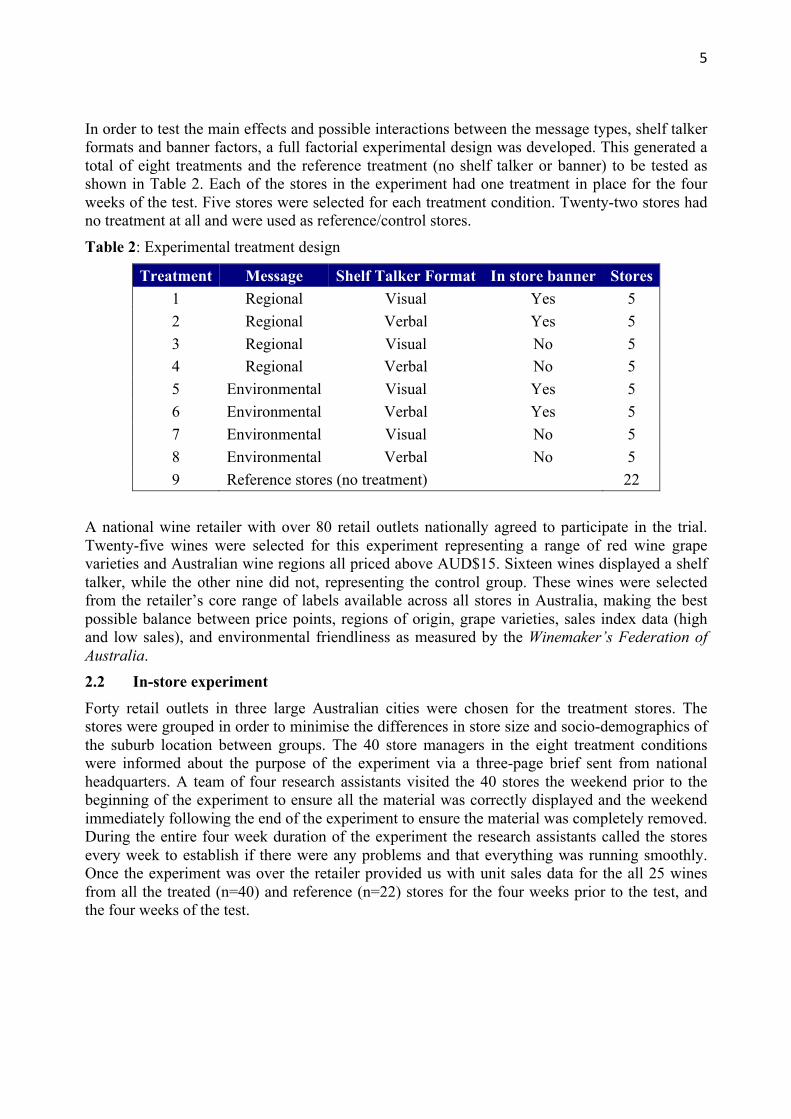
In order to test the main effects and possible interactions between the message types, shelf talker formats and banner factors, a full factorial experimental design was developed. This generated a total of eight treatments and the reference treatment (no shelf talker or banner) to be tested as shown in Table 2. Each of the stores in the experiment had one treatment in place for the four weeks of the test. Five stores were selected for each treatment condition. Twenty-two stores had no treatment at all and were used as reference/control stores.
Table 2: Experimental treatment design
Treatment Message Shelf Talker Format In store banner Stores 1 Regional Visual Yes 5 2 Regional Verbal Yes 5 3 Regional Visual No 5 4 Regional Verbal No 5 5 Environmental Visual Yes 5 6 Environmental Verbal Yes 5 7 Environmental Visual No 5 8 Environmental Verbal No 5 9 Reference stores (no treatment) 22
A national wine retailer with over 80 retail outlets nationally agreed to participate in the trial. Twenty-five wines were selected for this experiment representing a range of red wine grape varieties and Australian wine regions all priced above AUD$15. Sixteen wines displayed a shelf talker, while the other nine did not, representing the control group. These wines were selected from the retailer’s core range of labels available across all stores in Australia, making the best possible balance between price points, regions of origin, grape varieties, sales index data (high and low sales), and environmental friendliness as measured by the Winemaker’s Federation of Australia. 2.2 In-store experiment Forty retail outlets in three large Australian cities were chosen for the treatment stores. The stores were grouped in order to minimise the differences in store size and socio-demographics of the suburb location between groups. The 40 store managers in the eight treatment conditions were informed about the purpose of the experiment via a three-page brief sent from national headquarters. A team of four research assistants visited the 40 stores the weekend prior to the beginning of the experiment to ensure all the material was correctly displayed and the weekend immediately following the end of the experiment to ensure the material was completely removed. During the entire four week duration of the experiment the research assistants called the stores every week to establish if there were any problems and that everything was running smoothly. Once the experiment was over the retailer provided us with unit sales data for the all 25 wines from all the treated (n=40) and reference (n=22) stores for the four weeks prior to the test, and the four weeks of the test.
6
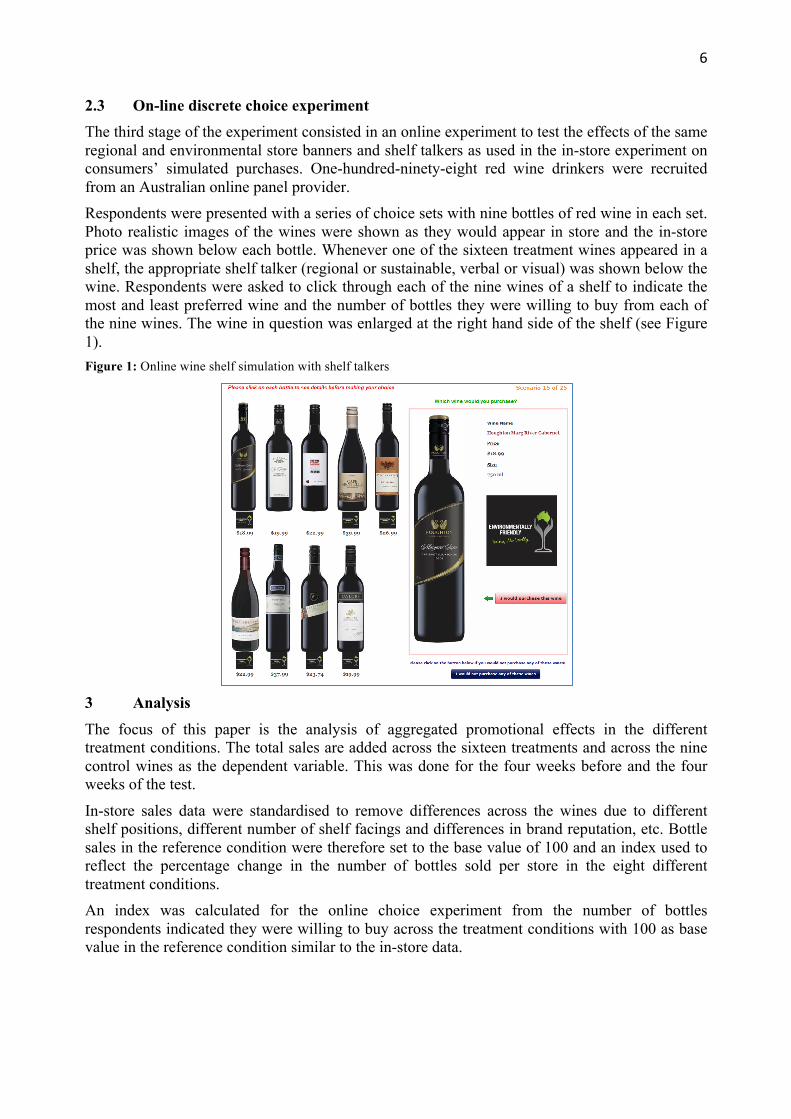
2.3 On-line discrete choice experiment The third stage of the experiment consisted in an online experiment to test the effects of the same regional and environmental store banners and shelf talkers as used in the in-store experiment on consumers’ simulated purchases. One-hundred-ninety-eight red wine drinkers were recruited from an Australian online panel provider. Respondents were presented with a series of choice sets with nine bottles of red wine in each set. Photo realistic images of the wines were shown as they would appear in store and the in-store price was shown below each bottle. Whenever one of the sixteen treatment wines appeared in a shelf, the appropriate shelf talker (regional or sustainable, verbal or visual) was shown below the wine. Respondents were asked to click through each of the nine wines of a shelf to indicate the most and least preferred wine and the number of bottles they were willing to buy from each of the nine wines. The wine in question was enlarged at the right hand side of the shelf (see Figure 1). Figure 1: Online wine shelf simulation with shelf talkers
3 Analysis The focus of this paper is the analysis of aggregated promotional effects in the different treatment conditions. The total sales are added across the sixteen treatments and across the nine control wines as the dependent variable. This was done for the four weeks before and the four weeks of the test.
In-store sales data were standardised to remove differences across the wines due to different shelf positions, different number of shelf facings and differences in brand reputation, etc. Bottle sales in the reference condition were therefore set to the base value of 100 and an index used to reflect the percentage change in the number of bottles sold per store in the eight different treatment conditions. An index was calculated for the online choice experiment from the number of bottles respondents indicated they were willing to buy across the treatment conditions with 100 as base value in the reference condition similar to the in-store data.
7
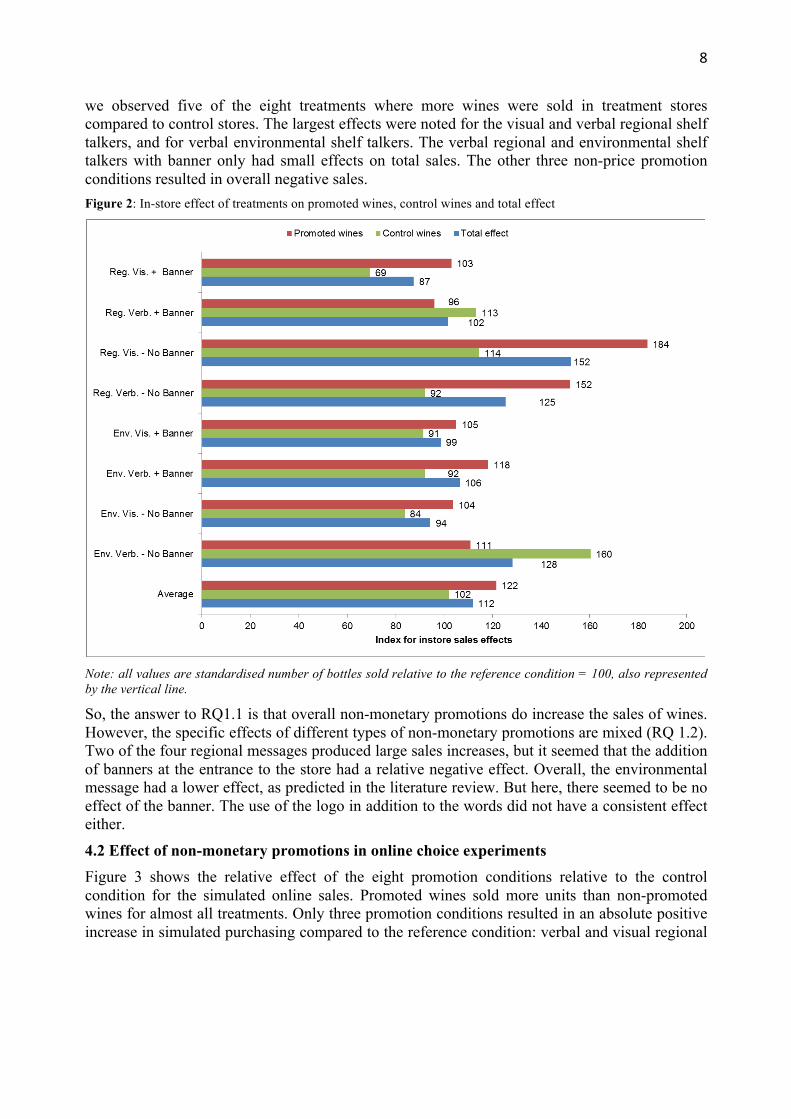
The predictive validity of the online choices was assessed by relating the average index values across the eight treatments and the reference condition by means of correlation and linear regression. 4 Results 4.1 Effect of in-store non-price promotions To address the first research question of the effect of non-monetary promotions on treated wines, the number of bottles sold during the promotion were related to sales prior the promotion. The results for promoted wines showed that the use of the promotional material (banners and shelf talkers) increased sales of treated wines in treated stores compared to control stores for seven out of eight treatments (compare red and green bars in Figure 2: In-store effect of treatments on promoted wines, control wines and total ). In particular, the use of a regional shelf talker – visual (184%) or verbal (152%) – without a banner generated the highest sales increase for treated wines compared to control stores. Also, a positive promotion effect was recorded for the treated wines with a verbal environmental shelf talker together with (111%) or without (118%) a banner, compared to the same wines in control stores. Marginally positive effects were observed for treated wines promoted with a regional shelf talker and a banner (103%), or with an environmental shelf talker with (105%) or without (104%) a banner. Only verbal regional shelf talkers with a banner were not able stimulate higher sales (96%) for treated wines compared to control stores. The green bars represent sales of the nine control wines in the treatment stores. We would generally expect their sales would decrease relative to the same wines in control stores as consumers were likely to substitute promoted wines for them, since they were chosen to be of similar origin, grape variety and price as the treatment wines. This expectation is confirmed in five out of the eight treatments (green bar less than 100%). There were three exceptions, where we observed an increase in sales of non-promoted wines. The first two of the three exceptions were observed for the verbal regional shelf talkers with and without a banner (113%). This phenomenon is particularly surprising as sales of promoted wines in the banner treatment did not increase compared to control stores (96%). A similar exception occurred for the verbal regional shelf talker without a banner. However, these wines increased in sales compared to treated stores by 14%, but still increased over the four week period before the trial. The third exception was observed for non-promoted wines in stores where verbal environmental shelf talkers without banners were present. In those stores, sales of control wines were 60% higher than in control stores. This considerable increase, however, can largely be attributed to a single outlier wine. We are not aware of the reasons for this increase, but 59 bottles of one of the control wines were sold in one treated store during the experiment, compared to an average of 6 bottles sold per store in the other treated stores. If we delete this outlier the increase in sales reduces to 111%, which is exactly the same value registered for treated wines in the same stores, suggesting that the same increase was observed for promoted and non-promoted wines. One area we could not control and could not observe were store level promotions or competitor promotions matched by the selected retailer during the test period. These might have caused differences in sales of the control wines. The total effect (blue bar) shows the impact of non-monetary promotions across all promoted and non-promoted wines we monitored. A positive total effect could only be observed if the promotion attracted sufficient new sales above any substitution for not promoted wines. Overall,
8
we observed five of the eight treatments where more wines were sold in treatment stores compared to control stores. The largest effects were noted for the visual and verbal regional shelf talkers, and for verbal environmental shelf talkers. The verbal regional and environmental shelf talkers with banner only had small effects on total sales. The other three non-price promotion conditions resulted in overall negative sales. Figure 2: In-store effect of treatments on promoted wines, control wines and total effect
Note: all values are standardised number of bottles sold relative to the reference condition = 100, also represented by the vertical line.
So, the answer to RQ1.1 is that overall non-monetary promotions do increase the sales of wines. However, the specific effects of different types of non-monetary promotions are mixed (RQ 1.2). Two of the four regional messages produced large sales increases, but it seemed that the addition of banners at the entrance to the store had a relative negative effect. Overall, the environmental message had a lower effect, as predicted in the literature review. But here, there seemed to be no effect of the banner. The use of the logo in addition to the words did not have a consistent effect either.
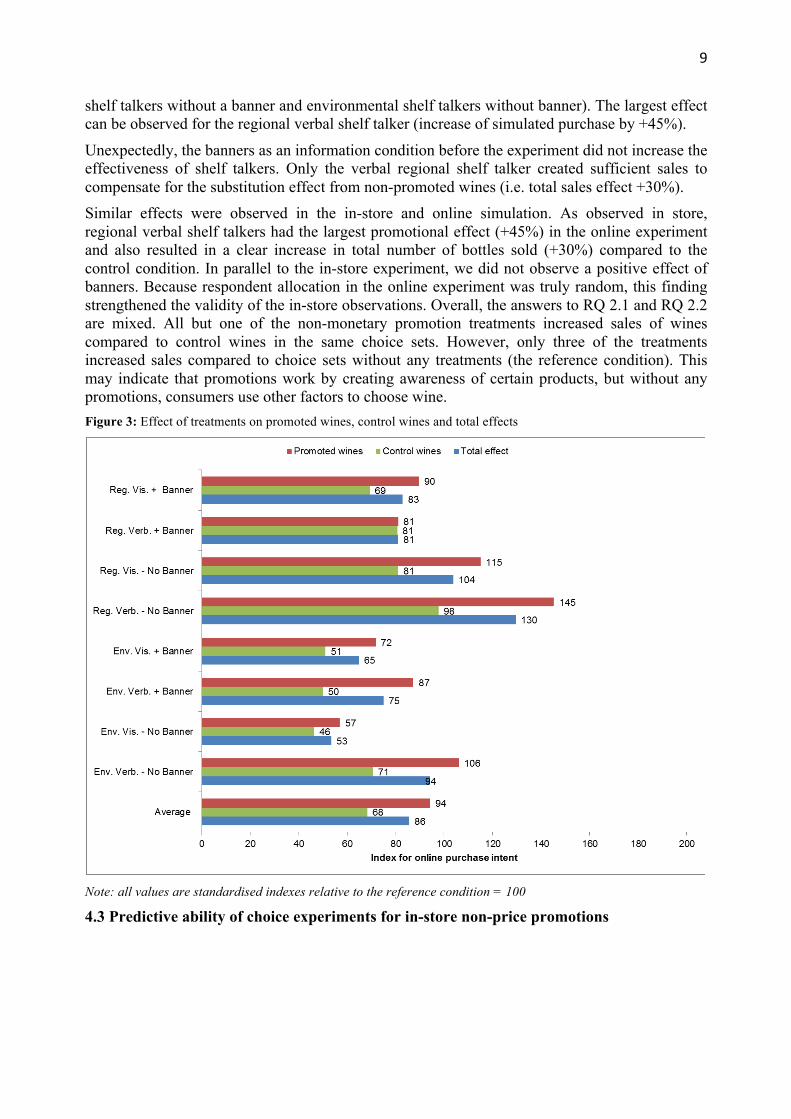
4.2 Effect of non-monetary promotions in online choice experiments Figure 3 shows the relative effect of the eight promotion conditions relative to the control condition for the simulated online sales. Promoted wines sold more units than non-promoted wines for almost all treatments. Only three promotion conditions resulted in an absolute positive increase in simulated purchasing compared to the reference condition: verbal and visual regional
9
shelf talkers without a banner and environmental shelf talkers without banner). The largest effect can be observed for the regional verbal shelf talker (increase of simulated purchase by +45%).
Unexpectedly, the banners as an information condition before the experiment did not increase the effectiveness of shelf talkers. Only the verbal regional shelf talker created sufficient sales to compensate for the substitution effect from non-promoted wines (i.e. total sales effect +30%). Similar effects were observed in the in-store and online simulation. As observed in store, regional verbal shelf talkers had the largest promotional effect (+45%) in the online experiment and also resulted in a clear increase in total number of bottles sold (+30%) compared to the control condition. In parallel to the in-store experiment, we did not observe a positive effect of banners. Because respondent allocation in the online experiment was truly random, this finding strengthened the validity of the in-store observations. Overall, the answers to RQ 2.1 and RQ 2.2 are mixed. All but one of the non-monetary promotion treatments increased sales of wines compared to control wines in the same choice sets. However, only three of the treatments increased sales compared to choice sets without any treatments (the reference condition). This may indicate that promotions work by creating awareness of certain products, but without any promotions, consumers use other factors to choose wine. Figure 3: Effect of treatments on promoted wines, control wines and total effects
Note: all values are standardised indexes relative to the reference condition = 100
4.3 Predictive ability of choice experiments for in-store non-price promotions
10
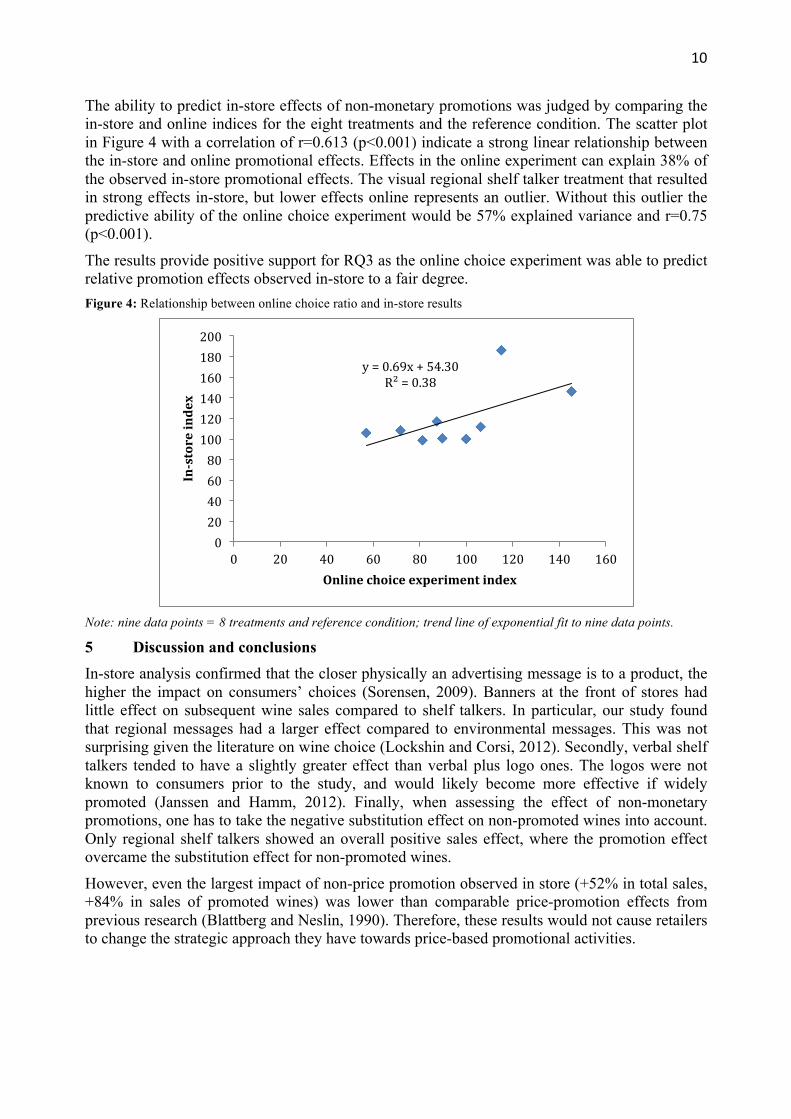
The ability to predict in-store effects of non-monetary promotions was judged by comparing the in-store and online indices for the eight treatments and the reference condition. The scatter plot in Figure 4 with a correlation of r=0.613 (p<0.001) indicate a strong linear relationship between the in-store and online promotional effects. Effects in the online experiment can explain 38% of the observed in-store promotional effects. The visual regional shelf talker treatment that resulted in strong effects in-store, but lower effects online represents an outlier. Without this outlier the predictive ability of the online choice experiment would be 57% explained variance and r=0.75 (p<0.001).
The results provide positive support for RQ3 as the online choice experiment was able to predict relative promotion effects observed in-store to a fair degree. Figure 4: Relationship between online choice ratio and in-store results
Note: nine data points = 8 treatments and reference condition; trend line of exponential fit to nine data points.
5 Discussion and conclusions In-store analysis confirmed that the closer physically an advertising message is to a product, the higher the impact on consumers’ choices (Sorensen, 2009). Banners at the front of stores had little effect on subsequent wine sales compared to shelf talkers. In particular, our study found that regional messages had a larger effect compared to environmental messages. This was not surprising given the literature on wine choice (Lockshin and Corsi, 2012). Secondly, verbal shelf talkers tended to have a slightly greater effect than verbal plus logo ones. The logos were not known to consumers prior to the study, and would likely become more effective if widely promoted (Janssen and Hamm, 2012). Finally, when assessing the effect of non-monetary promotions, one has to take the negative substitution effect on non-promoted wines into account. Only regional shelf talkers showed an overall positive sales effect, where the promotion effect overcame the substitution effect for non-promoted wines.
However, even the largest impact of non-price promotion observed in store (+52% in total sales, +84% in sales of promoted wines) was lower than comparable price-promotion effects from previous research (Blattberg and Neslin, 1990). Therefore, these results would not cause retailers to change the strategic approach they have towards price-based promotional activities.
y = 0.69x + 54.30 R² = 0.38
0 20 40 60 80 100 120 140 160 180 200
0 20 40 60 80 100 120 140 160
In-‐store index
Online choice experiment index
11
Given the very low cost associated with the design and printing of promotional material similar to the ones adopted in this research, it is suggested that producers or associations of producers discuss the opportunity to conduct non-price promotions during the year. This will not just have the benefit of increasing producers’ and retailers’ margins compared to selling a product at a discounted price, but will also help reduce the negative effects of price promotions. One of the biggest issues in conducting this kind of research is maintaining the experimental conditions in-store free from non-random influences. Store managers were contacted regularly to ensure that none of the treated and control wines were subject to local price promotions for the duration of the experiment. Despite the retailer’s promises, the authors found out later that three of the treated wines and three of the control wines were promoted just before the experiment started. In addition, two other wines had a massive change in sales during the experiment, without a reason that could be identified. This increased the variation in the sales results, which the authors tried to remove by considering only twelve treated wines (out of sixteen) and five control wines (out of nine).
When simulating in-store promotion in an online choice experiment, we observed high congruency with actual sales effects in-store. This high predictive ability has important implications for wine marketing research and retail research in general. Pretesting the effectiveness of promotional material does not require comprehensive and difficult in-store testing, which is dependent on retailer agreement and takes considerable time from preparation to promotion to analysis. A comparable online experiment is designed more quickly and only takes a couple of days to few weeks to collect the data online. Also, online experiments require far lower costs than a controlled in-store experiment across several states.
Online experiments allow one to quickly and easily test the effectiveness of different non-monetary promotion strategies in domestic and eventually overseas markets. The advantage of online tests is particularly pronounced because the collaboration with overseas retailers is usually more difficult and travel costs are high.
This work is not exempt from limitations. First, the study was limited to Australian red wines in Australia, while it would be interesting to extend this research to white wines, foreign wines and overseas markets. Another limitation is that while the in-store experiment allows a before and after comparison of the effects of non-monetary promotions, it is only possible to compare the results of the in-store experiment with the on-line discrete choice experiment for the period when the non-monetary promotions were displayed, because we did not conduct a discrete choice experiment without promotional material. Finally, although we tried to avoid an overestimation of the impact of non-monetary promotions in the discrete choice experiment by including nine control wines, which were not subject to any promotion, we couldn’t replicate the competition that the sixteen treated wines had in-store. The core range of wines each store carries is approximately 500 on top of which several other dozens of labels could be found depending on store size and other factors. The chance a consumer could notice one of our non-monetary promotions in-store was theoretically much lower than a respondent answering a DCE. However, the results show that a DCE can predict in-store choice quite well even without a perfectly comparable situation between in-store and on-line experiment. The actual level on in-store response is difficult to predict, but the order and effectiveness of each of the treatments was similar.
12
The authors have not yet modelled the differences of treatment effects across individual wines, and have not conducted significance tests to compare different treatment combinations in-store, on-line and between in-store and on-line. These limitations, however, constitute the main avenues of further research the authors would like to explore in the near future.
6 References
AAKER, D. A. 1991. Managing brand equity: capitalizing on the value of a brand name, New York, The Free Press.
ATKIN, T. & JOHNSON, R. 2010. Appellation as an indicator of quality. International Journal of Wine Business Research, 22, 42-61.
BARAT, S. & PASWAN, A. K. 2005. Do higher face-value coupons cost more than they are worth in increased sales? Journal of Product & Brand Management, 14, 379-386.
BLATTBERG, R. C. & NESLIN, S. A. 1990. Sales Promotion: Concepts, Methods and Strategies, Englewood Cliffs, Prentice-Hall.
CARDELLO, A. V. 2005. Terminology, reliability, validity, and subjectivity in the search for the "voice of the consumer". Food Quality and Preference, 16, 203-205.
CHAKRABORTY, G. & COLE, C. 1991. Coupon characteristics and brand choice. Psychology & Marketing, 8, 145-159.
CHANDON, P., MORWITZ, V. G. & REINARTZ, W. J. 2005. Do intentions really predict behavior? Self-generated validity effects in survey research. Journal of Marketing, 69, 1-14.
CHANDON, P., WANSINK, B. & LAURENT, G. 2000. A Benefit Congruency Framework of Sales Promotion Effectiveness. Journal of Marketing, 64, 65-81.
CHANG, J. B., LUSK, J. L. & NORWOOD, F. B. 2009. How Closely Do Hypothetical Surveys and Laboratory Experiments Predict Field Behavior? American Journal of Agricultural Economics, 91, 518-534.
CURRIM, I. S. 1981. Using Segmentation Approaches for Better Prediction and Understanding from Consumer Mode Choice Models. Journal of Marketing Research (JMR), 18, 301-309.
DARKE, P. R. & CHUNG, C. M. 2005. Effects of Pricing and Promotion on Consumer Perceptions: it depends on how you frame it. Journal of Retailing, 81, 35-47.
DODSON, J. A., TYBOUT, A. M. & STERNTHAL, B. 1978. Impact of deals and deal retraction on brand switching. Journal of Marketing Research, 15, 72-81.
DOOB, J., CARLSMITH, J., FREEDMAN, J., LANDAUER, T. & TOM, S. 1969. Effect of initial selling price on subsequent sales. Journal of Personality and Social Psychology, 11, 345-350.
EUROMONITOR INTERNATIONAL 2012. Wine – Australia. Available at: http://www.portal.euromonitor.com.ezlibproxy.unisa.edu.au/PORTAL/ResultsList.aspx.
13
GREWAL, D., MONROE, K. B. & KRISHNAN, R. 1998. The Effects of Price-Comparison Advertising on Buyers' Perceptions of Acquisition Value, Transaction Value, and Behavioral Intentions. The Journal of Marketing, 62, 46-59.
GRUNERT, K. G. 2003. Purchase and consumption: the interdisciplinary nature of analysing food choice. Food Quality and Preference, 14, 39-40.
GRUNERT, K. G., JUHL, H. J., ESBJERG, L., JENSEN, B. B., BECH-LARSEN, T., BRUNSØ, K. & MADSEN, C. Ø. 2009. Comparing methods for measuring consumer willingness to pay for a basic and an improved ready made soup product. Food Quality and Preference, 20, 607-619.
GUADAGNI, P. M. & LITTLE, J. D. C. 1983. A Logit Model of Brand Choice Calibrated on Scanner Data. Marketing Science, 2, 203-238.
HUANG, R. S. & DAWES, J. 2007. Price Promotions: How much volume is discounted that you would sell anyway at the normal price? Report 43 for Corporate Members. Ehrenberg-Bass Institute for Marketing Science.
JANSSEN, M. & HAMM, U. 2012. Product labelling in the market for organic food: Consumer preferences and willingness-to-pay for different organic certification logos. Food Quality and Preference, 25, 9-22.
JEDIDI, K., MELA, C. F. & GUPTA, S. 1999. Managing Advertising and Promotion for Long-Run Profitability. Marketing Science, 18, 1-22.
JONES, S., BARRIE, L. & ROBINSON, L. 2011. An investigation of the nature and effects of point-of-sale promotions for alcohol beverages.
KAHN, B. E. & LOUIE, T. A. 1990. Effects of retraction of price promotions on brand choice behavior for variety-seeking and last-purchase-loyal consumers. Journal of Marketing Research, 27, 279–289.
KELLER, K. L. 2002. Strategic Brand Management: Building, Measuring, and Management Brand Equity, 2nd Ed. Upper Saddle River: Prentice-Hall.
KUMAR, V., KARANDE, K. & REINARTZ, W. J. 1998. The impact of internal and external reference prices on brand choice: the moderating role of contextual variables. Journal of Retailing, 74, 401-426.
IBISWORLD 2012. The rise and rise of private labels. Available at http://www.ibisworld.com.au/about/media/pressrelease/release.aspx?id=292
LAURENT, G. 2000. Improving the external validity of marketing models: A plea for more qualitative input. International Journal of Research in Marketing, 17, 177-182.
LOCKSHIN, JARVIS, D'HAUTEVILLE & PERROUTY 2006. Using simulations from discrete choice experiments to measure consumer sensitivity to brand, region, price, and awards in wine choice. Food Quality and Preference, 17, 166-178.
LOCKSHIN, L. & CORSI, A. M. 2012. Consumer behaviour for wine 2.0: A review since 2003 and future directions. International Journal of Wine Economics and Policy, 1, 2-23.
14
LOUVIERE, J. & TIMMERMANS, H. J. L. S. 1992. Testing the external validity of hierarchical conjoint analysis models of recreational destination choice. Leisure Sciences, 14, 179-194.
LOUVIERE, J. J. 1988. Conjoint analysis modelling of stated preferences: A review of theory, methods, recent developments, and external validity. Journal of Transport Economics and Policy, 22, 93-119.
LUSK, J. L. & SCHROEDER, T. C. 2004. Are choice experiments incentive compatible? A test with quality differentiated beef steaks. American Journal of Agricultural Economics, 86, 467-482.
LYNCH, J. G. 1999. Theory and external validity. Journal of the Academy of Marketing Science, 27, 367-376.
MELA, C. F., GUPTA, S. & LEHMANN, D. R. 1997. The Long-Term Impact of Promotion and Advertising on Consumer Brand Choice. Journal of Marketing Research, 34, 248-261.
MUELLER-LOOSE, S. & LOCKSHIN, L. 2013. Testing the robustness of best worst scaling for cross-national segmentation with different numbers of choice sets. Journal of Food Quality and Preference, 27, 230-242.
MUELLER LOOSE, S. & REMAUD, H. 2011. Impact of corporate social responsibility claims on consumer food choice: A cross-cultural comparison, Ehrenberg-Bass Institute for Marketing Science.
MUELLER, S., LOCKSHIN, L. & LOUVIERE, J. 2010a. What your see may not be what you get: Asking consumers what matters may not reflect what they choose. Marketing Letters, 21, 335-350.
MUELLER, S., LOCKSHIN, L., LOUVIERE, J., FRANCIS, L. & OSIDACZ, P. 2009. How does shelf information influence consumers' wine choice? The Australian and New Zealand Wine Industry Journal, 24, 50-56.
MUELLER, S., OSIDACZ, P., FRANCIS, I. L. & LOCKSHIN, L. 2010b. Combining discrete choice and informed sensory testing in a two-stage process: Can it predict wine market share? Food Quality and Preference, 21, 741-754.
PALAZON, M. & DELGADO-BALLESTER, E. 2009. Effectiveness of price discounts and premium promotions. Psychology & Marketing, 26, 1108–1129.
PAULER, G. & DICK, A. 2006. Maximizing profit of a food retailing chain by targeting and promoting valuable customers using Loyalty Card and Scanner Data. European Journal of Operational Research, 174, 1260-1280.
PERROUTY, J. P., D'HAUTEVILLE, F. & LOCKSHIN, L. 2006. The influence of wine attributes on region of origin equity: an analysis of the moderating effect of consumer's perceived expertise. Agribusiness, 22, 323-341.
RAGHUBIR, P. & CORFMAN, K. 1999. When do price promotions affect pretrial brand attitudes? Journal of Marketing Research, 36, 211-222.
15
REMAUD, H., MUELLER, S., CHVYL, P. & LOCKSHIN, L. Do Australian wine consumers value organic wine? International Conference of the Academy of Wine Business Research, 17-19 July 2008 2008 Siena. 1-15.
ROYMORGAN 2006. Roy Morgan Single Source Alcholic Beverages Australia January - December 2006. Melbourne.
SINHA, I. & SMITH, M. F. 2000. Consumers' Perceptions of Promotional Framing of Price. Psychology & Marketing, 17, 257-275.
SORENSEN, H. 2009. Inside the Mind of the Shopper, Upper Saddle River, New Jersey, Pearson Education Inc.
THE AGE 2012. Wine boss fires parting shot at big two's retail 'mafia'. Available at http://www.smh.com.au/national/wine-boss-fires-parting-shot-at-big-twos-retail-mafia-20120602-1zouk.html
WINER, R. S. 1999. Experimentation in the 21st century: the importance of external validity. Journal of the Academy of Marketing Science, 27, 349-358.
WINE AUSTRALIA 2012. Homepage. Availble at http://www.wineaustralia.com/en/Splash%20screen.aspx
YI, Y. & YOO, J. 2011. The Long-Term Effects of Sales Promotions on Brand Attitude Across Monetary and Non-Monetary Promotions. Psychology & Marketing, 28, 879-896.