28
The Value Proposition of Age-Friendly Communities Summit Report September, 2015

The Value Proposition of Age-Friendly Communities
Summit ReportSeptember, 2015

2Value Proposition of Age-Friendly Communities Summit
Report Team
Scott Ball, Principal, Commons PlanningScott has been actively engaged in the promotion of the independent living and health of aging citizens, and has authored “Livable Communities For Aging Populations: Urban Design for Longevity”, the “Aging In Place Tool Kit” and “Lifelong Communities: A Regional Guide to Growth and Longevity” for the Atlanta Regional Commission, as well as co-authored the “Land-use and Public Health Toolkit” for the National Association of Local Boards of Health. Prior to his work with Commons, Scott served as Director of Post Award Asistance for Louisiana’s $11 billion Road Home recovery program and as Senior Project Manager with Duany Plater-Zyberk (DPZ) where he managed planning and zoning code projects throughout the nation. Mr. Ball has served on several boards and advisory committees including Association for Community Design, Atlanta Regional Heath Forum, Robert Wood Johnson Foundation’s Aging Atlanta Partnership, EPA’s Building Healthy Communities for Active Aging Initiative, NORC Coalition of Greater Atlanta, and the Georgia Fair Lending Coalition. Mr. Ball received a BA from Bowdoin College and M. Arch. From Yale University.
Matthew Lambert, Partner, Duany Plater-Zyberk Matt is an urban designer and planner on a broad range of project types, from multi-county regional plans, to new community and redevelopment plans and regulations, to affordable and modular housing design. He has managed projects throughout the U.S., and with communities in the Caribbean, Europe and the Middle East. He also leads DPZ’s information technology team. Lambert is active in the Congress for the New Urbanism; he is a founder of the CNU Next-Gen. As a member of the Transect Codes Council, he is contributing to the evolution of the Smart Code. He is also active in civic affairs in South Florida.
Joanna Lombard, University of MiamiProfessor Joanna Lombard co-teaches in the Ecosystem Science and Policy program and is an architect and Professor at the University of Miami School of Architecture. Her undergraduate degree is from Tulane University and her graduate degree is from Harvard University. At the University of Miami she teaches design in the core and option studios as well as courses on the theories of landscape and professional practice. She, Denis Hector, Fernando Miralles (CE and RSMAS) and Don Olson (RSMAS) collaborate on the undergraduate course, Architecture & the Environment. She is working with colleagues in the School of Architecture and College of Medicine on studies that examine the effects of the design of neighborhoods on the well-being of children and the elderly, funded respectively by the Robert Wood Johnson Foundation and the National Institute of Health.
Table of Contentsi. Introduction 4
ii. Background 5iii. Foundations 6iv. Value Propositions 13v. Next Steps and Opportunities 19
vi. Conclusion 24vii. End Notes 25
viii. Summit Attendees 27ix. Community AGEnda 29

4Value Proposition of Age-Friendly Communities Summit
Communities across the country are confronting a series of challenges created by the past six decades of urban development and the unprecedented advances in longevity during this same period
Urban growth has occurred in a manner that inhibits residents’ independence and ability to remain in their communities as they age. Increasingly, families and individuals find the quality of their lives compromised as the housing, transportation and community services that they have relied on can no longer accommodate their needs. Local healthcare systems, social service networks and local officials field increasing inquiries from older constituents stranded in their own homes and facing basic challenges surviving in their neighborhoods. At the same time, local budgets are tight and the concerns of elders compete amidst an array of issues that affect the quality and sustainability of community assets.
It has been stated many times that if a community can work for the young and the old, it will work for everyone
The purpose of this work is to measure the economics of this adage. What specific, quantifiable returns can be expected from designing communities to accommodate the increasing life expectancies of the modern age? If these benefits exceed the costs of age-friendly interventions, can their adoption and implementation begin to achieve change at the scale necessary to meet the needs?
Introduction

5Value Proposition of Age-Friendly Communities Summit
The World Health Organization, AARP, Grantmakers in Aging, the National Association of Area Agencies on Aging, the Administration for Community Living and other major organizations have developed frameworks, categorized the various types of age-friendly work underway, compiled extensive resources and crafted numerous technical assistance tools. Others have studied older adults living in environments not suited for aging, and have found higher medical costs, increasing rates of isolation and depression, unnecessary evictions, increased caregiver burdens and decreased economic productivity. But to date, efforts across the country have struggled to create age-friendly communities at a scale commensurate with the growing population—challenged both by a lack of sustainable financing and obstacles like “nimby-ism” that are not unique to age-friendly work but which, nonetheless inhibit community change.
Five communities, supported by the Grantmakers in Aging’s Community AGEnda initiative since 2012, Atlanta, Kansas City, Miami, Phoenix and the state of Indiana, came together to explore alternative metrics for age-friendly work. The Community AGEnda sites invited experts from a wide range of disciplines to join them for a worksession in Atlanta June 16-17, 2015 to review several draft concepts for assessing the value of work that is typically targeted by Age-Friendly initiatives. Age-Friendly interventions are designed to provide value to older adults. The value proposition work these communities embarked on together focused on the less understood collateral value of age-friendly work in an effort to grow implementation to a scale that matches the dimension of the need. Age-friendly interventions increase independence, and in doing so leverage and sustain the value older residents provide to their communities. The goal is
to establish the value of these interventions in the budgets and policies of a wide range of community operations.
Representing a range of disciplines and perspectives that include transportation, architecture, planning, local and regional government, housing, supportive services, economic development, and public health, professionals convened to discuss and develop several practical valuation methods that gauge and translate the value of age-friendly community into terms immediately relevant and consequential to the economic health of local governments.
Their initial work built on the research of Matthew Lambert, MArch of DPZ Partners, JoAnna Lombard, Phd of the University of Miami and Scott Ball, RA with Commons Planning and yielded remarkable results in a relatively short period of time. Like many such efforts, the group identified more questions than specific answers, but overall the entire team confirmed the initial premise that for age-friendly work to take hold and achieve scale it must do so through partnership with other like-minded movements, by aligning with critical local concerns which may or may not be framed as an issue for older adults, and that in the present resource restricted era, interventions should be structured to curb or reduce future expenses.
The work begins by understanding age-friendly communities not just from the value they provide to older people and the families that care for them, but by the value age-friendly communities provide to everyone else and most importantly the cost-effectiveness and the value add of designing communities that work for the young, the old and everyone in between.
Background

6Value Proposition of Age-Friendly Communities Summit
Age-Friendly communities are places that can support people throughout their lifetimes while growing the economy
They are neighborhoods, cities and towns where individuals can live healthy, engaged, high quality lives no matter their age or their abilities. By definition they are also places with a diverse age-structure. They are made up of people who access local services and utilize community facilities at different times on different days. Age-Friendly communities have households in different phases of development and growth and who impact local systems like school districts and roadway infrastructure in different and complementary ways. They are made up of individuals and families that need options for shopping, for transportation, for work and for play.
Understanding age-friendly communities as more than good places to grow old but also as economic engines, strong contributors to local tax base, more efficient users of infrastructure investments and critical components to curbing healthcare, transportation and other high cost drivers for employers, local governments and local agencies is the first step to developing an effective value proposition. Creating a good place to grow old
has not been a goal or priority of most of the key decisionmakers that shape local communities. But growing the tax base, developing efficient infrastructure, managing community amenities and neighborhood based economic development has been. Understanding how age-friendly communities achieve these goals is the first step in developing the value proposition.
Recent studies in Atlanta, Phoenix and Kansas City had demonstrated that older adults are critical contributors to a region’s economy . As a group their personal income and discretionary spending far exceed the personal income and spending of any other cohort. Their contributions to the labor force are so significant that in Atlanta alone, if labor force participation doesn’t increase over the coming years, overall labor force participation will shrink by almost 7%. While clearly every older adult does not have an above average personal income and some have no discretionary spending at all, these three studies revealed that as a group, they are a significant part of regional economic engines and yet in most communities are overlooked in local economic development strategies.
Foundations
Foundation 1: Re-Framing Age-Friendly Communities as Economic Drivers
In order to build value propositions, it was established that three major relationships had to be assumed- the role of older adults in driving the economy, the relationship between urban form and health and the value of interventions can be captured across sector and savings can re-invested to create sustainable, and scalable funding.

7Value Proposition of Age-Friendly Communities Summit
While the Age-Friendly communities’ movement has begun to effectively communicate the complexity and inter-connectedness of many aspects of daily life, it has not effectively communicated or managed the stresses between the institutional structures that support it
While it may make immediate sense that access to fresh, healthy food has an effect on the health of the local residents, the institutions charged with maintaining public health have significant methodological and cultural differences from the institutions charged with regulating commerce and the built environment. The health need does not easily translate into an urban planning response. The barriers are not just the compartmentalization of institutional systems, they are often cultural as well. For instance, health professionals usually gravitate toward the immediate, documented needs of current constituents, while urban planners focus on the projected, speculative needs of future constituents. This difference is a predicable result of the timelines within which the two professions work: health within individual lifetimes, planning working across multiple generations. However predictable, it is not uncommon for stresses to develop between these two professional disciplines: for health professionals to dismiss planners’ speculative future, while planners critique health’s reactionary response to current, individual symptoms rather than tackling larger root causes.
The Age-Friendly movement has primarily been driven by health professionals who understand the important influence the environment has on individual well-being. The success of the age friendly movement cannot be dependent on health professionals integrating into every urban planning process, nor on urban planners
becoming health professionals. Even coordinating committees between entities can be hard to sustain with in the stretched budgets and staff constrains that most agencies experience. However, enabling Age-Friendly communities requires first reviewing the critical points of intersection that have been fully established between the built environment and health outcomes.
Fundamental to Age-Friendly goals and domains is the acknowledgment of the complexity, inter-connectedness, and diversity of daily life. The unifying goal focuses on the enhancement of health and well-being. Decades of research have shown that across cultures and ages, health and well-being is associated with positive levels of social interaction, physical activity and fresh food. Communities in the U.S. before World War II typically provided access to this triad. Most people walked either to work or, as the streetcar suburb moniker implies, to transit. Physical activity and social interaction were integrated into daily life. The supermarket had not yet taken hold and most meals were based on fresh produce from the local green grocer, if not the backyard garden. By the end of the 1960s, however, a revolution in urban planning now known as sprawl shattered the health triad.
At the individual scale, once most daily movement occurred within the confines of a single car, daily physical activity was limited to the walk from a parked car to a nearby building. The constriction of social interaction quickly followed, and the supermarket and shopping mall established a new food relationship as the family car ferried packaged food to freezers and microwaves. At the societal scale, the migration from urban neighborhoods to suburbia magnified these impacts, which expanded to new generations through the baby boom of the 1950s and 60s.
FoundationsFoundation 2: Strength in Numbers: Connecting Aging, Health and Urban Design
8Value Proposition of Age-Friendly Communities Summit
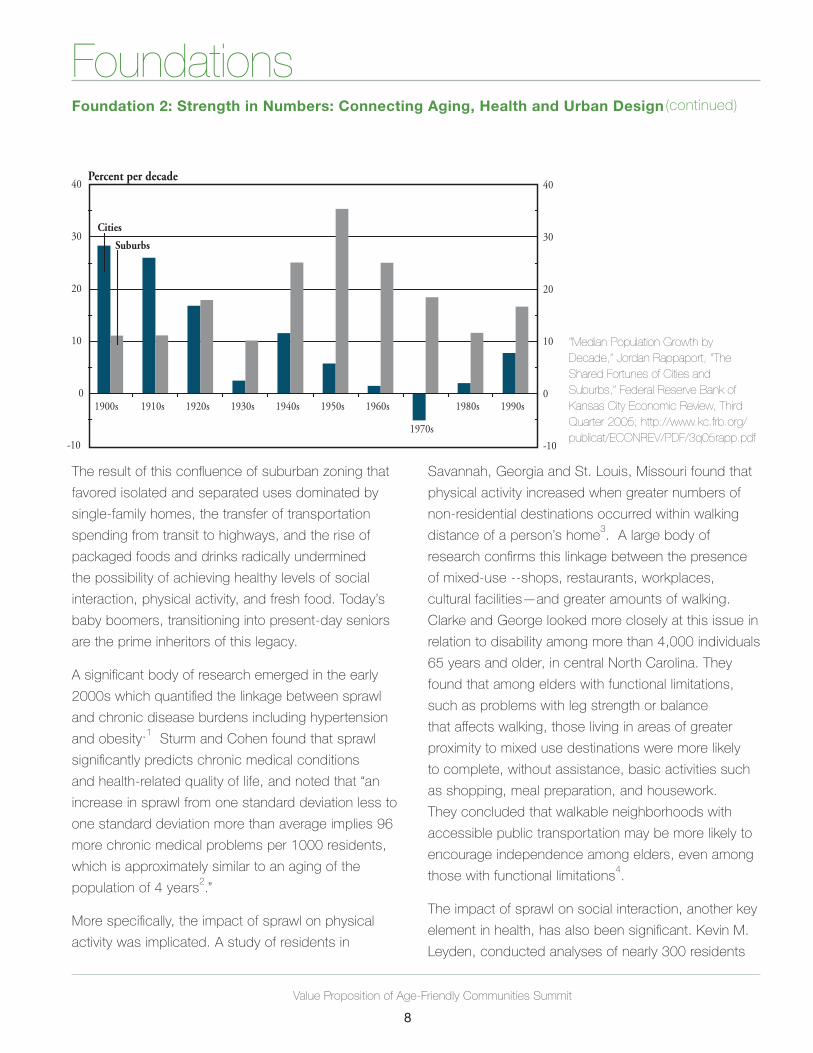
The result of this confluence of suburban zoning that favored isolated and separated uses dominated by single-family homes, the transfer of transportation spending from transit to highways, and the rise of packaged foods and drinks radically undermined the possibility of achieving healthy levels of social interaction, physical activity, and fresh food. Today’s baby boomers, transitioning into present-day seniors are the prime inheritors of this legacy.
A significant body of research emerged in the early 2000s which quantified the linkage between sprawl and chronic disease burdens including hypertension and obesity.1 Sturm and Cohen found that sprawl significantly predicts chronic medical conditions and health-related quality of life, and noted that “an increase in sprawl from one standard deviation less to one standard deviation more than average implies 96 more chronic medical problems per 1000 residents, which is approximately similar to an aging of the population of 4 years2.”
More specifically, the impact of sprawl on physical activity was implicated. A study of residents in
Savannah, Georgia and St. Louis, Missouri found that physical activity increased when greater numbers of non-residential destinations occurred within walking distance of a person’s home3. A large body of research confirms this linkage between the presence of mixed-use --shops, restaurants, workplaces, cultural facilities—and greater amounts of walking. Clarke and George looked more closely at this issue in relation to disability among more than 4,000 individuals 65 years and older, in central North Carolina. They found that among elders with functional limitations, such as problems with leg strength or balance that affects walking, those living in areas of greater proximity to mixed use destinations were more likely to complete, without assistance, basic activities such as shopping, meal preparation, and housework. They concluded that walkable neighborhoods with accessible public transportation may be more likely to encourage independence among elders, even among those with functional limitations4.
The impact of sprawl on social interaction, another key element in health, has also been significant. Kevin M. Leyden, conducted analyses of nearly 300 residents
FoundationsFoundation 2: Strength in Numbers: Connecting Aging, Health and Urban Design (continued)
36 FEDERAL RESERVE BANK OF KANSAS CITY
The automobile made possible this relative shift of population fromcities to suburbs. Before the automobile, people had to live withinwalking distance of their workplace, or else within walking distance of acommuter rail or streetcar line within walking distance of their work-place. Similarly, they needed to live close to local schools, doctors,merchants, as well as friends and family. Densely settled cities solvedthis locational need. Radiating from such cities, modestly sized villagesclustered around the stations of commuter rail lines.
The automobile relaxed these constraints. Suddenly, it became pos-sible to live considerably farther from work. So, people began migratingoutward from large cities, drawn by much lower housing prices. Settle-ment patterns within suburban neighborhoods were considerably moregeographically dispersed than in cities, since it was now possible to driveto local sources of commerce and social interaction.
At first, the paucity of highways connecting suburbs to citiessharply limited this outward expansion. By the early 1930s, suburbancommuters were already confronting daily traffic jams (Caro). A 1946article in Fortune complained,
Everyone who drives into New York City knows what to expect. Morning andafternoon, cars from New Jersey, Westchester, and Long Island choke up some$325 million worth of six-lane parkways and expressways that have been hailed as the world’s finest…The struggle against too much traffic is very much thesame in every other big U.S. city today.
Chart 2MEDIAN POPULATION GROWTH BY DECADE
-10
0
10
20
30
40
1900s 1910s 1920s 1930s 1940s 1950s 1960s
1970s
1980s 1990s
-10
0
10
20
30
40
Cities
Suburbs
Percent per decade
Sources: U.S. Census Bureau, various years; author’s calculations
“Median Population Growth by Decade,” Jordan Rappaport, “The Shared Fortunes of Cities and Suburbs,” Federal Reserve Bank of Kansas City Economic Review, Third Quarter 2005; http://www.kc.frb.org/publicat/ECONREV/PDF/3q05rapp.pdf

9Value Proposition of Age-Friendly Communities Summit
in Galway, Ireland in neighborhoods that ranged from the city center, outward to older first-ring, and beyond to newer, car-dependent suburbs. Leyden determined that higher numbers of walkable destinations near homes related to greater social connectedness. Residents living closer to mixed use destinations were more likely to know their neighbors, participate politically, and report greater trust in others5.
The health impacts of social interaction are also significant. After conducting a thorough reviewing of the extensive body of work in this area, James House et al. concluded “that social relationships, or the relative lack thereof- constitute a major risk factor for health,” and pointed out the irony that “just as we discover the importance of social relationships for health, and see an increasing need for them, their prevalence and availability may be declining6.” More recently, studies have examined the relationship between social interaction and specific diseases,
including a recent review of the literature on the impact of “social network, physical leisure, and non-physical activity on cognition and dementia,” found that “an active and socially integrated lifestyle in late life protects against dementia and AD” [Alzheimer’s Disease]7.
Fresh food is the third element of the health triad and its paucity in the daily diet has been a focus of numerous initiatives, most recently, the CDC’s Healthy Eating for a Healthy Weight program8. The Rhode Island Department of Health and the Environmental Justice League of Rhode Island adapted a Johns Hopkins model to create the Healthy Corner Store initiative to introduce more fresh food and healthy snacks to underserved neighborhoods9. In Colorado, Denver Urban Gardens supports “residents in creating sustainable, food-producing neighborhood community gardens.”10 These initiatives address the issues of fresh food, as well as providing social interaction,
Foundations
“Cumulative Government Capital Investment in Transit & Highways since 1956,” U.S. Congressional Budget Office. Trends in Public Spending on Transportation and Water Infrastructure, 1956 to 2004, August 2007, www.cbo.gov/ftpdocs/85xx/doc8517/SupplementalTables.xls
Foundation 2: Strength in Numbers: Connecting Aging, Health and Urban Design (continued)

10Value Proposition of Age-Friendly Communities Summit
and have been shown to enhance social capital, the sense of connectedness in community11. While essential to the sustenance of life, the potential for fresh food via community gardens also addresses the important benefits of access to green. Studies show that proximity to parks increases the likelihood of walking12, the reduction of crime in relation to the presence of trees13, and benefits of access to nature in the process of healing and well-being14, as well as the capacity to ruminate and reflect15.
As researchers were investigating the wide-ranging impacts of sprawl, designers had already begun to advocate a more integrated approach to urban design. The Congress for the New Urbanism (CNU), Smart Growth, and LEED for Neighborhood Development (LEED ND) all advanced strategies for reinfusing mixed use destinations into sprawl conditions. Projects for Public Spaces (PPS) addressed the lack of public spaces and presses for diverse public spaces that provide for all age-ranges. More recently, the Complete Streets movement has focused on the importance of mobility for pedestrians and cyclists, as well as cars and transit. This broadly-based engagement has produced a more inclusive form of urban design that spans across the scale of interventions, from revisions of municipal codes to the design of streetscapes, sidewalks and building frontages in new development, as well in existing communities. Throughout the two decades of this work, advocacy groups have developed and refined specific tools to address sprawl repair and provide new urban design strategies to support healthy communities.
Returning to the five goals of an Age-Friendly Community, it is evident that urban design strategies that provide for the health triad of physical activity, social interaction and fresh food are also embedded in the goals of the Congress for the New Urbanism (CNU) to build “places people love15,” of Smart Growth America to make “communities work for everyone17,” and LEED ND “to inspire and help create better, more sustainable, well-connected neighborhoods18.” Walkable, mixed-use communities provide streets and blocks that are organized and sized for connectivity and navigability with a density of buildings that enable access to transit, and a diversity of housing types which enables affordability. The details that support these urban design strategies include ample sidewalks, street trees, and access to parks and community gardens. Corner stores and farmer’s markets provide access to fresh food, and throughout this mix of activities, places and accessibility is threaded the social interaction that addresses, “the wide range of capacities and resources among older people,” providing a coordinated social and physical infrastructure that can “anticipate and respond flexibly to ageing-related needs and preferences;” “respect older people’s decisions and lifestyle choices;” “protect those who are most vulnerable;” and “promote older people’s inclusion in and contribution to all areas of community life.” With these points of intersection between urban design and health outcomes, a next step is to identify the most effective opportunities for inter-agency endeavor.
FoundationsFoundation 2: Strength in Numbers: connecting Aging, Health and Urban Design (continued)

11Value Proposition of Age-Friendly Communities Summit
Capture and reinvest provides a means to coordinate independent departments and professional disciplines without requiring a great deal of integration
Capture and reinvest allows independent players in the built environment and health systems to continue in the specialized roles they do best, using performance contractual arrangements to bridge their efforts towards the interdisciplinary goal. Capture and reinvest is a method for quantifying the costs and benefits of an intervention in a way that structures ongoing funding from the savings achieved. It can be used when the costs and benefits occur within the same budget, or service sector but more importantly is extremely useful in understanding potential future financing opportunities when the expenses are incurred by one entity and the benefits accrue to another. Capture and reinvest is the basic premise of a number of new tools being implemented across the country and around the world, including social impact bonds and performance contracts.
Capture and reinvest is first and foremost a way of understanding the flow of funds and the accrual of benefits. It allows users to identify all the entities involved in a change process including those who invest dollars, those necessary for delivering an intervention successfully (in a way that achieves specific results) and those who receive the benefits. There are multiple types of benefits that can be considered in a capture and reinvest model including those that accrue to individuals, to larger communities or entities. The model also identifies when and how the benefits achieve cost savings. In the case of social impact bonds and performance based contracts these are quantified into the specific terms of the funding investment.
Recent uses of the capture and reinvest model include aligning the benefits that evidence-based prevention programs provide to the overall healthcare delivery system with the savings they create for more sustainable financing of prevention work .
The capture and reinvest model is a critical tool for understanding the value age-friendly community interventions provide and identifying potential sources for ongoing support. Age friendliness can only occur when coordination is achieved between numerous government agencies and private sector investors responsible for the built and service environments. Capture and reinvestment provides the systemic basis for better aligning these players and ensuring that optimal coordination is achieved between independent actors.
Almost all age-friendly community work requires investment from one area but creates benefit in another. For example, modifying the built environment to enhance a community’s walkability will improve the physical and mental health of older people who are now able to live more active lifestyles. But the budget for sidewalk, crosswalk, streetscape improvements is not in a health budget, it is more likely in the Public Works or Transportation Departments’ budgets. The capture and reinvest model aligns the costs associated with the improvements, quantifies the health benefits to not only the individuals but the savings achieved by the entities that would have had to pay the costs of higher health expenses on behalf of the less mobile older adults. Those who experience the savings (in this example health plans, insurers, state benefit plans, Medicaid and Medicare) are a potential source of revenue to expand the initial enhancements, broadening walkability and active living for an even larger older population.
FoundationsFoundation 3: Identifying Value to Fund Community Change: Capture and Reinvest

12Value Proposition of Age-Friendly Communities Summit
This same relationship between an investment made by one sector and benefits realized in another exists between transportation services to older non-drivers and the subsequent access to healthcare when older adults can get a ride to the doctor; between the availability of supportive, affordable housing or affordable in-home services and the savings realized when older individuals defer or avoid all together expensive nursing home stays; access to affordable prescription drugs and the ability to make rent or mortgage payments, keep the utility bills up to date.
Capture and reinvest models can identify the benefits of an intervention far beyond the benefits they provide to older adults, the potential investors
in the intervention and the outcomes/savings they need to achieve to sustain funding. As a next step in the now dominant logic model, the capture ad reinvest model forms the cornerstone for each of the value propositions considered below. In Value Propositions 1 and 2, the future value generated by the investment drives the age-friendly intervention. In Value Proposition 3, the value generated in savings or reduced future expenses is re-invested in the age-friendly intervention.
Across all 3 categories of value propositions, the capture and reinvest model can and should be built before embarking on any age-friendly initiative that intends to sustain itself beyond an initial investment.
FoundationsFoundation 3: Identifying Value to Fund Community Change: Capture and Reinvest (continued)
Capture & Reinvest
Seed Funding
Return on Initial Seed Investment
Evidence-Based Prevention Program
Crisis Intervention or Treatment
Program Reduced need for
$ Savings Used to Sustain Prevention Program
Capture
Rei
nves
t

13Value Proposition of Age-Friendly Communities Summit
Age-friendly community initiatives profit communities by implementing a wide variety of programs that help keep people productive and engaged in their neighborhoods
These vary and can include zoning changes to integrate denser, more walkable and supportive housing into existing neighborhoods, home repair and modification programs, in-home services and supports, friendly visitor programs.
The built environment goals of the compact, walkable program focus on comfortable walking distances of quarter- to half-miles, known as pedestrian sheds, are basic building blocks of compact design strategy. The best examples of Age-Friendly communities are structured on pedestrian sheds that gather residents within walking distances of many daily needs, including transit. Other daily needs that are ideally balanced and mixed within the five-minute walking distance are shopping, work, school, recreation, and dwellings of all types.
A compact, walkable community contains a mix of housing types: apartments, town homes, and single-family homes in a range of settings- urban to rural. The community will also foster a good mix of commercial and civic enterprises, recreation, and pedestrian activity all within a quarter mile radius. Shops that are a short walk from homes meet daily needs. The pedestrian-oriented streets and strategically positioned community spaces support opportunities for social engagement.
A significant body of research already exists that demonstrates the economic performance of compact, walkable communities, and the findings from this research can in many cases be directly
applied to the Age-Friendly framework as well. Findings include that compact walkable communities:
• Are infrastructure efficient and requires less expense per dollar of tax base to provide roads, water, sewer, and other infrastructure when compared to sprawling, segregated use development19.
• Consistently increase property values by more than 15 percent for office, residential and retail use20.
• Better garners public support for more intense land use, which in turn results in a more robust tax base.21
• Increase business activity because people patronize retail establishments beyond the typical “9 to 5” day, thereby creating a 24 hour economy.22
• Create market demand for office and retail development while attracting investment, jobs, and the most sought-after employees.23
The key issue for age-friendly community initiatives is to build the platform for changes to the built environment based on the proven increases they have to the local tax base. Local governments are responsible for the decisions big and small that make great places. But the vast majority of local governments are not responsible for health. Instead they are responsible for maintaining and expanding the local tax base. Viable age-friendly strategies need to address tax base if they want to influence the decision making of local governments.
Value PropositionsValue Proposition 1: Age-Friendly Communities Grow the Local Tax Base

14Value Proposition of Age-Friendly Communities Summit
Value PropositionsValue Propsition 1: Age-Friendly Communities Grow the Local Tax Base (continued)
Mapping The Ratio of Tax Base to Infrastructure
Roadways contain the vast majority of municipal infrastructure. In addition to the roadway itself, they also are corridors for water, sewer and other utilities. This is an initial graphic to give a sense of the ratio of tax base to roadway by block group. The formula is: (City’s milage rate * the total AppValue in the block group) minus (number of owner occupied households * Homestead Exemption Amount * .City’s Milage Rate) minus (number of lane miles in the block group)
Area that is relatively revenue productive
Area that is relatively revenue negative
Case Example- Atlanta, GA

15Value Proposition of Age-Friendly Communities Summit
Age-Friendly Communities advocate for policies and programs that help older adults age-in-community rather than live in institutions.
These policies and programs are almost always argued for based on their reduced costs when compared to institutional care. This is important when arguing for increased Medicaid support for home and community based services, because the budget for Medicaid institutional care is set in the same budget as the allocations for Medicaid home and community based care. But aging-in-community requires more than home and community based support services, it requires zoning to allow different housing types within the same neighborhood, amenities that meet the needs of people of all ages, investments in community and senior centers that keep individuals active and engaged, assistance with home repair and home modifications, bus shelters, park benches, adequate signage and way finding. These and other qualities of an age-friendly community exist or do not exist as the result of the decisions of local governments, neighborhood organizations and other community development agencies, not Medicaid or any other payer of long term institutional care.
This Value Proposition seeks to quantify the impact on physical infrastructure and community facilities by a community with people of many different ages versus a community with a relatively homogeneous age structure. A number of existing examples suggest that when everyone in a community does not travel to the same place at the same time, traffic congestion is lower, creating a more even use of the transportation infrastructure investments. Some examples include: most major metro areas, traffic is reduced in the summer time when not everyone is traveling to work on
the same days at the same time; traffic is also reduced during a recession as all the members of the community are also not going to work at the same time. While a permanent summer might be an attractive public policy, and an extended recession a rather unattractive one- age-diverse communities may in fact utilize community infrastructure effectively in much the same way.
When people of different ages, in a different phases of their lives share a community, it means that not all families will be sending children to school in the same years, reducing sporadic surges in enrollment and the need for temporary classrooms. When not everyone has to be downtown to the office at 8am, the early risers can get their coffee at 7am, while those who no longer punch the clock might stop by for a latte closer to 9:30 or 10am. Neighborhood based restaurants will have a lunch crowd on the weekdays if not everyone is traveling outside the neighborhood to work and instead get their daily errands done, exercise and visit with friends close to home. These same restaurants are not only available to feed the commuters at night and on the weekend, their economic model can span 7 days a week rather than just Friday through Sunday.
There is considerable more work to be done to quantify the impacts of an age-diverse community on the usage, life, maintenance needs and costs of community services and infrastructure, but existing tools that are already used to measure the time cycles of residential and commercial development and the accompanying transportation infrastructure suggest that neighborhoods that can attract and support people of all ages, in all different parts of the life course can make more efficient use of their shared investments.
Value PropositionsValue Proposition 2: Age-Diverse Communities Use Infrastructure More Efficiently
16Value Proposition of Age-Friendly Communities Summit
Value Propositions(continued)
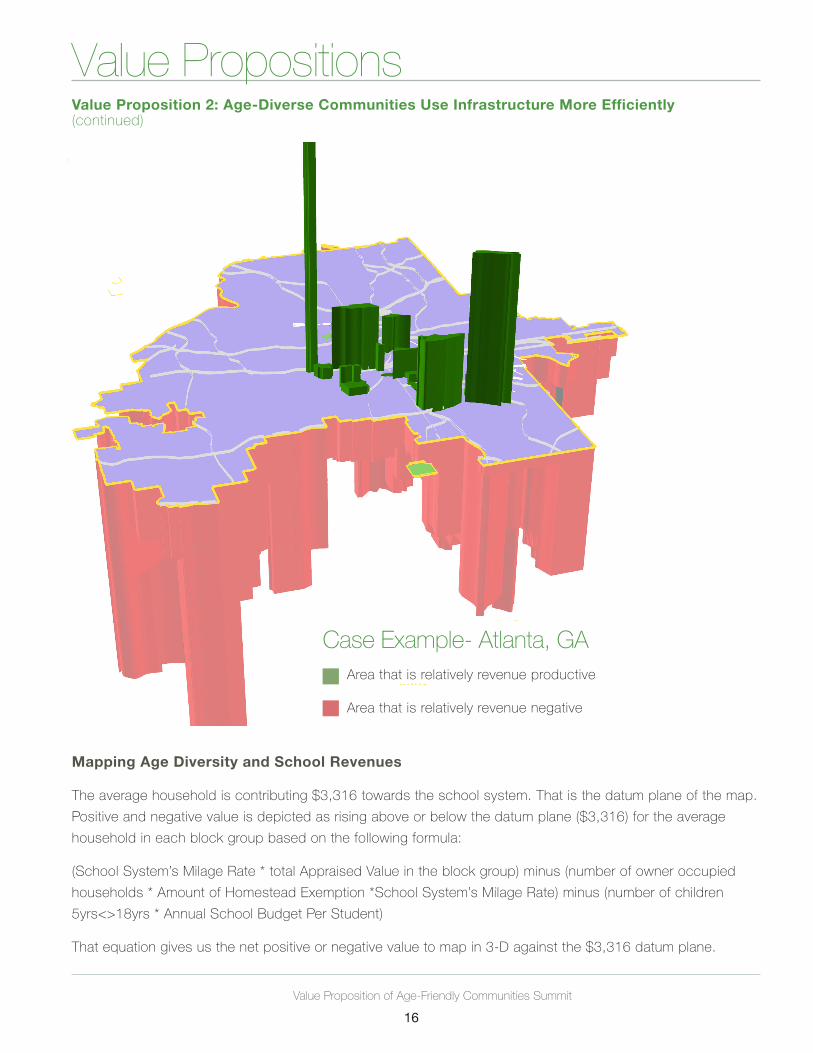
Area that is relatively revenue productive
Area that is relatively revenue negative
Mapping Age Diversity and School Revenues
The average household is contributing $3,316 towards the school system. That is the datum plane of the map. Positive and negative value is depicted as rising above or below the datum plane ($3,316) for the average household in each block group based on the following formula:
(School System’s Milage Rate * total Appraised Value in the block group) minus (number of owner occupied households * Amount of Homestead Exemption *School System’s Milage Rate) minus (number of children 5yrs<>18yrs * Annual School Budget Per Student)
That equation gives us the net positive or negative value to map in 3-D against the $3,316 datum plane.
Value Proposition 2: Age-Diverse Communities Use Infrastructure More Efficiently
Case Example- Atlanta, GA

17Value Proposition of Age-Friendly Communities Summit
The cost savings of prevention measures or the diversion from a high cost service to a lower cost service is already well understood within the health sector, even if policies and payments don’t always follow But the cost effectiveness of prevention or diversion efforts struggle to take hold in other sectors
This has begun to change as around the world, communities are experimenting with social impact bonds and performance contracts for human and community services- both of which identify future cost savings achieved through specific interventions with designated populations. The same opportunities exist to fund the options that individuals need to live in a community throughout their lifetimes, when interventions can successfully divert individuals from using more expensive services or prevent them from needing services at all. Transportation a critical element of age-friendly initiatives everywhere, offers opportunity to utilize savings created through prevention or diversion to expand available options.
Transportation continues to be the greatest unmet need of older adults in communities across the country. When individuals stop driving they lose their independence and become wholly reliant on family and friends for every essential trip, often foregoing altogether trips to see friends, the movies, take a class or see a play. Too often when faced with no options individuals experience increased isolation, deteriorating health conditions and are unable to access basic needs. With the rise in chronic conditions requiring regular treatments or monitoring, the need for regular and frequent trips is on the rise. As a result, providing an increased range of transportation options for non-drivers is
the cornerstone of most age-friendly community strategies. These include but are not limited to enhancing access to fixed route transit, increasing demand response services, volunteer driver programs, travel training and voucher programs, creating websites to help individuals and families navigate their options, as well as streamlining eligibility, scheduling and routing of local human service programs.
Mobility is enhanced when pedestrian and transit orientations are thought of as interrelated subjects—both parts of a continuous mobility network. When regional transit stops are supplemented with local circulators and safe biking paths, and sidewalks pedestrians can come to a neighborhood center, circulate among other neighborhood centers by local transit or bike, and connect into regional commuter transit without ever needing an automobile. The more that the path from home to circulator, to regional transit is seamless, the more resident mobility is maximized.
These options don’t just enhance individual mobility, research has shown they also provide economic benefits and development opportunities to local communities:
• Investments in public transportation increase livability while speeding economic growth and larger productivity gains.
• Investments in public transportation foster economic development and business recruitment.
• Rail transportation enhances real estate values.
• Nationwide, for every billion dollars invested in public transportation annual returns are:
Value PropositionsValue Proposition 3: Age-Friendly Options Can Reduce Future Costs

18Value Proposition of Age-Friendly Communities Summit
o 36,000 jobs are created, supporting $1.6 billion in labor income.
o $3.6 billion in business sales are generated, that spins off $490 million in tax revenue.
o $1.8 billion is added to the GDP.
While a comprehensive mobility network is beneficial to people of all ages and abilities and to the economy, the ability to grow this network and expand services just as demand is increasing is severely limited. Transit systems across the country struggle to maintain existing infrastructure and to try and expand with fewer and fewer resources. With basic maintenance and operation costs rising, improvements to bus stops, sidewalks surrounding stops and stations, signage and technology to know when service is en route or has been delayed can quickly become lower priorities. Transit expansion can also be inhibited by the growing expense of the required paratransit services that must accompany any new fixed route. In particular, paratransit systems are experiencing record demand with exponentially rising costs. A 2012 GAO report cited an average one-way trip cost of $29.30 in 2010 . In major metro areas like Atlanta, GA average one-way trips can cost over $43/trip.
Age-friendly initiatives can increase the opportunities to expand local options for older and disabled
individuals when they quantify the benefits of these services not just to the people served, but to the transit system as a whole. A recent profile of the changing needs and issues surrounding ADA Paratransit in Washington, DC demonstrated how the transit system was training individuals to utilize the mainstream transit system and allowing them to ride at no cost. With paratransit trips in DC rising above $50/trip, the savings was estimated at over $25 million .
Though public transit is not appropriate for everyone and the need for ADA paratransit still exists. Ride Connection in Portland, Oregon is known as one of the most progressive and comprehensive programs that is designed to complement the ADA paratransit system. Wherever possible it diverts riders from the traditional ADA system to a wide range of options including volunteer driver programs, neighbourhood based shuttles, demand response and when needed, taxis. Ride Connection is under contract with Tri-Met the metro transit agency to both provide these services and to train individuals how to us the traditional system. By providing value not just to individuals and their families, but also structuring a revenue relationship based on the value provided to the transit system, they have been successful in growing and sustaining a wide range of transportation options for people of all ages and abilities .
Value PropositionsValue Proposition 3: Age-Friendly Options Can Reduce Future Costs(continued)

19Value Proposition of Age-Friendly Communities Summit
Three major ideas for how Age-Friendly work can be valued and measured across sectors—particularly sectors that don’t have the wellbeing of older adults as a stated goal or funding priority have been articulated here. This initial work is a significant step toward reorienting age-friendly work to align with the major systems that shape community infrastructure and services, but as with any first effort, it has discovered much, but also identified core areas for work moving ahead. The following three areas could particularly benefit from immediate focus and investment.
Next Steps and Opportunities
Tools to Define the Geography of Place
Economic impact and other value assessments that are important to implementation of Age-Friendly principles are evaluated within geographic contexts. The geographic contexts typically used in economic impact modeling work against Age-Friendly goals either because they are too small or too large. Economic impacts are most often studied as the effect of a singular development across a 5 to 15 mile market area. This focus on how individual interventions that are usually much smaller than an neighborhood impact a region that is much larger than a neighborhood result in conclusions that mask the kinds of fine-grained interactions within a neighborhood between public spaces, housing types, retail, and transportation that are essential to Age-Friendliness.
The value Age-Friendly principles can only be accurately assessed when they are understood at the scale of neighborhoods where the mix of uses, of housing types, of retail and transportation options relates to the completeness of the community. Defining the places of Age-Friendliness in a consistent geographical manner will reveal not only reveal value, but it will quantify that value in a manner that allows it to be aligned with similar efforts from other disciplines. All health, urban, and economic development planning is organized in geographic districts, areas of impact, or delineated market
sheds. Age-Friendly initiatives have not defined the desirable asset class sufficiently in geographic terms to integrate into the myriad of professions and constituencies that must be mobilized for any built environment project or policy. A geographic framework for Age-Friendly communities will allow the movement to capitalize on policy windows in federal and state law and regulation, and to cross-walk Age-Friendly issues to those of other constituency groups.
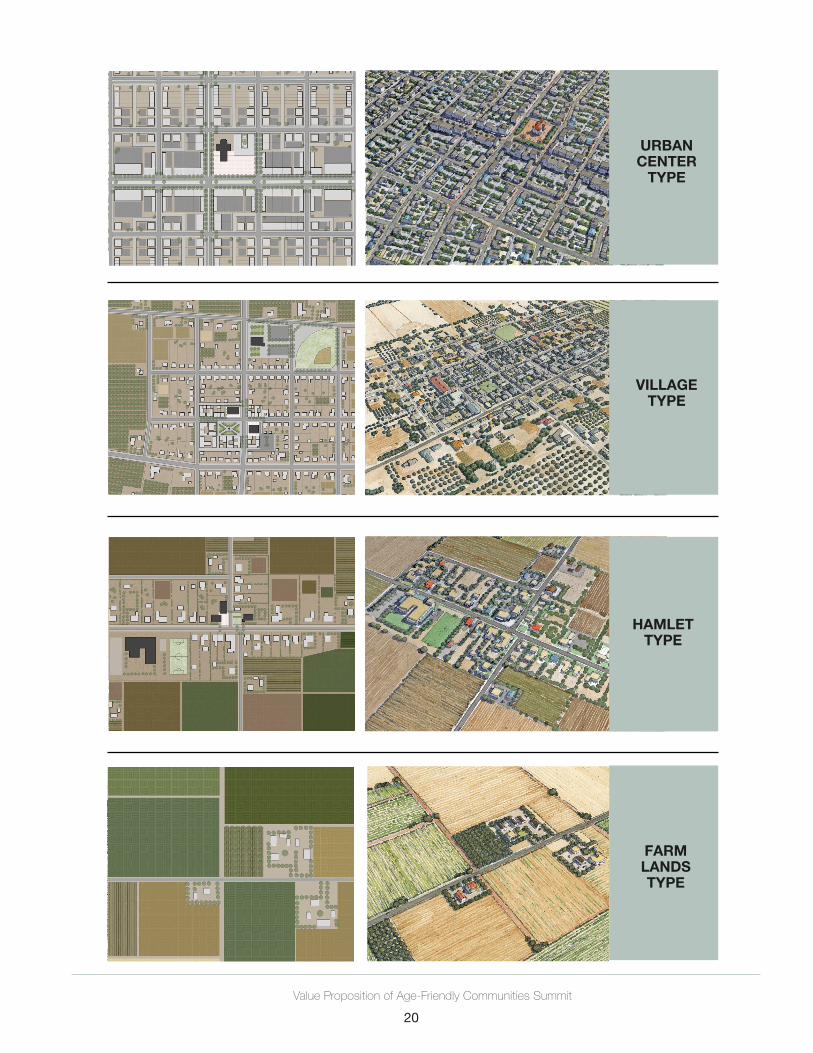
The Age-Friendly movement can take a lead role in developing, marketing, and implementing a national Place Type Framework that provides a comparative basis for understanding and evaluating livability and age friendliness concerns in specific places consistently across a wide range of local urban contexts. The places in which livability and age friendliness occur can not be adequately represented in planning activities until they are delineated in a way that is consistent and allows comparative evaluation.
Not every older adult in the nation is going to move to the inner city- most will not. Interventions and evaluation metrics must inform policy and improve conditions in a range of urban contexts if needs are going to be addressed at sufficient scale. By identifying, naming, and delineating the urban fabric by place types, the place type framework will allow
20Value Proposition of Age-Friendly Communities Summit
40
The rich Mesilla Valley has historically been successful farmland. Farming has great diversity in the County and ranges from fields to orchards to dairies and chicken farms. The development of the farmland is usually a house with farm buildings like barns, sheds, and occasionally bunkhouses. There is occasionally some industrial support services like packing houses for pecans and processing facilities for chile.
FarmsAgricultural fields, orchards, farms and related housing and warehousing.
36
Small Villages are notably different in intensity and form than Villages. They tend to occur in the northern part of the County and are a much smaller scale than Villages.
Small Villages are also agrarian settlements and are usually a crossroads community in a farming environment. The classic example of a regional Small Village is Garfield.
Small Villages exist largely to support the surrounding farming industry and provide services to the more rural residents. There maybe a school, but other non-residential uses are usually tied directly to the needs of the farming community. Housing is dominantly single family homes.
Small Villages may provide some basic needs to the local residents, but most needs still require car trips to larger towns and cities.
Small VillagesSmall assemblages of rural housing and small scaled services, supporting farms and the rural population.
34
There are many successful Villages in the region, and most were established under Spanish colonial planning practices. Many of the historic town sites have blocks dedicated for plazas near the center of the village.
Villages are historically agrarian settlements and are usually located in proximity to the Rio Grande, giving access to irrigation. Samples of regional Villages include La Union, La Mesa, Doña Ana, Salem, and many of the County’s historic colonias.
Housing diversity is very limited in Villages, however there are examples of small apartments and duplexes, to augment
the lower density of single family homes. Villages maintain a strong connection to the surrounding farmland and provide services to the more rural residents. There maybe a school, a church, a general mercantile, some small scale neighborhood services, a cafe and industrial uses in support of the farming economy.
VillagesIntegral to the agrarian landscape, Villages organize a variety of commercial, service, civic, and manufacturing uses.
PT29Place Types
TransportationChoice
CommunityAffordability
EconomicOpportunity
PreservingHeritage
Policy &Investment
Communities &Neighborhoods
City Centers
Residential Density
North Central South
Walkability
Access to Jobs
Cost of Transportation
Cost of Housing
PT
35Place Types
TransportationChoice
CommunityAffordability
EconomicOpportunity
PreservingHeritage
Policy &Investment
Communities &Neighborhoods
Villages
Residential Density
Walkability
Access to Jobs
Cost of Transportation
Cost of Housing
North Central South
Place Type Rating by Region
PT
37Place Types
TransportationChoice
CommunityAffordability
EconomicOpportunity
PreservingHeritage
Policy &Investment
Communities &Neighborhoods
Small Villages
Residential Density
Walkability
Access to Jobs
Cost of Transportation
Cost of Housing
North Central South
Place Type Rating by Region
PT
41Place Types
TransportationChoice
CommunityAffordability
EconomicOpportunity
PreservingHeritage
Policy &Investment
Communities &Neighborhoods
Farms
Residential Density
Walkability
Access to Jobs
Cost of Transportation
Cost of Housing
North Central South
Place Type Rating by Region
28
City Centers emerge over time from Towns and Villages that have proven to be the most successful in the region. As cities grow, their centers mature to support a diversity of uses, cultural and social institutions, and a wide diversity of people.
In Doña Ana County, the core of Las Cruces is the only existing City Center, which is also in need of repair. The urban renewal activity of the 50’s and 60’s destroyed much of the vibrant City Center. Despite the opportunities for infill, the Las Cruces center continues as the most valuable real estate per acre in the county, and is home to the greatest concentration of employment.
City Centers have not been developed in Doña Ana County in recent decades. The suburban pattern of development has dominated growth, but they remain an option as a future Place Type. City Centers serve as inspiration for the type of place municipalities may wish to become.
City CentersEmbodied with the greatest diversity of human and physical character, City Centers define the urban character of a region.
URBAN CENTER
TYPE
VILLAGE TYPE
HAMLET TYPE
FARM LANDS TYPE

21Value Proposition of Age-Friendly Communities Summit
Next Steps and Opportunities
Age-Friendly goals and expectations to be calibrated to a range of contexts: hamlet to inner city.
Age-friendly initiatives can bring a large constituency to advocate for the establishment of a national taxonomy of place types. This framework would help the movement implement, manage, and evaluate its own work while also taking a leading role in supporting allied efforts by other professions and governmental agencies to achieve more sustainable outcomes from the built environment.
A place type framework will create a basis for integrating livable community attributes into local
and regional planning across many disciplines. A major challenge to Age-Friendly communities is that disparate transportation and land use planning disciplines work with different geographic scales of focus and different geographic districts. A place type framework is being developed with an understanding of what each discipline needs in order to diagnose and plan communities, and provides a common format useful to each. A place type framework can inform the geographically broad efforts of regional transportation planning and equally serve the focused efforts of local urban design and economic development, doing both in a way that health considerations can be integrated into the process.
Place Types Context
Who is concerned with context?
public policy organizations • advocacy organizations • research bodies transportation professionals • planners • federal departments
Who is Concerned With Context?
Public Policy Organizations | Advocacy Organizations | Research Groups | Transportation Professionals | Planners | Federal Departments
Tools to Define the Geography of Place (continued)

22Value Proposition of Age-Friendly Communities Summit
Align with Others to Change Marketplace & Professional Practices
Age-Friendly Communities already have identified the essential life elements through the eight domains of the WHO framework—community and healthcare, transportation, housing, social participation, outdoor spaces and buildings, respect and social inclusion, civic participation and employment, communication and information-- and the unification of these domains through a supportive built environment produces a Complete Community. The eight domains also identify areas of opportunity for partnership in the endeavor of creating Complete Communities.
Attention to the ways and means that Complete Communities produce value can be an effective strategy to bring the voices of a significant a constituency to the coalitions already working to incorporate health and well-being considerations into a wide range of marketplace practices. Adding Age-Friendly Community voices to the different organizations and movements that include but aren’t limited to Smart Growth America, Transportation for America, Congress for New Urbanism, Center for Neighborhood Technology, National League of Cities,
the National Association of County Organizations, Mayors Institute for City Design, National Endowment for the Arts, American Public Transit Association and the many others who have been advocating for quality communities, transportation and housing options, the integration of arts and community engagement facilities in neighborhood places will ensure that the full range of potential for inclusion of older and disabled individuals are explored within each of these organizations’ active programs.
Formulating the value of Complete Communities is a means of advancing many Age-Friendly goals by improving the methods through which local governments and private investors evaluate return on investment. Age friendly interventions will be more widely adopted when they are widely revealed to be a means of saving or earning financial returns. The practice of regularly monitoring and assessing return on investments in the quality of place is in nascent stages, having not yet caught up to the resources made available by large pools of data organized and managed by increasingly networked software
Next Steps and Opportunities
Potential Allies

23Value Proposition of Age-Friendly Communities Summit
Align with Others to Change Marketplace Practices (continued)
systems. Several of the above mentioned allied advocacy groups have pioneered methods for better evaluating the economic impacts of local investment decisions, and better communicating those impacts. The age friendly movement can join in and partner the development of these analytic methods and help create a constituency for their more widespread adoption into policy-making and investment practices.
Age-friendly work can both benefit from the significant advocacy and progress others have made in the areas of quality growth and the creation of more dense, walkable places and these movements with their robust 10-15 year track records can
benefit from the constituency a focus on age-friendly work can bring. Many of these organizations have studied senior issues, have collaborative with AARP or other national groups and share a strong desire to consider the changing demographics in their approach. Aligning around value and returns on investment therefore is not really a matter of “selling aging” to quality growth organizations, but instead are a means of ensuring that Age-Friendly practices are widely understood as good for business. Partnering to develop the methods and practices that make this financial benefit apparent is one of the most effective and direct means of instigating widespread adoption.
Next Steps and Opportunities
Three Community AGEnda partners completed local economic impact analyses, highlighting the influence that people over the age of 60 have on local economies- Kansas City, Phoenix and Atlanta. The results had both similarities and differences, but using the same methodology they were able to quickly engage new partners and sectors in dialogue about how to foster communities that support people of all ages including older adults. In Atlanta for example, it was discovered that out of the 10 counties and 72 cities not a single community’s economic development strategy mentioned anyone over 60, though the analysis showed that older people as a group contribute significantly to the regional GDP and regional personal income indicators especially when compared to other age groups.
Local data- whether it is regional, county or city level data, drives local change. National trends and national analyses are critical for establishing the
relationships, but local data can change local policy and local investment strategy. As a next step, tools beyond the economic impact analysis are needed to help local communities quantify the local value of age-friendly communities. Additional methodologies for assessing the impact older adults have on local infrastructure and facility usage, the specific existing data sets that local communities can analyze to explore the impact older adults have on tax base and service utilization, and the data that can drive existing and future performance contracts to reduce costs and expand options.
Many tools already exist, but most consider the population as a whole. Additional work will refine these tools to isolate the specific role of the 60+ population and identify any potential impacts the broader trend of increasing longevity has on local economies.
Refine Tools for Local Valuation

24Value Proposition of Age-Friendly Communities Summit
This report is not a comprehensive assessment of the Age-Friendly movement, or all the value that Age-Friendly work can provide. Nor does it attempt to tackle the definition of value in all types of communities. For example, the relationship between physical community form and health that is an important foundation for this discussion, is not the same in extremely rural places. This work instead focuses on the types of communities where the vast majority of older adults live- cities, suburbs and small towns where residents live in proximity to one another- at different scales but in proximity.
This report is meant to begin the task of quantifying the value of Age-Friendly interventions in a way that matters to the entities that must ultimately fund the work if it is to be sustainable and is to reach the required scale. Rather than restructure or rebuild the multiple frameworks that have already been constructed to organize Age-Friendly work and it begins to broaden it beyond the value achieved for older adults to the value achieved for the community as a whole. Strong research has already made clear the connection between quality of place and good health, much has also been done to demonstrate
the relationship between quality of place and local economic growth. In addition, across the country communities, foundations, private and public agencies are re-evaluating how investments can reflect these relationships rather than reinforce the silos between them.
Rather than create separate and distinct measures, the value propositions of Age-Friendly communities must build on this momentum and should find ways to grow it. This includes advancing the metrics that identify place and measure impact on place and quantifying the specific role older adults play in growing the value of place. Place has become the common focus across disciplines and unless is can be measured free from the often arbitrary boundaries of jurisdictions or census tracts it cannot be properly understood nor will interventions be properly measured. Age-Friendly networks are to date the only organizations discussing older people and place. Representing the fastest growing population across the globe, Age-Friendly organizations are the best positioned to quantify the specific and measurable value older people bring to creating great places. The work continues.
Conclusion

25Value Proposition of Age-Friendly Communities Summit
1 Reid Ewing, Tom Schmid, Richard Killingsworth, Amy Zlot, Stephen Raudenbush, “Relationship Between Urban Sprawl and Physical Activity, Obesity, and Morbidity,” American Journal of Health Promotion, (Sept/Oct 2003: Vol. 18 Issue 1):pp.47-57.
2 Roland Sturm, D.A. Cohen, “Suburban Sprawl and Physical and Mental Health,” Public Health, (2004: 118, 7), pp. 488-496.
3 C.M. Hoehner, L.K. Brennan Ramirez, M.B. Elliott, S.L. Handy, & R.C. Brownson, “Perceived and objective environmental measures and physical activity among urban adults,” American Journal of Preventive Medicine, (2005, 28, 2S2), pp. 105-16.
4 P. Clarke & L.K. George, “The role of the built environment in the disablement process,” American Journal of Public Health, (2005: 95, 11), pp. 1933-9.
5 K.M. Leyden, “Social capital and the built environment: The importance of walkable neighborhoods,” American Journal of Public Health (2003: 93,9), pp. 1546-1551.
6 James S. House, Karl R. Landis, Debra Umberson, (1988) “Social Relationships and Health,” Science, July 29, (1988: 241), pp. 540-544.
7 Laura Fratiglioni, Stephanie Paillard-Borg, and Bengt Winblad, “An active and socially integrated lifestyle in late life might protect against dementia,” The Lancet, Neurology, (2004: 3) pp. 343-53.
8 http://www.cdc.gov/healthyweight/healthy_eating/
9 http://www.cdc.gov/obesity/downloads/CDCHealthEquityObesityToolkit508.pdf
10 http://dug.org/mission-and-history/
11 K. Alaimo, T. Reischl, J.O. Allen, “Community Gardening,
Neighborhood Meetings, and Social Capital.” Journal of Community Psychology, (2010: 38, 4), pp. 497-514.
12 S. Wilcox, C. Castro, A.C. King, R.A. Housemann, R.C. Brownson, “Determinants of leisure time physical activity in rural compared with urban older and ethnically diverse women in the United States.” Journal of Epidemiology Community Health, (2000: 54), pp. 667–672.
13 Frances E. Kuo and William C. Sullivan, “Environment and Crime in the Inner City: Does Vegetation Reduce Crime?” Environment and Behavior, (2001: 33, 3, May), pp. 343-367.
14 Roger S. Ulrich, “View through a window may influence recovery from surgery.” Science. (1984: 224), pp. 420-2.
15 Gregory N. Bratman, et al., “Nature experience reduces rumination and subgenual prefrontal cortex activation.” Proceedings of the National Academy of Sciences. (2015: 112, 28), 8567–8572. www.pnas.org/cgi/doi/10.1073/pnas.1510459112
16 www.cnu.org
17 http://www.smartgrowthamerica.org/about-us
18 http://www.usgbc.org/articles/getting-know-leed-neighborhood-development
19 Leinberger ,Christopher,“The WalkUP Wake-Up Ca ll : Atlanta,” The George Washington School of Business, 2013
20 Urban Land Institute; Price-Waterhouse Cooper, “Emerging Trends in Real Estate,” 2013
21 AARP; “The Livability Economy: People, Places and Prosperity” 2015
22 Ibid
23 Ibid
End Notes

26Value Proposition of Age-Friendly Communities Summit
Attendees
Alan DelatorrePortland State University Institute on Aging
Amanda Tyler Atlanta Regional Commission Amy St. Peter Maricopa Association of Governments
Brett Van Akkeren EPA Office of Sustainable Communities
Cain Williamson Atlanta Regional Commission
Carolyn Jeskey Community Transportation Association of America
Cathy Boyer-Shesol Kansas City Communities for All Ages
David Goldberg Transportation for America
Elizabeth Plater-Zyberk DPZ Partners
Emilie Evans PlaceEconomics
Geoff Koski Bleakly Advisory Group, Atlanta
Isabel M. Rovira Urban Health Solutions
Jane Hardin Community Transportation Association of America
Jennifer Wallace-Brodeur AARP
Jenny Campbell Grantmakers In Aging
Jennifer Molinsky Joint Center for Housing Studies at Harvard
Jennie Smith-Peers Elders Share the Arts
Jeff Radar Commissioner, Dekalb County, Georgia Jim BROOKS National League of Cities
Joanna Lombard University Of Miami School Of Architecture
Joanna Liberman Turner National Association of Regional Councils
Kate Clark Philadelphia Corporation for Aging
Katie Perumbeti Atlanta Regional Commission
Kathryn Lawler Atlanta Regional Commission
In June 2015, a multi-disciplinary group of experts assembled in Atlanta, Georgia to review preliminary findings, additional research and considerations Their thoughts and discussions are reflected in this report

27Value Proposition of Age-Friendly Communities Summit
Leslie Wollack National Association of Regional Councils
Laura Robbins Laura A. Robbins Consulting, LLC.
Lynn Richards Congress of New Urbanism
Marlene Nagel Mid-America Regional Council
Maria Sotnikova Atlanta Regional Commission
Marie Hebenstreit Beason Indiana Philanthropy Alliance
Marilyn Stein-Lefeber Laurel Ridge Consulting, LLC
Marsha Jenakovich Alliance for Aging
Martin Rivarola Mid America Regional Council
Mary Blumberg Atlanta Regional Commission
Matthew Lambert DPZ Partners
Mia Oberlink Center for Home Care Policy
Mike Alexander Atlanta Regional Commission
M. Haley Berry Atlanta Regional Commission
Richard Knopf Osher Lifelong Learning Institute at ASU
Roz Tucker Atlanta Regional Commission
Ruth Finkelstein International Longevity Center
Scott Ball Commons Planning , Inc.
Scott BernsteinCenter for Neighborhood Technology
Stephanie Firestone National Association of Area Agencies on Aging
Stephen M. Golant University of Florida
Attendees

About Community AGEnda
The Community AGEnda initiative, a special project of Grantmakers In Aging, has accelerated the implementation of age-friendly and intergenerational initiatives in five US regions and fostered partnerships with other domestic and international organizations focused on expanding age-friendly activities. The initiative also created new tools and resources to help communities better understand the opportunities and potential for becoming great places to grow up and to grow old. Further, Community AGEnda has engaged the philanthropic community, providing strategies to support these age-friendly efforts. This three-year project, which will be completed at the end of 2015, was funded by The Pfizer Foundation. For further details, please visit www.GIAging.org/CommunityAGEnda.
About Grantmakers In Aging
Grantmakers In Aging (GIA) is an inclusive and responsive membership organization that is a national catalyst for philanthropy, with a common dedication to improving the experience of aging. GIA members have a shared recognition that a society that is better for older adults is better for people of all ages. GIA members include private, family, and community foundations; corporate philanthropy programs; funders exclusively focused on aging; and funders with wider funding interests. Since 1981, GIA has had a strong track record of developing partnerships with governmental, educational, and charitable organizations. Its experience and these relationships position GIA to continue this important work, which will shape communities in diverse ways.
About the Pfizer Foundation
The Pfizer Foundation is a charitable organization established by Pfizer Inc. Its mission is to promote access to quality health care, to nurture innovation, and to support the community involvement of Pfizer colleagues. The Pfizer Foundation provides funding and resources to local and international organizations that expand and improve global health strategies. For more information, please visit Pfizer.com.


