Nova Southeastern University Nova Southeastern University NSUWorks NSUWorks Marine & Environmental Sciences Faculty Articles Department of Marine and Environmental Sciences 2-21-2020 The Vertical and Horizontal Distribution of Deep-Sea Crustaceans in The Vertical and Horizontal Distribution of Deep-Sea Crustaceans in the Order Euphausiacea in the Vicinity of the DeepWater Horizon Oil the Order Euphausiacea in the Vicinity of the DeepWater Horizon Oil Spill Spill Tamara Frank Charles Douglas Fine Eric A. Burdett April Cook Tracey Sutton Find out more information about Nova Southeastern University and the Halmos College of Natural Sciences and Oceanography. Follow this and additional works at: https://nsuworks.nova.edu/occ_facarticles Part of the Marine Biology Commons, and the Oceanography and Atmospheric Sciences and Meteorology Commons
Transcript
Nova Southeastern University Nova Southeastern University
NSUWorks NSUWorks
Marine & Environmental Sciences Faculty Articles
Department of Marine and Environmental Sciences
2-21-2020
The Vertical and Horizontal Distribution of Deep-Sea Crustaceans in The Vertical and Horizontal Distribution of Deep-Sea Crustaceans in the Order Euphausiacea in the Vicinity of the DeepWater Horizon Oil the Order Euphausiacea in the Vicinity of the DeepWater Horizon Oil Spill Spill
Tamara Frank
Charles Douglas Fine
Eric A. Burdett
April Cook
Tracey Sutton
Find out more information about Nova Southeastern University and the Halmos College of
Natural Sciences and Oceanography.
Follow this and additional works at: https://nsuworks.nova.edu/occ_facarticles
Part of the Marine Biology Commons, and the Oceanography and Atmospheric Sciences and
Deep-Sea Environments and Ecology,a section of the journal
Frontiers in Marine Science
Received: 31 July 2019Accepted: 06 February 2020Published: 21 February 2020
Citation:Frank TM, Fine CD, Burdett EA,
Cook AB and Sutton TT (2020) TheVertical and Horizontal Distribution
of Deep-Sea Crustaceansin the Order Euphausiacea
in the Vicinity of the DeepWaterHorizon Oil Spill. Front. Mar. Sci. 7:99.
doi: 10.3389/fmars.2020.00099
The Vertical and HorizontalDistribution of Deep-SeaCrustaceans in the OrderEuphausiacea in the Vicinity of theDeepWater Horizon Oil SpillTamara M. Frank1* , Charles D. Fine2, Eric A. Burdett1, April B. Cook1 andTracey T. Sutton1
1 Halmos College of Natural Sciences and Oceanography, Nova Southeastern University, Dania Beach, FL, United States,2 Coral Springs Charter School, Coral Springs, FL, United States
The vertical and horizontal distributions of Euphausiacea in the northern Gulf of Mexico(GOM), including the location of the Deepwater Horizon oil spill, were analyzed from340 trawl samples collected between April and June 2011. This study is the firstcomprehensive survey of euphausiid distributions from depths deeper than 1000 min the GOM and includes stratified sampling from five discrete depth ranges (0–200 m, 200–600 m, 600–1000 m, 1000–1200 m, and 1200–1500 m), and expandsthe depth ranges of 30 species. In addition, this study demonstrates significantlyhigher abundance and biomass of the euphausiid assemblage from slope vs. offshorestations, while the offshore assemblage was significantly more diverse. There is alsosome evidence for seasonality in reproduction amongst the seven species that hadgravid females. Lastly, these data represent the first quantification of the euphausiidassemblage in the region heavily impacted by the Deepwater Horizon event, and asthere are no pre-spill data, may serve as an impacted baseline against which to monitorchanges in the euphausiid assemblage in the years following exposure to DeepwaterHorizon oil and dispersants in the water column.
Keywords: deep-sea crustaceans, mesopelagic, Euphausiacea, Gulf of Mexico, vertical migrations
INTRODUCTION
Euphausiids are pelagic crustaceans that range in size from mesozooplankton (0.2 µm to 2 mm),macrozooplankton (2–20 mm), and actively swimming micronekton (20–200 mm) (Omori andIkeda, 1984; Sutton, 2013). They are a vital part of the food web as they consume phytoplankton andzooplankton (Kinsey and Hopkins, 1994; Atkinson et al., 2009) and are in turn consumed by largerorganisms including seabirds (Deagle et al., 2007), commercially important fish species such as tuna(Jayalakshmi et al., 2011), whales (Schramm, 2007), and humans (Baker et al., 1990). Euphausiaceaare also important because most of them undergo diel vertical migrations, in which they remain indeeper waters during the day to avoid visual predators, and ascend 100 s of meters into shallowerwaters at sunset to feed under the cover of darkness (reviewed in Cohen and Forward, 2009). Thisbehavior means that not only are they potential prey for a variety of different organisms at multiple
Frontiers in Marine Science | www.frontiersin.org 1 February 2020 | Volume 7 | Article 99
Frank et al. Deep-Sea Euphausiacea in the N Gulf of Mexico
depth levels but are also vectors for the vertical transport of bothcarbon and pollutants through the water column.
The current study is unique because it utilizes samplescollected simultaneously from 0 to 1500 m water depth withinfive discrete depth ranges. Previous studies of euphausiids in theGulf of Mexico (GOM) did not extend past 1000 m (Kinsey andHopkins, 1994; Gasca et al., 2001). When Burghart et al. (2007)collected samples of Decapoda, Lophogastrida and Mysida fromdepths greater than 1000 m in the eastern GOM, they foundthat the bathypelagic zone was dominated by different speciesthan those that dominated in the mesopelagic zone. They foundan additional 10 species of oplophorids present below 1000 m,that were not known to occur in the GOM. Their study alsodemonstrated that several species thought to be relatively rarebased on collections shallower than 1000 m (Hopkins et al.,1989) were actually quite common in the deeper depths, suchas the oplophorids Acanthephyra stylorostratis and Hymenodoraglacialis. The Burghart et al. study emphasized the need toextend these studies to the Euphausiacea, one of the dominantgroups of crustaceans in the GOM (Kinsey and Hopkins, 1994;Burdett et al., 2017).
In addition, this study sampled sites at boundary zonesalong the continental slope. While these boundary zones alongcontinental margins are found in oceanic ecosystems worldwide,there are few studies on the micronektonic composition on bothsides of these boundary zones, most of which focused on fishspecies with limited information on crustaceans (Reid et al.,1991; Aguzzi and Company, 2010; Sutton, 2013; Feagans-Bartowand Sutton, 2014). The data presented here will provide vitalinformation needed to understand the community structure andrelationships between species found at these boundary regionsand adjacent oceanic systems.
The trawling sites for this study encompassed the region mostheavily impacted by the Deepwater Horizon oil spill, resultingfrom the explosion on the Deepwater Horizon rig on April 20,2010. This damaged rig discharged 3.19 million barrels of oilinto the northeastern GOM before it was capped in July, withthe deepest hydrocarbon plume occurring at 1100 m (Reddyet al., 2011; US District Court, 2015). This spill caused the crashof several local fisheries and coastal ecosystems (Gulfbase.org,2012) and a recent study on deep-sea crustaceans in thefamily Oplophoridae demonstrated a significant decrease in theirbiomass and abundance between 2011 (1 year after the spill)and 2017 (7 years after the spill) (Nichols, 2018). The datapresented here, collected 1 year after the spill, represent thefirst quantification of the euphausiid assemblage in this regionand will serve as the initial impacted baseline against which tomonitor temporal changes in the assemblage in studies conducted5–10 years after the spill.
MATERIALS AND METHODS
Sample Collection and ProcessingSamples were collected from April through June 2011 on theM/V Meg Skansi in the northern GOM (Figure 1) with a 10-m2
mouth area, six-net MOCNESS (Multiple Opening and Closing
Net and Environmental Sensing System) (Wiebe et al., 1976)with 3-mm mesh nets. Sampling was standardized at five discretedepth ranges from 0 to 1500 m, except in locations where depthsdid not reach 1500 m. Sampling depths were chosen based onthe following rationales, developed during the NOAA-supportedOffshore Nekton Sampling and Analysis Program (ONSAP): net1 (1500–1200 m) fished below the depth at which a subsurfacehydrocarbon plume was detected after the oil spill, net 2 (1200–1000 m) fished through the hydrocarbon plume (Reddy et al.,2011), net 3 (1000–600 m) fished where many of the verticalmigrators reside during the day, net 4 (600–200 m) was atdepths that vertical migrators pass through during their dielvertical migrations and net 5 (200–0 m) fished the epipelagic zonewhere strong vertical migrators are found at night. Samples werecollected twice during each 24-h cycle, resulting in one “day”trawl and one “night” trawl at each station. A total of 340 discretedepth samples were collected from 45 stations. The sampleswere fixed in 10% buffered formalin in seawater and transportedto the Deep-sea Biology lab at Nova Southeastern University,where all the euphausiids were identified to the lowest taxonomicclassification possible, using the Baker et al. (1990) euphausiidkey. The body lengths of up to 25 individuals (some samplescontained less than 25 individuals) of each species in each samplewere measured with digital calipers (CO030150 electronic digitalcaliper, Marathon Management). After taxonomic identification,wet weights for each species in every sample were recordedto the nearest 0.01 g (P-114 Balance, Denver Instruments). Asthe volume of water filtered by each net in each trawl varied,these data were standardized by dividing the combined speciescounts (N) or biomass (g) by the total volume filtered (m3) forthe respective net.
The stations sampled were a subset of the Southeast AreaMonitoring and Assessment Program (SEAMAP) sampling grid(Eldridge, 1988), bound by the 1000-m isobath to the north andthe 27◦N latitudinal line to the south. Stations were divided intotwo groups and listed as either slope or offshore (Figure 1).Those stations that were on or adjacent to the 1000-m isobath,where trawls down to 1500 m were not possible, were categorizedas slope stations and trawled down to their maximum depth.Stations that were located on the seaward side of the isobathwhere trawls down to 1500 m were possible, were categorized asoffshore stations. To compare slope assemblages of euphausiidswith offshore assemblages, species data from all the trawlsin one area were combined; i.e., data from all slope stations(n = 13) were combined to compare with data from all offshorestations (n = 32). Standard Station (27◦N, 86◦W), where extensivesampling of euphausiids was conducted in the 1990s (Kinsey andHopkins, 1994), coincided with Sampling Station SE-5.
Abundance, Biomass, and DiversityIndex CalculationsEuphausiids were ranked in descending order of abundancewith the most abundant species having a rank of 1, for bothslope and offshore assemblages. A Spearman’s rank comparisonwas completed to determine if there were significant differencesbetween slope and offshore euphausiid assemblages. As the
Frontiers in Marine Science | www.frontiersin.org 2 February 2020 | Volume 7 | Article 99
Frank et al. Deep-Sea Euphausiacea in the N Gulf of Mexico
FIGURE 1 | Sampling stations of the M/V Meg Skansi cruise from April to June showing slope and offshore station divisions. The orange line is the 1000 m isobath.Stations on or to the landward size of this line (black circles) were considered slope stations; stations on the seaward side of this line (pink circles) were consideredoffshore stations. Black star indicates Deepwater Horizon oil rig. Red star indicates Standard Station (Kinsey and Hopkins, 1994). Figure is from Burdett et al. (2017),used with permission from the Bulletin of Marine Science.
data were not normally distributed (Shapiro-Wilk test), Mann-Whitney U tests were utilized to determine if there weresignificant differences between abundance and biomass as well asindividual species’ abundances for slope vs. offshore assemblages.
Species richness (S), evenness (J’), calculated with Pielou’sEvenness Index equation, and diversity (H’), calculated withthe Shannon Diversity Index equation were calculated for everydepth range and time period sampled within either slope oroffshore assemblages (Hill, 1973). Independent sample t-testswere then performed on the Shannon Diversity Indices as perJayaraman (1999) and Aguzzi et al. (2015). All analyses andgraphs were performed with the analyses package and graphingoptions available in Excel.
Vertical DistributionSpecies whose abundance was >1% to the total euphausiidabundance were characterized as abundant species, andcollectively, they made up 99% of the euphausiid abundance.Species that contributed less than 1% to the total abundancewere characterized as rare species (Figure 2). Only the abundantspecies were analyzed with respect to their vertical distributions,as there were enough individuals present (over 100 per species)for meaningful analyses. The standardized abundance (N m−3)was determined for each species, and the percentage of theassemblage at every depth range and time period sampled withineither slope or offshore assemblages was calculated.
Gravid Female DataThe number of gravid females present was recorded for thespecies that had at least one gravid female, and standardized
abundances (N m−3 of water filtered) of gravid females per depthrange and per month were calculated, as was the percent ofthe total catch that was represented by gravid females for thespecified month.
RESULTS
Temperature and salinity profiles for April–June 2011 (Burdettet al., 2017), showed that there was little variation in thesephysical parameters with respect to location or month – depthand range of the thermocline and halocline, as well as surfacetemperature/salinity and those at trawling depths – so thesefactors were not taken into consideration during the analyses.
Taxonomic AnalysesDuring the analyses, it became clear that for several groupsof euphausiids collected at these sites, the species descriptiondid not match known species. The characteristic distinguishingNematoscelis atlantica and Nematoscelis microps (James, 1970;Roger, 1978; Mikkelsen, 1987; Baker et al., 1990) is the numberof setae on the propodus of the first thoracic leg, whichshould be 5–6 for N. atlantica, and 8–9 for N. microps. Inaddition, the dactylus should be straight and evenly taperingin N. atlantica, while it is described as being strongly recurvedin N. microps. Of the first two hundred individuals thatwere examined, 91% of them possessed seven setae, whilethe dactylus was between the diagrams in the keys (Bakeret al., 1990; Gibbons et al., 1999; Brinton et al., 2000). Dr.Martha Nizinski, Curator of Decapods at the National Museumof Natural History, could also not determine which species
Frontiers in Marine Science | www.frontiersin.org 3 February 2020 | Volume 7 | Article 99
Frank et al. Deep-Sea Euphausiacea in the N Gulf of Mexico
FIGURE 2 | (A) Total standardized abundance (N m−3) for the species that comprise the top 99% of all Euphausiacea caught (categorized as abundant species) atall stations. (B) Total standardized abundance for the species that comprise the remaining 1% of all Euphausiacea caught (categorized as rare). X-axis maximumvalue is different from that in (A).
Frontiers in Marine Science | www.frontiersin.org 4 February 2020 | Volume 7 | Article 99
Frank et al. Deep-Sea Euphausiacea in the N Gulf of Mexico
group these aberrant individuals belonged to, so, while ∼10% of the 25000 individuals examined did have the “correct”number of setae, they were all grouped together as Nematoscelisatlantica/Nematoscelis microps. Ongoing molecular analyses willdetermine if this is a new species, or if the original separation wasa misidentification of a single species. Furthermore, Thysanopodaobtusifrons and Thysanopoda aequalis (James, 1970; Mikkelsen,1987; Baker et al., 1990) are reportedly distinguishable by thestructure of their antennular lappets. T. obtusifrons shouldhave an antennular lappet that covers a third to half of thewidth of the base of the second segment of the antennularpeduncle, while T. aequalis should have an antennular lappetthat covers the full width of the base of the second segment.This difference was not readily apparent in the samples analyzedin this study, so the two species were grouped togetheras T. obtusifrons and T. aequalis. Lastly, T. acutifrons andT. orientalis are two very closely related species and cannotbe differentiated unless they are sexually mature adults withpetasmae or thelyca (Baker et al., 1990). The individuals in thesesamples were small with very few sexually mature individuals,so these two species were grouped together as T. acutifronsand T. orientalis.
Slope Assemblage vs. OffshoreAssemblage ComparisonIn total, 51,559 euphausiids belonging to 31 species werecollected. Numerically, 16 species made up 99% of the total(slope + offshore stations) euphausiid assemblage and werecategorized as abundant, while 15 species made up the remaining1% and were categorized as rare. N. atlantica/N. microps was byfar the most abundant euphausiid taxon, accounting for 51.2%of all euphausiids present, with Stylocheiron abbreviatum (12.4%)being the only other species to account for more than 10% of thetotal assemblage (Figure 2A). Each of the rare species included inthe bottom 1% accounted for 0.2% or less of the total euphausiidassemblage (Figure 2B).
The total number of individuals caught per m3 wassignificantly greater (Mann Whitney U, p = 0.004) in slopesamples than it was in offshore samples (Figure 3A). However,in terms of individual species’ contributions to the totalabundance, the relative abundance of each species (i.e., thepercent contribution to the total abundance) remained consistent(less than a 2% difference in relative abundance) for the speciescategorized as abundant in both locations (Figure 4), with theexception of N. atlantica/N. microps and Euphausia mutica. N.atlantica/N. microps accounted for 56.1% of the total abundancefor slope samples vs. 49.4% of the total abundance for offshoresamples. E. mutica accounted for 0.1% of the total abundancefor slope samples vs. 2.6% of the total abundance for offshoresamples. While N. atlantica/N. microps was the most abundantspecies in both slope and offshore samples, E. mutica was the7th most abundant species in offshore samples and the 16th mostabundant in slope samples (Figure 4).
While there were more offshore stations, station variancewas very low for both slope (1.19 × 10⁻⁵m−3) and offshore(6.41 × 10⁻⁶ m−3) stations, indicating that the greaterabundance of euphausiids in slope waters vs. offshore waters was
not due to skewed data resulting from more trawling offshore.Of the ten rare species that were present only in the offshoresamples, four of them (N. tenella, S. robustum, E. krohnii, and E.hemigibba/E. pseudogibba) were collected in substantial numbers(91, 63, 32, and 17) and distributed across multiple stations. Theremaining six species were collected in much lower numbers (oneto seven) and additional slope sampling is needed before drawingany conclusions about their geographical restrictions.
A Spearman’s Rank correlation demonstrated a significant(ρ = 0.90, DF = 31 p < 0.001) monotonic relationship, meaningthat as slope abundances increased, each abundant species’respective offshore abundance also increased. Eight of the 16abundant euphausiid species were significantly more abundant inthe slope samples than offshore (all p < 0.01; Mann Whitney U),while one species (E. mutica) was significantly (p < 0.01) moreabundant in offshore samples than in slope samples (Figure 4).
With respect to the rare euphausiid species, 10 specieswere found in offshore samples that were not found inslope samples (Figure 5), with Nematoscelis tenella (n = 91),Stylocheiron robustum (n = 63), Euphausia krohnii (n = 32), andEuphausia hemigibba/Euphausia pseudogibba (n = 17) occurringin abundances of over 10 individuals. The abundance of theremaining six species ranged from one to seven. There wereno species found in slope samples that were not found inoffshore samples.
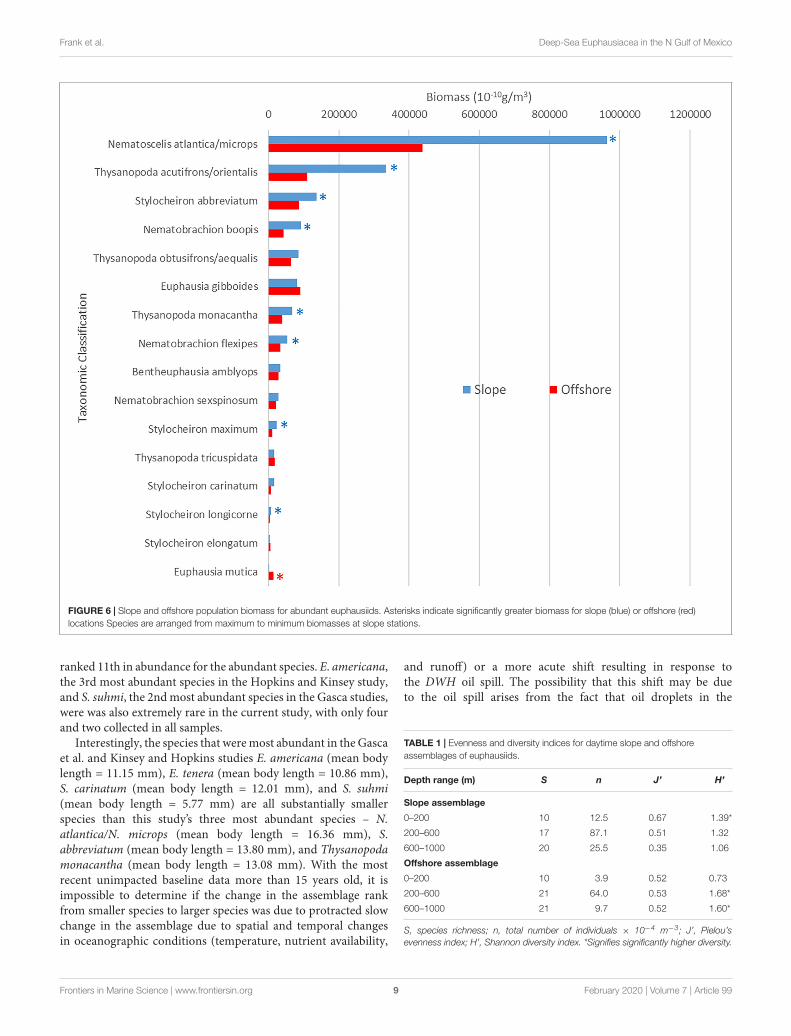
The biomass for the euphausiid assemblage reflected theabundance trends, with biomass for the slope assemblage beingsignificantly higher (Mann-Whitney U, p = 0.0004) than it wasfor the offshore assemblage (Figure 3B). The biomass trendsfor individual species also reflected abundance trends, with thebiomass of the majority of abundant euphausiid species higher atslope stations than at offshore stations (Figure 6). N. atlantica/N.microps had the highest biomass for both slope and offshorelocations. The same eight species that were significantly moreabundant in the slope stations also had significantly (Mann-Whitney U, all p < 0.01) higher biomasses than in the offshorestations; the same species (E. mutica) that was significantlymore abundant in the offshore stations also had a significantly(Mann-Whitney U, p < 0.01) higher biomass in offshore stations.Euphausiids made up 15.8% of the total biomass of all thecrustaceans collected during this study (1.837 kg), making itthe 3rd highest ranking crustacean family in terms of biomassin this region, with N. atlantica/N. microps, the most abundanteuphausiid, making up 44% of the total euphausiid biomass.Thysanopoda acutifrons/Thysanopoda orientalis was the 6th-mostabundant euphausiid, but due to its larger size compared tothe more abundant species, it ranked 2nd in terms of biomass,making up 12.7% of the total euphausiid biomass.
Slope and offshore euphausiid assemblages were comparedusing the Shannon Diversity (H’) and Pielou’s #Evenness (J’)indices, but these analyses did not include the bathypelagiczone because bathypelagic samples were not available for theslope stations. Diversity was significantly higher (p < 0.001) inthe slope samples than the offshore samples in the epipelagiczone during the day (Table 1) but was significantly higher(<0.001) in the offshore samples than the slope samples duringthe night (Table 2). In the mesopelagic zone (200–1000 m),
Frontiers in Marine Science | www.frontiersin.org 5 February 2020 | Volume 7 | Article 99
Frank et al. Deep-Sea Euphausiacea in the N Gulf of Mexico
FIGURE 3 | (A) Standardized abundance (N m−3) for slope vs. offshore euphausiid assemblage. Abundance was significantly higher in the slope stations (KruskalWallis, p = 0.005). Stars represent mean values. (B) Standardized biomass for slope vs. offshore euphausiid assemblage. Biomass was significantly higher in theslope stations (Kruskal Wallis, p = 0.0009). Stars represent mean values.
both day and night, the diversity was significantly higher(p < 0.05) in the offshore samples. The upper and lowermesopelagic assemblages were more evenly distributed offshoreduring the day, whereas the epipelagic assemblage was moreevenly distributed over the slope.
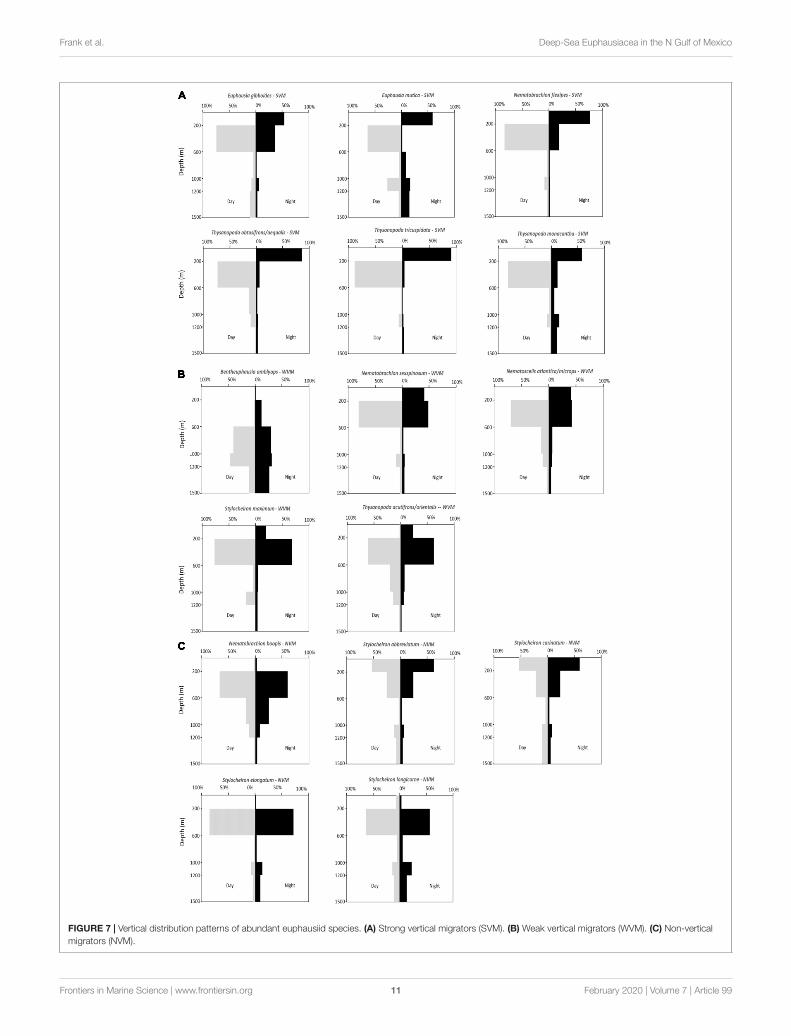
Vertical DistributionVertical distribution patterns were determined for the 16most abundant species (those that made up 99% of the
euphausiid assemblage). These species could be separated intothree distinct groups based on their vertical distributions: (1)species in which over 50% of the population migrated to ashallower depth range at night, and were thus categorized asstrong vertical migrators (SVM – Figure 7A); (2) species inwhich 19.5–41.3% of the population migrated to a shallowerdepth range at night and thus categorized as weak verticalmigrators (WVM – Figure 7B); and (3) species where lessthan 2% of the population moved to a shallower depth
Frontiers in Marine Science | www.frontiersin.org 6 February 2020 | Volume 7 | Article 99
Frank et al. Deep-Sea Euphausiacea in the N Gulf of Mexico
FIGURE 4 | Slope and offshore standardized abundances for abundant species. Asterisks indicate significantly greater abundances for slope (blue) or offshore (red)locations. Species are arranged from maximum to minimum abundances at slope stations.
range at night, and thus categorized as non-vertical migrators(NVM- Figure 7C).
A total of 6 of the 16 abundant species were strong verticalmigrators, five species were weak vertical migrators, and fivespecies showed no discernable vertical migrations. All six ofthe species that were considered strong vertical migrators hadover 50% of their respective day populations caught at depths ofbetween 200 and 600 m during the day. Four of the five speciesthat showed a weak vertical migration pattern had over 50% oftheir respective day populations caught between 200 and 600 m,while the other weak migrator, Bentheuphausia amblyops, wasfound primarily between 600 and 1200 m (40.4% between 600and 1000 m and 46.1% between 1000 and 1200 m) during theday, with a small portion (11.8%) migrating up to 200–600 mat night. Of the five species that showed no vertical migration,
more than 50% of the S. abbreviatum and Stylocheiron carinatumindividuals were caught between 0 and 200 m during both theday and the night. The remaining three species (Stylocheironlongicorne, Stylocheiron elongatum, and Nematobrachion boopis)were caught primarily between 200 and 600 m during boththe day and night.
The 15 species that accounted for the remaining 1% oftotal euphausiid abundance were not caught in sufficientquantities to create meaningful vertical distribution graphs.Supplementary Table S1 shows the depth distribution ofthese rare species.
Gravid Female DataGravid females were found in seven species. N. atlantica/N.microps had the highest number of gravid females, and
Frontiers in Marine Science | www.frontiersin.org 7 February 2020 | Volume 7 | Article 99
Frank et al. Deep-Sea Euphausiacea in the N Gulf of Mexico
FIGURE 5 | Slope and offshore abundances for rare euphausiids. X-axis maximum value is substantially lower than that of Figure 4.
Euphausia tenera had the highest percentage of gravid females.N. atlantica/N. microps was the only species in which gravidfemales were caught in all five depth ranges (Table 3). Table 4shows monthly representation of gravid female abundance andwhat percent of that species’ population the gravid abundancerepresents. Only one species had gravid females in April (N.atlantica/N. microps), while five species had gravid females inMay and six species had gravid females in June. N. atlantica/N.microps is the only species in which gravid females were caughtin all 3 months of sampling with the greatest abundance(2925 × 10−7m−3) and percent (10.0%) of population gravidoccurring in May.
DISCUSSION
Assemblage StructureSixteen species of euphausiids made up 99% of the euphausiidabundance, with the most abundant species being the combinedspecies group N. atlantica/N. microps, in both slope and offshore
stations. The only previous study in this region was by Kinseyand Hopkins (1994), conducted at their Standard Station, whichoverlapped with Station SE-5 in the current study. Combinedvalues of N. atlantica and N. microps from the Hopkins andKinsey study puts them as the 5th most abundant species intheir study while the three most abundant species in their studywere E. tenera, S. carinatum, and Euphausia americana. Morerecent studies by Castellanos and Gasca (1999) and Gasca et al.(2001) collected Euphausiacea from the southern GOM, andalthough they only trawled in the epipelagic zone (0–200 m), theirnight trawls would have collected most of the vertical migratingspecies. They found 17 species of euphausiids and determinedthat three species, S. carinatum, Stylocheiron suhmi, and E. tenera(in decreasing order of abundance) contributed to the majorityof the euphausiid abundance in both spring and summer. Thismeans that two of the top three most abundant species in thesetwo studies (S. carinatum and E. tenera), separated by location(southern GOM vs. northern GOM) and time (7 years) were thesame. In the current study, E. tenera was extremely rare, with onlysix collected in 340 samples from all depths, while S. carinatum
Frontiers in Marine Science | www.frontiersin.org 8 February 2020 | Volume 7 | Article 99
Frank et al. Deep-Sea Euphausiacea in the N Gulf of Mexico
FIGURE 6 | Slope and offshore population biomass for abundant euphausiids. Asterisks indicate significantly greater biomass for slope (blue) or offshore (red)locations Species are arranged from maximum to minimum biomasses at slope stations.
ranked 11th in abundance for the abundant species. E. americana,the 3rd most abundant species in the Hopkins and Kinsey study,and S. suhmi, the 2nd most abundant species in the Gasca studies,were was also extremely rare in the current study, with only fourand two collected in all samples.
Interestingly, the species that were most abundant in the Gascaet al. and Kinsey and Hopkins studies E. americana (mean bodylength = 11.15 mm), E. tenera (mean body length = 10.86 mm),S. carinatum (mean body length = 12.01 mm), and S. suhmi(mean body length = 5.77 mm) are all substantially smallerspecies than this study’s three most abundant species – N.atlantica/N. microps (mean body length = 16.36 mm), S.abbreviatum (mean body length = 13.80 mm), and Thysanopodamonacantha (mean body length = 13.08 mm). With the mostrecent unimpacted baseline data more than 15 years old, it isimpossible to determine if the change in the assemblage rankfrom smaller species to larger species was due to protracted slowchange in the assemblage due to spatial and temporal changesin oceanographic conditions (temperature, nutrient availability,
and runoff) or a more acute shift resulting in response tothe DWH oil spill. The possibility that this shift may be dueto the oil spill arises from the fact that oil droplets in the
TABLE 1 | Evenness and diversity indices for daytime slope and offshoreassemblages of euphausiids.
Depth range (m) S n J’ H’
Slope assemblage
0–200 10 12.5 0.67 1.39*
200–600 17 87.1 0.51 1.32
600–1000 20 25.5 0.35 1.06
Offshore assemblage
0–200 10 3.9 0.52 0.73
200–600 21 64.0 0.53 1.68*
600–1000 21 9.7 0.52 1.60*
S, species richness; n, total number of individuals × 10−4 m−3; J’, Pielou’sevenness index; H’, Shannon diversity index. *Signifies significantly higher diversity.
Frontiers in Marine Science | www.frontiersin.org 9 February 2020 | Volume 7 | Article 99
Frank et al. Deep-Sea Euphausiacea in the N Gulf of Mexico
TABLE 2 | Evenness and diversity indices for nighttime slope and offshoreassemblages of euphausiids.
Depth range (m) S n J’ H’
Slope assemblage
0–200 16 134.1 0.65 1.76
200–600 17 65.1 0.53 1.45
600–1000 12 14.2 0.67 1.64
Offshore assemblage
0–200 21 85.5 0.62 1.93*
200–600 26 70.0 0.52 1.70*
600–1000 22 9.2 0.57 1.83*
S, species richness; n, total number of individuals × 10−4m−3; J’, Pielou’sevenness index; H, Shannon diversity index. *Signifies significantly higher diversity.
water could have a greater impact on smaller species due totheir larger surface area to volume ratios; as animals increasein size, their surface area doubles, but their volume triples(Schmidt-Nielsen, 1984). The relatively larger surface area meansa larger area for contaminants to diffuse into the body, and thesmaller volume means less internal components to dilute thecontaminants, giving rise to the possibility that oil/dispersantsmight have a greater impact on smaller individuals. This hasbeen experimentally demonstrated in copepods (Jiang et al.,2012), where smaller individuals were more sensitive to oilWAF (water associated fraction) than larger ones, and in theamphipod Gammarus oceanicus, where larvae were hundredsof times more sensitive to oils than adults (Lindén, 1976).Further decadal long studies are required in this region todetermine if this is an acute shift in the assemblage that mayshow recovery over time or is simply part of a persistentdecadal pattern.
Slope vs. OffshoreThe abundance and biomass of euphausiids were significantlygreater in slope than in offshore stations (Figure 3), but the vastmajority of the euphausiid assemblage was found between 0 and600 m in both regions, which was also reported by Kinsey andHopkins (1994) and Castellanos and Gasca (1996) at their studysites. These data indicate that deeper depths offshore cannotaccount for the distribution differences, and the reason remainsto be determined.
The offshore assemblage was significantly more diverse thanthe slope assemblage at all depths and times of day, with theexception of the epipelagic assemblage sampled during the day,which was significantly more diverse over the slope (Tables 1, 2).Diversity values incorporate species richness and evenness withina population and since species richness was the same for bothlocations in the epipelagic zone (10 species), the lower number ofindividuals offshore (5× 10⁻⁴ m−3) compared to those over theslope (11× 10−4 m−3) might explain the observed differences.
While studies comparing slope and offshore fauna arerelatively rare, Reid et al., 1991 described a mesopelagic-boundary community for micronekton off the coast of Hawaii,that occupied a narrow boundary zone over the upper slope.The faunal composition of this boundary community differed
substantially from the neighboring oceanic community forfishes, squids, and crustaceans. In addition, there were higherconcentrations of boundary species closer to shore, with rapidseaward reduction in abundances, similar to what we report herefor Euphausiidae, and what Burdett et al. (2017) reported for theOplophoridae. However, although Burdett et al. (2017) sampledmany of the same Oplophoridae species sampled in the Reidet al., 1991 study, they found several species with significantlydifferent distributions. For example, Janicella spinacauda wasprimarily an offshore species in the NE GOM, while the Reidstudy found them to be equally abundant in both inshore andoffshore samples, indicating that there may be considerablelocal differences in species compositions and diversity. Thedata reported here, together with the Burdett and Reid studies(and earlier studies referenced therein) emphasize the idea thatboundary communities are globally distributed, and that slopecommunities are unique to their regions, with local geography,currents and even seasonality contributing to these differences.Future studies need to take into account that there maybe significant differences in species composition and biomassbetween slope and. neritic stations, and how these boundarycommunities impact the neritic ecosystem.
Species richness in night assemblages increased in theepipelagic zone for both offshore and slope samples compared totheir respective day assemblages. The greatest increase occurredin the offshore epipelagic samples (10 species during the day, 20species at night), due to the nighttime vertical migrations of thesespecies. These findings are supported by Biggs et al. (1977) andCastellanos and Gasca (1999), who also noted species richnessincreased during the night in the epipelagic zone. This hugeincrease in species richness in the epipelagic zone due to verticalmigrations at night underscores of importance of conductinga full spatial and temporal sampling series when attempting toassess the impact of human activities on deep-sea species.
Gravid Female DataAt least one gravid female was found in seven species ofEuphausiacea. Six of these species were categorized as abundant,while one (E. tenera) was a rare species. Gravid females werefound at all depth ranges with the majority found between 200and 600 m (Table 3). N. atlantica/N. microps gravid females (totalof 1683 gravid females, 9.3% of the sampled population) werepresent in all depth ranges, with the vast majority occurringbetween 0 and 600 m depth. The total number of gravid N.atlantica/N. microps females (the only species for which largenumbers of gravid females were found) varied from April toJune, but the total number of individuals varied as well, so therewere no substantial differences in the percent of gravid femalescollected each month. Four of the seven species that had at leastone gravid female, had the largest percent of their populationgravid in the month of June. In addition, the number of specieswith gravid females increased from one in April, to five in May,to six in June (Table 4). Previous studies suggest that euphausiidsreproduce seasonally (Cuzin-Roudy, 2000; Gómez-Gutiérrez andRobinson, 2005), and data from the current study point towardsa seasonal aspect to their reproduction as well. Further data areneeded on reproductive seasonality in euphausiids, as the timing
Frontiers in Marine Science | www.frontiersin.org 10 February 2020 | Volume 7 | Article 99
of events like an oil spill in the GOM would have significantlygreater impacts if they occur during the reproductive season.
Vertical DistributionThe data for most species in the current study support theconclusions of Kinsey and Hopkins (1994) in terms of whetherspecies are strong, weak or non-vertical migrators. Based onthe data reported in the current study, T. tricuspidata, whosesample size was too small for Kinsey and Hopkins (1994) tocategorize, can now also be added to the list of strong verticalmigrators in the GOM, with more than 50% of the daytimepopulation ascending to shallower depths at night. N. atlantica/N.microps and Stylocheiron maximum were considered to be verticalmigrators by Kinsey and Hopkins (1994), but their sample sizewas not large enough for them to distinguish between strongand weak vertical migrators. Based on the large sample sizes inthe current study, these species can be identified as weak verticalmigrators, as are Nematobrachion sexspinosum, Bentheuphausiaamblyops, and T. acutifrons/T. orientalis.
However, their conclusion that S. longicorne was a verticalmigrator are not supported by the results of the current study.Their conclusion was based on a small sample size and apparentmovements from 200 to 300 m during the day, to 125 to 200 mduring the night. These depth ranges encompass two of thedepth ranges in the current study, so if vertical migrations were
TABLE 4 | Gravid female abundance (×10−7m−3) by month for each speciesof Euphausiacea.
*NA indicates no individuals of that species were collected. “0” indicates thatindividuals of that species were collected but none of them were gravid. Numbersin parentheses are the percent of that species population that gravid femalesrepresent for that month.
occurring, they should have been apparent. Based on the largesample size in the current study and the fact that the percentageof the population at night in the epipelagic zone (2.3%) was lowerthan during the day (7.4%), this species should be considered anon-vertical migrator.
Bergstrom and Stromberg (1997), studying the euphausiidassemblage off the Swedish west coast, found thatMeganyctiphanes norvegica did not vertically migrate througha thermocline that was present between 50 and 60 m, althoughThysanoessa raschii did. This suggests that some euphausiidspecies may be limited by thermoclines with respect to theirvertical distribution, but others are not. At the time of thecurrent study, a thermocline was present between 25 and 600 mand a halocline was present between 125 and 500 m at bothslope and offshore locations (Burdett et al., 2017). As shownby Burdett et al., there were no significant differences betweentemperature or salinity at similar depths between slope andoffshore stations. Since the thermocline in the present studyextended for hundreds of meters and all the vertically migratingspecies of euphausiids traversed these depths, it does not appearthat the presence of a thermocline inhibited the vertical activityof euphausiids in this study. In addition, the lack of differencesin this parameter between offshore and slope stations indicatesthat differences in distribution patterns for these species cannotbe attributed to this factor.
Supplementary Table S2 shows depth ranges for alleuphausiids caught in the GOM from previous studies. Due to thedeeper depths included in the current study, the depth ranges of30 species have been expanded – 25 down to 1500 m. two downto 1200 m, and three to shallower depths where they were notreported before.
There is one species of weak vertical migrator, Bentheuphausiaamblyops, with a deeper daytime depth distribution than theother 15 abundant species, with more than 50% of the daytimepopulation found at the depth of the subsurface plume (1000 to1200 m) that initially resulted from the DWHOS [e.g., Camilliet al., 2010; Hazen et al., 2010; Ryan et al., 2011)]. One mightanticipate that this species would be more profoundly affected bythe oil spill that the shallower living species. However, extensivesampling of the water column in 2010 from the surface tojust above the seafloor showed PAH concentrations higher than0.3 µ/L in (Murawski et al., 2016; Romero et al., 2018), levelswhich are toxic to marine organisms (Whitehead et al., 2012).
Frontiers in Marine Science | www.frontiersin.org 12 February 2020 | Volume 7 | Article 99
Frank et al. Deep-Sea Euphausiacea in the N Gulf of Mexico
Therefore, it is unlikely that any species specific effects would bepresent. In addition, these types of analyses require comparisonswith samples collected before the oil spill, and these samplesdo not exist, with the exception of the 15-year old Kinseyand Hopkins study, which did not mention quantify B.amblyops in their study.
However, the fact that 11 of the 16 most abundant speciesare vertical migrators can substantially increase the impact ofan anthropogenic event such as an oil spill. Vertical migratorsserve as vectors of oil released in deeper waters, such as theDWHOS, to surface waters, as well as vectors of oil spilled atthe surface, to deeper waters. Being primary prey for a variety ofspecies – stomiid deep-sea fish, tuna, whales, seabirds (Sutton andHopkins, 1996; Deagle et al., 2007; Schramm, 2007; Jayalakshmiet al., 2011) – they would serve as mechanisms of trophictransport of contaminants through the food web.
CONCLUSION
In conclusion, the results of this study indicate that there aresignificant differences between offshore and slope assemblagesof euphausiids, with both biomass and abundance beingsignificantly higher at the slope stations, indicating that theselocation factors need to be taken into account when describingthe assemblages in regions when sampling includes stations closeto the continental slope. In addition, this study also supportssuggestions from earlier studies that seasonality in reproductionis present in euphausiids, data that are vital for modelingpotential effects of anthropomorphic disturbances in this region.While no conclusions can be drawn about the impact of theDWHOS, it is interesting that there has been a shift in theassemblage from domination by smaller species to domination bylarger species between a study that occurred 15 years ago, and thecurrent study, that occurred 1 year after the oil spill. Finally, thelarge number of vertical migrators, the extent of their migrations,and the significant effect of this behavior on species richness inshallow waters, emphasizes the need to conduct studies of thistype throughout the water column, both during the day and atnight. These data will also serve as an impacted baseline againstwhich to monitor future assemblage shifts as the region recoversfrom any changes that may have resulted from the DeepwaterHorizon oil spill.
DATA AVAILABILITY STATEMENT
The datasets generated for this study can be found in the https://data.gulfresearchinitiative.org (doi: 10.7266/N7VX0DK2).
AUTHOR CONTRIBUTIONS
TS and AC did all the cruise planning, led the cruises, andprovided the samples for analysis. TF, CF, and EB completed allthe taxonomic analysis. TF and CF completed the majority ofthe statistical analyses, wrote the manuscript, and produced thefigures and tables.
FUNDING
This project was funded in part by the NOAA Officeof Response and Restoration and in part from a grantfrom the Gulf of Mexico Research Initiative (GoMRI) tothe Deep Pelagic Nekton Dynamics of the Gulf of Mexico(DEEPEND) Consortium. Data are publicly available throughthe Gulf of Mexico Research Initiative Information and DataCooperative (GRIIDC) at https://data.gulfresearchinitiative.org(doi: 10.7266/N7VX0DK2).
ACKNOWLEDGMENTS
We thank the crew of the M/V Meg Skansi for collecting thesamples used in this study. We also thank Martha Nizinski for heraid in validating specimen identification, Lacey Malarky for hercontributions to the statistical analysis of this report, and D. Hahnand N. Thompson for the manuscript review.
SUPPLEMENTARY MATERIAL
The Supplementary Material for this article can be foundonline at: https://www.frontiersin.org/articles/10.3389/fmars.2020.00099/full#supplementary-material
REFERENCESAguzzi, J., and Company, J. B. (2010). Chronobiology of deep-water decapod
crustaceans on continental margins. Adv. Mar. Biol. 58, 55–225. doi: 10.1016/B978-0-12-381015-1.00003-4
Aguzzi, J., Sbragaglia, V., Tecchio, S., Navarro, J., and Company, J. B. (2015).Rhythmic behaviour of marine benthopelagic species and the synchronousdynamics of benthic communities. Deep Sea Res. Part 1 Oceanog. Res. Pap. 95,1–11. doi: 10.1016/j.dsr.2014.10.003
Atkinson, A., Siegel, V., Pakhomov, E. A., Jessopp, M. J., and Loeb, V. (2009). Are-appraisal of the total biomass and annual production of Antarctic krill. DeepSea Res. I 56, 727–740. doi: 10.1016/j.dsr.2008.12.007
Baker, A. de, C., Boden, B. P., and Brinton, E. (1990). A Practical Guide to theEuphausiids of the World. London: Natural History Museum, 1–96.
Bergstrom, B., and Stromberg, J. O. (1997). Behavioral differences in relationto pycnoclines during vertical migration of the euphausiids Meganyctiphanesnorvegica (M. Sars) and Thysanoessa raschii (M. Sars). J. Plankton Res. 19,255–261. doi: 10.1093/plankt/19.2.255
Biggs, D. C., Zimmerman, R. A., Gasca, R., Suarez-Morales, E., Castellanos, I. A.,and Leben, R. R. (1977). Note on plankton and cold-core rings in the Gulf ofMexico. Fish. Bull. 95, 369–375.
Brinton, E., Ohman, M. C., Townsend, A. W., Knight, M. D., and Bridgeman, A. L.(2000). Euphausiids of the World Ocean. Leiden: ETI BioInformatics.
Burdett, E., Fine, C., Sutton, T., Cook, A., and Frank, T. (2017). Geographicand depth distributions, ontogeny, and reproductive seasonality ofdecapod shrimps (Caridea: Oplophoridae) from the northeasternGulf of Mexico. Bull. Mar. Sci. 93, 743–767. doi: 10.5343/bms.2016.1083
Frontiers in Marine Science | www.frontiersin.org 13 February 2020 | Volume 7 | Article 99
Frank et al. Deep-Sea Euphausiacea in the N Gulf of Mexico
Burghart, S. E., Hopkins, T. L., and Torres, J. J. (2007). The bathypelagic decapoda,lophogastrida, and Mysida of the eastern Gulf of Mexico. Mar. Biol. 152,315–327. doi: 10.1007/s00227-007-0691-3
Camilli, R., Reddy, C. M., Yoerger, D. R., Van Mooy, B. A. S., Jakuba, M. V., Kinsey,J. C., et al. (2010). Tracking hydrocarbon plume transport and biodegradationat Deepwater Horizon. Science 330, 201–204. doi: 10.1126/science.1195223
Castellanos, I. A., and Gasca, R. (1996). Eufáusidos (Crustacea: Euphausiacea) deaguas superficiales del sur del Golfo de Mexico. Caribb. J. Sci. 32, 187–194.
Castellanos, I. A., and Gasca, R. (1999). Epipelagic euphausiids (Euphausiacea)and spring mesoscale features in the Gulf of Mexico. Crustaceana 72, 391–404.doi: 10.1163/156854099503456
Cohen, J. H., and Forward, R. B. Jr. (2009). Zooplankton diel vertical migration-areview of proximate control. Oceanogr. Mar. Biol. 47, 77–110.
Cuzin-Roudy, J. (2000). Seasonal reproduction, multiple spawning, and fecundityin northern krill, Meganyctiphanes norvegica, and Antarctic krill, Euphausiasuperba. Can. J. Fish. Aquat. Sci. 57, 6–15. doi: 10.1139/f00-165
Deagle, B. E., Gales, N. J., Evans, K., Jarman, S. N., Robinson, S., Trebilco, R.,et al. (2007). Studying seabird diet through genetic analysis of faeces: a casestudy on macaroni penguins (Eudyptes chrysolophus). PLoS One 2:831. doi:10.1371/journal.pone.0000831
Eldridge, P. J. (1988). The southeast area monitoring and assessment program(SEAMAP): a state federal-university program for collection, management, anddissemination of fishery-independent data and information in the southeasternUnited States. Mar. Fish Rev. 50, 29–39.
Feagans-Bartow, J. N., and Sutton, T. T. (2014). Ecology of the oceanic rim:pelagic eels as key ecosystem components. Mar. Ecol. Prog. Ser. 502, 257–266.doi: 10.3354/meps10707
Felder, D. L., and Camp, D. K., (2010). Gulf of Mexico Origin, Waters, and Biota:Biodiversity. College Station, TX: Texas A&M University Press.
Gasca, R., Castellanos, I., and Biggs, D. C. (2001). Euphausiids (CrustaceaEuphausiacea) and summer mesoscale features in the Gulf of Mexico. Bull. Mar.Sci. 68, 397–408.
Gibbons, M. J., Spiridonov, V. A., and Tarling, G. A., (1999). “Euphausiacea,”in South Atlantic Zooplankton, Vol. 2, ed. D. Boltovskoy, (Leiden: BackhuysPublishers)
Gómez-Gutiérrez, J., and Robinson, C. J. (2005). Embryonic, early larvaldevelopment time, hatching mechanism and interbrood period of the sac-spawning euphausiid Nyctiphanes simplex Hansen. J. Plankton Res. 27, 279–295.doi: 10.1093/plankt/fbi003
Gulfbase.org (2012). Resource Database for Gulf of Mexico Research. Available at:http://www.gulfbase.org/facts.php
Hazen, T. C., Dubinsky, E. A., DeSantis, T. Z., Andersen, G. L., Piceno, Y. M., Singh,N., et al., (2010). Deep-sea oil plume enriches indigenous oil-degrading bacteria.Science 330, 204–208. doi: 10.1126/science.1195979
Hill, M. O. (1973). Diversity and evenness: a unifying notation and itsconsequences. Ecology 54, 427–432. doi: 10.2307/1934352
Hopkins, T. L., Gartner, J. V. Jr., and Flock, M. E. (1989). The caridean shrimp(Decapoda: Natantia) assemblage in the mesopelagic zone of the eastern Gulf ofMexico. Bull. Mar. Sci. 45, 1–14.
James, B. M., (1970). “Euphausiacean crustacea,” in Contributions on the Biologyof the Gulf of Mexico, eds W. E. Pequegnat, and F. A. Chase, Jr.(Houston: GulfPublishing), 205–229.
Jayalakshmi, K. J., Jasmine, P., Muraleedharan, K. R., Prabhakaran, M. P.,Habeebrehman, H., Jacob, J., et al. (2011). Aggregation of Euphausia sibogaeduring summer monsoon along the southwest coast of India. J. Mar. Biol.10:945734. doi: 10.1155/2011/945734
Jayaraman, K. (1999). A Statistical Manual for Forestry Research. Bangkok: Foodand Agricultural Organization of the United Nations, Regional Office for Asiaand the Pacific, 1–231.
Jiang, Z., Huang, Y., Chen, Q., Zeng, J., and Xu, X. (2012). Acute toxicity of crudeoil water accommodated fraction on marine copepods: the relative importanceof acclimatization temperature and body size. Mar. Environ. Res. 81, 12–17.doi: 10.1016/j.marenvres.2012.08.003
Kinsey, S. T., and Hopkins, T. L. (1994). Trophic strategies of euphausiids in alow-latitude ecosystem. Mar. Biol. 118, 651–661. doi: 10.1007/bf00347513
Lindén, O. (1976). Effects of oil on the amphipod Gammarus oceanicus. Environ.Pollut. (1970) 10, 239–250. doi: 10.1016/j.toxicon.2013.11.015
Mikkelsen, P. (1987). The Euphausiacea of eastern Florida (Crustacea:Malacostraca). Proc. Biol. Soc. 100, 275–295.
Moore, H. B. (1950). The relation between the scattering layer and theEuphausiacea. Biol. Bull. 99, 181–212. doi: 10.2307/1538738
Murawski, S. A., Fleeger, J. W., Patterson, W. F., Hu, C., Daly, K., Romero,I., et al. (2016). How did the Deepwater Horizon oil spill affect coastal andcontinental shelf ecosystems of the Gulfof Mexico? Oceanography 29, 160–173.doi: 10.5670/oceanog.2016.80
Nichols, D. (2018). A Temporal Analysis of a Deep-Pelagic Crustacean Assemblage(Decapoda: Caridea: Oplophoridae and Pandalidae) in the Gulf of Mexico Afterthe Deep Water Horizon Oil Spill. Ph.D. thesis, Nova Southeastern University,Fort Lauderdale, FL. doi: 10.2307/1538738
Omori, M., and Ikeda, T. (1984). Methods in marine zooplankton ecology. J. Mar.Biol. Assoc. U. K. 65, 562–894.
Reddy, C. M., Arey, J. S., Seewald, J. S., Sylva, S. P., Lemkau, K. L., Nelson,R. K., et al. (2011). Composition and fate of gas and oil released to the watercolumn during the Deepwater Horizon oil spill. Proc. Nat. Acad. Sci. U.S.A. 109,20229–20234. doi: 10.1073/pnas.1101242108
Reid, S. B., Hirota, J., Young, R. E., and Hallacher, L. E. (1991). Mesopelagic-boundary community in Hawaii: micronekton at the interface betweenneritic and oceanic ecosystems. Mar. Biol. 109, 427–440. doi: 10.1007/BF01313508
Roger, C. (1978). Bioecological Sheets on Tropical Pacific Euphausiids. Initiations –Documentations Techniques, Paris (ORSTOM) 36. Paris: IRD Editions, 1–81.
Romero, I. C., Sutton, T., Carr, B., Quintana-Rizzo, E., Ross, S. W., Hollander,D. J., et al. (2018). Decadal assessment of polycyclic aromatic hydrocarbonsin mesopelagic fishes from the Gulf of Mexico reveals exposure to oil-derivedsources. Environ. Sci. Technol. 52, 10985–10996. doi: 10.1021/acs.est.8b02243
Ryan, J. P., Zhang, Y., Thomas, H., Rienecker, E. V., Nelson, R. K., and Cummings,S. R. (1‘2011). “A high-resolution survey of a deep hydrocarbon plume inthe Gulf of Mexico during the 2010 Macondo blowout,” in Monitoring andModeling the Deepwater Horizon Oil Spill: A Record-Breaking Enterprise.Geophysical Monograph Series, Vol. 195, eds Y. Liu, A. Macfadyen, Z.-G. Ji, andR. H. Weisberg, 63–75. doi: 10.1029/2011GM001106
Schmidt-Nielsen, K. (1984). Scaling: Why is Animal Size so Important? Cambridge:Cambridge University Press.
Schramm, M. J. (2007). Tiny Krill: Giants in Marine Food Chain. NOAA NationalMarine Sanctuary Program. Available at: http://sanctuaries.noaa.gov/news/pdfs/sanctuarywatch/sw8_3.pdf (accessed December 12, 2013).
Springer, S., and Bullis, H. R. Jr. (1956). Collections by the Oregon in the Gulf ofMexico. List of Crustaceans, Mollusks, and Fishes Identified From CollectionsMade by the Exploratory Fishing Vessel Oregon in the Gulf of Mexico andAdjacent Seas 1950 Through 1955. United States Department of the Interior,Special Scientific Report, Fisheries, 196. Washington, DC: U.S. Department ofthe Interior, Bureau of Commercial Fisheries, 1–134.
Sutton, T. T. (2013). Vertical ecology of the pelagic ocean: classical patterns andnew perspectives. J. Fish. Biol. 83, 1508–1527. doi: 10.1111/jfb.12263
Sutton, T. T., and Hopkins, T. L. (1996). Trophic ecology of the stomiid (Pisces:Stomiidae) fish assemblage of the eastern Gulf of Mexico: strategies, selectivityand impact of a top mesopelagic predator group. Mar. Biol. 127, 179–192.doi: 10.1007/bf00942102
Whitehead, A., Dubansky, B., Bodinier, C., Garcia, T.I, Miles, S., Pilley, C., et al.(2012). Genomic and physiological footprint of the Deepwater Horizon oilspill on resident marsh fishes. Proc. Natl. Acad. Sci. U.S.A. 109, 20298–20302.doi: 10.1073/pnas.1109545108
Wiebe, P. H., Burk, K. H., Boyd, S. H., and Morton, A. W. (1976). Amultiple opening-closing net and environmental sensing system for samplingzooplankton. J. Mar. Res. 34, 313–326.
Conflict of Interest: The authors declare that the research was conducted in theabsence of any commercial or financial relationships that could be construed as apotential conflict of interest.