The Vocal Tract in Singing Brad H. Story Department of Speech, Language, and Hearing Sciences University of Arizona Tucson, AZ Citation: This chapter was published in The Oxford Handbook of Singing, G. Welch, D.M. Howard, & J. Nix, Eds., (2016). DOI: 10.1093/oxfordhb/9780199660773.013.012 Abstract Precise control of the vocal tract configuration is of critical importance for producing the desired acoustic char- acteristics of singing. The pattern of acoustic resonances generated by a given vocal tract shape influences vowel identity, voice quality (timbre), and, to some degree, the spectral characteristics of the voice excitation source itself. This chapter is broadly focused on how the vocal tract shape can be tuned (i.e., modified) in subtle ways to enhance the signal radiated from a singer to an audience. Specifically, the vocal tract shape contributions to the “singing formant,” enhancement of vibrato, and harmonic/formant alignment are discussed. Keywords: vocal tract, acoustic resonances, vowel identity, voice quality, singing formant 1 Introduction “The upper part of the larynx, together with the pharynx,... and mouth, constitutes a passage-way, or tube, of variable size and shape, through which the vibrating current of air is passed. It is here that the voice is moulded, so to speak, on its way to the ear, and the shape of the passage-way largely determines the quality or timbre of the voice.” A.G. Bell, Mechanism of Speech, 1911, p. 18. Creating music with an instrument requires the use of a precision device (e.g., violin, trumpet, etc) that has been hand-crafted or manufactured for the exclusive purpose of generating sounds with a specific quality or timbre. In contrast, creating music by singing requires humans to utilize the same anatomical structures that are used to perform other tasks such as speaking, breathing, chewing, and swallowing. Thus, a singer cannot customize the structure of the instrument, but rather can only modify, through training and learning, the ways in which it is used. This results in an acoustic waveform that is a complex aural portrait consisting of the elements of song (notes, tempo, melody, etc.) superimposed on a unique acoustic “background” or “setting” determined by the singer’s anatomy and use of it. Specifically, singing is dominated by voiced sounds which are initiated by the vibration of the vocal folds. These vibrations create a source of oscillating airflow that acoustically encodes information relevant to the vibratory character of the vocal fold tissue. In turn, this time-varying airflow induces a pressure wave that propagates through the airspace of the vocal tract formed by the relative positions of the tongue, jaw, lips, and velum, and acquires information about the shape of the airspace that is eventually carried along to a listener’s ear. The final output signal contains acoustic features that reveal information about the generation of the sound at its source as well as the vocal tract structure through which the source sound has traveled. Precise control of the vocal tract configuration is of critical importance for producing the desired acoustic charac- teristics of singing. The pattern of acoustic resonances generated by a given vocal tract shape influences vowel identity,
Transcript
The Vocal Tract in SingingBrad H. StoryDepartment of Speech, Language, and Hearing SciencesUniversity of ArizonaTucson, AZ
Citation: This chapter was published in The Oxford Handbook of Singing, G. Welch, D.M. Howard,& J. Nix, Eds., (2016). DOI: 10.1093/oxfordhb/9780199660773.013.012
AbstractPrecise control of the vocal tract configuration is of critical importance for producing the desired acoustic char-
acteristics of singing. The pattern of acoustic resonances generated by a given vocal tract shape influences vowelidentity, voice quality (timbre), and, to some degree, the spectral characteristics of the voice excitation source itself.This chapter is broadly focused on how the vocal tract shape can be tuned (i.e., modified) in subtle ways to enhance thesignal radiated from a singer to an audience. Specifically, the vocal tract shape contributions to the “singing formant,”enhancement of vibrato, and harmonic/formant alignment are discussed.
“The upper part of the larynx, together with the pharynx,... and mouth, constitutes a passage-way, or
tube, of variable size and shape, through which the vibrating current of air is passed. It is here that the
voice is moulded, so to speak, on its way to the ear, and the shape of the passage-way largely determines
the quality or timbre of the voice.” A.G. Bell, Mechanism of Speech, 1911, p. 18.
Creating music with an instrument requires the use of a precision device (e.g., violin, trumpet, etc) that has been
hand-crafted or manufactured for the exclusive purpose of generating sounds with a specific quality or timbre. In
contrast, creating music by singing requires humans to utilize the same anatomical structures that are used to perform
other tasks such as speaking, breathing, chewing, and swallowing. Thus, a singer cannot customize the structure of
the instrument, but rather can only modify, through training and learning, the ways in which it is used. This results
in an acoustic waveform that is a complex aural portrait consisting of the elements of song (notes, tempo, melody,
etc.) superimposed on a unique acoustic “background” or “setting” determined by the singer’s anatomy and use of
it. Specifically, singing is dominated by voiced sounds which are initiated by the vibration of the vocal folds. These
vibrations create a source of oscillating airflow that acoustically encodes information relevant to the vibratory character
of the vocal fold tissue. In turn, this time-varying airflow induces a pressure wave that propagates through the airspace
of the vocal tract formed by the relative positions of the tongue, jaw, lips, and velum, and acquires information about
the shape of the airspace that is eventually carried along to a listener’s ear. The final output signal contains acoustic
features that reveal information about the generation of the sound at its source as well as the vocal tract structure
through which the source sound has traveled.
Precise control of the vocal tract configuration is of critical importance for producing the desired acoustic charac-
teristics of singing. The pattern of acoustic resonances generated by a given vocal tract shape influences vowel identity,
and sound quality (timbre). This chapter will focus on how the vocal tract shape can be globally shaped for vowel pro-
duction and locally tuned (i.e., modified) in subtle ways to enhance the signal radiated from a singer to an audience.
Specifically, the vocal tract shape contributions to vowel production, the “singing formant,” and harmonic/formant
alignment will be addressed.
2 Representations of the Human Vocal Tract
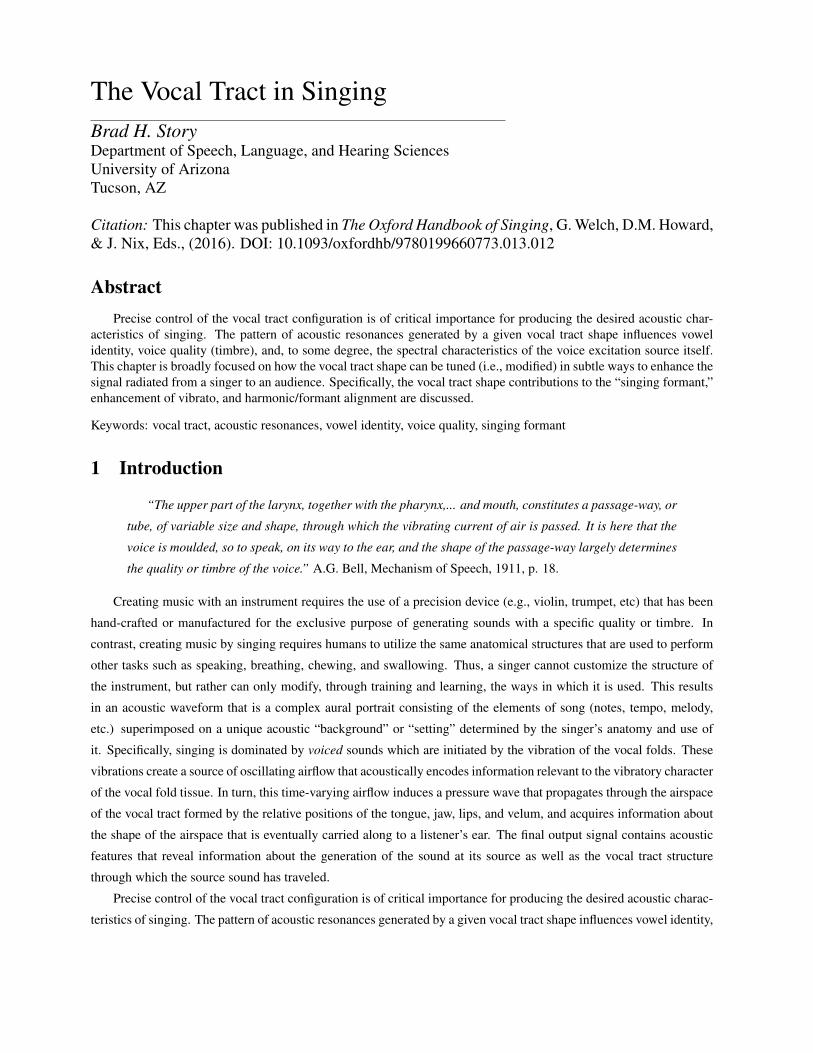
From an articulatory perspective, singing is often discussed in terms of the individual articulators (Fig. 1). For
instance, the tongue position could be said to be forward and high for production of the vowel /i/ or backward and low
for an /A/, the lips may be rounded when producing /u/ but spread for an /i/, or the larynx may be raised or lowered
to alter the color of a given vowel. From an acoustic perspective, however, it is not the tongue, mandible, larynx, lips,
and velum that are individually relevant, but rather how their relative positions contribute to the overall shape of the
airspace that extends from the vocal folds to the lips. This airspace is called the vocal tract, and is the structure that
generates the acoustic characteristics of the sound pressure produced by a singer. Thus, precise control of the vocal
tract shape is essential for producing a desired quality of sound.
larynx
trachea
velum
lips tongue
epiglottis mandible
Figure 1: Midsagittal diagram of the articulators.
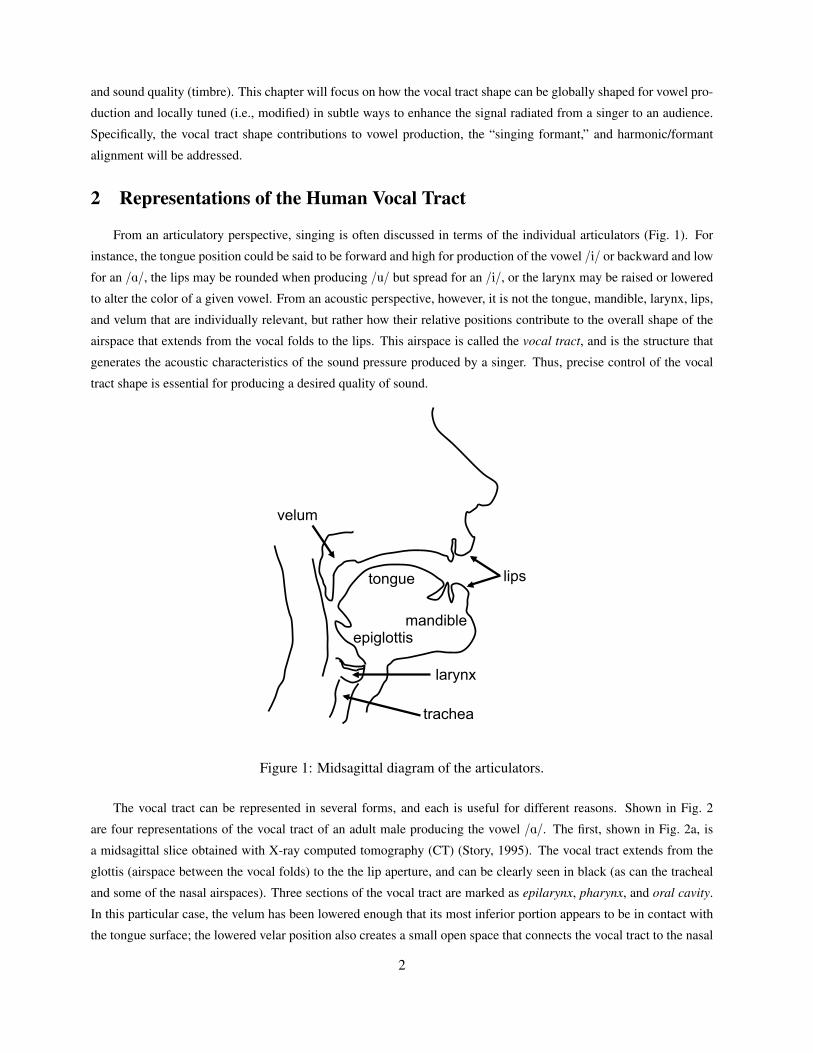
The vocal tract can be represented in several forms, and each is useful for different reasons. Shown in Fig. 2
are four representations of the vocal tract of an adult male producing the vowel /A/. The first, shown in Fig. 2a, is
a midsagittal slice obtained with X-ray computed tomography (CT) (Story, 1995). The vocal tract extends from the
glottis (airspace between the vocal folds) to the the lip aperture, and can be clearly seen in black (as can the tracheal
and some of the nasal airspaces). Three sections of the vocal tract are marked as epilarynx, pharynx, and oral cavity.
In this particular case, the velum has been lowered enough that its most inferior portion appears to be in contact with
the tongue surface; the lowered velar position also creates a small open space that connects the vocal tract to the nasal
2
airspaces thus producing a nasalized vowel, albeit unintended here.
Although a midsagittal view is useful for relating the articulator positions to the vocal tract shape, it cannot provide
the variation in cross-sectional area along the vocal tract length1. Instead, a volume of slices containing the relevant
portions of the head and neck is needed such that the vocal tract can be reconstructed as a three-dimensional object.
Fig. 2b demonstrates a 3D reconstruction based on the same image set containing the midsagittal slice (Fig. 2a).
The vocal tract is shown displaced from the tissue and bone, and represents the true shape of the airspace in three
dimensions. The most inferior portion is the upper part of the trachea which then narrows at the location of the vocal
folds; the wing-like structures connected to the lower part of the vocal tract are the piriform sinuses.
trachea
epilarynx
phar
ynx
oral cavity
velu
m
vocal folds
lips
(a) (b)
0 5 10 150
1
2
3
4
5
6
7
8
Distance from Glottis (cm)
Are
a (c
m2 )
pharynxepilarynx oral cavity lips
−4 −2 0 2 4 6 80
2
4
6
8
10
12
P−A (cm)
I−S
(cm
)
glottis
epilarynx
pharynx
oral cavity
(c) (d)
Figure 2: Four graphical representations of the vocal tract of an adult male speaker based on images fromX-ray CT. (a) Single midsagittal slice of an /A/ vowel with various part of airspace labeled, (b) 3D recon-struction of the vocal tract, (c) area function measured from the 3D reconstruction in (b), and (d) pseudo-midsagittal plot generated from equivalent diameters of the area function.
3
Acoustic characteristics of the vocal tract are typically studied by simplifying the 3D shape to an area function.
This is obtained by measuring the cross-sectional area of oblique sections perpendicular to a centerline extending from
the glottis (vocal folds) to the lips. The area function for the 3D vocal tract (Fig. 2b) is plotted in Fig. 2c. The stairstep
quality of the plot exemplies that the area function discretizes the vocal tract into a series of concatenated “tubelets,”
however, it is often more visually appealing to simply plot a continuous line through the data points as is also shown
in the figure. It is noted that the piriform sinuses are not represented by the area function; they can be separately
measured (c.f., Story, 1996,1998; Dang and Honda, 1997) but will not be considered in this chapter. It is also the case
that the area function representation does not explicitly include the ≈ 90 degree bend in the vocal tract. Although the
bend is of great biomechanical importance for efficiently changing the vocal tract shape, it does not affect the acoustic
characteristics significantly, at least in the typical frequency range of interest for singing and speaking (i.e, less than
5000 Hz). It is, however, often more intuitively appealing to see the vocal tract shape presented in an anatomically-
relevant coordinate system. In Fig. 2d is the same area function as in Fig. 2c but shown as equivalent diameters plotted
along the two-dimensional vocal tract centerline. The light dashed lines are the diameters and the heavy solid lines
generate an outline of the vocal tract shape. Since this does not represent a true midsagittal plane it will be referred to
here as a pseudo-midsagittal plot (c.f., Story et al., 2001). Pseudo-midsagittal plots and area functions will be used in
subsequent sections to describe and explain the relation of the vocal tract structure to acoustic characteristics.
3 Model of Human Sound Production
Vowels and vowel-like sounds are produced by the combination of a sound source and a sound filter (e.g., Fant,
1960), where the source signal is the succession of airflow pulses generated by the periodic opening and closing of
the space between the vocal folds (i.e., the glottis) as they vibrate. This signal is typically referred to as the glottal
flow, where the temporal duration of each flow pulse determines the fundamental frequency (F0) of a particular vowel
sound. In addition to the F0, the source signal contains a series of harmonic components that are related to the F0
by integer multiples (e.g., the second harmonic is 2F0, the third harmonic is 3F0, ...). The primary filter is the vocal
tract which, as discussed in the previous section, is comprised of the epilaryngeal, pharyngeal and oral cavities. Any
particular shape of the vocal tract produces a pattern of acoustic resonances. As the source signal (wave) travels
through the vocal tract, the resonances have the effect of enhancing the amplitude of some harmonics of the source
while suppressing others. Hence, the output sound results from the interaction of the source with the filter.
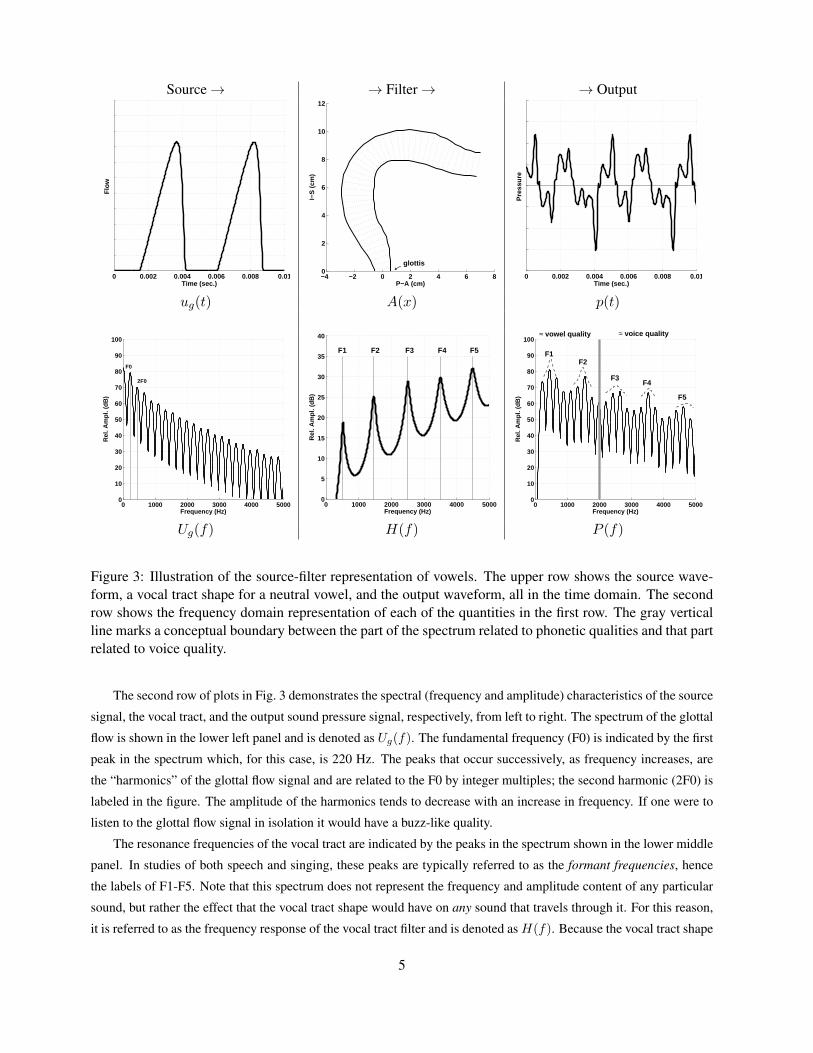
The source-filter representation is illustrated graphically in Fig. 3 with signals generated by a speech production
model2. Two flow pulses (cycles) of the glottal airflow signal ug(t) are plotted in the upper left panel; for this example,
they are repeated every 4.5 milliseconds, which is equivalent to a fundamental frequency of 220 Hz (A3 on the equal-
tempered scale). A vocal tract shape A(x) is shown in pseudo-midsagittal form in the upper middle panel of the
figure; for demonstration purposes it has been configured to have a fairly uniform cross-section along the entire tract
length. The glottal flow pulses enter the vocal tract at the point labeled “glottis” and generate sound pressure waves
that propagate through it, reflecting and transmitting various amounts energy at any change in cross-sectional area.
The pressure that is finally generated at the lip end of the vocal tract radiates outward from the singer. An output
pressure waveform p(t) is shown in the upper right panel and is analogous to a signal that could be obtained with a
microphone held near a singer’s lips. Note that effect of the vocal tract as a filter is to transform the relatively simple
glottal flow signal into a more complex pressure wave that carries with it “information” about the shape of the vocal
tract.
4
Source→ → Filter→ → Output
0 0.002 0.004 0.006 0.008 0.01Time (sec.)
Flo
w
−4 −2 0 2 4 6 80
2
4
6
8
10
12
P−A (cm)
I−S
(cm
)
glottis←0 0.002 0.004 0.006 0.008 0.01
Time (sec.)
Pre
ssur
e
ug(t) A(x) p(t)
0 1000 2000 3000 4000 50000
10
20
30
40
50
60
70
80
90
100
Frequency (Hz)
Rel
. Am
pl. (
dB)
F0
2F0
0 1000 2000 3000 4000 50000
5
10
15
20
25
30
35
40
Frequency (Hz)
Rel
. Am
pl. (
dB)
F1 F2 F3 F4 F5
0 1000 2000 3000 4000 50000
10
20
30
40
50
60
70
80
90
100
Frequency (Hz)R
el. A
mpl
. (dB
)
F1F2
F3F4
F5
≈ vowel quality ≈ voice quality
Ug(f) H(f) P (f)
Figure 3: Illustration of the source-filter representation of vowels. The upper row shows the source wave-form, a vocal tract shape for a neutral vowel, and the output waveform, all in the time domain. The secondrow shows the frequency domain representation of each of the quantities in the first row. The gray verticalline marks a conceptual boundary between the part of the spectrum related to phonetic qualities and that partrelated to voice quality.
The second row of plots in Fig. 3 demonstrates the spectral (frequency and amplitude) characteristics of the source
signal, the vocal tract, and the output sound pressure signal, respectively, from left to right. The spectrum of the glottal
flow is shown in the lower left panel and is denoted as Ug(f). The fundamental frequency (F0) is indicated by the first
peak in the spectrum which, for this case, is 220 Hz. The peaks that occur successively, as frequency increases, are
the “harmonics” of the glottal flow signal and are related to the F0 by integer multiples; the second harmonic (2F0) is
labeled in the figure. The amplitude of the harmonics tends to decrease with an increase in frequency. If one were to
listen to the glottal flow signal in isolation it would have a buzz-like quality.
The resonance frequencies of the vocal tract are indicated by the peaks in the spectrum shown in the lower middle
panel. In studies of both speech and singing, these peaks are typically referred to as the formant frequencies, hence
the labels of F1-F5. Note that this spectrum does not represent the frequency and amplitude content of any particular
sound, but rather the effect that the vocal tract shape would have on any sound that travels through it. For this reason,
it is referred to as the frequency response of the vocal tract filter and is denoted asH(f). Because the vocal tract shape
5
in this case is fairly uniform, the resonance or formant frequencies are nearly equally spaced at intervals of 1000 Hz
along the frequency axis. This could be considered a neutral vowel and would be labeled phonetically as either /@/ or
/2/.
The output pressure spectrum P (f), shown in the lower right panel, is the combination of the glottal flow spectrum
and frequency response of the vocal tract. Mathematically, P (f) is the product of Ug(f)H(f) (because the spectra are
shown logarithmically in dB, the amplitude at each frequency in the output spectrum is the sum of the amplitudes each
frequency in the other two lower panels). The fundamental frequency and all of the harmonics are present in the output
spectrum, but their amplitudes have been modified by the vocal tract resonances (formant frequencies); harmonics near
a formant frequency are enhanced in amplitude, while those distant from the formants are suppressed. In other words,
the harmonics of the glottal flow spectrum sample the frequency response of the vocal tract to express, in the output,
both the harmonic content of the glottal source and the acoustic resonance pattern of the vocal tract shape.
It is noted that the terms formant and resonance can create some confusion if not properly defined. Fant (1960)
discussed the differences of the two words where formant is defined as a peak of enhanced spectral energy in the
output spectrum and resonance is a natural frequency of the vocal tract. Since that time it has been generally accepted
that a formant measured from a spectrum (or spectrogram) is an estimate of a resonance frequency. Stevens (2000,
p.131) states that “The poles represent the complex natural frequencies of the vocal tract. The imaginary parts indicate
the frequencies at which oscillations would occur in the absence of excitation and are called the formant frequencies.
They are normally designated as F1, F2, ... Fn, in increasing order of frequency.” Thus, in most cases the resonance
frequencies of the vocal tract are essentially the formants. This definition, however, is largely based on speech research
rather than singing, and there are some situations of the latter that may generate spectra with the appearance of a single
broad formant that is in fact generated by close proximity of several resonances.
4 Controlling the vocal tract for singing
“Vocalization being essentially vowelization, it is the vowel that is the real carrier of the tone. Con-
sonants ... are to be respected, but they must not become predominant within the line... [and] need not
play villain to the heroic vowel...” Richard Miller, On the Art of Singing, p. 20
Singing is dominated by vowels because they are produced with open vocal tract configurations that allow for a
continuous flow of sound. In contrast, most consonants, in one way or another, require a severe constriction of the vocal
tract and create a partial or complete interruption of the sound stream. Thus, the musical features that characterize
singing are largely expressed through the precise control of the vocal tract during vowel production.
Vowel identity is largely based on the first two formant frequencies (Peterson & Barney, 1952; Hillenbrand et
al., 1995), although the third formant may also contribute in some cases. To demonstrate how the vocal tract can be
shaped for different purposes, an artificial division has been superimposed on the the output spectrum in Fig. 3 (lower
right panel). The gray vertical line located at 2000 Hz is intended to suggest that much of the vocal tract shaping for
vowel quality (i.e., phonetic aspects) is directed at positioning F1 and F2, whereas the contribution of the vocal tract
to voice quality, or what is often referred to as “timbre,” is represented in the upper formants F3, F4, and F5. The next
several sections explore how each of these spectral regions can be controlled by overall shaping of the vocal tract for
particular vowels, as well as precise, but subtle, tuning of various parts of the vocal tract to enhance the sound quality.
6
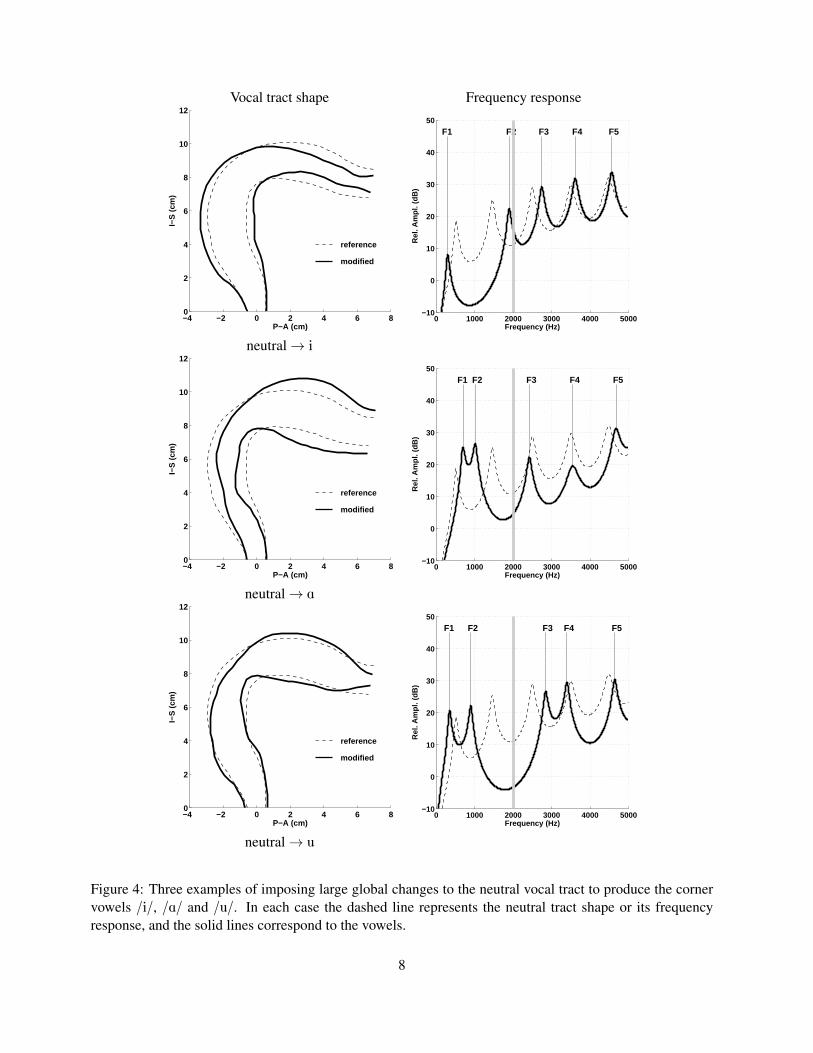
4.1 Shaping the vocal tract for production of vowels
Using the neutral vocal tract shape of Fig. 3 as a starting point and reference, three new tract shapes have been
generated that shift the F1 and F2 formant frequencies into positions along the frequency axis that would roughly
correspond to the vowels /i/, /A/, and /u/. The pseudo-midsagittal plots and frequency response functions for each
are shown in Fig. 4, where the dashed lines indicate the shape or frequency response of the neutral reference.
These particular shapes were created with a computer algorithm that carefully altered the vocal tract configuration
until a desired set of F1 and F2 formant frequencies were achieved (Story, 2006) (for these cases, the other formants
were unconstrained). The /i/ vowel in the upper row of Fig. 4 is characterized acoustically by a low F1 and a high
F2, which is produced, relative to the neutral shape, by constricting the oral cavity and expanding the pharynx. In
contrast, the /A/ vowel has a high F1 and and low F2, and is produced by expanding the oral cavity and constricting
the pharynx. Both F1 and F2 have relatively low values for the /u/ vowel and are generated by constricting a section
of the vocal tract near the lips and in the velar region, as well as slightly expanding both the oral cavity and the lower
part of the pharynx.
It is sometimes necessary in singing to modify a vowel in order to accommodate a particular note. For example,
if a musical score prescribed that the note F4, which requires a fundamental frequency of 349 Hz, be sung as an /i/
vowel, a singer could not use the /i/ vocal tract shape in Fig. 4 without sacrificing vowel identity and possibly stability
of phonation (Titze & Story, 1997). This is because the F1 of that vocal tract configuration is 300 Hz, which is below
the F0 of the prescribed note. The solution is to slightly modify the /i/ shape such that F1 is increased just enough to
be at a higher frequency than the target F0. A modification of the /i/ vowel is shown in Fig. 5 where the oral cavity
has been expanded to release the primary constriction and the pharynx has slightly enlarged. These changes have the
main desired effect of shifting the F1 from 300 Hz to 450 Hz.
Although these particular vocal tract shapes were generated through artificial means, they demonstrate the typical
canonical configuration for these vowels. The main point is that positioning the first two formant frequencies for vowel
production requires fairly large changes in the cross-sectional over most of the vocal tract length. That is, shifting from
one vowel to another necessitates global changes in vocal tract shape. Interestingly, the epilaryngeal portion of the
vocal tract was left nearly unchanged relative to the neutral shape when creating the three new vowels. As will be
demonstrated in the next section, it is this region of the vocal tract that can be used to “tune” the overall sound quality
while maintaining the desired vowel.
4.2 Tuning the vocal tract to enhance sound quality
The overall sound quality of the voice can be significantly influenced by the relative locations of acoustic reso-
nances F3, F4, and F5. It is in this region of the spectrum that the so-called “singer’s formant” or “singing formant”
typically appears. An example can be seen in the long-time average spectrum (LTAS) shown in Fig. 6 for a tenor. This
“formant” is a broad peak of spectral energy but is generally produced by a cluster of two or more resonances of the
vocal tract that are in close proximity to each other.
Bartholomew (1934) seems to have been the first to quantitatively describe the spectral prominence at about
2800-2900 Hz in vowels sung by males. He called it the “high formant” and suggested that it exists “...regardless
of whether produced by a tenor or baritone,... and regardless of fundamental pitch [F0], the vowel or intensity.”
Although somewhat perplexed by its apparent existence in all the male singers he studied, Bartholomew narrowed
the origin of the high formant to the portion of the vocal tract between the “rima glottidis [glottis]” and the top rim
7
Vocal tract shape Frequency response
−4 −2 0 2 4 6 80
2
4
6
8
10
12
P−A (cm)
I−S
(cm
)
modified
reference
0 1000 2000 3000 4000 5000−10
0
10
20
30
40
50
F1 F2 F3 F4 F5
Frequency (Hz)
Rel
. Am
pl. (
dB)
neutral→ i
−4 −2 0 2 4 6 80
2
4
6
8
10
12
P−A (cm)
I−S
(cm
)
modified
reference
0 1000 2000 3000 4000 5000−10
0
10
20
30
40
50
F1 F2 F3 F4 F5
Frequency (Hz)
Rel
. Am
pl. (
dB)
neutral→ A
−4 −2 0 2 4 6 80
2
4
6
8
10
12
P−A (cm)
I−S
(cm
)
modified
reference
0 1000 2000 3000 4000 5000−10
0
10
20
30
40
50
F1 F2 F3 F4 F5
Frequency (Hz)
Rel
. Am
pl. (
dB)
neutral→ u
Figure 4: Three examples of imposing large global changes to the neutral vocal tract to produce the cornervowels /i/, /A/ and /u/. In each case the dashed line represents the neutral tract shape or its frequencyresponse, and the solid lines correspond to the vowels.
8
Vocal tract shape Frequency response
−4 −2 0 2 4 6 80
2
4
6
8
10
12
P−A (cm)
I−S
(cm
)
modified
reference
0 1000 2000 3000 4000 5000−10
0
10
20
30
40
50
F1 F2 F3 F4 F5
Frequency (Hz)
Rel
. Am
pl. (
dB)
i→ imod
Figure 5: Demonstration of modifying an /i/ to raise F1.
0 1000 2000 3000 4000 5000−50
−40
−30
−20
−10
0
10
Frequency (Hz)
Rel
. Am
pl. (
dB)
Singing Formant
Figure 6: Long time average spectrum (LTAS) of a tenor. A singing formant is apparent in the range of2500-3500 Hz.
9
−4 −2 0 2 4 6 80
2
4
6
8
10
12
P−A (cm)
I−S
(cm
)
0 1000 2000 3000 4000 5000−10
0
10
20
30
40
50
F1 F2 F3 F4 F5
Frequency (Hz)
Rel
. Am
pl. (
dB)
(a) (b)
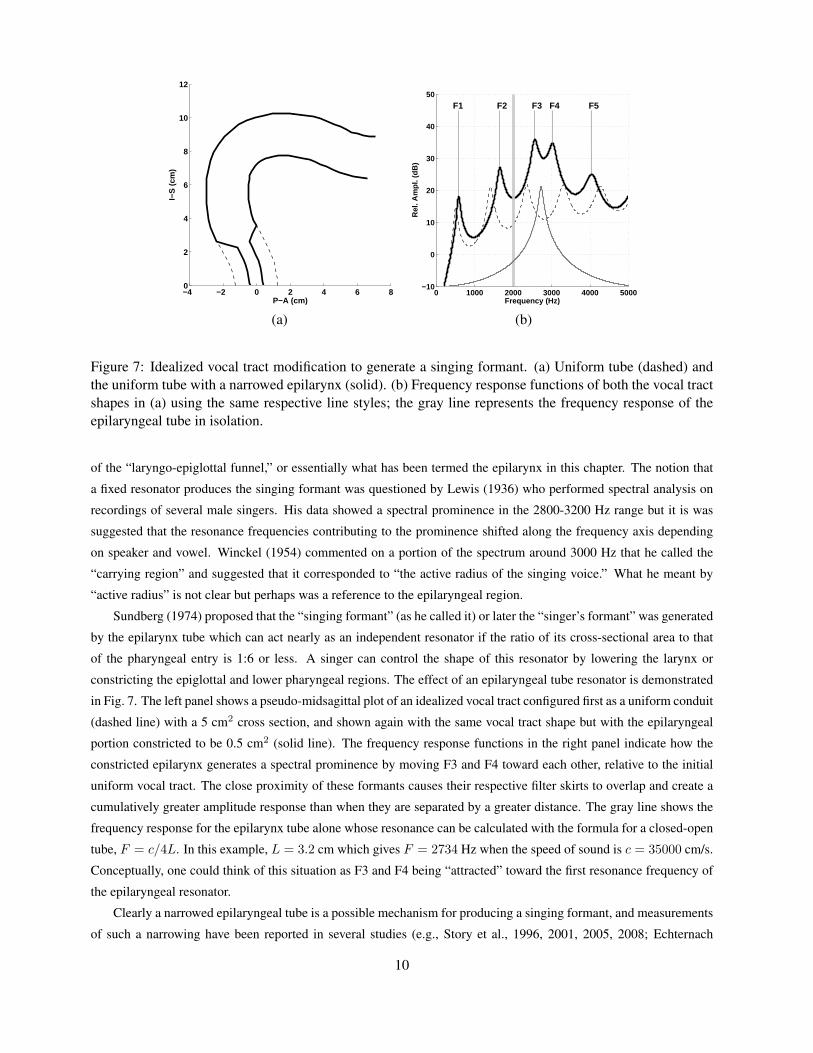
Figure 7: Idealized vocal tract modification to generate a singing formant. (a) Uniform tube (dashed) andthe uniform tube with a narrowed epilarynx (solid). (b) Frequency response functions of both the vocal tractshapes in (a) using the same respective line styles; the gray line represents the frequency response of theepilaryngeal tube in isolation.
of the “laryngo-epiglottal funnel,” or essentially what has been termed the epilarynx in this chapter. The notion that
a fixed resonator produces the singing formant was questioned by Lewis (1936) who performed spectral analysis on
recordings of several male singers. His data showed a spectral prominence in the 2800-3200 Hz range but it is was
suggested that the resonance frequencies contributing to the prominence shifted along the frequency axis depending
on speaker and vowel. Winckel (1954) commented on a portion of the spectrum around 3000 Hz that he called the
“carrying region” and suggested that it corresponded to “the active radius of the singing voice.” What he meant by
“active radius” is not clear but perhaps was a reference to the epilaryngeal region.
Sundberg (1974) proposed that the “singing formant” (as he called it) or later the “singer’s formant” was generated
by the epilarynx tube which can act nearly as an independent resonator if the ratio of its cross-sectional area to that
of the pharyngeal entry is 1:6 or less. A singer can control the shape of this resonator by lowering the larynx or
constricting the epiglottal and lower pharyngeal regions. The effect of an epilaryngeal tube resonator is demonstrated
in Fig. 7. The left panel shows a pseudo-midsagittal plot of an idealized vocal tract configured first as a uniform conduit
(dashed line) with a 5 cm2 cross section, and shown again with the same vocal tract shape but with the epilaryngeal
portion constricted to be 0.5 cm2 (solid line). The frequency response functions in the right panel indicate how the
constricted epilarynx generates a spectral prominence by moving F3 and F4 toward each other, relative to the initial
uniform vocal tract. The close proximity of these formants causes their respective filter skirts to overlap and create a
cumulatively greater amplitude response than when they are separated by a greater distance. The gray line shows the
frequency response for the epilarynx tube alone whose resonance can be calculated with the formula for a closed-open
tube, F = c/4L. In this example, L = 3.2 cm which gives F = 2734 Hz when the speed of sound is c = 35000 cm/s.
Conceptually, one could think of this situation as F3 and F4 being “attracted” toward the first resonance frequency of
the epilaryngeal resonator.
Clearly a narrowed epilaryngeal tube is a possible mechanism for producing a singing formant, and measurements
of such a narrowing have been reported in several studies (e.g., Story et al., 1996, 2001, 2005, 2008; Echternach
10
et al., 2011). Other researchers, however, have reported a singing formant to exist in the spectra of singers without
an apparent lengthening and narrowing of the epilarynx. Using magnetic resonance imaging (MRI), stroboscopy,
and acoustic analysis, Detweiler (1994) showed that the singers in her study produced a spectral prominence in the
2800-3200 Hz range, but did not achieve a 1:6 ratio of cross-sectional area of the epilarynx to the lower pharynx. In
addition, Wang (1986) showed that a spectral prominence could be achieved with both high and low larynx positions.
Both studies suggest that the singing formant can be produced by some modification of the vocal tract other than
lengthening and narrowing the epilarynx.
A different approach to understanding the singing formant can be developed by consideration of acoustic sensitiv-
ity functions. Choosing the /A/ vowel configuration from Fig. 4 as a starting point, several steps will be described that
allow for modification to the shape so that a singing formant will be generated (note that the frequency response in
Fig. 4 for the /A/ shows F3, F4, and F5 to be widely spaced rather than clustered as is desired for the singing formant).
Acoustic sensitivity functions (Fant & Pauli, 1974) can be calculated for each formant of any given area function as
the difference between the potential and kinetic energy that exists along the vocal tract length (and then normalized to
the total energy). When viewed as a function of distance from the glottis they can be used to predict how a particular
change to the vocal tract shape will shift a particular formant.
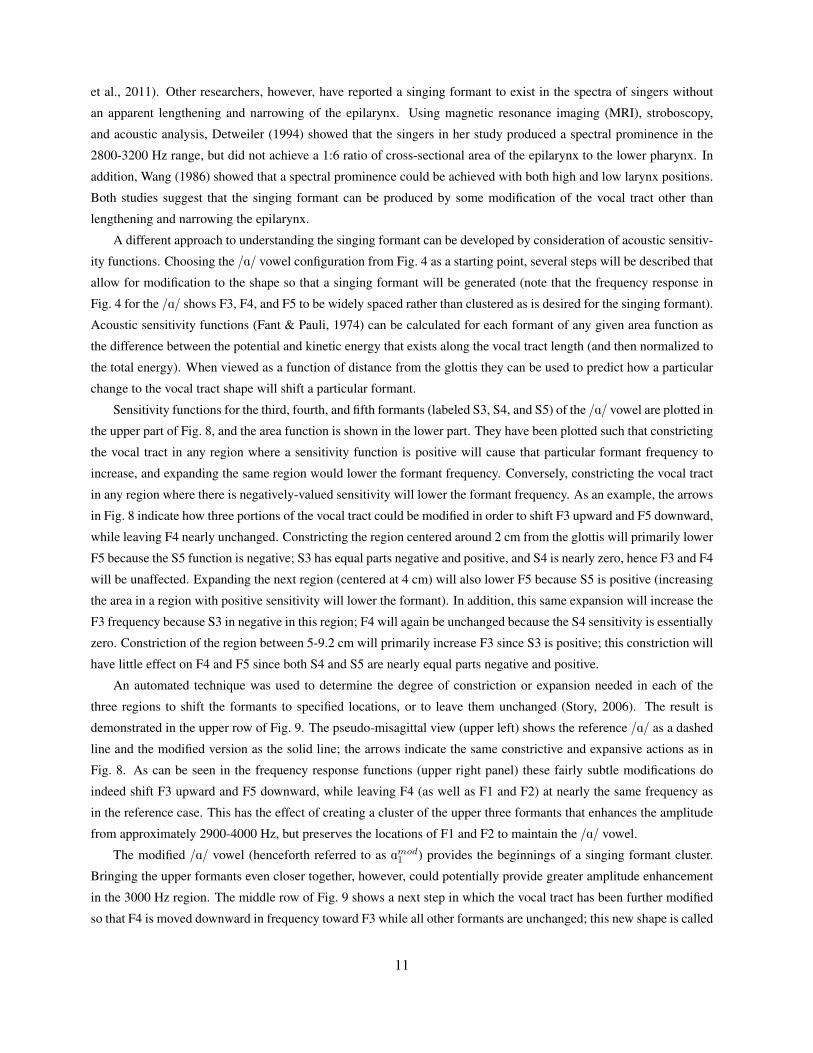
Sensitivity functions for the third, fourth, and fifth formants (labeled S3, S4, and S5) of the /A/ vowel are plotted in
the upper part of Fig. 8, and the area function is shown in the lower part. They have been plotted such that constricting
the vocal tract in any region where a sensitivity function is positive will cause that particular formant frequency to
increase, and expanding the same region would lower the formant frequency. Conversely, constricting the vocal tract
in any region where there is negatively-valued sensitivity will lower the formant frequency. As an example, the arrows
in Fig. 8 indicate how three portions of the vocal tract could be modified in order to shift F3 upward and F5 downward,
while leaving F4 nearly unchanged. Constricting the region centered around 2 cm from the glottis will primarily lower
F5 because the S5 function is negative; S3 has equal parts negative and positive, and S4 is nearly zero, hence F3 and F4
will be unaffected. Expanding the next region (centered at 4 cm) will also lower F5 because S5 is positive (increasing
the area in a region with positive sensitivity will lower the formant). In addition, this same expansion will increase the
F3 frequency because S3 in negative in this region; F4 will again be unchanged because the S4 sensitivity is essentially
zero. Constriction of the region between 5-9.2 cm will primarily increase F3 since S3 is positive; this constriction will
have little effect on F4 and F5 since both S4 and S5 are nearly equal parts negative and positive.
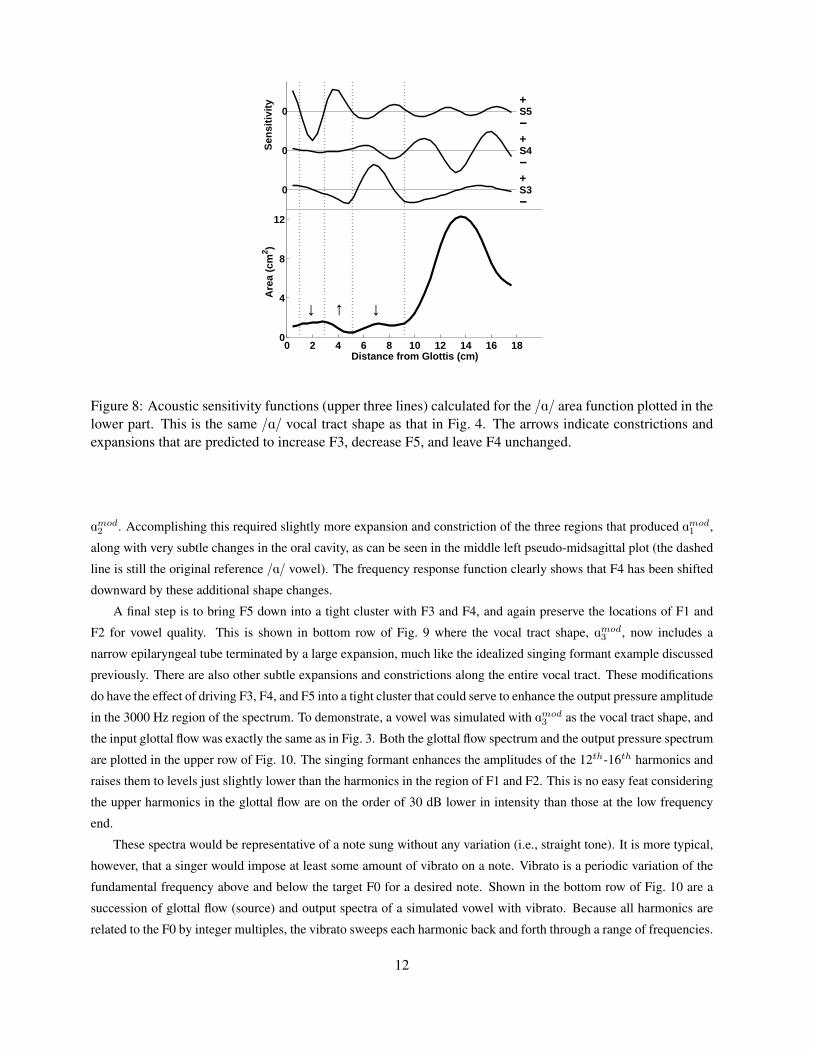
An automated technique was used to determine the degree of constriction or expansion needed in each of the
three regions to shift the formants to specified locations, or to leave them unchanged (Story, 2006). The result is
demonstrated in the upper row of Fig. 9. The pseudo-misagittal view (upper left) shows the reference /A/ as a dashed
line and the modified version as the solid line; the arrows indicate the same constrictive and expansive actions as in
Fig. 8. As can be seen in the frequency response functions (upper right panel) these fairly subtle modifications do
indeed shift F3 upward and F5 downward, while leaving F4 (as well as F1 and F2) at nearly the same frequency as
in the reference case. This has the effect of creating a cluster of the upper three formants that enhances the amplitude
from approximately 2900-4000 Hz, but preserves the locations of F1 and F2 to maintain the /A/ vowel.
The modified /A/ vowel (henceforth referred to as Amod1 ) provides the beginnings of a singing formant cluster.
Bringing the upper formants even closer together, however, could potentially provide greater amplitude enhancement
in the 3000 Hz region. The middle row of Fig. 9 shows a next step in which the vocal tract has been further modified
so that F4 is moved downward in frequency toward F3 while all other formants are unchanged; this new shape is called
11
0 2 4 6 8 10 12 14 16 180
4
8
12
Distance from Glottis (cm)
Are
a (c
m2 )
Sen
sitiv
ity
0
0
0
−
+−
+−
+
S3
S4
S5
↓ ↑ ↓
Figure 8: Acoustic sensitivity functions (upper three lines) calculated for the /A/ area function plotted in thelower part. This is the same /A/ vocal tract shape as that in Fig. 4. The arrows indicate constrictions andexpansions that are predicted to increase F3, decrease F5, and leave F4 unchanged.
Amod2 . Accomplishing this required slightly more expansion and constriction of the three regions that produced Amod1 ,
along with very subtle changes in the oral cavity, as can be seen in the middle left pseudo-midsagittal plot (the dashed
line is still the original reference /A/ vowel). The frequency response function clearly shows that F4 has been shifted
downward by these additional shape changes.
A final step is to bring F5 down into a tight cluster with F3 and F4, and again preserve the locations of F1 and
F2 for vowel quality. This is shown in bottom row of Fig. 9 where the vocal tract shape, Amod3 , now includes a
narrow epilaryngeal tube terminated by a large expansion, much like the idealized singing formant example discussed
previously. There are also other subtle expansions and constrictions along the entire vocal tract. These modifications
do have the effect of driving F3, F4, and F5 into a tight cluster that could serve to enhance the output pressure amplitude
in the 3000 Hz region of the spectrum. To demonstrate, a vowel was simulated with Amod3 as the vocal tract shape, and
the input glottal flow was exactly the same as in Fig. 3. Both the glottal flow spectrum and the output pressure spectrum
are plotted in the upper row of Fig. 10. The singing formant enhances the amplitudes of the 12th-16th harmonics and
raises them to levels just slightly lower than the harmonics in the region of F1 and F2. This is no easy feat considering
the upper harmonics in the glottal flow are on the order of 30 dB lower in intensity than those at the low frequency
end.
These spectra would be representative of a note sung without any variation (i.e., straight tone). It is more typical,
however, that a singer would impose at least some amount of vibrato on a note. Vibrato is a periodic variation of the
fundamental frequency above and below the target F0 for a desired note. Shown in the bottom row of Fig. 10 are a
succession of glottal flow (source) and output spectra of a simulated vowel with vibrato. Because all harmonics are
related to the F0 by integer multiples, the vibrato sweeps each harmonic back and forth through a range of frequencies.
12
Vocal tract shape Frequency response
−4 −2 0 2 4 6 80
2
4
6
8
10
12
P−A (cm)
I−S
(cm
)
→←
→←
←→
modified
reference
0 1000 2000 3000 4000 5000−10
0
10
20
30
40
50
F1 F2 F3 F4 F5
Frequency (Hz)
Rel
. Am
pl. (
dB)
→
←
A→ Amod1
−4 −2 0 2 4 6 80
2
4
6
8
10
12
P−A (cm)
I−S
(cm
)
modified
reference
0 1000 2000 3000 4000 5000−10
0
10
20
30
40
50
F1 F2 F3F4 F5
Frequency (Hz)
Rel
. Am
pl. (
dB)
→
←←
A→ Amod2
−4 −2 0 2 4 6 80
2
4
6
8
10
12
P−A (cm)
I−S
(cm
)
modified
reference
0 1000 2000 3000 4000 5000−10
0
10
20
30
40
50
F1 F2 F3F4F5
Frequency (Hz)
Rel
. Am
pl. (
dB)
A→ Amod3
Figure 9: Three modifications of the /A/ vocal tract shape to build up a singing formant.
13
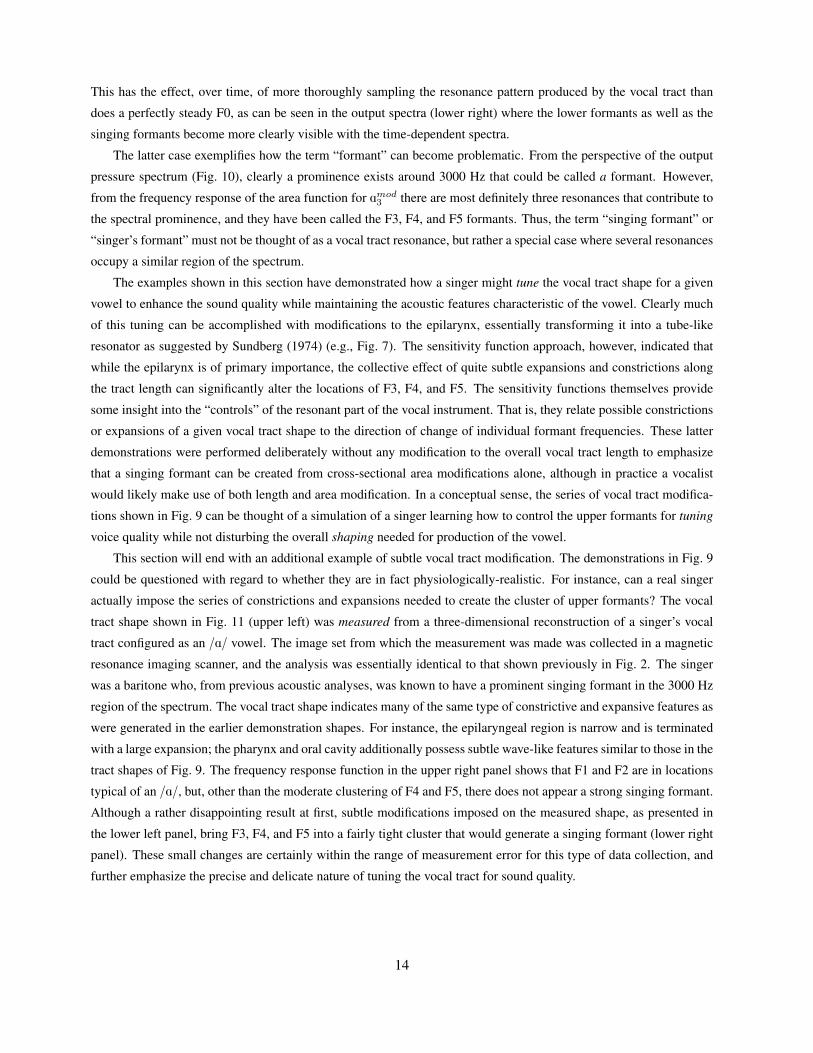
This has the effect, over time, of more thoroughly sampling the resonance pattern produced by the vocal tract than
does a perfectly steady F0, as can be seen in the output spectra (lower right) where the lower formants as well as the
singing formants become more clearly visible with the time-dependent spectra.
The latter case exemplifies how the term “formant” can become problematic. From the perspective of the output
pressure spectrum (Fig. 10), clearly a prominence exists around 3000 Hz that could be called a formant. However,
from the frequency response of the area function for Amod3 there are most definitely three resonances that contribute to
the spectral prominence, and they have been called the F3, F4, and F5 formants. Thus, the term “singing formant” or
“singer’s formant” must not be thought of as a vocal tract resonance, but rather a special case where several resonances
occupy a similar region of the spectrum.
The examples shown in this section have demonstrated how a singer might tune the vocal tract shape for a given
vowel to enhance the sound quality while maintaining the acoustic features characteristic of the vowel. Clearly much
of this tuning can be accomplished with modifications to the epilarynx, essentially transforming it into a tube-like
resonator as suggested by Sundberg (1974) (e.g., Fig. 7). The sensitivity function approach, however, indicated that
while the epilarynx is of primary importance, the collective effect of quite subtle expansions and constrictions along
the tract length can significantly alter the locations of F3, F4, and F5. The sensitivity functions themselves provide
some insight into the “controls” of the resonant part of the vocal instrument. That is, they relate possible constrictions
or expansions of a given vocal tract shape to the direction of change of individual formant frequencies. These latter
demonstrations were performed deliberately without any modification to the overall vocal tract length to emphasize
that a singing formant can be created from cross-sectional area modifications alone, although in practice a vocalist
would likely make use of both length and area modification. In a conceptual sense, the series of vocal tract modifica-
tions shown in Fig. 9 can be thought of a simulation of a singer learning how to control the upper formants for tuning
voice quality while not disturbing the overall shaping needed for production of the vowel.
This section will end with an additional example of subtle vocal tract modification. The demonstrations in Fig. 9
could be questioned with regard to whether they are in fact physiologically-realistic. For instance, can a real singer
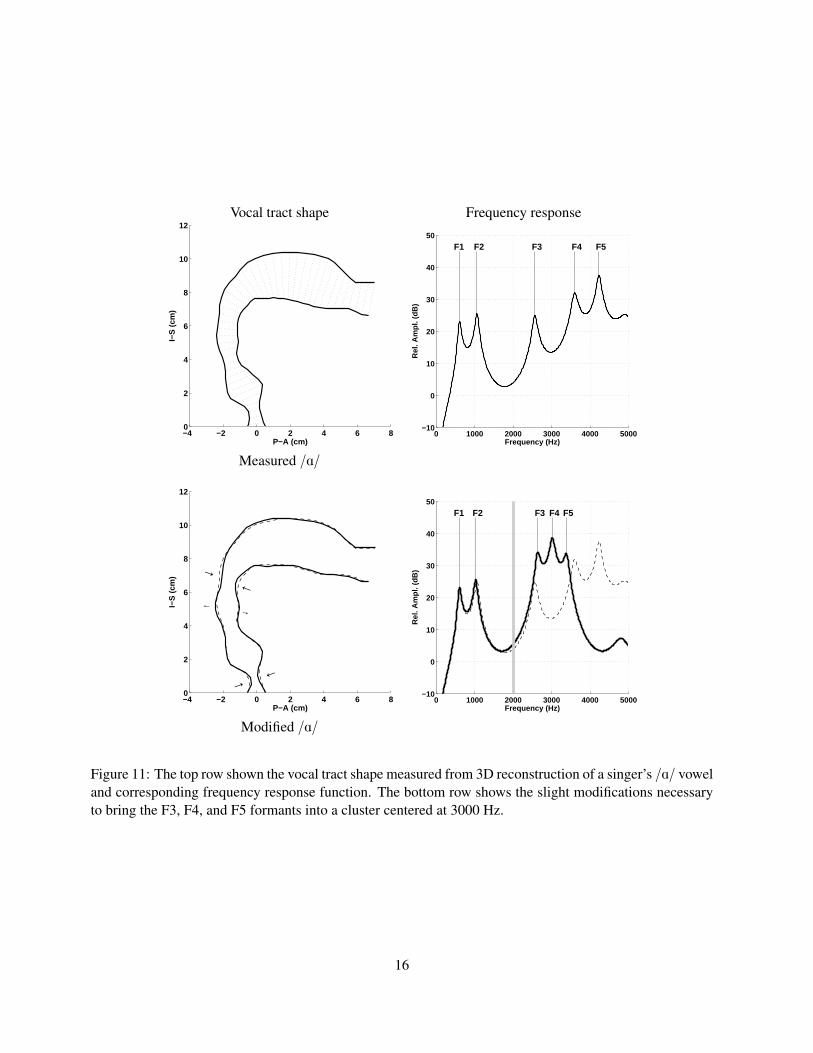
actually impose the series of constrictions and expansions needed to create the cluster of upper formants? The vocal
tract shape shown in Fig. 11 (upper left) was measured from a three-dimensional reconstruction of a singer’s vocal
tract configured as an /A/ vowel. The image set from which the measurement was made was collected in a magnetic
resonance imaging scanner, and the analysis was essentially identical to that shown previously in Fig. 2. The singer
was a baritone who, from previous acoustic analyses, was known to have a prominent singing formant in the 3000 Hz
region of the spectrum. The vocal tract shape indicates many of the same type of constrictive and expansive features as
were generated in the earlier demonstration shapes. For instance, the epilaryngeal region is narrow and is terminated
with a large expansion; the pharynx and oral cavity additionally possess subtle wave-like features similar to those in the
tract shapes of Fig. 9. The frequency response function in the upper right panel shows that F1 and F2 are in locations
typical of an /A/, but, other than the moderate clustering of F4 and F5, there does not appear a strong singing formant.
Although a rather disappointing result at first, subtle modifications imposed on the measured shape, as presented in
the lower left panel, bring F3, F4, and F5 into a fairly tight cluster that would generate a singing formant (lower right
panel). These small changes are certainly within the range of measurement error for this type of data collection, and
further emphasize the precise and delicate nature of tuning the vocal tract for sound quality.
14
Source Spectrum Output Spectrum
0 1000 2000 3000 4000 50000
10
20
30
40
50
60
70
80
90
100
Frequency (Hz)
Rel
. Am
pl. (
dB)
F0
2F0
0 1000 2000 3000 4000 50000
10
20
30
40
50
60
70
80
90
100
Frequency (Hz)
Rel
. Am
pl. (
dB)
Singing Formant
Ug(f) P (f) based on Amod3
0 1000 2000 3000 4000 50000
10
20
30
40
50
60
70
80
90
100
Frequency (Hz)
Rel
. Am
pl. (
dB)
↔F0
0 1000 2000 3000 4000 50000
10
20
30
40
50
60
70
80
90
100
Frequency (Hz)
Rel
. Am
pl. (
dB)
Singing Formant
Ug(f), vibrato P (f) based on Amod3
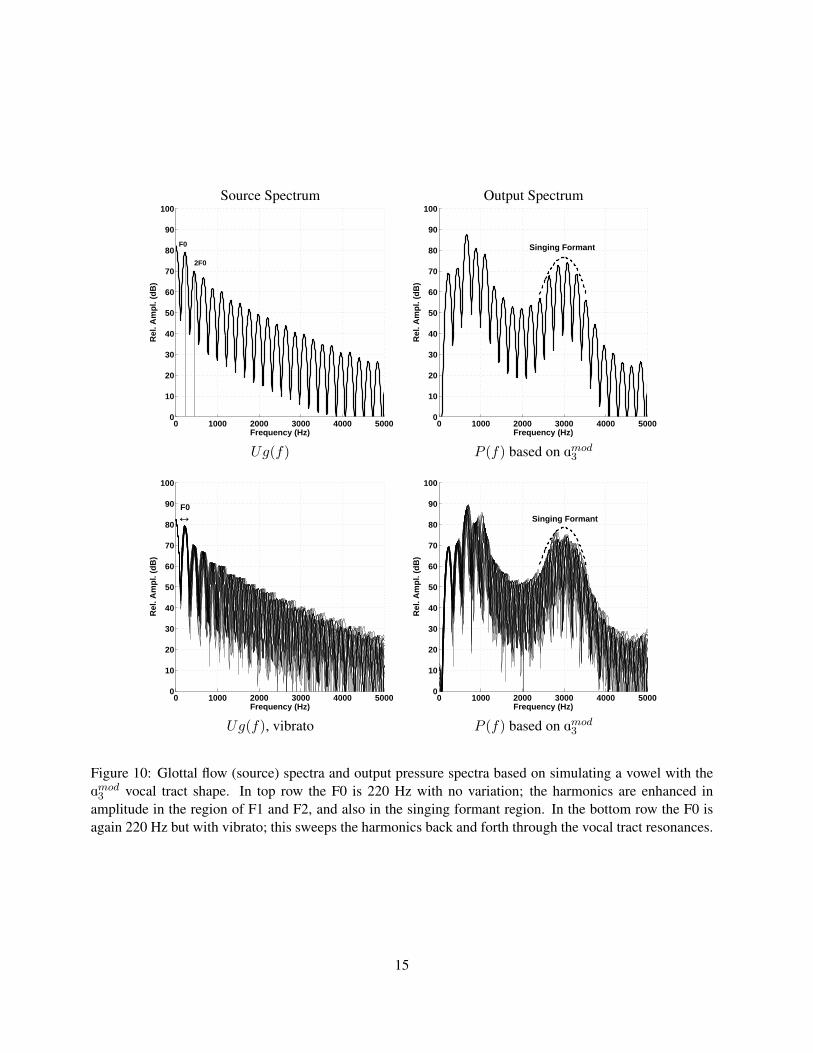
Figure 10: Glottal flow (source) spectra and output pressure spectra based on simulating a vowel with theAmod
3 vocal tract shape. In top row the F0 is 220 Hz with no variation; the harmonics are enhanced inamplitude in the region of F1 and F2, and also in the singing formant region. In the bottom row the F0 isagain 220 Hz but with vibrato; this sweeps the harmonics back and forth through the vocal tract resonances.
15
Vocal tract shape Frequency response
−4 −2 0 2 4 6 80
2
4
6
8
10
12
P−A (cm)
I−S
(cm
)
0 1000 2000 3000 4000 5000−10
0
10
20
30
40
50
F1 F2 F3 F4 F5
Frequency (Hz)
Rel
. Am
pl. (
dB)
Measured /A/
−4 −2 0 2 4 6 80
2
4
6
8
10
12
P−A (cm)
I−S
(cm
)
→←
←→
←→
0 1000 2000 3000 4000 5000−10
0
10
20
30
40
50
F1 F2 F3 F4 F5
Frequency (Hz)
Rel
. Am
pl. (
dB)
Modified /A/
Figure 11: The top row shown the vocal tract shape measured from 3D reconstruction of a singer’s /A/ voweland corresponding frequency response function. The bottom row shows the slight modifications necessaryto bring the F3, F4, and F5 formants into a cluster centered at 3000 Hz.
16
4.3 Tuning a female vocal tract for a singing formant
Although the basic notions of vocal tract modification discussed in the previous section could, in principle, be
applied to a female vocal tract, there are aspects of female singing that suggest the approach to tuning may be somewhat
different. The primary difference between a male and female vocal tract is the overall length; the tract length for a
typical adult male is about 17.5 cm, whereas for an adult female it is around 15 cm. Nonetheless, the global shaping
required for vowel production is similar regardless of the tract length; e.g., expansion of the oral cavity and constriction
of the pharynx is needed to produce an /A/ vowel. Further, the higher notes sung by females may require some
extreme shape modifications to ensure that the first formant is higher than the target note (e.g., Titze et al., 2011). It is
something of an open question, however, whether female singers, especially sopranos, can produce or make use of a
singing formant. Weiss et al. (2001) reported that sopranos seem to produce a spectral prominence between 2600-4600
Hz for low and mid frequency notes (i.e., 261 Hz and 622 Hz, respectively). Because the prominence was typically
broader than a singing formant observed for male vocalists, the authors suggested that the physiological origin of the
soprano singing formant was different than that of males.
The purpose of this section is not to give a thorough review of the female vocal tract, but rather to provide another
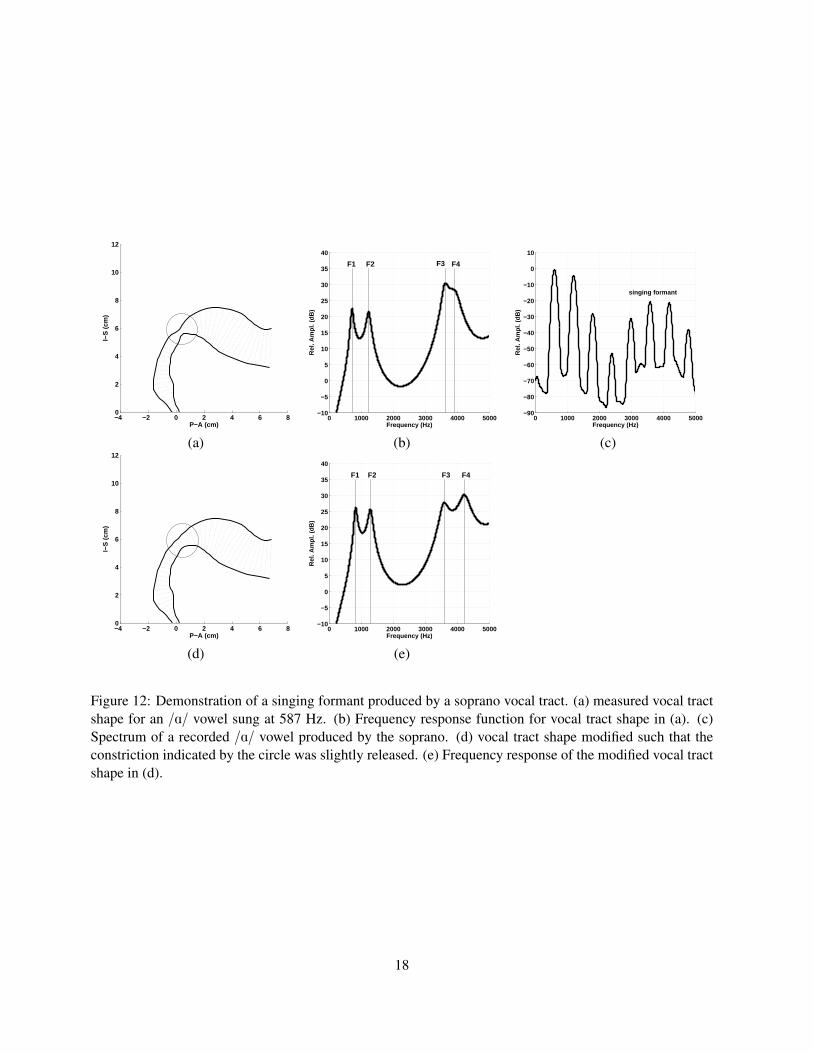
demonstration of vocal tract tuning, this time for a vowel configuration measured from a soprano singer. The vocal
tract shape shown in Fig. 12a is that of an /A/ vowel sung on the note D5 (587 Hz). This was originally reported as
an area function in Story (2004) and has been plotted here with exactly the same scale as the pseudo-midsagittal plots
shown for the male vocal tract in previous figures. The frequency response calculated for the tract shape is plotted
in Fig. 12b, and clearly shows that F3 and F4 have been driven toward each other to produce a two-formant cluster.
The effect of this cluster can be seen in the spectrum of the singer’s recording of this vowel as shown in Fig. 12c; the
amplitudes of harmonics 5-8 are enhanced in the spectrum. Although the epilarynx portion is fairly narrow it gradually
diverges toward the wider pharyngeal portion of the tract, providing little evidence for an epilaryngeal tube resonator
as the source of the singing formant. An acoustic sensitivity function analysis of this vocal tract shape suggested that
both F3 and F4 were highly sensitive to cross-sectional area changes in the region at about the mid-point where there
is a fairly tight constriction (indicated by the circle in Fig. 12a) suggesting that further constriction would move F3 and
F4 even closer together and releasing the constriction would move them apart. To test the prediction, this region of
the tract was increased in area (i.e., constriction was slightly released) as shown in Fig. 12d, and indeed has the effect
of moving F3 down and F4 up in frequency (Fig. 12e), slightly detuning the singing formant. Additional expansion of
this region would move F3 and F4 farther apart.
This example shows yet another subtle tuning maneuver that could alter the sound quality. The point at which
the constriction was made is in the velar region. Although speculative at this point, it appears that such a constriction
might be created by muscular action of both the tongue and velum, providing control of F3 and F4.
5 Summary
More than a century ago Alexander Graham Bell wrote, regarding the vocal tract, that: “It is here that the voice is
moulded, so to speak, on its way to the ear, and the shape of the passage-way [vocal tract] largely determines the quality
or timbre of the voice.” (Bell, 1911). Certainly this statement is as true today as it was then, and one might think that
after a hundred years of subsequent research all things would be known about relation of the vocal tract shape to the
acoustic characteristics it produces. But research is often focused, for good reason, on understanding particular aspects
17
−4 −2 0 2 4 6 80
2
4
6
8
10
12
P−A (cm)
I−S
(cm
)
0 1000 2000 3000 4000 5000−10
−5
0
5
10
15
20
25
30
35
40
Frequency (Hz)
Rel
. Am
pl. (
dB)
F1 F2 F3 F4
0 1000 2000 3000 4000 5000−90
−80
−70
−60
−50
−40
−30
−20
−10
0
10
Frequency (Hz)
Rel
. Am
pl. (
dB)
singing formant
(a) (b) (c)
−4 −2 0 2 4 6 80
2
4
6
8
10
12
P−A (cm)
I−S
(cm
)
0 1000 2000 3000 4000 5000−10
−5
0
5
10
15
20
25
30
35
40
Frequency (Hz)
Rel
. Am
pl. (
dB)
F1 F2 F3 F4
(d) (e)
Figure 12: Demonstration of a singing formant produced by a soprano vocal tract. (a) measured vocal tractshape for an /A/ vowel sung at 587 Hz. (b) Frequency response function for vocal tract shape in (a). (c)Spectrum of a recorded /A/ vowel produced by the soprano. (d) vocal tract shape modified such that theconstriction indicated by the circle was slightly released. (e) Frequency response of the modified vocal tractshape in (d).
18
of a system. With regard to the vocal tract much effort has been expended in studying those acoustic characteristics
that are phonetically-relevant; for vowels this primarily means the first two or three formant frequencies. Less effort
has been put toward the study of how the vocal tract imparts acoustic characteristics related to voice quality, for either
singing or speech.
As has been demonstrated in this chapter, enhancement of voice quality typically requires subtle but precise
modifications of the vocal tract shape. This is in direct contrast to the more global shape changes needed for shifting
from one vowel to another. In light of this apparent division between the qualities needed for vowel identity versus
the desired qualities of the sound itself (musical or otherwise), a conceptual model was introduced that differentiated
shaping from tuning. Shaping involves large movements of the articulators that create major changes in cross-sectional
area along nearly the entire vocal tract length. In contrast, tuning refers to small localized modifications of a particular
vocal tract shape already in place for a specific vowel, but can alter the positions of the formants in such ways that
the output is significantly enhanced in quality, and may also facilitate the efficient transfer of energy from laryngeal
source to the radiated sound at the lips. There is still much to be learned about the tuning aspect of the vocal tract for
purposes of voice quality.
6 Acknowledgements
Portions of this work were supported by grant R01 DC011275 from the National Institutes on Deafness and Other
Communication Disorders.
Footnotes
1. There have been many attempts to transform cross-distances measured in the midsagittal plane to cross-sectional
areas via functions such as A = kdα, where d is cross distance, and α and k are empirically-derived constants
(c.f., Heinz and Stevens, 1964; Baer et al., 1991; Sundberg et al., 1987). Although useful for working with
midsagittal data, such transformations are not actual measurements of the cross-sectional area variation along
the tract length.
2. The particular model used is based on the author’s previous research. A description of the model is outside the
scope of the current chapter but interested readers can find components of it in Story (1995, 2004, 2013) and
Titze (2006).
References
Baer, T., Gore, J. C., Gracco, L. C., and Nye, P. W., (1991). Analysis of vocal tract shape and dimensions using
magnetic resonance imaging: Vowels, J. Acoust. Soc. Am., 90, 799-828.
Bartholomew, W. T., (1934). A physical definition of “Good Voice-Quality” in the male voice, J. Acoust. Soc.
Am., 6, 25-33.
Bell, A. G., (1911). The Mechanism of Speech, Fifth edition, Funk and Wagnalls, New York/London.
Dang, J., and Honda, K., (1997). Acoustic characteristics of the piriform fossa in models and humans, J. Acoust.
Soc. Am., 101(1), 456-465.
19
Detweiler, R., (1994). Investigation of the laryngeal system as the resonance source of the singer’s formant, J.
Voice, 8(4), 303-313.
Echternach, M., Sundberg, J., Baumann, T., Markl, M., and Richter, B., (2011). Vocal tract area functions and
formant frequencies in opera tenors’ modal and falsetto registers, J. Acoust. Soc. Am., 129(6), 3955-3963.
Fant, G., (1960). Acoustic Theory of Speech Production, The Hague, Mouton.
Fant, G., and Pauli, S., (1975). Spatial characteristics of vocal tract resonance modes, in Proc. Speech Comm.
Sem. 74., Stockholm, Sweden, Aug 1-3, 121-132.
Heinz, J. M., and Stevens, K. N., (1964). On the derivation of area Functions and acoustic spectra from
cineradiographic films of speech, J. Acoust. Soc. Am. 36(5), 1037-1038.
Hillenbrand, J., Getty, L. A., Clark, M. J., and Wheeler, K., (1995). Acoustic characteristics of American
English vowels, J. Acoust. Soc. Am., 97(5), 3099-3111.
Lewis, D., (1936). Vocal resonance, J. Acoust. Soc. Am., 8, 91-99.
Miller, R. (1996). On the Art of Singing, Oxford University Press, New York.
Peterson, G.E., and Barney, H.L., (1952). Control methods used in a study of the vowels, J. Acoust. Soc. Am.,
24(2), 175-184.
Stevens, K. N. (2000). Acoustic Phonetics, MIT Press, Cambridge, MA.
Story, B. H., (1995). Physiologically-based speech simulation using an enhanced wave-reflection model of the
vocal tract, Ph. D. Dissertation, University of Iowa.
Story, B.H., Titze, I.R., and Hoffman, E.A., (1996). Vocal tract area functions from magnetic resonance imag-
ing, J. Acoust. Soc. Am., 100(1), 537-554.
Story, B.H., Titze, I.R., and Hoffman, E.A., (1996). Vocal tract area functions from magnetic resonance imag-
ing, J. Acoust. Soc. Am., 100(1), 537-554.
Story, B.H., Titze, I.R., and Hoffman, E.A., (1998). Vocal tract area functions for an adult female speaker based
on volumetric imaging, J. Acoust. Soc. Am., 104(1), 471-487.
Story, B.H., Titze, I.R., and Hoffman, E.A., (2001). The relationship of vocal tract shape to three voice qualities,
J. Acoust. Soc. Am., 109, 1651–1667.
Story, B. H. (2004). Vowel acoustics for speaking and singing, Acta Acustica united with Acustica, 90(4),
629-640.
Story, B. H., (2005). Synergistic modes of vocal tract articulation for American English vowels, J. Acoust. Soc.
Am., 118(6), 3834-3859.
Story, B. H., (2006). A technique for “tuning” vocal tract area functions based on acoustic sensitivity functions,
J. Acoust. Soc. Am., 119(2), 715-718.
Story, B. H., (2008). Comparison of Magnetic Resonance Imaging-based vocal tract area functions obtained
from the same speaker in 1994 and 2002, J. Acoust. Soc. Am., 123(1), 327-335.
20
Story, B.H., (2013). Phrase-level speech simulation with an airway modulation model of speech production,
Computer Speech and Language. 27(4), 989-1010.
Sundberg, J., (1974). Articulatory interpretation of the “singing formant,” J. Acoust. Soc. Am., 55(4), 838-843.
Sundberg, J. (1987). From sagittal distance to area: A study of transverse, vocal tract cross-sectional area,
Phonetica, 44, 76-90.
Titze, I.R., and Story, B.H., (1997). Acoustic interactions of the voice source with the lower vocal tract, J.
Acoust. Soc. Am., 101(4), 2234-2243.
Titze, I.R. (2006). The Myoelastic Aerodynamic Theory of Phonation, National Center for Voice and Speech,
pp. 197-214.
Titze, I. R., Worley, A. S., and Story, B. H. (2011). Source-vocal tract interaction in female operatic singing
and theater belting, J. Singing, 67(5), 561-572.
Wang, S., (1986). Singer’s high formant associated with different larynx position in styles of singing, J. Acoust.
Soc. Jpn. (E)7,6, 303-314.
Weiss, R., Brown, W. S., and Morris, J., (2001). Singer’s formant in sopranos: Fact or fiction?, J. Voice, 15(4),