67 th Economic Policy Panel Meeting 12-13 April 2018 Zurich Hosted by the Swiss National Bank The organisers would like to thank the Swiss National Bank for their support. The views expressed in this paper are those of the author(s) and not those of the supporting organization. The Walking Dead?: Zombie Firms and Productivity Performance in OECD Countries Müge Adalet McGowan (OECD) Dan Andrews (OECD) Valentine Millot (OECD)
Transcript
67th Economic Policy Panel Meeting
12-13 April 2018 Zurich
Hosted by the Swiss National Bank
The organisers would like to thank the Swiss National Bank for their support. The views expressed in this paper are those of the author(s) and not those of the supporting organization.
The Walking Dead?: Zombie Firms and Productivity
Performance in OECD Countries
Müge Adalet McGowan (OECD) Dan Andrews (OECD)
Valentine Millot (OECD)
ZOMBIE FIRMS
1
ABSTRACT
The Walking Dead?: Zombie Firms and Productivity Performance in OECD Countries
This paper explores the extent to which “zombie” firms – defined as old firms that have persistent problems meeting their interest payments – are stifling labour productivity performance. The results show that the prevalence of and resources sunk in zombie firms have risen since the mid-2000s and that the increasing survival of these low productivity firms at the margins of exit congests markets and constrains the growth of more productive firms. Controlling for cyclical effects, cross-country analysis shows that within-industries over the period 2003-2013, a higher share of industry capital sunk in zombie firms is associated with lower investment and employment growth of the typical non-zombie firm and less productivity-enhancing capital reallocation. Besides limiting the expansion possibilities of healthy incumbent firms, market congestion generated by zombie firms can also create barriers to entry and constrain the post-entry growth of young firms. Finally, we link the rise of zombie firms to the decline in OECD potential output growth through two key channels: business investment and multi-factor productivity growth.
THE WALKING DEAD?: ZOMBIE FIRMS AND PRODUCTIVITY PERFORMANCE IN OECD COUNTRIES
Müge Adalet McGowan, Dan Andrews and Valentine Millot OECD
1. INTRODUCTION
The productivity slowdown over the past decade brings into closer focus the barriers to productivity growth in OECD economies. Firm-level research is increasingly linking the aggregate slowdown to the widening dispersion in productivity performance across firms (Andrews et al., 2016), rising resource misallocation (Gopinath et al., 2017) and declining business dynamism (Decker et al., 2016). In this context, one source of concern is that firms that would typically exit in a competitive market are surviving, which may weigh on average productivity and potentially crowd-out growth opportunities for more productive firms. In some countries, these problems are likely symptomatic of structural policy weaknesses, particularly with respect to insolvency regimes. But there are reasons to suspect that non-viable firms may also be increasingly kept alive by the legacy of the financial crisis, with bank forbearance, prolonged monetary stimulus and the persistence of crisis-induced SME support policy initiatives emerging as possible culprits. The experience of Japan in the 1990s suggests that the costs to potential output from exit margin distortions are large (Caballero, Hoshi and Kashyap, 2008; Peek and Rosengren, 2005). Yet, there is little systematic cross-country research on the consequences of the prolonged survival of low productivity firms for aggregate labour productivity.
Corresponding authors are: Müge Adalet McGowan ([email protected]), Dan Andrews ([email protected]) and Valentine Millot ([email protected]) from the OECD Economics Department. The authors would like to thank Catherine L. Mann, Giuseppe Nicoletti, Jean-Luc Schneider, Mikkel Hermansen, Ben Westmore, Paul O’Brien, Sebastian Barnes, Alessandro Saia, Peter Gal, the editors and the referees for their valuable comments, and Sarah Michelson for excellent editorial support.
This paper uses harmonised cross-country firm-level data to explore the extent to which “zombie” firms – defined as old firms that have persistent problems meeting their interest payments – are stifling labour productivity growth. We show that the prevalence of and resources sunk in zombie firms have risen since the mid-2000s, which is significant given that recessions typically provide opportunities for restructuring and productivity-enhancing reallocation (Caballero and Hammour, 1994). In turn, we argue that the patterns of prolonged restructuring and depressed creative destruction which underlined the Japanese macroeconomic stagnation during the 1990s may be relevant to understanding contemporary productivity developments in some OECD countries. Specifically, we apply the Caballero et al. (2008) framework from their seminal study of Japan to a broader sample of OECD countries over the period 2003-2013. After controlling for cyclical influences at the industry-country level, within-industry analysis shows that a higher share of industry capital sunk in zombie firms tends to crowd-out the growth – measured in terms of investment and employment – of the typical non-zombie firm. Assuming a causal relationship, our estimates imply that business investment by the typical non-zombie firm would have been on average 2% higher in 2013, had the zombie share not risen from its 2007 level, with significantly higher effects in Italy, Finland and Spain1.
Besides limiting the expansion possibilities of healthy incumbent firms, market congestion generated by zombie firms can also create barriers to entry. Our results suggest that zombie congestion tends to widen the average multi-factor productivity (MFP) gap between zombie and non-zombie firms, and this effect is more pronounced for young firms. The latter provides new empirical evidence in support of Caballero et al. (2008) theoretical conjecture that this larger MFP gap arises because entrants must clear a higher productivity threshold to compensate for lower market profitability, as zombie congestion inflates wages relative to productivity and depresses market prices and (non-zombie) market shares. These results are significant given evidence of rising productivity dispersion and barriers to entry (Andrews, Criscuolo and Gal, 2016), and it is likely that the zombie firm phenomenon is closely connected to – and possibly even a driver of – these developments. Moreover, we show that the employment growth of young non-zombie firms is particularly sensitive to zombie congestion. Thus, zombie congestion not only discourages entry but also constrains the ability of those particularly productive young firms to upscale post-entry.
While our baseline methodology focuses on the impact of zombie congestion on the growth opportunities of the average non-zombie firm, the concept of the average can be tenuous given that there is widespread heterogeneity in productivity performance within narrowly defined sectors (Syverson, 2004). Specifically, our baseline methodology may understate the aggregate impact if zombie congestion particularly constrains the growth of high productivity firms. Accordingly, we augment the state-of-the-art dynamic reallocation methodology proposed by Foster, Grim and Haltiwanger (2016) and find
1. As further discussed in the next section, the results should be interpreted with caution since they are estimated relatively to the outcomes of zombie firms and they identify correlations rather than causal effects.
ZOMBIE FIRMS
4
that within a given industry, an increase in the capital stock sunk in zombie firms is associated with a decline in the ability of more productive firms to attract capital. These findings are significant given that rising capital misallocation is emerging as a key explanation of the productivity slowdown in some countries (Gopinath et al., 2015).
A counterfactual exercise suggests that had the zombie share not risen from pre-crisis levels, the contribution of capital reallocation to aggregate MFP in 2013 would have been around 0.7% to 1% higher in Italy and Spain, respectively. In other countries, reducing zombie congestion to the lowest level observed within each industry could yield gains to MFP of up to 0.5%. Beyond this within-sector reallocation effect and the scope of our model, the continued survival of zombie firms is likely to negatively affect aggregate MFP by: i) directly lower aggregate productivity by dragging down unweighted industry level average productivity; ii) deter the potential entry of young firms which possess a comparative advantage in radical innovation and which place indirect pressure on incumbents to improve their productivity; and iii) potentially hinder the reallocation of resources across industries above and beyond their effect on within-industry reallocation patterns which we study in this paper.
Since the sample period includes crisis years, one concern is that the rise of zombie firms could be partly a cyclical story as shocks that raise the prevalence of zombie firms can also adversely affect firm performance. Looking at the case of Italy, Schivardi, Sette and Tabellini (2017) address this issue with firm-bank relationship data, using bank undercapitalisation as an exogenous proxy for zombie lending. Although the current state of available cross-country data does not allow to fully rule out this issue by using an exogenous instrument, we take a number of steps to address this potential critique, including a fixed effect structure that controls for unobserved time-varying country-industry specific shocks and a number of robustness tests. Furthermore, the continued rise in zombie firms after the crisis and the fact that there are no valid reasons for cyclical effects to increase the productivity gap between zombie and non-zombie firms or affect disproportionately more productive firms suggest that there is a structural element to the decline in the efficiency of the exit margin.
The next section reviews existing evidence on the implications of zombie firms for aggregate productivity performance. Section 3 describes the underlying firm-level data and provides descriptive evidence on zombie firms. Section 4 outlines the empirical methodology used to estimate the distortionary effects of zombie firms on non-zombie firm performance and patterns of productivity-enhancing capital reallocation. Section 5 discusses the baseline results, robustness tests and extensions, while Section 6 employs some counterfactual simulations to illustrate the potential relevance of zombie congestion for some key components of potential growth. The final section offers some concluding thoughts and discusses some relevant policy dimensions to the zombie firm problem in Europe, including the role of bank forbearance and structural policy weakness, with particular reference to the design of insolvency regimes.
ZOMBIE FIRMS
5
2. ZOMBIE FIRMS, RESOURCE REALLOCATION AND AGGREGATE PRODUCTIVITY
In a well-functioning market economy, the creative-destruction process compels poorly performing firms to improve their efficiency or exit the market. However, evidence of widening productivity dispersion across firms (Andrews et al., 2016), rising capital misallocation (Gopinath, et al., 2017) and declining business dynamism (Decker et al., 2016) suggest that this process may be slowing down. Put differently, it has become relatively easier for weak firms that do not adopt the latest technologies to remain in the market, while more productive firms are less likely to expand. At the same time, a number of factors suggest that there may be a policy dimension to this problem. These include structural policy weakness (e.g. inadequate insolvency regimes), bank forbearance, loose monetary policy and impaired banking systems and the persistence of crisis-induced SME support. Indeed, this confluence of factors has created concerns that “zombie firms” might be holding back potential growth in a number of countries, including Korea, the United Kingdom and Southern Europe (Bank of England, 2013; Bank of Korea, 2013; Acharya et al., 2016).
Given that firm closure or restructuring plans entail some costs that may take some time for the market to absorb, one may argue that there is a case to keep distressed firms operating at least in the short run, especially during sharp economic downturns. Recent literature has, for example, emphasized the potential counter-cyclical effects of lending techniques such as relationship banking (i.e. banks developing a sound knowledge of their clients’ prospects through repeated interactions with them), which help the continuation of credit to viable firms that encounter temporary financial distress (Beck et al., 2014). Helping distressed firms during recessions may prevent massive layoffs and help maintain aggregate demand in the short run, and may also help mitigate disruptions in supply chains and maintain productive capacity, which may accelerate the subsequent phase of economic recovery. However, in the longer term, the distortions in competition implied by the prolonged existence of zombie firms may have detrimental effects on economic performance and productivity growth and crisis-induced support schemes for weak firms may persist for political economy reasons.
Historically, the distortionary effects of “zombie firms” on healthy firms have been analysed in the context of the Japanese macroeconomic stagnation in the 1990s (Caballero, et al. 2008; Peek and Rosengren, 2005; Hoshi, 2006). These studies have concentrated on forbearance lending, which propped up inefficient firms and encouraged them not to undertake efforts necessary to raise their profitability, as the main reason that zombie firms were kept alive.2 The effects of such credit misallocation on the economy could be amplified by loose monetary policy to the extent that lowers the opportunity
2. In this case, banks continued to lend to these firms due to: i) relationship banking, whereby the long-standing connection of a bank with a borrower may give rise to perverse ex ante incentives on the part of borrowers, forcing the bank to continue to lend (Chen and Chu, 2003; Nishimura and Kawamoto, 2004); and ii) regulatory forbearance that gives perverse incentives to weakly capitalised banks not to realise losses, which in turn would be accentuated by inefficient insolvency regimes (Okamura, 2011).
ZOMBIE FIRMS
6
cost for banks to bet on the resurrection of failing firms via forbearance (White, 2012, Albertazzi and Marchetti, 2010).3
Indeed, a paper drafted contemporaneously with ours shows that the Outright Monetary Transactions (OMT) Program launched by the European Central Bank in 2012 increased zombie lending motives of banks (Acharya et al., 2016).4 Using a relatively small sample of large firms across European countries, they show that undercapitalised banks used OMT windfall gains to direct loans to zombies to avoid incurring losses on their loan portfolios. In addition, this additional credit to zombie firms did not directly raise real activity but the misallocation of credit adversely affected the investment and employment growth of non-zombie firms due to zombie congestion. Our approach is complementary to their analysis but contains a number of differences. First, we do not restrict to the specific channel of bank lending but look more generally at the issue of the existence of zombie firms, defined as firms in persistent financial distress, and focus on the implications on resource reallocation and aggregate productivity growth. Since we are not constrained by the availability of data on bank loans, our analysis uses a larger set of firms, relying on the full sample of the commercial database ORBIS. Furthermore, in the analysis of reallocation patterns, we look at the effect of zombie congestion not only on the growth prospects of low versus high quality firms, but also more generally on the ability of more productive firms to attract capital.
The theoretical literature suggests that there are three channels through which zombie firms can contribute to low aggregate labour productivity growth: i) zombie firms themselves exhibit low levels of labour productivity; ii) zombie firms crowd-out investment by the typical non-zombie firm; and iii) zombie firms hinder efficient resource allocation and aggregate MFP growth, by either preventing more productive firms from gaining market share, or new and more dynamic firms from replacing inefficient incumbents. The adverse effects of zombie firms on capital deepening and MFP growth in turn both imply a negative impact on labour productivity growth. The present paper focuses on the two latter channels, i.e. the effect of zombie firms on resource reallocation patterns. Besides these reallocation effects, weak investment by non-zombie firms will also undermine within-firm MFP growth to the extent that new technologies and innovation are embodied in capital (Cooper, Haltiwanger and Power, 1997). Zombie firms can also crowd out new firms’ room to experiment with promising but uncertain technologies and business practices, further undermining scope for within-firm productivity gains.
In their seminal study of Japan in the 1990s, Caballero et al. (2008) explore the effect of zombie firms on growth through two main channels: i) sclerosis – the preservation of low productivity firms which would exit in the absence of bank subsidies; and ii) scrambling – the retention of firms and projects that are less productive than some of those that do not enter or are not implemented due to the congestion caused by zombies.
3. This channel is likely to be reinforced given that the low interest rate environment might be challenging the traditional business models of financial institutions, lowering their profitability and distorting the credit supply (OECD, 2016a). 4. This analysis utilises Thomson Reuters LPC’s DealScan data on bank-firm relationships in Europe matched with Bureau van Dijk’s Amadeus firm-level data.
ZOMBIE FIRMS
7
Specifically, the model assumes that in an economy without zombie firms, incumbents hit by unfavourable shocks exit and are replaced by entrants hit by favourable productivity draws, increasing aggregate productivity growth. The existence of zombie firms, where subsidised incumbents do not exit when hit by unfavourable shocks, distorts competition through the rest of the economy. Zombie firms can create these distortions by depressing market prices for their products, raising market wages by keeping workers whose productivity at their current firms declined and congesting the markets in general. These distortions adversely affect non-zombie firms that must compete with the inefficient firms for scarce resources and face lower profits due to these lower prices and higher wages.
In their empirical application to Japanese data, Caballero et al. (2008) find that zombie-dominated industries exhibit less job turnover and lower investment and employment growth amongst non-zombie firms. The distortions created by zombie firms via low prices and high wages not only limit the possibility that healthy incumbents expand, but also reduce the profits and collateral that new and more productive firms could generate. Hence, the presence of zombie firms can create barriers to entry, further weakening market selection. In their empirical analysis, Caballero et al. (2008) find that the presence of zombie firms widens the productivity gap between zombie and non-zombie firms since entrants must clear a higher productivity threshold to compensate for the additional barriers to entry that the zombie congestion generates.
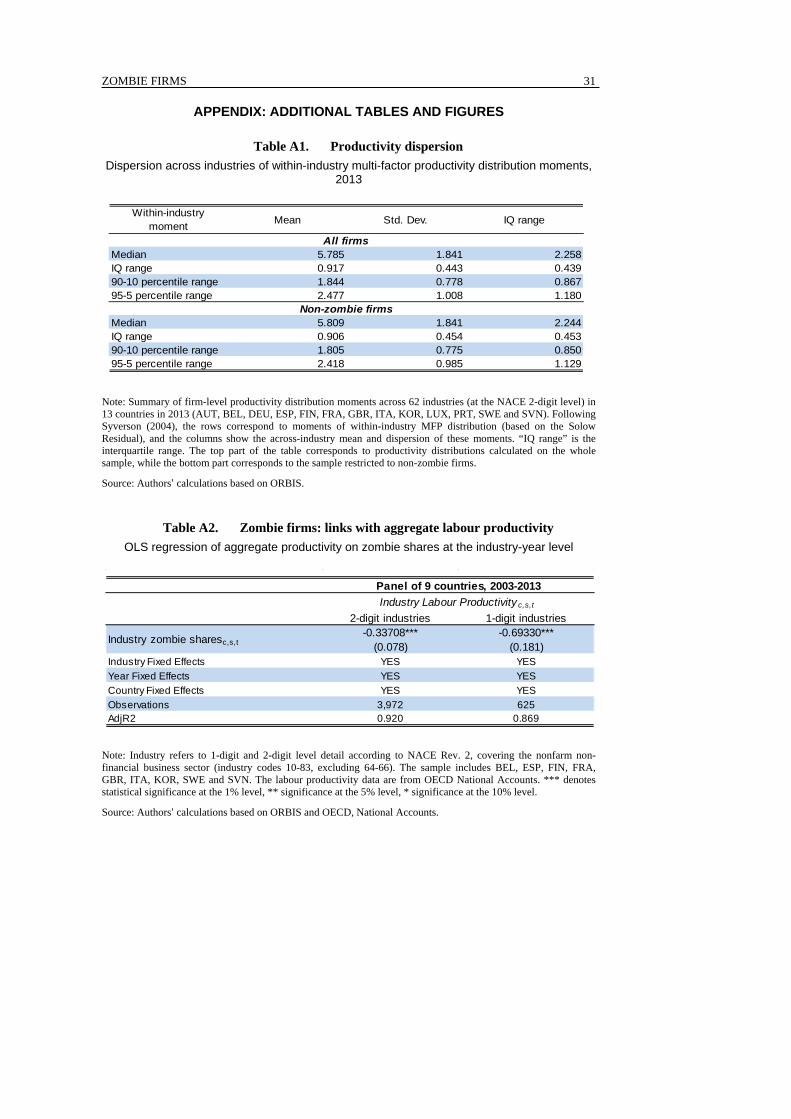
Importantly, the impact of zombie congestion on the growth opportunities of the non-zombie firms and aggregate productivity may be understated if the widespread heterogeneity in firm productivity is not taken into account. Indeed, Table A1 of the Appendix shows that there is considerable heterogeneity in non-zombie productivity performance. This dispersion in firm multi-factor productivity – an average interquartile range of 0.91 corresponding to a productivity ratio of about 2.5 to 1 – can create scope for productivity-enhancing capital reallocation.5 If the market congestion caused by zombie firms disproportionately affects firms at the higher end of the productivity distribution, the overall negative effect on aggregate productivity will be stronger. Accordingly, the paper also analyses the impact of zombie firms on aggregate productivity through reallocation patterns.
It should be noted that our framework, based on Caballero (2008) estimates the relative effect of zombie congestion on subsequent performance of non-zombie firms compared to zombie firms, but does not account for the overall effect or the potential counterbalancing effects on healthy firms of zombie firms’ survival, e.g. through reduced unemployment and sustained aggregate demand. The capacity of the market to absorb the cost of zombie firm exit is beyond the scope of our model, which focuses on the distortions in resource reallocation among incumbent firms induced by zombie firms. Based on a new dataset of Italian firms matched to bank data, Schivardi, Sette and
5. These calculations show MFP dispersion moments for NACE 2 digit industries based on the sample of nine countries for 2013 (see section 3.1 for details). For all the firms, the average interquartile range of firm-level productivity values is about 0.92. Since MFP is expressed in log-level, this corresponds to a ratio of around 2.50 to 1 between the 75th and 25th percentile firms in an industry’s productivity distribution (Table A1).
ZOMBIE FIRMS
8
Tabellini (2017) adopt a refined empirical strategy to study the overall impact of zombie firms on the market through the particular channel of zombie lending, using the level of undercapitalisation of banks operating in one market as an exogenous proxy for zombie lending. Although their findings corroborate the existence of a significant negative effect of zombie lending on resource reallocation among incumbent firms in Italy, i.e. on the relative performance of non-zombie firms to zombie firms, they also suggest the presence of counterbalancing effects of zombie firm survival on non-zombie firms at least in the short run.
3. DATA AND CROSS-COUNTRY EVIDENCE ON ZOMBIE FIRMS
3.1. Data description
We use a harmonised cross-country dataset, where the underlying firm level data are sourced from ORBIS, a commercial database provided to the OECD by the electronic publishing firm Bureau Van Dijk (see Box 1). While ORBIS covers a larger number of countries, the final sample of countries is driven by the availability of data that is necessary to construct MFP and zombie firm measures.6 Since the analysis of zombie firms requires looking at the bottom of the productivity distribution and more productive firms are better represented in ORBIS, we adopt a conservative strategy and limit the sample to a set of countries where the data coverage is more complete, especially across time. The analysis is therefore based on a panel of nine countries – Belgium, Finland, France, Italy, Korea, Slovenia, Spain, Sweden and the United Kingdom – for 2003-2013. The cross-section analysis for 2013 adds four additional countries, namely Austria, Germany, Luxembourg and Portugal. The sample is restricted to the non-farm non-financial business sector (NACE Rev.2 codes 10-83, excluding 64-66).
6. The sample is restricted to countries and years for which ORBIS covers at least 40% of aggregate employment (based on national account figures), and where profit, debt and MFP variables are available for the majority of observations.
Box 1. Firm level data
ORBIS is the largest cross-country firm-level database that is available and accessible for economic and financial research. However, since the information is primarily collected for use in the private sector typically with the aim of financial benchmarking, a number of steps need to be undertaken before the data can be used for economic analysis. The steps we apply closely follow suggestions by Kalemli-Ozcan, et al. (2015) and previous OECD experience (Gal, 2013). As discussed in Gal and Hijzen (2016) and Andrews et al. (2016), these data are cleaned and benchmarked using a number of common procedures such as keeping accounts that refer to entire calendar year, using harmonized consolidation level of accounts, dropping observations with missing information on key variables as well as outliers identified as implausible changes or ratios. Monetary variables are deflated using 2-digit industry deflators from OECD STAN and national accounts and prices are expressed in industry purchasing power parities (PPPs).
Following Gal (2013), capital stock variables and firm and industry level productivity measures (labour productivity and multifactor productivity) using several methodologies are created. An estimate of firm level real capital stocks is constructed by deriving the real value of gross investment flows by deflating the difference in the book value of net capital stocks and depreciation between two years and applying the perpetual inventory method to gross investment flows using the book value of fixed tangible assets as the starting value. The baseline measure of MFP used in this analysis is the Solow-residual from a value added production function, using industry-specific but country- and time-invariant factor shares. It is calculated as: 𝑣𝑣𝑣𝑣 −(1 − 𝑠𝑠𝐿𝐿)𝑘𝑘 − 𝑠𝑠𝐿𝐿𝑙𝑙, where va, l and k denote the natural logarithm of firm value added, number of employees and capital stock, respectively, and 𝑠𝑠𝐿𝐿 is the ratio of labour costs to value added at the industry-level (using the average ratio across country and over time), based on the OECD STAN database (see Gal, 2013 for more details). Our results are robust to other measures of MFP (Table A12), including a measure derived from an IV estimation of the production function, following the method proposed by Wooldridge (2009).
ZOMBIE FIRMS
9
The analysis is based on unconsolidated accounts in order to avoid double-counting of
firms, which might occur if both the consolidated account of the parent-company and the unconsolidated accounts of its subsidiaries are present in the database. One potential source of bias when using unconsolidated accounts is that these data might be affected by corporate profit shifting strategies. In order to address this issue, we also conducted the analysis on the sample excluding firms which are part of multinational group (MNEs), relying on ORBIS ownership links data. The baseline econometric results are robust to excluding MNEs from the sample.
To address further issues arising from underrepresentation of certain industries and of small and young firms in ORBIS, we also align the ORBIS firm sample with the distribution of the firm population from the Structural Demographic Business Statistics (SDBS) collected by the OECD and Eurostat, based on confidential national business registers.7 This post-stratification procedure is of course based on the assumption that within each specific cell, ORBIS firms are representative of the true population – an assumption that may be problematic if the nature of selection varies across countries. The robustness of the baseline empirical results is tested by using these weights and also restricting the sample to firms with more than 20 employees.
3.2. Cross-country evidence on zombie firms
3.2.1. Identification of zombie firms
Past studies of zombie firms have used several definitions, ranging from less restrictive (firms with negative profits) to more restrictive (firms likely receiving subsidised credit), with different advantages and disadvantages.
A common approach uses operating characteristics to identify firms with persistent financial weakness. These could include: i) firms with an interest coverage ratio (the ratio of operating income to interest expenses) less than one for three consecutive years (Bank of Korea, 2013); ii) firms with negative profits (Bank of England, 2013); and iii)
7. The post-stratification procedure applies re-sampling weights based on the number of employees in each SDBS country-industry-size class cell to ‘scale up’ the number of ORBIS observations in each cell so that they match those observed in the SDBS (see Gal, 2013). For example, if SDBS employment is 30% higher than ORBIS employment in a given cell, then the 30% ‘extra’ employment is obtained by drawing firms randomly from the pool of ORBIS firms, such that the ‘extra’ firms will make up for the missing 30%.
ZOMBIE FIRMS
10
firms with negative value added. An advantage of these measures is that they are more easily comparable across countries and that ORBIS has the relevant information to construct them, but to the best of our knowledge, none of these measures has been utilised to create cross-country indicators.8
In the remainder of the paper, we employ a zombie classification based on the interest coverage ratio definition in the baseline analysis. This choice is driven by three main reasons: i) interest coverage ratios are better comparable across countries; ii) interest coverage ratios are less endogenous to productivity than negative profits; and iii) interest coverage ratios encompass channels other than subsidised credit through which zombie firms may be kept alive (e.g. non-performing loans, government guarantees to SMEs, weak insolvency regimes). More explicitly, a firm is defined as a zombie firm in 2013 if it is aged 10 years or older in 2013 and it had an interest coverage ratio less than one for three consecutive years (2011-2013). The age restriction is placed in order to address the fact that it may be difficult to distinguish real zombie firms from young innovative start-ups only based on profitability measures.9 Looking at the persistence of financial weakness via the three year window somewhat addresses the concerns regarding the business cycle effects on the prevalence of zombie firms.10 Further robustness of the measurement of zombie firms is tested by using various persistence time windows (4 and 5 years instead of 3) and age thresholds (15 and 20 years instead of 10) as well as a modified version of the definition employed in Caballero et al. (2008).11
3.2.2. Characteristics of zombie firms
Before proceeding, we explore the characteristics of zombie firms, specifically firm age and firm size. A firm is identified as a zombie firm if it has an interest coverage ratio less than one for three consecutive years, but at this stage, we place no restriction on firm age. Taking a simple unweighted average across zombie firms in 13 countries in 2013, the likelihood of being a zombie firm tends to increase with size: firms with 250
8. A very recent paper by Acharya et al. (2016) has looked at zombie firms in a number of European periphery countries, but their sample size is limited compared to ours, since they specifically look at firm-bank relationships. 9. In reality, there can be several reasons for a firm to have persistently negative profits. These include: i) young firms at the start of their lifecycle which can take a while to start making profits; ii) firms with high expected future profits which exhibit current weak performance; iii) state-owned enterprises that could exist for other reasons than profits. Nevertheless, there remain a number of firms without such characteristics that continue to survive, despite the fact that their exit would raise aggregate growth. 10. In the empirical analysis, the use of a strict fixed effects structure of interacted country, industry and year fixed effects further controls for the potential effect of the business cycle. 11. The seminal approach by Caballero et al. (2008) defines zombie firms as those potentially receiving subsidised bank credit. More specifically, actual observed interest payments made by the firm are compared to an estimated benchmark R* based on the firm debt structure and market interest rates. One simplified version of this approach, which is implementable with the data at hand, is the following:
𝑅𝑅𝑖𝑖,𝑡𝑡∗ = 𝑟𝑟𝑠𝑠𝑡𝑡−1𝐵𝐵𝐵𝐵𝑖𝑖,𝑡𝑡−1 + �15�
𝑟𝑟𝑙𝑙𝑡𝑡−𝑗𝑗
5
𝑗𝑗=1
�𝐵𝐵𝐵𝐵𝑖𝑖,𝑡𝑡−𝑗𝑗
where 𝐵𝐵𝐵𝐵𝑖𝑖,𝑡𝑡 is the short-term loans (less than one year) and B𝐵𝐵𝐵𝐵𝑖𝑖,𝑡𝑡 is the long-term debt (more than one year) of firm i at the end of year t, 𝑟𝑟𝑠𝑠𝑡𝑡 is the short-term prime rate and 𝑟𝑟𝑙𝑙𝑡𝑡 is the long-term rate at year t (𝑟𝑟𝑠𝑠𝑡𝑡 and 𝑟𝑟𝑙𝑙𝑡𝑡 are both calculated as annual average of monthly rates). This definition is as close as we can get to the measure defined in Caballero et al. (2008), which is hard to replicate exactly with the data available in ORBIS, as it requires very detailed information on the debt distribution of each firm in order to calculate an accurate lower bound measure (distinguishing between short-term and long-term bank borrowings as well as the amount of outstanding corporate bonds). Nevertheless, the use of ORBIS carries the advantage that it allows us to consider a much broader sample of firms than the dataset utilised in Caballero et al. (2008), which focuses on listed firms only.
ZOMBIE FIRMS
11
employees or more are nearly twice as more likely to be zombie firms than firms with less than 20 employees.12 This could be due to the fact that large firms are more likely to receive government subsidies since there is a preference to limit the employment loss due to the exit of large firms, especially during times of crises. Furthermore, banks might have incentives to keep large firms alive due to either relationship banking or bank forbearance (Agostino et al., 2008). This is in line with evidence based on listed firms in Japan, which finds that larger firms are typically more likely to be protected and become zombies, although this pattern tends to reverse for very large firms (Hoshi, 2006).
The likelihood of being a zombie firm is also higher for older firms: more than one out of ten firms over 40 years old are zombie firms. These firms are indeed most likely to have a large number of employees and receive subsidies from banks. A non-negligible share of young firms (5% of firms between two and five years old) also shows weak financial outcomes, which, as already mentioned in Section 3.2.1, may be due to the delay that start-ups face to reach positive economic returns. Thus, firms that are less than 10 years old are excluded from the zombie measure presented in the next sections.
3.2.3. Prevalence of zombie firms
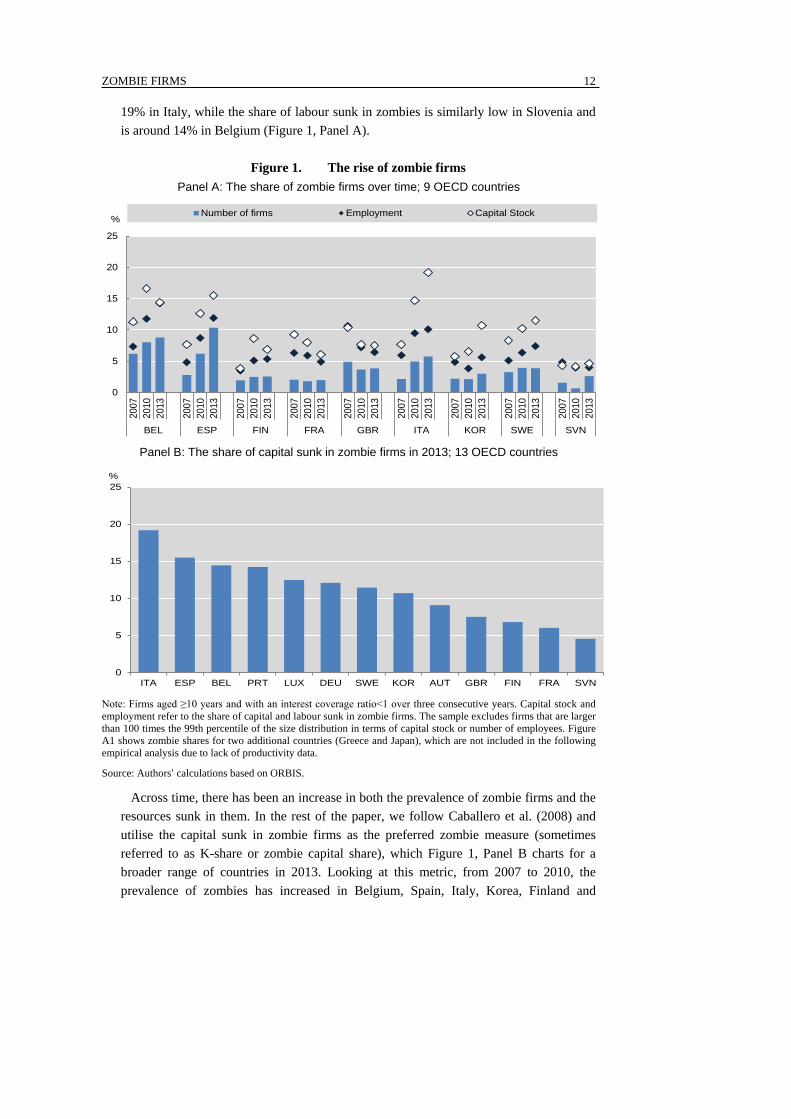
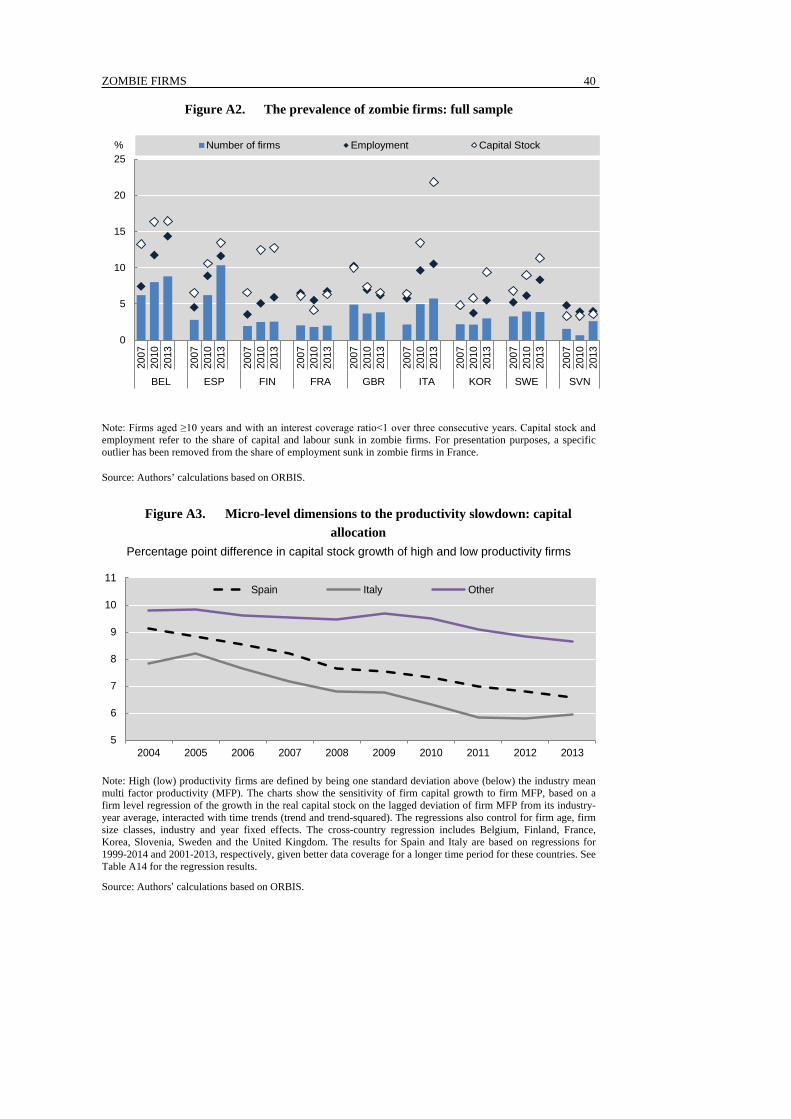
Panel A of Figure 1 shows the relative importance of zombie firms, defined as those 10 years or older and with an interest coverage ratio less than one over three consecutive years. For each country, zombie shares are shown for 2007, 2010 and 2013 – for example, the zombie shares in 2007 correspond to the period between 2005 and 2007 – both in terms of the number of zombie firms and for two size weighted measures: the share of industry labour and capital sunk in zombie firms. For presentational purposes and to ensure that the results are not driven by a few large outlier firms and more specifically those with a specific financial structure (e.g. some state-owned enterprises), we exclude firms that are larger than 100 times the 99th percentile of the size distribution in terms of capital stock or number of employees. While there are several differences for some countries, the general pattern across countries and across time remains fairly stable when we reconstruct the zombie estimates using data for all firms (see Figure A2 in the Appendix for estimates based on all firms).13 In the remainder of the paper, we utilise zombie industry capital shares constructed from the full dataset but the econometric analysis is robust to using zombie shares based on either approach.
In Italy in 2013, 6% of firms were classified as zombies, while the share of the capital stock and employment (covered by the ORBIS sample) sunk in zombie firms was 19% and 10%, respectively. Significant cross-country differences also emerge. In 2013, the share of zombies in terms of the number of firms is highest at 10% in Spain, and lowest in France at 2%. The latter is consistent with analysis suggesting that zombie lending is not widespread in France (Avouyi-Dovi et al., 2016). Estimates of the share of the capital stock sunk in zombie firms in 2013 range from under 5% in Slovenia to up to
12. Detailed statistics by age and size are available in Table A17. 13. For example, in Finland in 2013, the share of the capital stock sunk in zombie firms is 12% when data for all firms is utilised (see Figure A2), compared to 7% in Figure 1. In Italy, the zombie capital share for 2013 falls from 22% to 19%, when outliers are excluded.
ZOMBIE FIRMS
12
19% in Italy, while the share of labour sunk in zombies is similarly low in Slovenia and is around 14% in Belgium (Figure 1, Panel A).
Figure 1. The rise of zombie firms
Panel A: The share of zombie firms over time; 9 OECD countries
Panel B: The share of capital sunk in zombie firms in 2013; 13 OECD countries
Note: Firms aged ≥10 years and with an interest coverage ratio<1 over three consecutive years. Capital stock and employment refer to the share of capital and labour sunk in zombie firms. The sample excludes firms that are larger than 100 times the 99th percentile of the size distribution in terms of capital stock or number of employees. Figure A1 shows zombie shares for two additional countries (Greece and Japan), which are not included in the following empirical analysis due to lack of productivity data.
Source: Authors’ calculations based on ORBIS.
Across time, there has been an increase in both the prevalence of zombie firms and the resources sunk in them. In the rest of the paper, we follow Caballero et al. (2008) and utilise the capital sunk in zombie firms as the preferred zombie measure (sometimes referred to as K-share or zombie capital share), which Figure 1, Panel B charts for a broader range of countries in 2013. Looking at this metric, from 2007 to 2010, the prevalence of zombies has increased in Belgium, Spain, Italy, Korea, Finland and
0
5
10
15
20
25
2007
2010
2013
2007
2010
2013
2007
2010
2013
2007
2010
2013
2007
2010
2013
2007
2010
2013
2007
2010
2013
2007
2010
2013
2007
2010
2013
BEL ESP FIN FRA GBR ITA KOR SWE SVN
Number of firms Employment Capital Stock%
0
5
10
15
20
25
ITA ESP BEL PRT LUX DEU SWE KOR AUT GBR FIN FRA SVN
%
ZOMBIE FIRMS
13
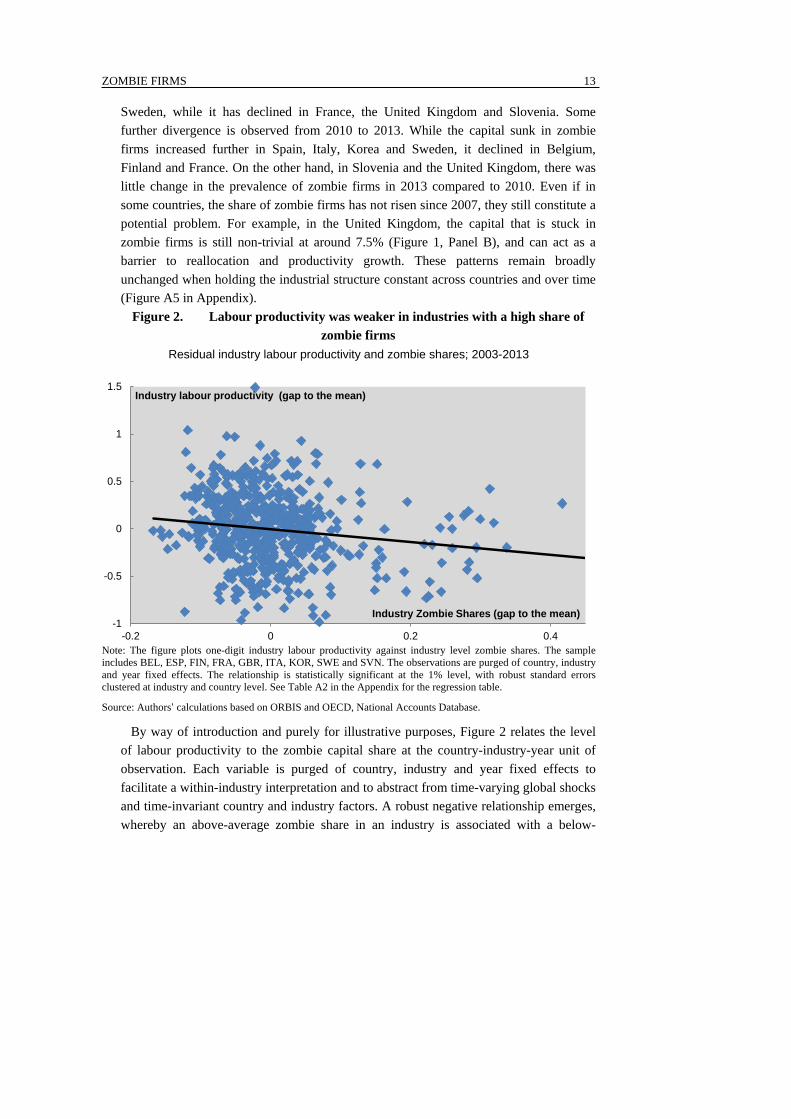
Sweden, while it has declined in France, the United Kingdom and Slovenia. Some further divergence is observed from 2010 to 2013. While the capital sunk in zombie firms increased further in Spain, Italy, Korea and Sweden, it declined in Belgium, Finland and France. On the other hand, in Slovenia and the United Kingdom, there was little change in the prevalence of zombie firms in 2013 compared to 2010. Even if in some countries, the share of zombie firms has not risen since 2007, they still constitute a potential problem. For example, in the United Kingdom, the capital that is stuck in zombie firms is still non-trivial at around 7.5% (Figure 1, Panel B), and can act as a barrier to reallocation and productivity growth. These patterns remain broadly unchanged when holding the industrial structure constant across countries and over time (Figure A5 in Appendix).
Figure 2. Labour productivity was weaker in industries with a high share of zombie firms
Residual industry labour productivity and zombie shares; 2003-2013
Note: The figure plots one-digit industry labour productivity against industry level zombie shares. The sample includes BEL, ESP, FIN, FRA, GBR, ITA, KOR, SWE and SVN. The observations are purged of country, industry and year fixed effects. The relationship is statistically significant at the 1% level, with robust standard errors clustered at industry and country level. See Table A2 in the Appendix for the regression table.
Source: Authors’ calculations based on ORBIS and OECD, National Accounts Database.
By way of introduction and purely for illustrative purposes, Figure 2 relates the level of labour productivity to the zombie capital share at the country-industry-year unit of observation. Each variable is purged of country, industry and year fixed effects to facilitate a within-industry interpretation and to abstract from time-varying global shocks and time-invariant country and industry factors. A robust negative relationship emerges, whereby an above-average zombie share in an industry is associated with a below-
-1
-0.5
0
0.5
1
1.5
-0.2 0 0.2 0.4
Industry Zombie Shares (gap to the mean)
Industry labour productivity (gap to the mean)
ZOMBIE FIRMS
14
average industry labour productivity performance (Table A2; Figure 2).14 The coefficient estimates imply that a 3.5% rise in the share of zombie firms – roughly equivalent to that observed between 2005 and 2013 on average across the nine OECD countries in the sample – is associated with a 1.2% decline in the level of labour productivity across industries. Accordingly, the remainder of the paper explores in more detail the channels through which zombie congestion may adversely affect labour productivity performance.
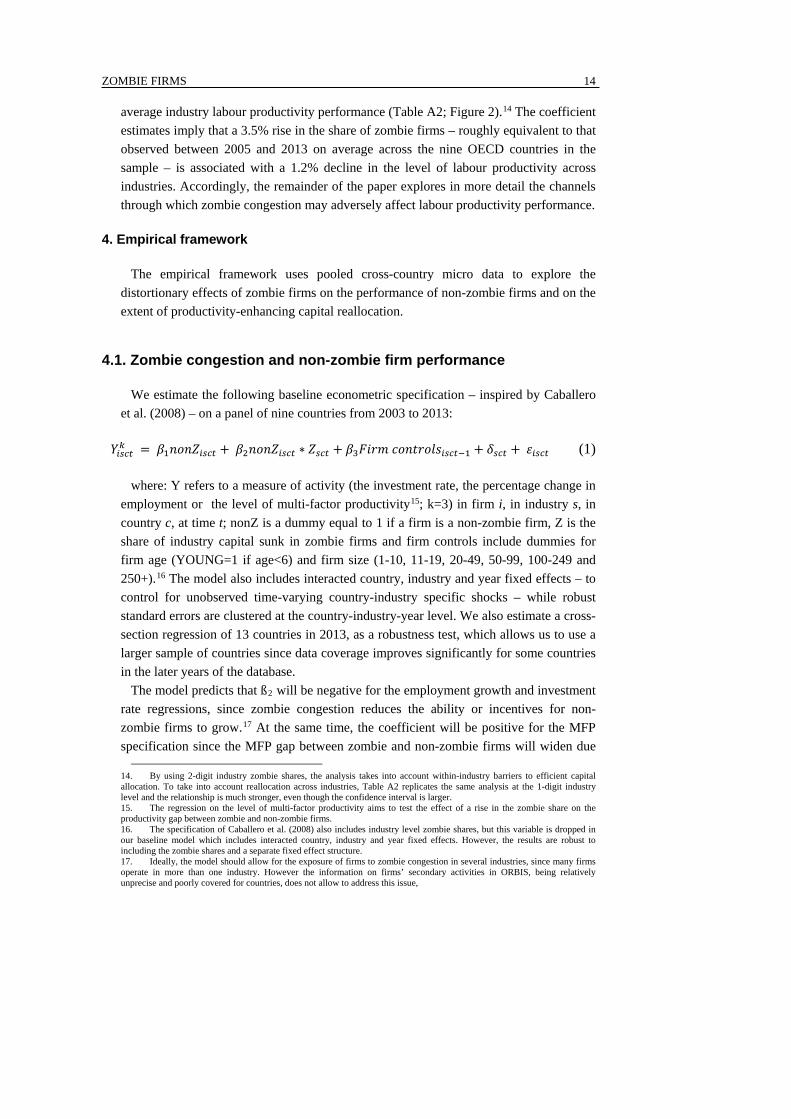
4. Empirical framework
The empirical framework uses pooled cross-country micro data to explore the distortionary effects of zombie firms on the performance of non-zombie firms and on the extent of productivity-enhancing capital reallocation.
4.1. Zombie congestion and non-zombie firm performance
We estimate the following baseline econometric specification – inspired by Caballero et al. (2008) – on a panel of nine countries from 2003 to 2013:
where: Y refers to a measure of activity (the investment rate, the percentage change in employment or the level of multi-factor productivity15; k=3) in firm i, in industry s, in country c, at time t; nonZ is a dummy equal to 1 if a firm is a non-zombie firm, Z is the share of industry capital sunk in zombie firms and firm controls include dummies for firm age (YOUNG=1 if age<6) and firm size (1-10, 11-19, 20-49, 50-99, 100-249 and 250+).16 The model also includes interacted country, industry and year fixed effects – to control for unobserved time-varying country-industry specific shocks – while robust standard errors are clustered at the country-industry-year level. We also estimate a cross-section regression of 13 countries in 2013, as a robustness test, which allows us to use a larger sample of countries since data coverage improves significantly for some countries in the later years of the database.
The model predicts that ß2 will be negative for the employment growth and investment rate regressions, since zombie congestion reduces the ability or incentives for non-zombie firms to grow.17 At the same time, the coefficient will be positive for the MFP specification since the MFP gap between zombie and non-zombie firms will widen due
14. By using 2-digit industry zombie shares, the analysis takes into account within-industry barriers to efficient capital allocation. To take into account reallocation across industries, Table A2 replicates the same analysis at the 1-digit industry level and the relationship is much stronger, even though the confidence interval is larger. 15. The regression on the level of multi-factor productivity aims to test the effect of a rise in the zombie share on the productivity gap between zombie and non-zombie firms. 16. The specification of Caballero et al. (2008) also includes industry level zombie shares, but this variable is dropped in our baseline model which includes interacted country, industry and year fixed effects. However, the results are robust to including the zombie shares and a separate fixed effect structure. 17. Ideally, the model should allow for the exposure of firms to zombie congestion in several industries, since many firms operate in more than one industry. However the information on firms’ secondary activities in ORBIS, being relatively unprecise and poorly covered for countries, does not allow to address this issue,
ZOMBIE FIRMS
15
to the higher productivity threshold that entrants must clear to overcome the entry barriers that zombie firms create (see Section 2). The coefficient on the non-zombie dummy (ß1) is difficult to interpret: it could be positive if zombie firms are not in a position to spend as much as healthy firms, but it could be negative if zombie firms receive very increasingly large subsidies. Hence, in the discussion of the results in Section 5.1, we concentrate on the coefficient of the interaction term of the non-zombie dummy and the industry zombie shares (ß2).
We control for cyclical influences which could simultaneously raise the prevalence of zombie firms and adversely affect firm performance in a number of ways. First, the econometric specification is designed with a highly burdensome fixed effect structure that controls for unobserved time-varying country-industry specific shocks, including the overall (un)attractiveness of operating in an industry in a given country for that year. Second, we check the robustness of the results to restricting the sample to the pre-crisis period (Section 5.3.2). Third, a number of robustness tests are conducted to specifically address this issue, as detailed in section 5.3. Nonetheless, one needs to be careful in the causal interpretation of the results, since the only way to show that the causality runs from zombie congestion to firm outcomes would be if zombie firms were randomly assigned to industries.
4.2. Zombie congestion and capital reallocation
It is important to note that the coefficient estimates from equation (1) refer to the effect of zombies on the performance of a typical non-zombie firm; that is, they correspond to an average effect. However, the concept of the average firm becomes more tenuous in the context of the widespread heterogeneity in firm productivity that exists within narrowly-defined sectors (Section 2). Indeed, the distortionary effects might be larger than that captured in the baseline model in equation (1) if zombie congestion disproportionately reduces the ability of more productive firms to attract capital and grow. To test for the potential distortionary effects of zombie congestion on resource allocation, we augment canonical models of firm dynamics which predict that conditional on firm size, firms with higher MFP grow more quickly (see Foster et al., 2016; Decker et al., 2016).18,19
We consider a baseline specification for a panel of 9 countries from 2003 to 2013, based on the following model:
18. Canonical models of firm dynamics suggest that the observed pace of firm volatility is driven by the interaction between idiosyncratic firm-specific shocks and the frictions on adjustment (entry, exit, expansion and contraction) for firms (Hopenhayn, 1992; Jovanovic, 1982). This implies that reallocation can be due to either a change in the intensity of shocks or a change in the responsiveness to productivity shocks. Applying these models to US data, Decker et al. (2016) find that the latter can account for the changing pattern of reallocation over time. 19. One advantage of this approach of estimating the contribution of reallocation is that it disciplines firm growth on productivity, in contrast to other methodologies (i.e. Foster, Haltiwanger and Krizan, 1996; Olley and Pakes, 1996) where the estimated contribution of reallocation could arise for a number of reasons, unrelated to productivity-enhancing reallocation.
where K growth is the change in real capital stock for firm i, in industry s, in country c, at time t; MFP denotes a measure of firm-level multi-factor productivity which is a deviation from the country-industry-year average to control for MFP differences across industries and countries; Z is the share of industry resources (labour or capital) sunk in zombie firms; firm controls are dummies for firm age and firm size as described above. The model also controls for interacted country, industry and year fixed effects to control for time-varying country-industry-specific shocks, while robust standard errors are clustered at the country, industry and year level. The model predicts that ß1 will be positive since firms with higher productivity are expected to attract resources and grow, while ß2 will be negative if the presence of zombie firms distorts the efficiency of capital reallocation. Similar to the previous model, we also estimate a cross-section regression of 13 countries in 2013 as a robustness check.
5. Empirical results
5.1. Zombie congestion and non-zombie firm performance
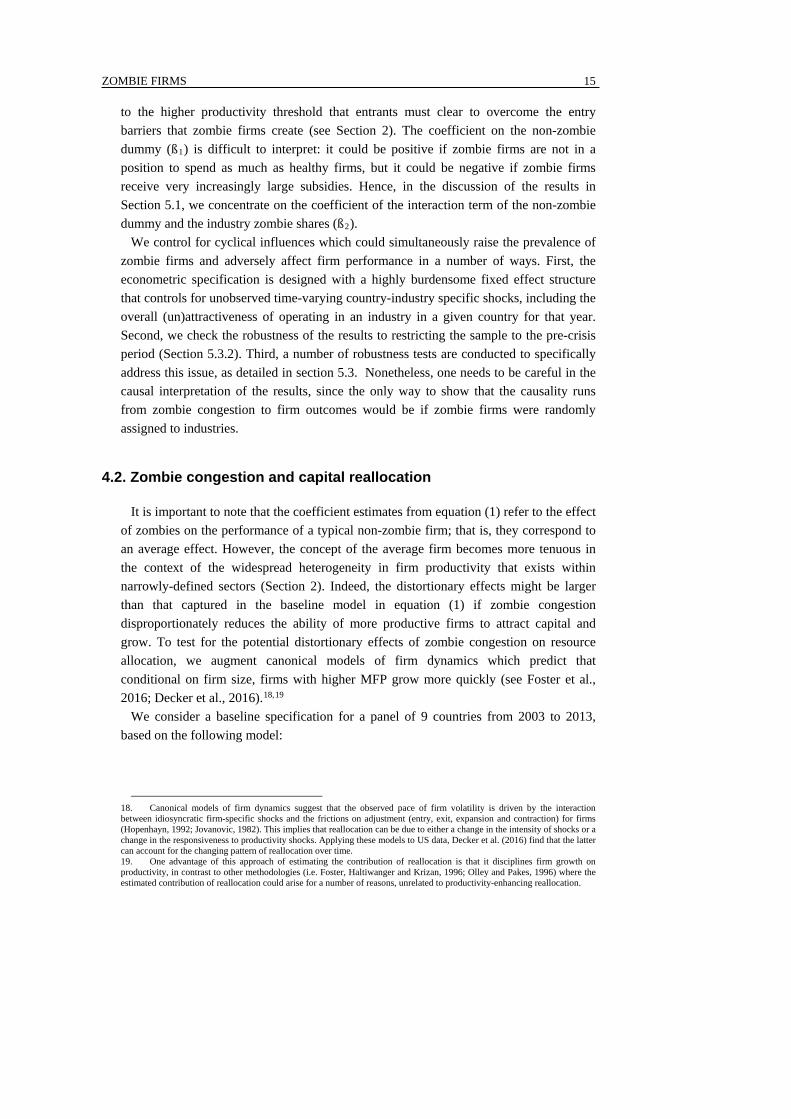
Table 1 (Panel A) presents the baseline estimates of equation (1) where the distortionary effects of zombie firms are analysed in terms of the investment rate, the employment growth and the level of MFP of non-zombie firms relative to zombie firms. Industry zombie percentage is based on the share of capital sunk in zombie firms (see Section 3.1). The interaction terms in Columns 1 and 4 show that across countries, an increase in the zombie share at the industry level is associated with lower investment for the average non-zombie firm relative to the average zombie firm. The same is true with respect to employment growth (Columns 2 and 5).20
Columns 3 and 6 of Table 1 show that the MFP gap between zombie firms and non-zombie firms rises as the percentage of zombies in an industry rises, which is in line with the predictions of the model in Caballero et al. (2008). The results suggest that the presence of zombie firms creates distortions, which depress productivity by preserving inefficient firms at the expense of more productive potential entrants. At the same time, since zombie firms create “congestion”, which creates barriers to entry, the marginal entrant needs to clear a higher productivity threshold for entry to compensate for lower profitability caused by congestion. This, in turn, amplifies the productivity gap between zombie and non-zombie firms.
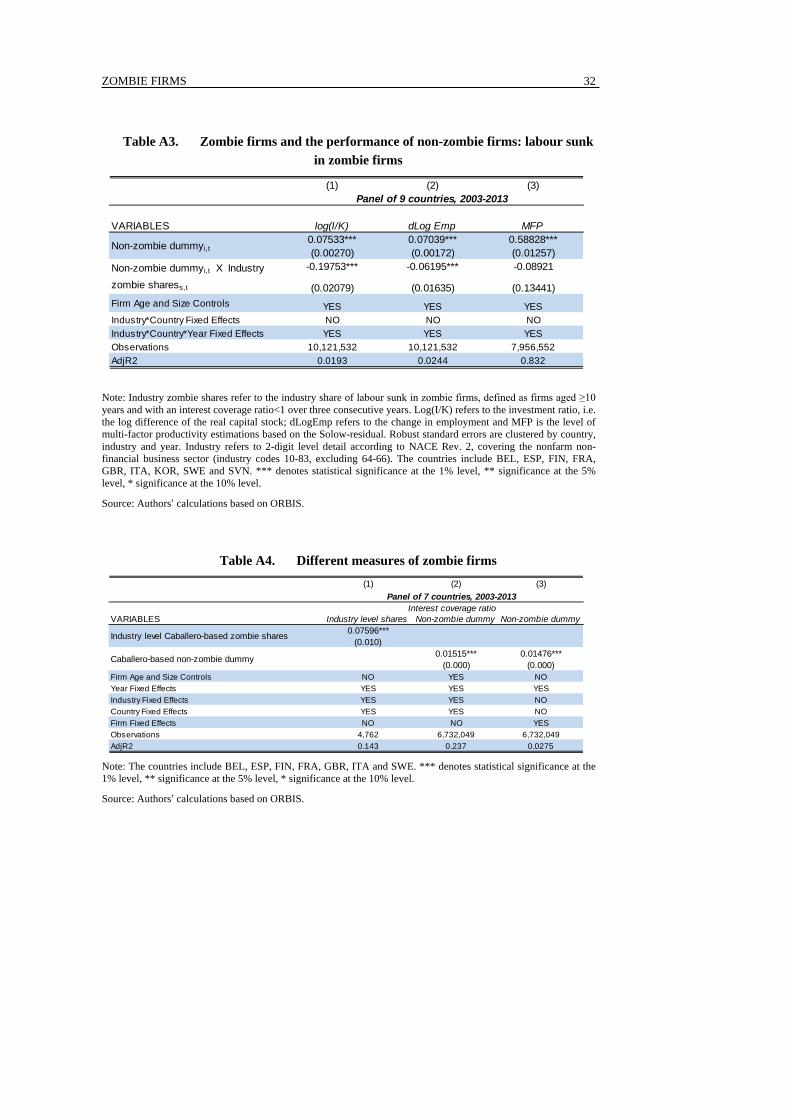
20. The results on investment and employment growth continue to hold when the share of labour sunk in zombie firms is used to define zombie shares (Table A3).
ZOMBIE FIRMS
17
Table 1. Zombie firms and non-zombie firm performance
Note: Industry zombie shares refer to the share of industry capital sunk in zombie firms, defined as firms aged ≥10 years and with an interest coverage ratio<1 over three consecutive years. Log(I/K) refers to the investment ratio, i.e. the log difference of the real capital stock; dLogEmp refers to the change in employment and MFP is the level of multi-factor productivity estimations based on the Solow-residual. Robust standard errors are clustered by country, industry and year. Industry refers to 2-digit level detail according to NACE Rev. 2, covering the non-farm non-financial business sector (industry codes 10-83, excluding 64-66). The countries in Panel A include BEL, ESP, FIN, FRA, GBR, ITA, KOR, SWE and SVN, while the cross-section in Panel B adds AUT, DEU, LUX and PRT. *** denotes statistical significance at the 1% level, ** significance at the 5% level, * significance at the 10% level.
Source: Authors’ calculations based on ORBIS.
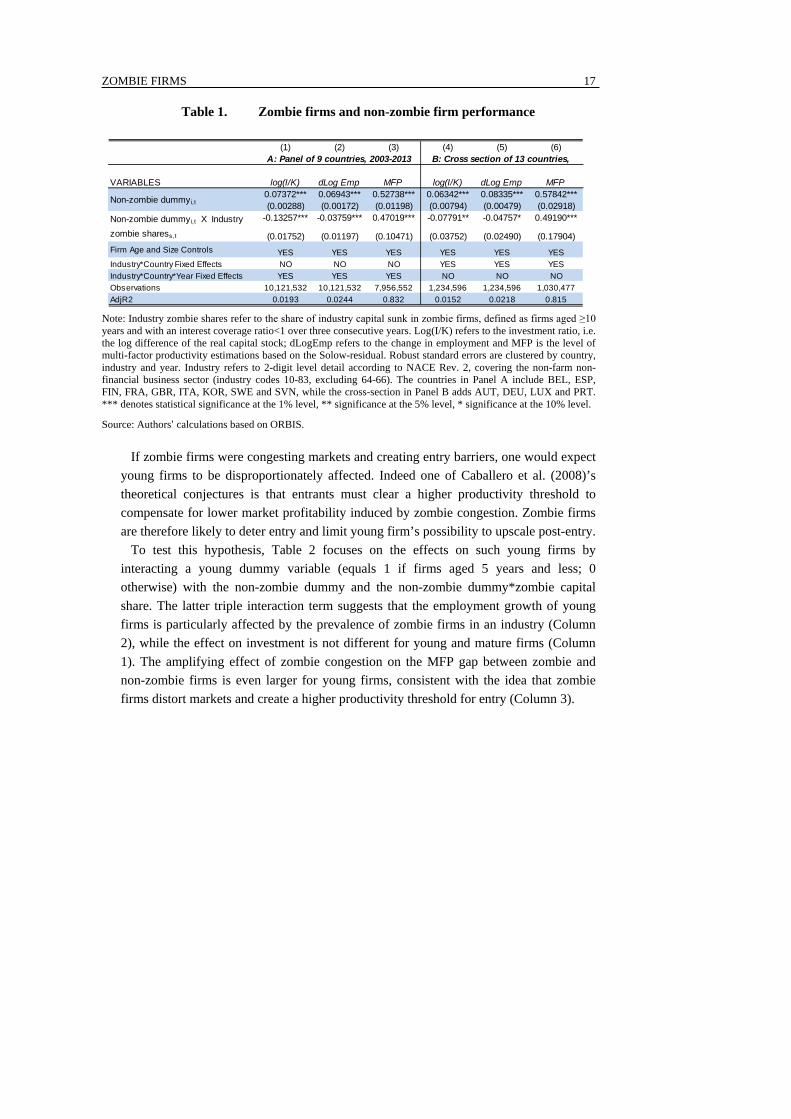
If zombie firms were congesting markets and creating entry barriers, one would expect young firms to be disproportionately affected. Indeed one of Caballero et al. (2008)’s theoretical conjectures is that entrants must clear a higher productivity threshold to compensate for lower market profitability induced by zombie congestion. Zombie firms are therefore likely to deter entry and limit young firm’s possibility to upscale post-entry.
To test this hypothesis, Table 2 focuses on the effects on such young firms by interacting a young dummy variable (equals 1 if firms aged 5 years and less; 0 otherwise) with the non-zombie dummy and the non-zombie dummy*zombie capital share. The latter triple interaction term suggests that the employment growth of young firms is particularly affected by the prevalence of zombie firms in an industry (Column 2), while the effect on investment is not different for young and mature firms (Column 1). The amplifying effect of zombie congestion on the MFP gap between zombie and non-zombie firms is even larger for young firms, consistent with the idea that zombie firms distort markets and create a higher productivity threshold for entry (Column 3).
(0.01752) (0.01197) (0.10471) (0.03752) (0.02490) (0.17904)Firm Age and Size Controls YES YES YES YES YES YESIndustry*Country Fixed Effects NO NO NO YES YES YESIndustry*Country*Year Fixed Effects YES YES YES NO NO NOObservations 10,121,532 10,121,532 7,956,552 1,234,596 1,234,596 1,030,477AdjR2 0.0193 0.0244 0.832 0.0152 0.0218 0.815
Non-zombie dummyi,t X Industry zombie sharess,t
Non-zombie dummyi,t
A: Panel of 9 countries, 2003-2013 B: Cross section of 13 countries,
ZOMBIE FIRMS
18
Table 2. Zombie firms and the performance of young firms
Note: Industry zombie shares refer to the industry share of capital sunk in zombie firms, defined as firms aged ≥10 years and with an interest coverage ratio<1 over three consecutive years. Young dummy is equal to 1 if firm age is less than 6. Log(I/K) refers to the investment ratio, i.e. the log difference of the real capital stock; dLogEmp refers to the change in employment and MFP is the level of multi-factor productivity estimations based on the Solow-residual. Robust standard errors are clustered by country, industry and year. Industry refers to 2-digit level detail according to NACE Rev. 2, covering the nonfarm non-financial business sector (industry codes 10-83, excluding 64-66). The countries include BEL, ESP, FIN, FRA, GBR, ITA, KOR, SWE and SVN. *** denotes statistical significance at the 1% level, ** significance at the 5% level, * significance at the 10% level.
Source: Authors’ calculations based on ORBIS.
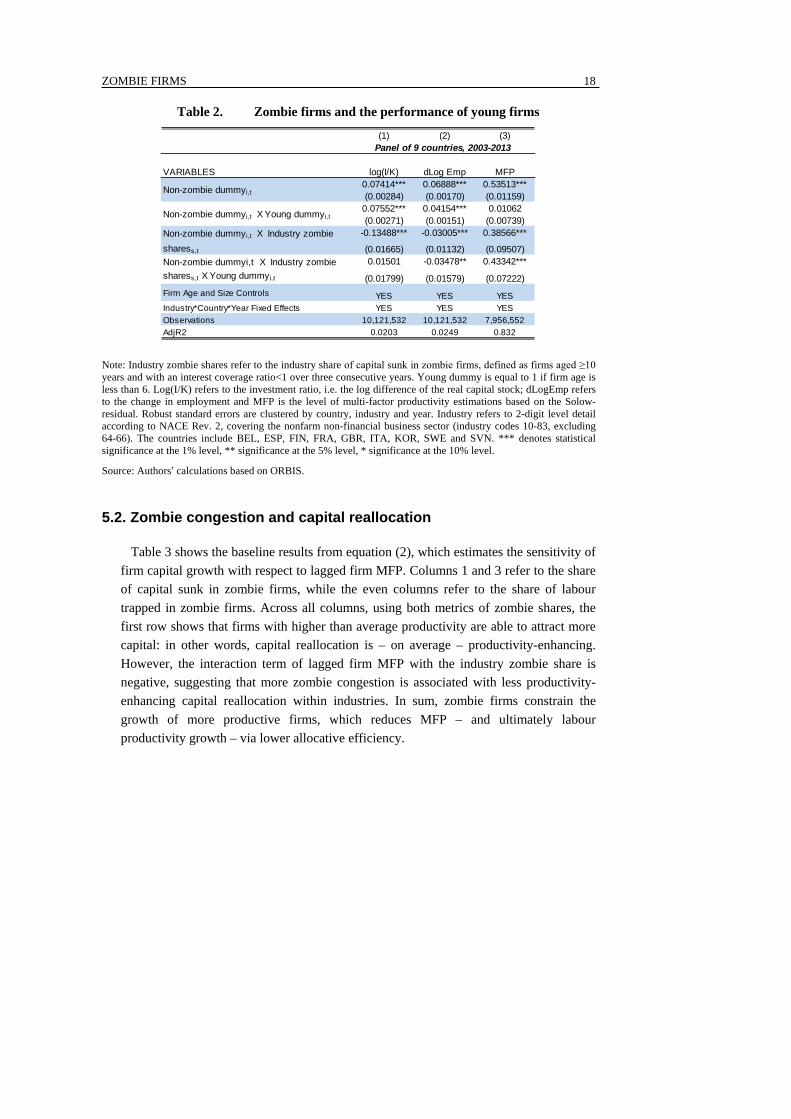
5.2. Zombie congestion and capital reallocation
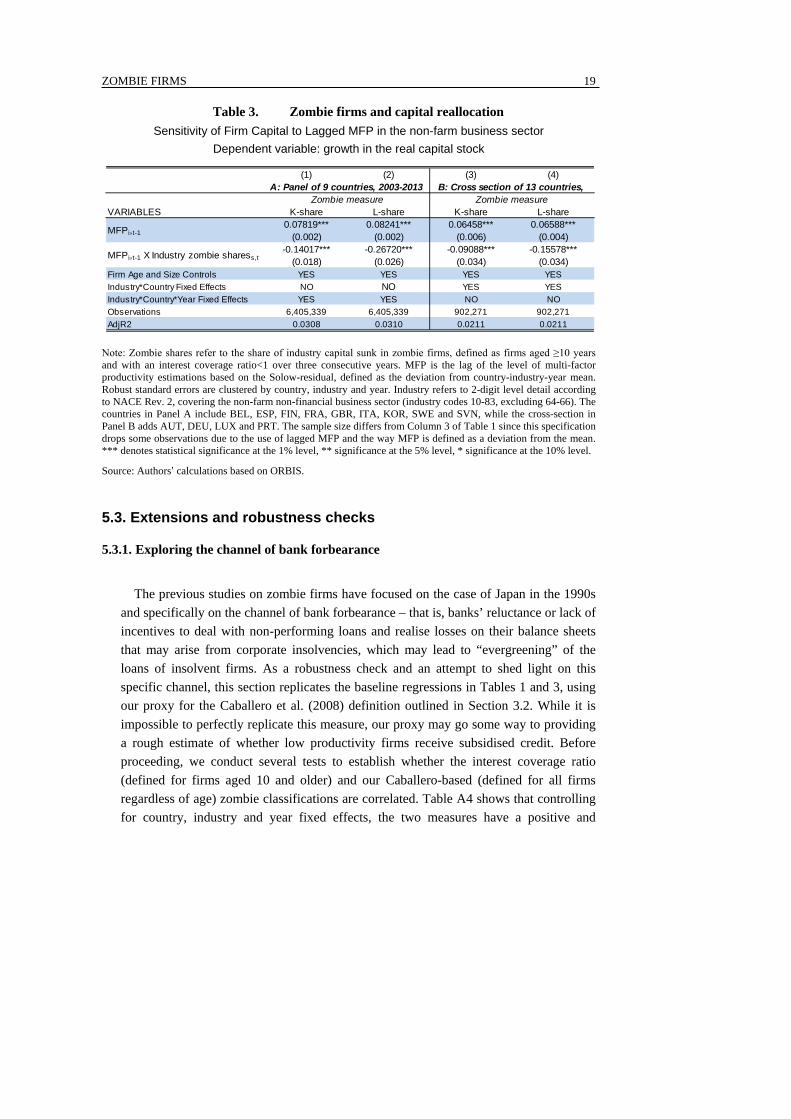
Table 3 shows the baseline results from equation (2), which estimates the sensitivity of firm capital growth with respect to lagged firm MFP. Columns 1 and 3 refer to the share of capital sunk in zombie firms, while the even columns refer to the share of labour trapped in zombie firms. Across all columns, using both metrics of zombie shares, the first row shows that firms with higher than average productivity are able to attract more capital: in other words, capital reallocation is – on average – productivity-enhancing. However, the interaction term of lagged firm MFP with the industry zombie share is negative, suggesting that more zombie congestion is associated with less productivity-enhancing capital reallocation within industries. In sum, zombie firms constrain the growth of more productive firms, which reduces MFP – and ultimately labour productivity growth – via lower allocative efficiency.
Non-zombie dummyi,t X Industry zombie sharess,t X Young dummyi,t
Panel of 9 countries, 2003-2013
Non-zombie dummyi,t
Non-zombie dummyi,t X Young dummyi,t
Non-zombie dummyi,t X Industry zombie sharess,t
ZOMBIE FIRMS
19
Table 3. Zombie firms and capital reallocation Sensitivity of Firm Capital to Lagged MFP in the non-farm business sector
Dependent variable: growth in the real capital stock
Note: Zombie shares refer to the share of industry capital sunk in zombie firms, defined as firms aged ≥10 years and with an interest coverage ratio<1 over three consecutive years. MFP is the lag of the level of multi-factor productivity estimations based on the Solow-residual, defined as the deviation from country-industry-year mean. Robust standard errors are clustered by country, industry and year. Industry refers to 2-digit level detail according to NACE Rev. 2, covering the non-farm non-financial business sector (industry codes 10-83, excluding 64-66). The countries in Panel A include BEL, ESP, FIN, FRA, GBR, ITA, KOR, SWE and SVN, while the cross-section in Panel B adds AUT, DEU, LUX and PRT. The sample size differs from Column 3 of Table 1 since this specification drops some observations due to the use of lagged MFP and the way MFP is defined as a deviation from the mean. *** denotes statistical significance at the 1% level, ** significance at the 5% level, * significance at the 10% level.
Source: Authors’ calculations based on ORBIS.
5.3. Extensions and robustness checks
5.3.1. Exploring the channel of bank forbearance
The previous studies on zombie firms have focused on the case of Japan in the 1990s
and specifically on the channel of bank forbearance – that is, banks’ reluctance or lack of incentives to deal with non-performing loans and realise losses on their balance sheets that may arise from corporate insolvencies, which may lead to “evergreening” of the loans of insolvent firms. As a robustness check and an attempt to shed light on this specific channel, this section replicates the baseline regressions in Tables 1 and 3, using our proxy for the Caballero et al. (2008) definition outlined in Section 3.2. While it is impossible to perfectly replicate this measure, our proxy may go some way to providing a rough estimate of whether low productivity firms receive subsidised credit. Before proceeding, we conduct several tests to establish whether the interest coverage ratio (defined for firms aged 10 and older) and our Caballero-based (defined for all firms regardless of age) zombie classifications are correlated. Table A4 shows that controlling for country, industry and year fixed effects, the two measures have a positive and
(0.018) (0.026) (0.034) (0.034)Firm Age and Size Controls YES YES YES YESIndustry*Country Fixed Effects NO NO YES YESIndustry*Country*Year Fixed Effects YES YES NO NOObservations 6,405,339 6,405,339 902,271 902,271AdjR2 0.0308 0.0310 0.0211 0.0211
MFPi,t-1 X Industry zombie sharess,t
B: Cross section of 13 countries, A: Panel of 9 countries, 2003-2013Zombie measure Zombie measure
MFPi,t-1
ZOMBIE FIRMS
20
significant relationship, both with respect to whether a particular firm is classified as a zombie and zombie capital shares at the industry level.21
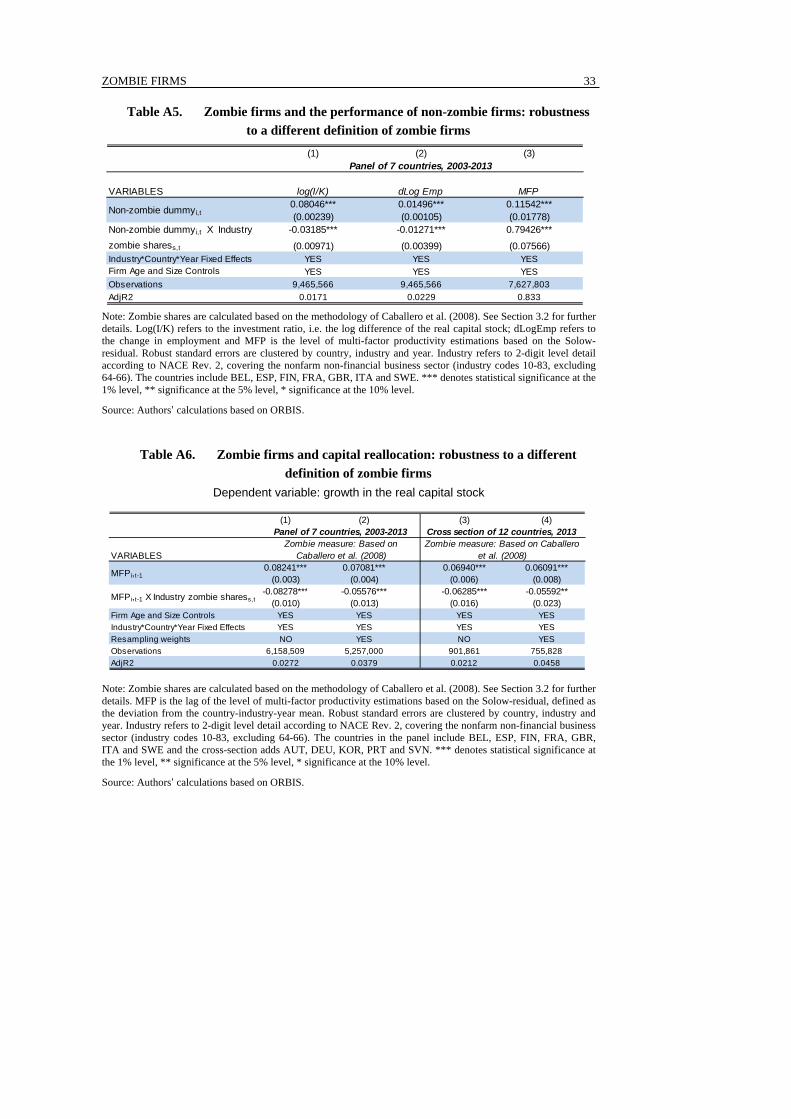
The baseline results presented in Tables 1 and 3 are robust to using zombie shares based on this alternative definition for a panel of seven countries for the period 2003 to 2013.22 Across countries, a rise in the subsidised credit definition of the zombie share at the industry level is associated with: i) lower investment and employment growth for non-zombie firms (Table A5, Columns 1-2); ii) a larger MFP gap between zombie and non-zombie firms (Table A5, Columns 3); and iii) less productivity-enhancing capital reallocation (Table A6).23 These results suggest that bank forbearance might be a channel through which zombie firms contribute to the productivity slowdown.
5.3.2. Restricting the sample to the pre-crisis period
As discussed in Section 4, to address the concerns that the relationship between zombie firms, the performance of non-zombie firms and productivity-enhancing capital reallocation could be partly driven by cyclical effects, we test the robustness of the baseline results in Tables 1 and 3 by restricting the sample period to 2003-2007. The first two columns of Table A7 show that an increase in the zombie share at the industry level is associated with lower investment and employment growth for the average non-zombie firm in the pre-crisis period.24 Columns 3 and 4 of Table A7 show that more zombie congestion is associated with less productivity-enhancing capital reallocation within industries between 2003 and 2007. These results suggest that resources trapped in zombie firms was a policy issue even before the crisis and further support the view that there is a structural dimension to the conjecture that the continued survival of weak firms is stifling labour productivity performance.
5.3.3. Excluding firms which are part of a multinational group
As discussed in Section 3.1, another source bias which might affect the identification of zombie firms comes from potential corporate profit shifting strategies, which are especially likely to take place in multinational groups (MNEs). In order to address this issue, we tested the robustness of the baseline results to excluding from the sample the firms which are part of MNEs. MNEs are identified using global ultimate owner (GUO) controlling at least 50% of the shares in ORBIS ownership links data: a firm is considered as part of an MNE if its GUO is located in another country, or if at least one of the firms controlled by its GUO is located in a foreign country. When excluding MNEs from the sample, the share of capital sunk in zombie firms (see Figure 1) remains nearly unchanged, increasing only by 0.9% on average across countries included in our
21. Our analysis suggests that the firm level correlation is robust to including firm fixed effects and firm controls, such as age and size, to control for the fact that the interest coverage ratio is defined for firms aged 10 and older. 22. The use of this definition lowers the number of countries in the sample to seven with Korea and Slovenia being dropped due to lack of data availability. 23. The results are robust to using a cross-section of 12 countries for 2013 (Column 3 of Table A6) and using resampling weights based on the SDBS to address representativeness issues (Columns 2 and 4). 24. The baseline results of the rising MFP gap between zombie firms and non-zombie firms with higher shares of zombies in an industry do not hold in the pre-crisis period, suggesting that the prevalence of zombie firms might affect entry with a lag.
ZOMBIE FIRMS
21
sample. Moreover, when we exclude MNEs from the sample, the econometric estimates of equation 1 (see Table A8) are qualitatively similar to the baseline estimates in Table 1.25
5.3.4. Other robustness checks
The baseline results in Tables 1 and 3 are robust to a number of further specifications:
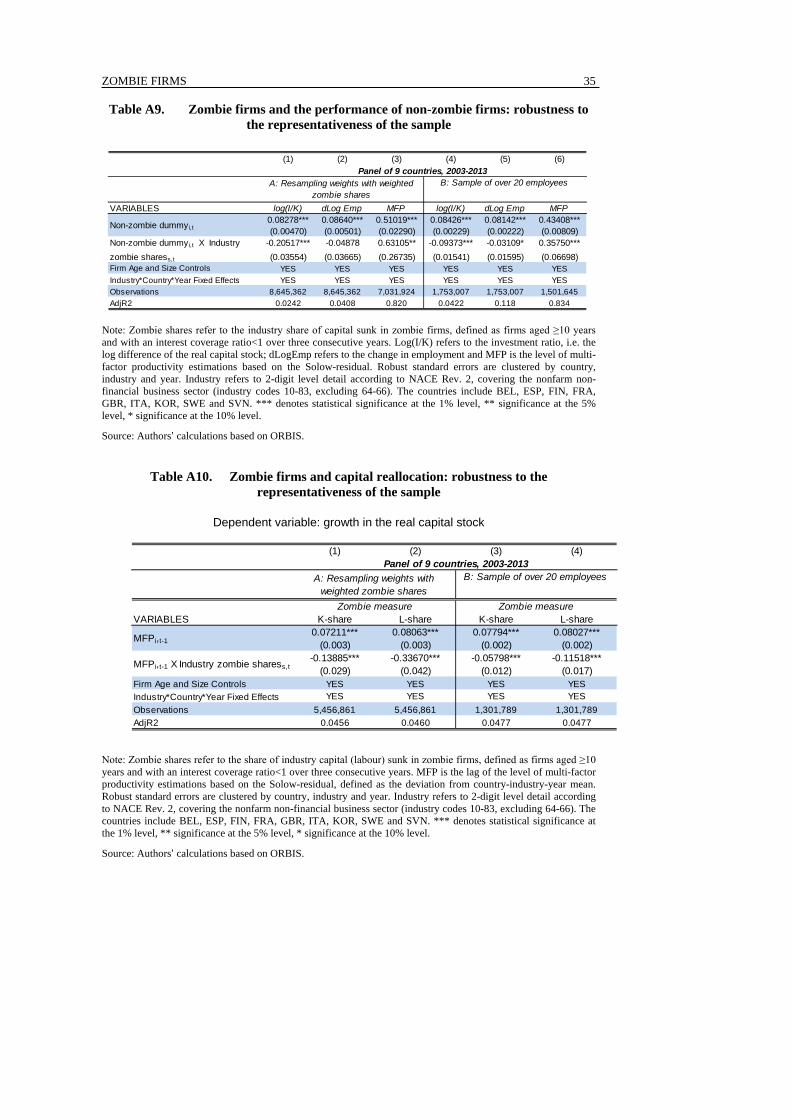
• Addressing the representativeness issues discussed in Section 3.1 by: i) using weights based on the Structural Demographics and Business Statistics of the OECD (SDBS) in the regressions and the construction of the industry level zombie shares (Columns 1-3 of Panel A of Table A9 and Columns 1 and 2 of Panel A of Table A10)26; and ii) excluding firms with less than 20 employees (Columns 4-6 of Panel B of Table A9 and Columns 3 and 4 of Panel B of Table A10).
• Addressing potential cyclical influences which could simultaneously raise the prevalence of zombie firms and adversely affect firm performance, using: i) different definitions of the zombie measure based on the interest coverage ratio such as looking at only firms aged above 15 and 20 years instead of 10 years, and persistence measures based on 4 and 5 years instead of 3 years; ii) different fixed effects and clustering techniques at the country, sector, and/or time level27; iii) excluding one country at a time from the sample; iv) excluding Italy and Spain – which were particularly affected by the crisis – from the sample; and v) excluding outliers from the sample.28
• Using: i) interest coverage ratio based on operating profits before depreciation and amortisation, to take into account potential balance sheets manipulations through depreciation and amortisation; ii) zombie measures based on persistent negative profit before tax or persistent negative net income.
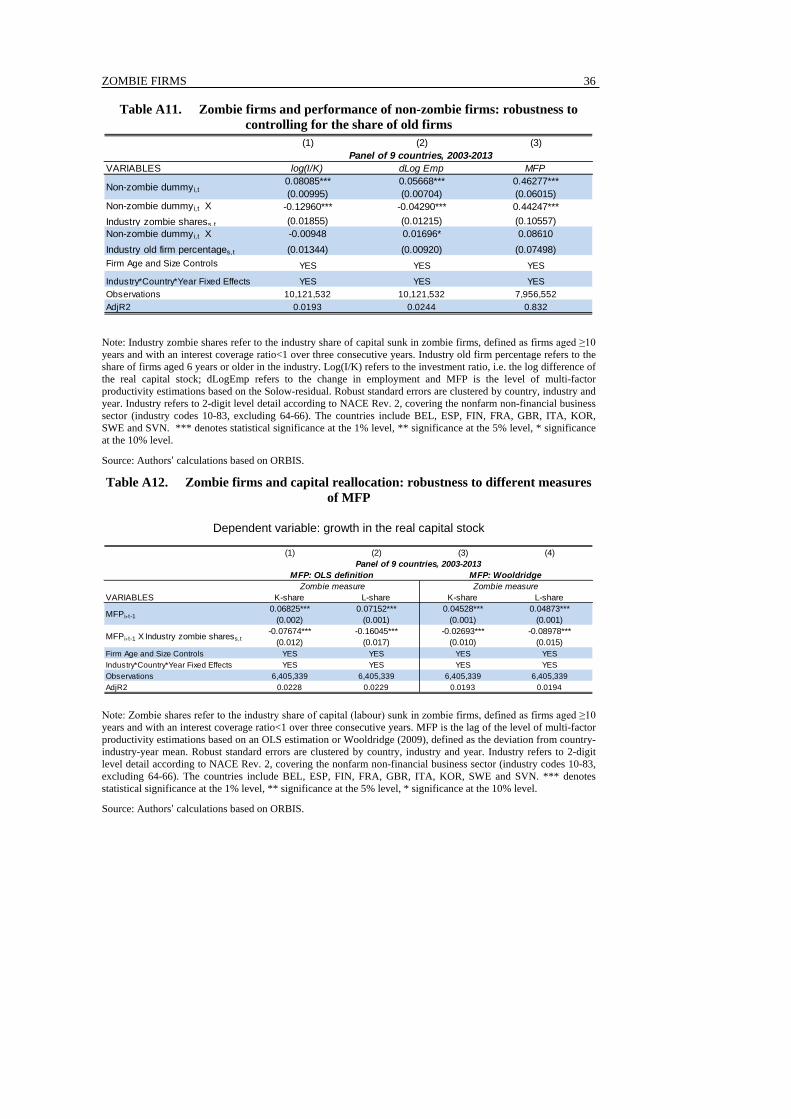
The baseline results in Table 1 are also robust to: i) including, as an additional variable, the interaction of the non-zombie dummy with the share of old firms in the industry to check that the negative interaction term does not simply reflect the effect of a growing share of old firms in the economy, i.e. declining business dynamism (Table A11); ii) instrumenting zombie capital shares by lag values to check that the results are not driven by cyclical shocks simultaneously affecting the zombie share and the relative
25. Due to the limited coverage of ORBIS historical data on ownership links, the analysis excluding MNEs is only conducted on the cross section 2013. 26. The results are also robust to only using the weights in the regression with the unweighted zombie shares and only using the weighted zombie shares without weighing the regressions. 27. We also tested the robustness of the baseline results in Table 1 to the inclusion of firm fixed effects. As noted by Caballero et al. (2008), this approach leads to lose much of the information as for 80% of our sample, the zombie status of firms is persistent over time. Nonetheless, the estimate of 𝛽𝛽2 remains negative and significant in the investment regression, and positive and significant in the productivity regression, while the estimate of 𝛽𝛽2 in the employment regression is less robust. 28. We use the sample excluding firms that are larger than 100 times the 99th percentile of the size distribution in terms of capital stock or number of employees, which may affect zombie shares significantly in some countries (e.g. Italy and Finland). These results are available on request.
ZOMBIE FIRMS
22
performance of non-zombie firms compared to zombie firms (Table A16); and iii) including firm sales growth as an additional control, following Caballero et al. (2008).29
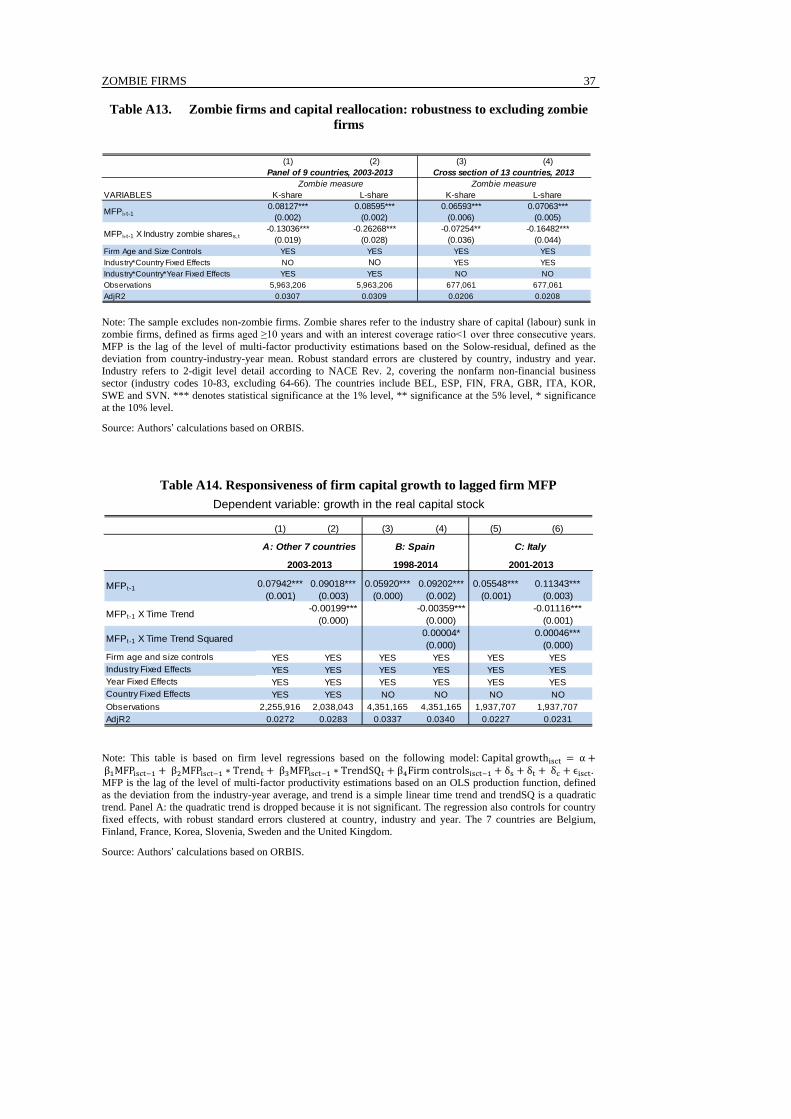
The baseline results presented in Table 3 – linking capital reallocation and zombie shares – are also robust to: i) using different estimates of MFP based on an OLS production function (Columns 1 and 2 of Table A12) and derived from an IV estimation method proposed by Wooldridge (2009) (Columns 3 and 4 of Table A12); and ii) excluding non-zombie firms from the sample (Table A13).
6. Zombie firms and resource allocation
The aim of this section is to provide some suggestive evidence on the links between the rise in zombie firms and aggregate labour productivity performance via two main channels: weak business investment and the slowdown in MFP performance in OECD countries. These results should be treated with caution as they only identify correlations, as opposed to causal effects, and they also do not account for potential counterbalancing effects of zombie firms survival e.g. via reduced unemployment and sustained aggregate demand. To illustrate the economic magnitude of our estimates, we conduct two counterfactual exercises to explore the effects of zombie firms on investment, employment of non-zombie firms (Section 6.1) and capital reallocation (a component of aggregate MFP; Section 6.2).
6.1. Implications for capital and employment of non zombie firms
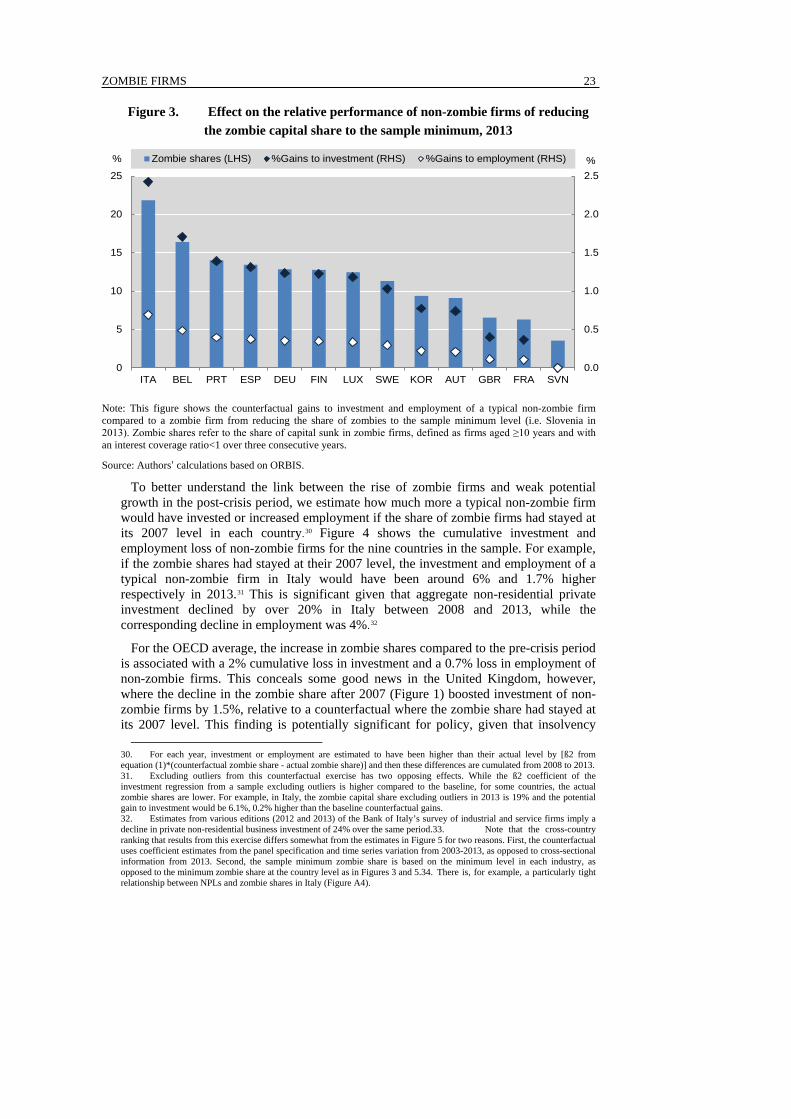
Based on the results of Table 1, Figure 3 illustrates the potential gains to investment and employment growth of a typical non-zombie firm from reducing zombie shares in each country to the lowest shares observed in Slovenia in 2013 (4%). If interpreted causally, these results suggest that reducing zombie shares in Belgium to the lowest level in the sample would be associated with a 1.7% gain in investment for a typical non-zombie firm in 2013, which is significant given that aggregate business investment in Belgium remained some 4% lower in 2013, compared to its 2008 level.
29. Including firm sales growth controls for business opportunities for the healthy firms, which could be another explanation for the lower investment and employment growth of non-zombie firms. These results are available on request.
ZOMBIE FIRMS
23
Figure 3. Effect on the relative performance of non-zombie firms of reducing the zombie capital share to the sample minimum, 2013
Note: This figure shows the counterfactual gains to investment and employment of a typical non-zombie firm compared to a zombie firm from reducing the share of zombies to the sample minimum level (i.e. Slovenia in 2013). Zombie shares refer to the share of capital sunk in zombie firms, defined as firms aged ≥10 years and with an interest coverage ratio<1 over three consecutive years.
Source: Authors’ calculations based on ORBIS.
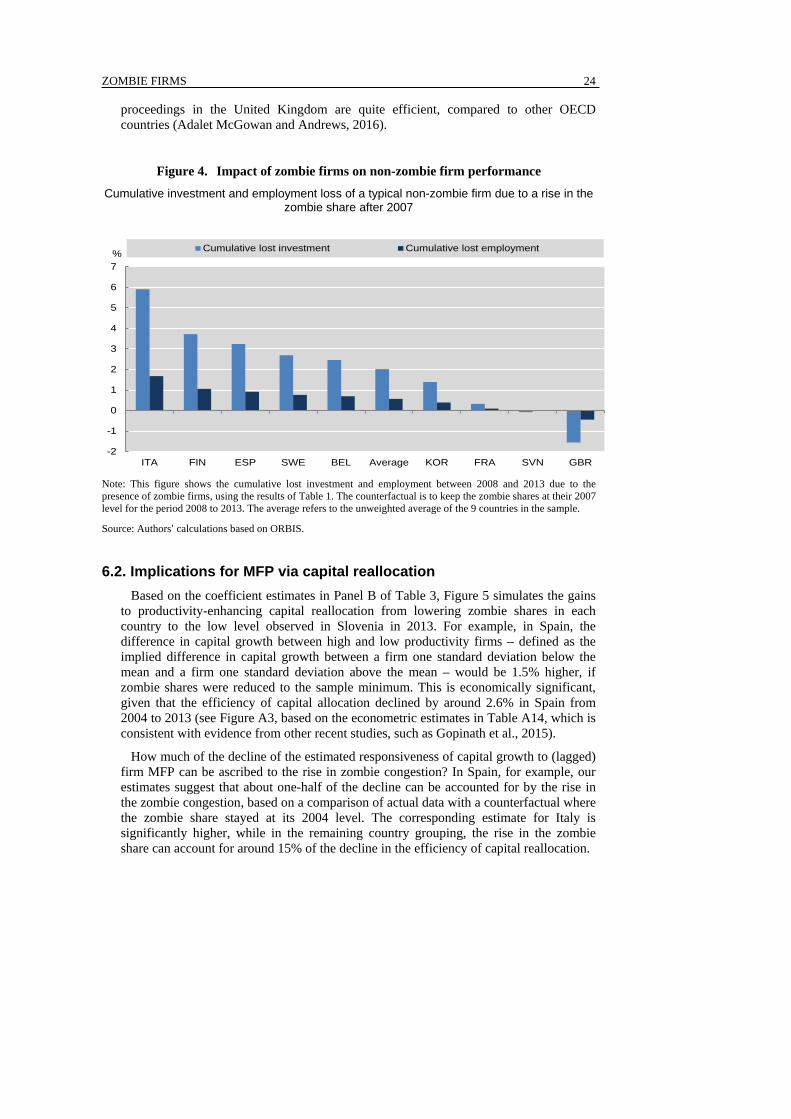
To better understand the link between the rise of zombie firms and weak potential growth in the post-crisis period, we estimate how much more a typical non-zombie firm would have invested or increased employment if the share of zombie firms had stayed at its 2007 level in each country.30 Figure 4 shows the cumulative investment and employment loss of non-zombie firms for the nine countries in the sample. For example, if the zombie shares had stayed at their 2007 level, the investment and employment of a typical non-zombie firm in Italy would have been around 6% and 1.7% higher respectively in 2013.31 This is significant given that aggregate non-residential private investment declined by over 20% in Italy between 2008 and 2013, while the corresponding decline in employment was 4%.32
For the OECD average, the increase in zombie shares compared to the pre-crisis period is associated with a 2% cumulative loss in investment and a 0.7% loss in employment of non-zombie firms. This conceals some good news in the United Kingdom, however, where the decline in the zombie share after 2007 (Figure 1) boosted investment of non-zombie firms by 1.5%, relative to a counterfactual where the zombie share had stayed at its 2007 level. This finding is potentially significant for policy, given that insolvency
30. For each year, investment or employment are estimated to have been higher than their actual level by [ß2 from equation (1)*(counterfactual zombie share - actual zombie share)] and then these differences are cumulated from 2008 to 2013. 31. Excluding outliers from this counterfactual exercise has two opposing effects. While the ß2 coefficient of the investment regression from a sample excluding outliers is higher compared to the baseline, for some countries, the actual zombie shares are lower. For example, in Italy, the zombie capital share excluding outliers in 2013 is 19% and the potential gain to investment would be 6.1%, 0.2% higher than the baseline counterfactual gains. 32. Estimates from various editions (2012 and 2013) of the Bank of Italy’s survey of industrial and service firms imply a decline in private non-residential business investment of 24% over the same period.33. Note that the cross-country ranking that results from this exercise differs somewhat from the estimates in Figure 5 for two reasons. First, the counterfactual uses coefficient estimates from the panel specification and time series variation from 2003-2013, as opposed to cross-sectional information from 2013. Second, the sample minimum zombie share is based on the minimum level in each industry, as opposed to the minimum zombie share at the country level as in Figures 3 and 5.34. There is, for example, a particularly tight relationship between NPLs and zombie shares in Italy (Figure A4).
0.0
0.5
1.0
1.5
2.0
2.5
0
5
10
15
20
25
ITA BEL PRT ESP DEU FIN LUX SWE KOR AUT GBR FRA SVN
Zombie shares (LHS) %Gains to investment (RHS) %Gains to employment (RHS)% %
ZOMBIE FIRMS
24
proceedings in the United Kingdom are quite efficient, compared to other OECD countries (Adalet McGowan and Andrews, 2016).
Figure 4. Impact of zombie firms on non-zombie firm performance Cumulative investment and employment loss of a typical non-zombie firm due to a rise in the
zombie share after 2007
Note: This figure shows the cumulative lost investment and employment between 2008 and 2013 due to the presence of zombie firms, using the results of Table 1. The counterfactual is to keep the zombie shares at their 2007 level for the period 2008 to 2013. The average refers to the unweighted average of the 9 countries in the sample.
Source: Authors’ calculations based on ORBIS.
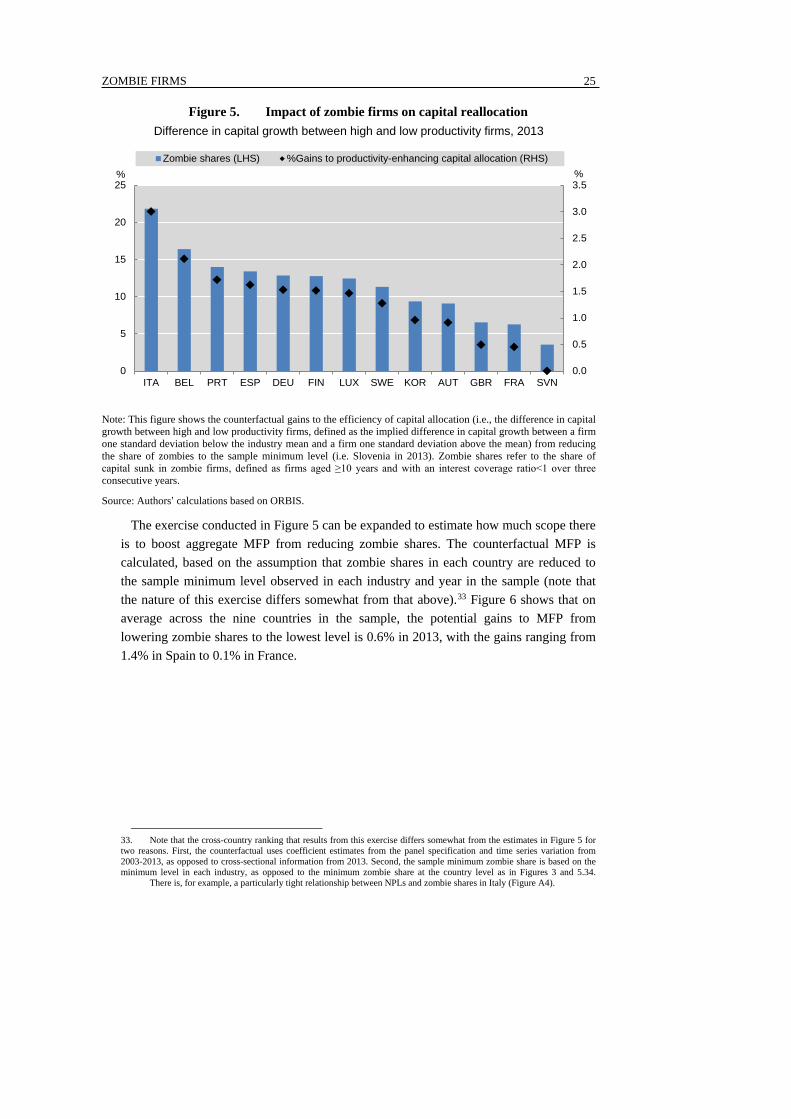
6.2. Implications for MFP via capital reallocation Based on the coefficient estimates in Panel B of Table 3, Figure 5 simulates the gains
to productivity-enhancing capital reallocation from lowering zombie shares in each country to the low level observed in Slovenia in 2013. For example, in Spain, the difference in capital growth between high and low productivity firms – defined as the implied difference in capital growth between a firm one standard deviation below the mean and a firm one standard deviation above the mean – would be 1.5% higher, if zombie shares were reduced to the sample minimum. This is economically significant, given that the efficiency of capital allocation declined by around 2.6% in Spain from 2004 to 2013 (see Figure A3, based on the econometric estimates in Table A14, which is consistent with evidence from other recent studies, such as Gopinath et al., 2015).
How much of the decline of the estimated responsiveness of capital growth to (lagged) firm MFP can be ascribed to the rise in zombie congestion? In Spain, for example, our estimates suggest that about one-half of the decline can be accounted for by the rise in the zombie congestion, based on a comparison of actual data with a counterfactual where the zombie share stayed at its 2004 level. The corresponding estimate for Italy is significantly higher, while in the remaining country grouping, the rise in the zombie share can account for around 15% of the decline in the efficiency of capital reallocation.
-2
-1
0
1
2
3
4
5
6
7
ITA FIN ESP SWE BEL Average KOR FRA SVN GBR
Cumulative lost investment Cumulative lost employment%
ZOMBIE FIRMS
25
Figure 5. Impact of zombie firms on capital reallocation Difference in capital growth between high and low productivity firms, 2013
Note: This figure shows the counterfactual gains to the efficiency of capital allocation (i.e., the difference in capital growth between high and low productivity firms, defined as the implied difference in capital growth between a firm one standard deviation below the industry mean and a firm one standard deviation above the mean) from reducing the share of zombies to the sample minimum level (i.e. Slovenia in 2013). Zombie shares refer to the share of capital sunk in zombie firms, defined as firms aged ≥10 years and with an interest coverage ratio<1 over three consecutive years.
Source: Authors’ calculations based on ORBIS.
The exercise conducted in Figure 5 can be expanded to estimate how much scope there is to boost aggregate MFP from reducing zombie shares. The counterfactual MFP is calculated, based on the assumption that zombie shares in each country are reduced to the sample minimum level observed in each industry and year in the sample (note that the nature of this exercise differs somewhat from that above).33 Figure 6 shows that on average across the nine countries in the sample, the potential gains to MFP from lowering zombie shares to the lowest level is 0.6% in 2013, with the gains ranging from 1.4% in Spain to 0.1% in France.
33. Note that the cross-country ranking that results from this exercise differs somewhat from the estimates in Figure 5 for two reasons. First, the counterfactual uses coefficient estimates from the panel specification and time series variation from 2003-2013, as opposed to cross-sectional information from 2013. Second, the sample minimum zombie share is based on the minimum level in each industry, as opposed to the minimum zombie share at the country level as in Figures 3 and 5.34. There is, for example, a particularly tight relationship between NPLs and zombie shares in Italy (Figure A4).
0.0
0.5
1.0
1.5
2.0
2.5
3.0
3.5
0
5
10
15
20
25
ITA BEL PRT ESP DEU FIN LUX SWE KOR AUT GBR FRA SVN
Zombie shares (LHS) %Gains to productivity-enhancing capital allocation (RHS)% %
ZOMBIE FIRMS
26
Figure 6. Counterfactual MFP gains from reducing zombie shares to industry minimum level
Estimate gain to the level of aggregate business sector MFP in 2013 (percentage points)
Note: This figure shows the counterfactual gains to MFP via higher capital reallocation from reducing the shares of zombies in each country to the sample minimum level in each industry and year. The country level numbers are an unweighted average of all industries (2-digit level detail according to NACE Rev. 2, covering the non-farm non-financial business sector).
Source: Authors’ calculations based on ORBIS.
7. Policy discussion
This paper provides evidence that the prevalence of financially weak or “zombie” firms – that increasingly linger as opposed to exit the market – are associated with less efficient resource allocation. We apply the framework from the seminal study of zombie firms in Japan (see Caballero et al., 2008) to a broader sample of OECD countries and show that a higher share of industry capital sunk in zombie firms is associated with lower investment and employment growth of a typical non-zombie firm. Besides limiting the expansion possibilities of healthy incumbent firms, market congestion generated by zombie firms can also exacerbate productivity dispersion, create barriers to entry and constrain the post-entry growth of young firms. Finally, we find that an increase in the capital stock sunk in zombie firms is associated with less productivity-enhancing capital reallocation, measured as the decline in the ability of more productive firms to attract capital. These findings raise a number of issues for policy: To what extent is policy weakness responsible for the rise in zombie congestion? What can policy do to alleviate this source of productivity weakness?
0.0
0.2
0.4
0.6
0.8
1.0
1.2
1.4
1.6
ESP ITA SWE Average KOR GBR BEL FIN SVN FRA
ZOMBIE FIRMS
27
From a general perspective, in the early phases of the crisis, some crisis-induced policy initiatives such as government loan guarantees and low interest rates might have been useful in facilitating credit and preventing firm exit that would lead to mass layoffs. However, given the length of the crisis, the persistence of some of these policies may now be detrimental to productivity growth by distorting credit supply, especially given asymmetric information problems making it difficult to identify unviable firms, and curbing the potentially positive contribution of exit. As mentioned in Caballero et al. (2008), the utilised model does not allow us to assess the overall effect of allowing zombies to continue operating, and whether the costs in terms of productivity loss were compensated by the benefits in terms of reduced unemployment. Yet, it provides evidence of the potentially large costs associated with the distortions induced by the prolonged survival of zombie firms in some countries.
More specifically, the persistence of zombie firms may partly stem from banks’ reluctance or lack of incentives to deal with non-performing loans (NPLs) and realise losses on their balance sheets that may arise from corporate insolvencies or loan foreclosure. A positive relationship between the zombie capital share and NPLs within countries over time (see Table A15) highlights the potential connection between zombie congestion and banking sector weakness.34 More concretely, using the same definition of zombie firms and linking firms to banks, Andrews and Petroulakis (2017) estimate that around one-third of the adverse impact of zombie congestion on productivity-enhancing capital reallocation can be accounted for by weak banks. These results underscore the urgency to pursue a more aggressive policy to resolve NPLs.
To the extent that our results suggest that zombie congestion was a drag on productivity performance before the crisis, it is likely that that Europe’s zombie firm problem is also symptomatic of structural policy weakness. In a follow-up paper, we exploit a recent OECD questionnaire which gathers information across countries on the key design features of insolvency regimes which delay the initiation of and increase the length of insolvency proceedings (Adalet McGowan, Andrews and Millot, 2017). As shown in Figure 7, it appears that the share of capital sunk in zombie firms at the country-level tends to be higher in countries with insolvency regimes that delay the timely initiation and resolution of proceeding. In this paper we show that reforms to insolvency regimes which lower barriers to corporate restructuring and the personal cost associated with entrepreneurial failure may reduce the share of capital sunk in zombie firms, which in turn spurs the reallocation of capital to more productive firms. While this could reflect the fact that zombie firms are more likely to exit, the analysis also shows that a well-designed insolvency regimes are associated with a higher likelihood that zombie firms subsequently return to better financial health and (more marginal) non-zombie firms avoid turning into zombie firms. Thus, cross-country differences in zombie
34. There is, for example, a particularly tight relationship between NPLs and zombie shares in Italy (Figure A4).
ZOMBIE FIRMS
28
congestion may also emerge because insolvency regimes in some countries are more successful at restructuring weak firms than in others.35
Figure 7. The share of capital in zombie firms is higher in countries with
insolvency regimes that raise barriers to firm exit or restructuring
Note: The figure plots the total share of capital sunk in zombie firms (defined as firms aged ≥10 years and with an interest coverage ratio<1 over three consecutive years) at the country level against a composite indicator on the design of countries’ insolvency regimes, based on twelve features capturing the extent to which insolvency regimes are likely to delay the initiation and resolution of insolvency proceedings (see Adalet McGowan, Andrews and Millot, 2017). The sample excludes firms that are larger than 100 times the 99th percentile of the size distribution in terms of capital stock or number of employees The relationship is statistically significant at the 10% level, with robust standard errors.
Source: Authors’ calculations based on ORBIS and the OECD questionnaire on insolvency regimes.
Finally, reallocation-friendly policies such as those facilitating job turnover or labour
mobility will also be important in allowing more productive firms to expand with resources released from the exiting firms. Since the exit of low productivity firms implies more labour market churn, however, there is a case for policy to manage the costs of worker displacement and facilitate efficient worker reallocation through well-designed active labour market policies (Andrews and Saia, 2016), which could be financed out of the growth dividends illustrated above. While the exit of zombie firms may initially entail a hit to aggregate employment, over time the costs to displaced workers will be mitigated by two factors. First, the removal of the zombie congestion implies higher non-zombie employment growth, especially amongst young firms which disproportionately contribute to aggregate job creation (Haltiwanger et al., 2013; Criscuolo, et al., 2014). Second, the exit of zombie firms creates scope for some displaced workers to be reallocated to a job that better matches their skill, which is significant given evidence that highly-skilled labour is trapped in relatively low
35. This analysis also shows that the zombie capital share is positively correlated with a weaker rule of law and more stringent regulatory barriers to firm entry.
AUT
BEL
DEU
ESP
FINFRA
GBR
GRC
ITA
JPN
KOR
PRT
SVN
SWE
y = 6.606*x + 1.450
0
5
10
15
20
25
30
0 0.5 1 1.5 2 2.5
Insolvency regime entailing higher barriers to exit or restructuring (normalised index), 2010
Share of capital in zombie firms, 2013
%
ZOMBIE FIRMS
29
productivity firms in many OECD countries (Adalet McGowan and Andrews, 2015). A better matching of skills to jobs makes workers more productive, implying scope for higher wages, and reduces the risk that under-utilised skills will quickly depreciate.
REFERENCES
Acharya, V., T. Eisert, C. Eufinger and C. Hirsch (2016), “Whatever It Takes: The Real Effects of Unconventional Monetary Policy”, SAFE Working Papers, No. 152.
Adalet McGowan, M. and D. Andrews (2015), “Labour Market Mismatch and Labour Productivity: Evidence from PIAAC Data”, OECD Economics Department Working Papers, No. 1209.
Adalet McGowan, M. and D. Andrews (2016), “Insolvency Regimes and Productivity Growth: A Framework for Analysis”, OECD Economics Department Working Papers, No. 1309.
Adalet McGowan, M. and D. Andrews (2017), “Declining Resource Allocation in Spain: Implications for Productivity”, OECD Economics Department Working Papers, forthcoming.
Adalet McGowan M. and D. Andrews and V. Millot (2017), “Insolvency Regimes, Zombie Firms and Capital Reallocation”, OECD Economics Department Working Papers, No. 1399.
Agostino, M., S. Bruno and T. Francesco (2008), “The Effects of Screening and Monitoring on Credit Rationing of SMEs”, Economic Notes, Vol. 37, Issue 2.
Albertazzi, U. and D. J. Marchetti (2010), “Credit supply, flight to quality and evergreening: an analysis of bank-firm relationships after Lehman”, Banca d’Italia, Temi di discussione, No. 746.
Andrews, D. and F. Petroulakis (2017), “Breaking the Shackles: Zombie Firms, Weak Banks and Depressed Restructuring in Europe”, OECD Economics Department Working Papers, forthcoming.
Andrews, D. and A. Saia (2016), “Coping with Creative Destruction: Reducing the Costs of Firm Exit”, OECD Economics Department Working Papers, No.1353.
Andrews, D. and F. Cingano (2014), “Public Policy and Resource Allocation: Evidence from Firms in OECD Countries”, Economic Policy, No. 29(78), pp. 253-296.
Andrews, D. and C. Criscuolo (2013), “Knowledge Based Capital, Innovation and Resource Allocation”, OECD Economics Department Working Papers, No. 1046.
Andrews, D., C. Criscuolo and P. Gal (2016), “The Global Productivity Slowdown, Technology Divergence and Public Policy: A Firm Level Perspective”, OECD Productivity Working Papers, No. 5.
Andrews, D., C. Criscuolo and P. Gal (2015), “Frontier Firms, Technology Diffusion and Public Policy: Micro Evidence from OECD Countries”, OECD Productivity Working Papers, No. 2.
Andrews, D., C. Criscuolo and C. Menon (2014), “Do Resources Flow to Patenting Firms?: Cross-Country Evidence from Firm Level Data”, OECD Economics Department Working Papers, No. 1127.
Avouyi-Dovi, S., R. Lecat, C. O’Donnell, B. Bureau and J.P. Villetelle (2016), “Are Insolvent Firms Being Kept Afloat by Excessively Low Interest Rates?”, Rue de la Banque, No. 29, Banque de France.
Bank of England (2013), Inflation Report, Bank of England, London. Bank of Korea (2013), Financial Stability Report, Bank of Korea, Seoul. Beck, T., H. Degryse, R. De Haas and N. van Horen (2014), “When arm’s length is too far.
Relationship banking over the business cycle”, BOFIT Discussion Papers, No. 14. Blanchard, O. and J. Wolfers (2000), “The Role of Shocks and Institutions in the Rise of European
Unemployment: The Aggregate Evidence”, Economic Journal, Vol. 110(462). Caballero, R., and M. Hammour (1994), “The Cleansing Effect of Recessions”, The American
Economic Review, Vol. 84 (5), pp. 1350–68. Caballero, R., T. Hoshi and A.K. Kashyap (2008), “Zombie Lending and Depressed Restructuring
in Japan”, American Economic Review, 98(5), pp. 1943-1977. Chen, N.K. and H.L. Chu (2003) “Collateral Value and Forbearance Lending”, Centre for Economic
Performance Discussion Paper, No. 0603.
ZOMBIE FIRMS
30
Criscuolo, C., P. Gal and C. Menon (2014), “The Dynamics of Employment Growth: New Evidence from 18 Countries”, OECD Science, Technology and Industry Policy Papers, No. 14.
Cooper, R., J. Haltiwanger and L. Power (1997). “Machine Replacement and the Business Cycle: Lumps and Bumps”, NBER Working Paper, No. 5260.
Decker, R., J. Haltiwanger, R. Jarmin and J. Miranda (2016), “Changing Business Dynamism: Volatility of Shocks vs. Responsiveness to Shocks”, mimeo.
Foster, L., J. Haltiwanger and C.J. Krizan (2001). “Aggregate Productivity Growth: Lessons from Microeconomic Evidence.” in Edward Dean, Michael Harper and Charles Hulten eds. New Developments in Productivity Analysis, Chicago: University of Chicago Press.
Foster, L., C. Grim and J. Haltiwanger (2016), “Reallocation in the Great Recession: Cleansing or Not?”, Journal of Labour Economics, Vol. 34.
Gal, P. (2013), “Measuring Total Factor Productivity at the Firm Level using OECD-ORBIS”, OECD Economics Department Working Paper, No. 1049.
Gal, P. and A. Hijzen (2016), “The Short-term Impact of Product Market Reforms: A Cross-country Firm Level Analysis”, OECD Economics Department Working Paper, No. 1311.
Garrido, J. (2016), “Insolvency and Enforcement Reforms in Italy”, IMF Working Paper, No. 134. Garrido, J., E. Kopp and A. Weber (2016), “Cleaning-up Bank Balance Sheets: Economic , Legal
and Supervisory Measures for Italy”, IMF Working Paper, No. 135. Gopinath, G., S. Kalemli-Ozcan, L. Karabarbounis and C. Villegas-Sanchez (2015), “Capital
Allocation and Productivity in South Europe”, NBER Working Paper, No. 21453. Haltiwanger, J., R. Jarmin and J. Miranda (2013), “Who Creates Jobs? Small Versus Large Versus
Young”, Review of Economics and Statistics, 95(2), pp. 347-361. Hopenhayn, H. (1992), “Entry, Exit and Firm Dynamics in the Long-Run Equilibrium”,
Econometrica, Vol. 60. Hoshi, T. (2006), “Economics of the Living Dead”, The Japanese Economic Review, Vol. 57(1), pp.
30-49. Jovanovic, B. (1982), “Selection and the Evolution of Industry”, Econometrica, Vol. 50. Kalemli-Ozcan, S., B. Sorensen, C. Villegas-Sanchez, V. Volosovych and S. Yesiltas (2015), “How
to Construct Nationally Representative Firm Level Data from the Orbis Global Database”, NBER Working Papers, No. 21558.
Nishimura, K. and Y. Kawamoto (2004) “Why Does the Problem Persist? ‘Rational Rigidity’ and the Plight of the Japanese Banks”, in R. Stern and G. Saxonhouse (eds.) Japan’s Lost Decade: Origins, Consequences and Prospects for Recovery, Oxford: Blackwell.
http://dx.doi.org/10.2139/ssrn.1786496. Olley, S. and A. Pakes (1996), “The Dynamics of Productivity in the Telecommunications
Industry”, Econometrica, Vol. 64(6). Peek, J. and E. Rosengren (2005), “Unnatural Selection: Perverse Incentives and the Misallocation”,
American Economic Review, Vol. 95, No. 4. Schivardi, F., E. Sette and G. Tabellini (2017), “Credit Misallocation During the European Financial
Crisis”, CEPR Discussion Paper, No. 11901. Syverson. C. (2004), “Product Substitutability and Productivity Dispersion”, The Review of
Economics and Statistics, Vol. 86. White, W. (2012), “Ultra Easy Monetary Policy and the Law of Unintended Consequences”,
Federal Reserve Bank of Dallas Globalization and Monetary Policy Institute Working Paper, No. 126.
Wooldridge, J. M., 2009, “On Estimating Firm-level Production Functions Using Proxy Variables to Control for Unobservables”, Economics Letters, Vol. 104.
ZOMBIE FIRMS
31
APPENDIX: ADDITIONAL TABLES AND FIGURES
Table A1. Productivity dispersion Dispersion across industries of within-industry multi-factor productivity distribution moments,
2013
Note: Summary of firm-level productivity distribution moments across 62 industries (at the NACE 2-digit level) in 13 countries in 2013 (AUT, BEL, DEU, ESP, FIN, FRA, GBR, ITA, KOR, LUX, PRT, SWE and SVN). Following Syverson (2004), the rows correspond to moments of within-industry MFP distribution (based on the Solow Residual), and the columns show the across-industry mean and dispersion of these moments. “IQ range” is the interquartile range. The top part of the table corresponds to productivity distributions calculated on the whole sample, while the bottom part corresponds to the sample restricted to non-zombie firms.
Source: Authors’ calculations based on ORBIS.
Table A2. Zombie firms: links with aggregate labour productivity OLS regression of aggregate productivity on zombie shares at the industry-year level
Note: Industry refers to 1-digit and 2-digit level detail according to NACE Rev. 2, covering the nonfarm non-financial business sector (industry codes 10-83, excluding 64-66). The sample includes BEL, ESP, FIN, FRA, GBR, ITA, KOR, SWE and SVN. The labour productivity data are from OECD National Accounts. *** denotes statistical significance at the 1% level, ** significance at the 5% level, * significance at the 10% level.
Source: Authors’ calculations based on ORBIS and OECD, National Accounts.
Within-industry moment Mean Std. Dev. IQ range
Median 5.785 1.841 2.258IQ range 0.917 0.443 0.43990-10 percentile range 1.844 0.778 0.86795-5 percentile range 2.477 1.008 1.180
Median 5.809 1.841 2.244IQ range 0.906 0.454 0.45390-10 percentile range 1.805 0.775 0.85095-5 percentile range 2.418 0.985 1.129
Table A3. Zombie firms and the performance of non-zombie firms: labour sunk in zombie firms
Note: Industry zombie shares refer to the industry share of labour sunk in zombie firms, defined as firms aged ≥10 years and with an interest coverage ratio<1 over three consecutive years. Log(I/K) refers to the investment ratio, i.e. the log difference of the real capital stock; dLogEmp refers to the change in employment and MFP is the level of multi-factor productivity estimations based on the Solow-residual. Robust standard errors are clustered by country, industry and year. Industry refers to 2-digit level detail according to NACE Rev. 2, covering the nonfarm non-financial business sector (industry codes 10-83, excluding 64-66). The countries include BEL, ESP, FIN, FRA, GBR, ITA, KOR, SWE and SVN. *** denotes statistical significance at the 1% level, ** significance at the 5% level, * significance at the 10% level.
Source: Authors’ calculations based on ORBIS.
Table A4. Different measures of zombie firms
Note: The countries include BEL, ESP, FIN, FRA, GBR, ITA and SWE. *** denotes statistical significance at the 1% level, ** significance at the 5% level, * significance at the 10% level.
(0.02079) (0.01635) (0.13441)Firm Age and Size Controls YES YES YESIndustry*Country Fixed Effects NO NO NOIndustry*Country*Year Fixed Effects YES YES YESObservations 10,121,532 10,121,532 7,956,552AdjR2 0.0193 0.0244 0.832
Non-zombie dummyi,t X Industry zombie sharess,t
Non-zombie dummyi,t
Panel of 9 countries, 2003-2013
(1) (2) (3)
VARIABLES Industry level shares Non-zombie dummy Non-zombie dummy0.07596***
(0.010)0.01515*** 0.01476***
(0.000) (0.000)Firm Age and Size Controls NO YES NOYear Fixed Effects YES YES YESIndustry Fixed Effects YES YES NOCountry Fixed Effects YES YES NOFirm Fixed Effects NO NO YESObservations 4,762 6,732,049 6,732,049AdjR2 0.143 0.237 0.0275
Panel of 7 countries, 2003-2013Interest coverage ratio
Industry level Caballero-based zombie shares
Caballero-based non-zombie dummy
ZOMBIE FIRMS
33
Table A5. Zombie firms and the performance of non-zombie firms: robustness to a different definition of zombie firms
Note: Zombie shares are calculated based on the methodology of Caballero et al. (2008). See Section 3.2 for further details. Log(I/K) refers to the investment ratio, i.e. the log difference of the real capital stock; dLogEmp refers to the change in employment and MFP is the level of multi-factor productivity estimations based on the Solow-residual. Robust standard errors are clustered by country, industry and year. Industry refers to 2-digit level detail according to NACE Rev. 2, covering the nonfarm non-financial business sector (industry codes 10-83, excluding 64-66). The countries include BEL, ESP, FIN, FRA, GBR, ITA and SWE. *** denotes statistical significance at the 1% level, ** significance at the 5% level, * significance at the 10% level.
Source: Authors’ calculations based on ORBIS.
Table A6. Zombie firms and capital reallocation: robustness to a different definition of zombie firms
Dependent variable: growth in the real capital stock
Note: Zombie shares are calculated based on the methodology of Caballero et al. (2008). See Section 3.2 for further details. MFP is the lag of the level of multi-factor productivity estimations based on the Solow-residual, defined as the deviation from the country-industry-year mean. Robust standard errors are clustered by country, industry and year. Industry refers to 2-digit level detail according to NACE Rev. 2, covering the nonfarm non-financial business sector (industry codes 10-83, excluding 64-66). The countries in the panel include BEL, ESP, FIN, FRA, GBR, ITA and SWE and the cross-section adds AUT, DEU, KOR, PRT and SVN. *** denotes statistical significance at the 1% level, ** significance at the 5% level, * significance at the 10% level.
(0.010) (0.013) (0.016) (0.023)Firm Age and Size Controls YES YES YES YESIndustry*Country*Year Fixed Effects YES YES YES YESResampling weights NO YES NO YESObservations 6,158,509 5,257,000 901,861 755,828AdjR2 0.0272 0.0379 0.0212 0.0458
MFPi,t-1 X Industry zombie sharess,t
Panel of 7 countries, 2003-2013
MFPi,t-1
Zombie measure: Based on Caballero et al. (2008)
Cross section of 12 countries, 2013Zombie measure: Based on Caballero
et al. (2008)
ZOMBIE FIRMS
34
Table A7. Zombie firms: pre-crisis regressions
Note: Zombie shares refer to the industry share of capital (labour) sunk in zombie firms, defined as firms aged ≥10 years and with an interest coverage ratio<1 over three consecutive years. Log(I/K) refers to the investment ratio, i.e. the log difference of the real capital stock; dLogEmp refers to the change in employment and MFP is the level of multi-factor productivity estimations based on the Solow-residual. Robust standard errors are clustered by country, industry and year. Industry refers to 2-digit level detail according to NACE Rev. 2, covering the nonfarm non-financial business sector (industry codes 10-83, excluding 64-66). The countries include BEL, ESP, FIN, FRA, GBR, ITA, KOR, SWE and SVN. *** denotes statistical significance at the 1% level, ** significance at the 5% level, * significance at the 10% level.
Source: Authors’ calculations based on ORBIS.
Table A8. Zombie firms and performance of non-zombie firms: robustness to exclusion of MNEs
Note: Zombie shares refer to the industry share of capital sunk in zombie firms, defined as firms aged ≥10 years and with an interest coverage ratio<1 over three consecutive years. Log(I/K) refers to the investment ratio, i.e. the log difference of the real capital stock; dLogEmp refers to the change in employment and MFP is the level of multi-factor productivity estimations based on the Solow-residual. MNEs are identified using information on global ultimate owners (GUO) controlling at least 50% of the shares in ORBIS ownership links data. A firm is considered as part of an MNE if its GUO is located in another country, or if at least one of the firms controlled by its GUO is located in a foreign country. Robust standard errors are clustered by country and industry. Industry refers to 2-digit level detail according to NACE Rev. 2, covering the nonfarm non-financial business sector (industry codes 10-83, excluding 64-66). The countries include AUT, BEL, DEU, ESP, FIN, FRA, GBR, ITA, KOR, LUX, PRT, SVN and SWE. *** denotes statistical significance at the 1% level, ** significance at the 5% level, * significance at the 10% level.
Firm Age and Size Controls YES YES YESIndustry*Country Fixed Effects YES YES YESObservations 1,067,378 1,067,378 890,065AdjR2 0.0159 0.0220 0.818
Non-zombie dummyi,t
Non-zombie dummyi,t X Industry zombie sharess,t
Cross section of 13 countries, 2013
ZOMBIE FIRMS
35
Table A9. Zombie firms and the performance of non-zombie firms: robustness to the representativeness of the sample
Note: Zombie shares refer to the industry share of capital sunk in zombie firms, defined as firms aged ≥10 years and with an interest coverage ratio<1 over three consecutive years. Log(I/K) refers to the investment ratio, i.e. the log difference of the real capital stock; dLogEmp refers to the change in employment and MFP is the level of multi-factor productivity estimations based on the Solow-residual. Robust standard errors are clustered by country, industry and year. Industry refers to 2-digit level detail according to NACE Rev. 2, covering the nonfarm non-financial business sector (industry codes 10-83, excluding 64-66). The countries include BEL, ESP, FIN, FRA, GBR, ITA, KOR, SWE and SVN. *** denotes statistical significance at the 1% level, ** significance at the 5% level, * significance at the 10% level.
Source: Authors’ calculations based on ORBIS.
Table A10. Zombie firms and capital reallocation: robustness to the representativeness of the sample
Dependent variable: growth in the real capital stock
Note: Zombie shares refer to the share of industry capital (labour) sunk in zombie firms, defined as firms aged ≥10 years and with an interest coverage ratio<1 over three consecutive years. MFP is the lag of the level of multi-factor productivity estimations based on the Solow-residual, defined as the deviation from country-industry-year mean. Robust standard errors are clustered by country, industry and year. Industry refers to 2-digit level detail according to NACE Rev. 2, covering the nonfarm non-financial business sector (industry codes 10-83, excluding 64-66). The countries include BEL, ESP, FIN, FRA, GBR, ITA, KOR, SWE and SVN. *** denotes statistical significance at the 1% level, ** significance at the 5% level, * significance at the 10% level.
Table A11. Zombie firms and performance of non-zombie firms: robustness to controlling for the share of old firms
Note: Industry zombie shares refer to the industry share of capital sunk in zombie firms, defined as firms aged ≥10 years and with an interest coverage ratio<1 over three consecutive years. Industry old firm percentage refers to the share of firms aged 6 years or older in the industry. Log(I/K) refers to the investment ratio, i.e. the log difference of the real capital stock; dLogEmp refers to the change in employment and MFP is the level of multi-factor productivity estimations based on the Solow-residual. Robust standard errors are clustered by country, industry and year. Industry refers to 2-digit level detail according to NACE Rev. 2, covering the nonfarm non-financial business sector (industry codes 10-83, excluding 64-66). The countries include BEL, ESP, FIN, FRA, GBR, ITA, KOR, SWE and SVN. *** denotes statistical significance at the 1% level, ** significance at the 5% level, * significance at the 10% level.
Source: Authors’ calculations based on ORBIS.
Table A12. Zombie firms and capital reallocation: robustness to different measures of MFP
Dependent variable: growth in the real capital stock
Note: Zombie shares refer to the industry share of capital (labour) sunk in zombie firms, defined as firms aged ≥10 years and with an interest coverage ratio<1 over three consecutive years. MFP is the lag of the level of multi-factor productivity estimations based on an OLS estimation or Wooldridge (2009), defined as the deviation from country-industry-year mean. Robust standard errors are clustered by country, industry and year. Industry refers to 2-digit level detail according to NACE Rev. 2, covering the nonfarm non-financial business sector (industry codes 10-83, excluding 64-66). The countries include BEL, ESP, FIN, FRA, GBR, ITA, KOR, SWE and SVN. *** denotes statistical significance at the 1% level, ** significance at the 5% level, * significance at the 10% level.
Panel of 9 countries, 2003-2013MFP: OLS definition MFP: Wooldridge
Zombie measure Zombie measure
ZOMBIE FIRMS
37
Table A13. Zombie firms and capital reallocation: robustness to excluding zombie firms
Note: The sample excludes non-zombie firms. Zombie shares refer to the industry share of capital (labour) sunk in zombie firms, defined as firms aged ≥10 years and with an interest coverage ratio<1 over three consecutive years. MFP is the lag of the level of multi-factor productivity estimations based on the Solow-residual, defined as the deviation from country-industry-year mean. Robust standard errors are clustered by country, industry and year. Industry refers to 2-digit level detail according to NACE Rev. 2, covering the nonfarm non-financial business sector (industry codes 10-83, excluding 64-66). The countries include BEL, ESP, FIN, FRA, GBR, ITA, KOR, SWE and SVN. *** denotes statistical significance at the 1% level, ** significance at the 5% level, * significance at the 10% level.
Source: Authors’ calculations based on ORBIS.
Table A14. Responsiveness of firm capital growth to lagged firm MFP Dependent variable: growth in the real capital stock
Note: This table is based on firm level regressions based on the following model: Capital growthisct = α + β1MFPisct−1 + β2MFPisct−1 ∗ Trendt + β3MFPisct−1 ∗ TrendSQt + β4Firm controlsisct−1 + δs + δt + δc + ϵisct. MFP is the lag of the level of multi-factor productivity estimations based on an OLS production function, defined as the deviation from the industry-year average, and trend is a simple linear time trend and trendSQ is a quadratic trend. Panel A: the quadratic trend is dropped because it is not significant. The regression also controls for country fixed effects, with robust standard errors clustered at country, industry and year. The 7 countries are Belgium, Finland, France, Korea, Slovenia, Sweden and the United Kingdom.
Firm age and size controls YES YES YES YES YES YESIndustry Fixed Effects YES YES YES YES YES YESYear Fixed Effects YES YES YES YES YES YESCountry Fixed Effects YES YES NO NO NO NOObservations 2,255,916 2,038,043 4,351,165 4,351,165 1,937,707 1,937,707AdjR2 0.0272 0.0283 0.0337 0.0340 0.0227 0.0231
MFPt-1 X Time Trend
MFPt-1 X Time Trend Squared
A: Other 7 countries B: Spain C: Italy
2003-2013 1998-2014 2001-2013
MFPt-1
ZOMBIE FIRMS
38
Table A15. Zombie firms and non-performing loans
Note: This table shows the link between country-level non-performing loans and capital zombie shares, using all the annual observations between 2002 and 2013 (Column 1), and only observations for non-overlapping three year periods, i.e. 2002-2004, 2005-2007, 2008-2010 and 2011-2013 (Column 2). The sample includes BEL, ESP, FIN, FRA, GBR, ITA, KOR, SWE and SVN. The robust standard errors are clustered by country and year. *** denotes statistical significance at the 1% level, ** significance at the 5% level, * significance at the 10% level.
Source: Authors’ calculations based on IMF, Financial Soundness Indicators and ORBIS.
Table A16. Zombie firms and performance of non-zombie firms: robustness to using lag values as instrument variables for zombie shares
Note: MFP is the lag of the level of multi-factor productivity estimations based on the Solow-residual, defined as the deviation from country-industry-year mean. Instrumental variable regressions estimated using the Stata package reghdfe. Standard errors are clustered by country, industry and year. Industry refers to 2-digit level detail according to NACE Rev. 2, covering the nonfarm non-financial business sector (industry codes 10-83, excluding 64-66). The countries include BEL, ESP, FIN, FRA, GBR, ITA, KOR, SWE and SVN. *** denotes statistical significance at the 1% level, ** significance at the 5% level, * significance at the 10% level.
IV= Industry zombie shares s,c,t-1 IV= Industry zombie shares s,c,t-2
ZOMBIE FIRMS
39
Table A17. Share of zombie firms by size classes and age classes
Note: Zombie firms in are defined as firms with an interest coverage ratio<1 over the three consecutive years 2011-2013 observed among each size and age groups (average share across countries and years). The countries in the sample include Belgium, Finland, France, Italy, Korea, Slovenia, Spain, Sweden and the United Kingdom.
Source: Authors’ calculations based on ORBIS.
Figure A1. The prevalence of zombie firms: additional countries
Note: Firms aged ≥10 years and with an interest coverage ratio<1 over three consecutive years. Capital stock and employment refer to the share of capital and labour sunk in zombie firms. . The sample excludes firms that are larger than 100 times the 99th percentile of the size distribution in terms of capital stock or number of employees
Figure A2. The prevalence of zombie firms: full sample
Note: Firms aged ≥10 years and with an interest coverage ratio<1 over three consecutive years. Capital stock and employment refer to the share of capital and labour sunk in zombie firms. For presentation purposes, a specific outlier has been removed from the share of employment sunk in zombie firms in France.
Source: Authors’ calculations based on ORBIS.
Figure A3. Micro-level dimensions to the productivity slowdown: capital
allocation Percentage point difference in capital stock growth of high and low productivity firms
Note: High (low) productivity firms are defined by being one standard deviation above (below) the industry mean multi factor productivity (MFP). The charts show the sensitivity of firm capital growth to firm MFP, based on a firm level regression of the growth in the real capital stock on the lagged deviation of firm MFP from its industry-year average, interacted with time trends (trend and trend-squared). The regressions also control for firm age, firm size classes, industry and year fixed effects. The cross-country regression includes Belgium, Finland, France, Korea, Slovenia, Sweden and the United Kingdom. The results for Spain and Italy are based on regressions for 1999-2014 and 2001-2013, respectively, given better data coverage for a longer time period for these countries. See Table A14 for the regression results.
Source: Authors’ calculations based on ORBIS.
0
5
10
15
20
25
2007
2010
2013
2007
2010
2013
2007
2010
2013
2007
2010
2013
2007
2010
2013
2007
2010
2013
2007
2010
2013
2007
2010
2013
2007
2010
2013
BEL ESP FIN FRA GBR ITA KOR SWE SVN
Number of firms Employment Capital Stock%
5
6
7
8
9
10
11
2004 2005 2006 2007 2008 2009 2010 2011 2012 2013
Spain Italy Other
ZOMBIE FIRMS
41
Figure A4. Zombie firms and NPLs: the case of Italy
Note: Zombie capital share refers to the share of capital sunk in zombie firms, defined as firms aged ≥10 years and with an interest coverage ratio<1 over three consecutive years.
Source: Authors’ calculations based on IMF, Financial Soundness Indicators and ORBIS.
Figure A5. The prevalence of zombie firms: Zombie shares adjusted for industrial structure
Note: Firms aged ≥10 years and with an interest coverage ratio<1 over three consecutive years. Capital stock and employment refer to the share of capital and labour sunk in zombie firms. For each country the shares are calculated as a weighted average of zombie shares at the country-sector level, using the sector’s share (in terms of number of firms, employment or capital stock) in the total sample in 2007 as weights. The sample excludes firms that are larger than 100 times the 99th percentile of the size distribution in terms of capital stock or number of employees.