42
Trends in Real Estate LEADERSHIP DIXIE Thursday, November 11, 2008
| Date post: | 01-Jan-2016 |
| Category: |
Documents |
| Upload: | solomon-jordan |
| View: | 214 times |
| Download: | 0 times |

The Washington County Board of REALTORS® Presents
Trends in Real Estate
LEADERSHIP DIXIE
Thursday, November 11, 2008

Understanding Foreclosure DataA recent report by RealtyTrac indicated that Utah foreclosuresjumped by 294 percent in July compared to the same month a yearago, ranking Utah the 9th highest foreclosure state in the nation.
What the RealtyTrac report failed to mention and what newspaperand television reporters neglected to explain is that RealtyTrac’smethodology counts defaults as foreclosures, inflating the actualforeclosure count. Defaults or delinquencies, mortgages 30 daysor more late, sometimes never formally enter the foreclosureprocess.
A more accurate foreclosure picture is provided by the MortgageBankers Association. According to MBA’s latest data, nearly 99percent of Utah’s 435,000 serviced mortgage loans are not in theprocess of foreclosure.
Salt Lake REALTOR® Magazine / September 2008

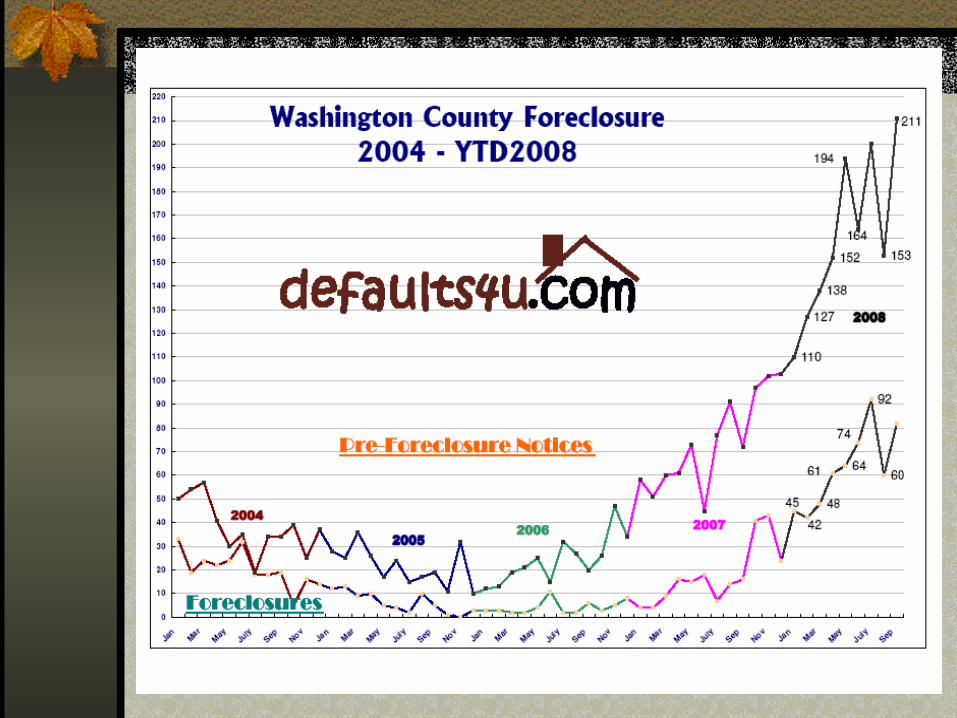
ForeclosuresNotices of default declined steeply (nearly 24%) from 200 in July to 153 in August. This is the first real decline in notices of default in over a year.
Trustee’s Deeds or actual foreclosure sales, similarly fell from 92 in July to just 60 in August. The assessed value of 153 Notices of Default in August rose to $43,000,000 as compared to July’s assessed value of $29,000,000. This is a trend to watch as higher dollar homes begin to hit the foreclosure blocks.
Over 73% of the foreclosures initiated this year were for mortgages taken out in 2006 (40%), 2007 (30%) and 2008 (3%).
Developer Services – August 2008

EXPERTS: “Housing needs to improve”
NEW YORK – Washington’s financial bailout plan is now law. So the credit spigot will start flowing again, banks will resume lending, and an economic recovery can begin, right?
Wrong. Experts say the most important thing that needs to happen before the $700 billion bailout even has a chance of working; home prices must stop falling. That would send a signal to banks that the worst has passed and it’s safe to start doling out money again.
The problem is the lending freeze has made getting a mortgage loan tough for everyone except those with sterling credit. That means it will take several months or longer to pare down the glut of houses that were built when times were good – and those that have come on the market because of soaring foreclosures – before homes start appreciating.
Associated Press / October 2008

Economic Recovery: How and When?
Housing is a critical component to the U.S. economy and by extension the availability of credit. Roughly one in eight U.S. jobs depends on housing directly or indirectly – from construction workers to bank loan officers to big brokers on Wall Street. A turnaround in housing prices would boost confidence in the wider economy and, experts hope, goad banks into lending again.
“Housing traditionally does lead the economy through a recovery.I think it’s going to be critical for a sustained recovery in this cycle, too,” said Gary Thayer, senior economist at Wachovia Securities.
Associated Press / October 2008

The Cyclical Nature Of Real Estate
Two years ago the scenario was much different from today. New homes were being purchased in favor of existing homes. Likely, towards the end of year 2009 the tables will turn again and new homes will be springing up in all areas of the county on so many of those now well-priced lots which lay there gathering dust, taxes, and weeds.
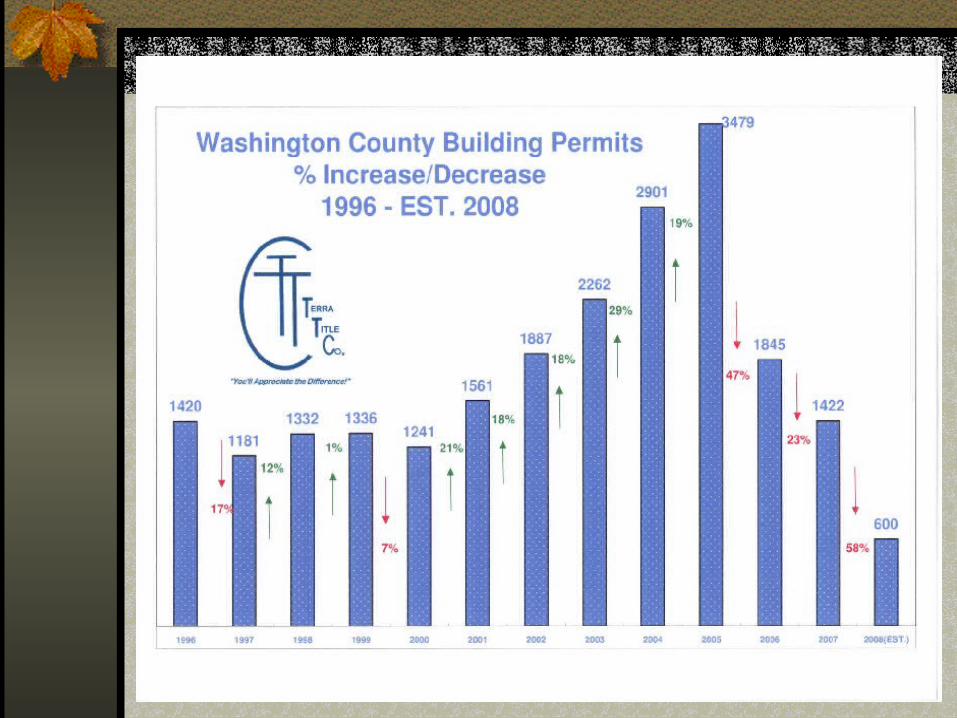
While it is important to note that it has been 20 years since our permitting levels were as low as they’ll be in year 2008, this temporary respite will pass, and the run-up will begin anew. Our local real estate market has never been more attractive if you are a buyer. Truly, the buyer with the resources and money has clout at a level not seen in a quarter century.
MainStreet Business Journal – June 2008
Alan Carter – Southern Utah Title
Home Building Permits At A 20-Year Low
The number of new construction permits issued in Washington County changes depending on property inventory levels and product availability for new purchasers.
Frankly, it is unlikely that local contractors and builders can build a new home for a price within 10 percent of the price of an existing home. Hence, those new residents are settling into a bank repossession, a short sale, or a stressed property of some type just to save money.
So we are purchasing fewer permits and building less new homes, and the existing home market is extremely active, particularly for products that are well priced.
MainStreet Business Journal – June 2008
Allan Carter – Southern Utah Title


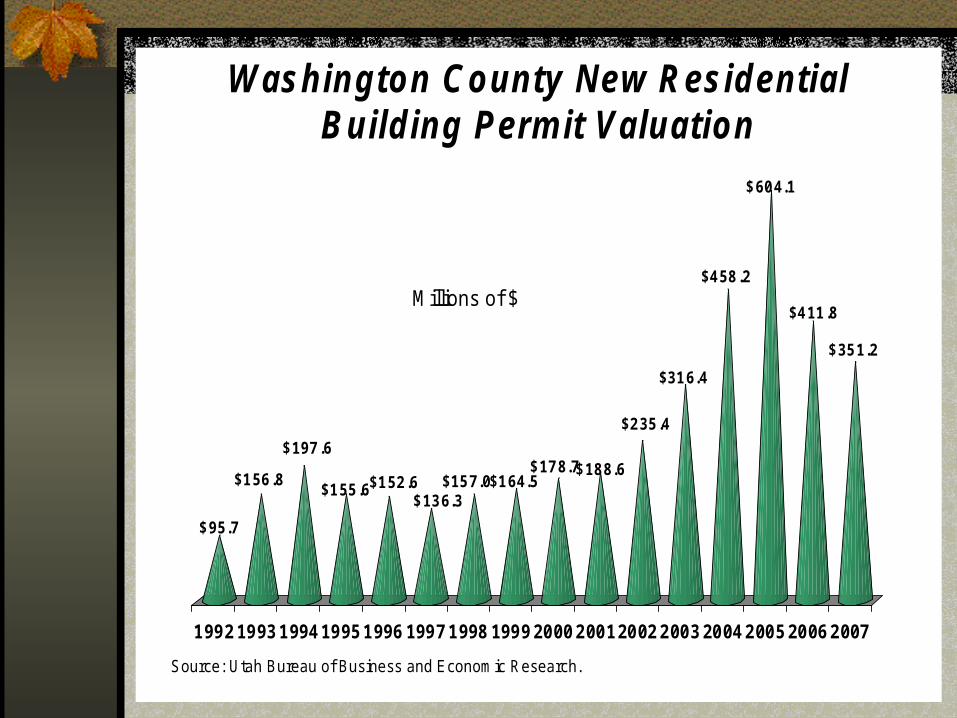
$ 95.7
$1 56 .8
$ 197 .6
$1 55 .6$1 52 .6$ 13 6.3
$15 7.0$1 64.5$ 17 8.7$ 18 8.6
$2 35 .4
$31 6.4
$4 58 .2
$ 60 4.1
$4 11 .8
$ 35 1.2
1992 1993 1994 1995 1996 1997 1998 1999 2000 2001 2002 2003 2004 2005 2006 2007
Washington County New Residential Building Permit Valuation
Source: Utah Bureau of Business and Economic Research.
Millions of $

Population Growth Sparks A Healthy Economy
Washington County is no stranger to growth. We have been growing since the pioneers made their homes along the banks of the Santa Clara and Virgin Rivers. The rate at which an area grows is due in large part to its history, topography, climate, job prospects, the arts, leisure activities and educational opportunities. We as a county possess countless reasons for people to want to call this place home.
People will flock to an area with a high quality of life. Businesses will flock to an area known for its educated work force and its strong work ethic. We cannot stop people from coming here. Growing pains are to be expected, but the rewards will be unparalleled.
Representative David ClarkThe Pipeline – Spring / Summer 2008

Current Growth RateWith a current growth rate in Washington County of about 3.5 percent, approximately 2,000 new families will locate here this year. As each family makes its search for nirvana, pricing will likely be the driving mechanism and determinant for most purchases.
And so we remind everybody, that it is the lower prices in the real estate market that act as a beacon and lure to attract those who previously spurned the thoughts of owning a piece of “Utah’s Dixie.” truly, there has never been a better time to purchase a home in Washington County than “NOW” and during the next year.
MainStreet Business Journal – June 2008
Allan Carter – Southern Utah Title

ACCRA Cost of Living IndexSecond Quarter 2008
Metro / Micro * 100% 12.49% 29.84% 9.94% 4.07%
Area & State Composite Grocery Housing Utilities Health Care
St.George, UT 97.3 100.7 105.0 72.3 97.5
Salt Lake City, UT 98.8 102.8 99.6 70.0 103.9
Las Vegas, NV 106.3 103.1 123.1 94.8 100.8
Cedar City, UT * 91.5 100.9 89.5 78.6 85.6
Lake Havasu, AZ 111.2 104.5 137.3 100.0 96.9
Kingman, AZ
Riverside, CA 119.3 109.6 157.3 86.3 106.1
San Bernardino, CA
Ontario, CA
The Council For Community And Economic Research

2000 to 2007 Population Growth by County55%
42%
36%35%
31%
29%
28%23%
20%
19%
16%
16%
14%
13%
12%
12%11%
11%
8%
8%7%
7%
7%
5%4%
3%
2%
-3%-3%
-4%
Washington
Wasatch
Tooele
Utah
Iron
Morgan
Summit
Davis
State of Utah
Cache
JuabSanpete
Uintah
Salt Lake
Duchesne
Weber
Box Elder
Rich
Sevier
Millard
Beaver
Grand
Kane
WayneDaggett
San Juan
Garfield
EmeryCarbon
Piute
Source: Utah Population Estimates Committee; Utah Governor’s Office of Planning and Budget.
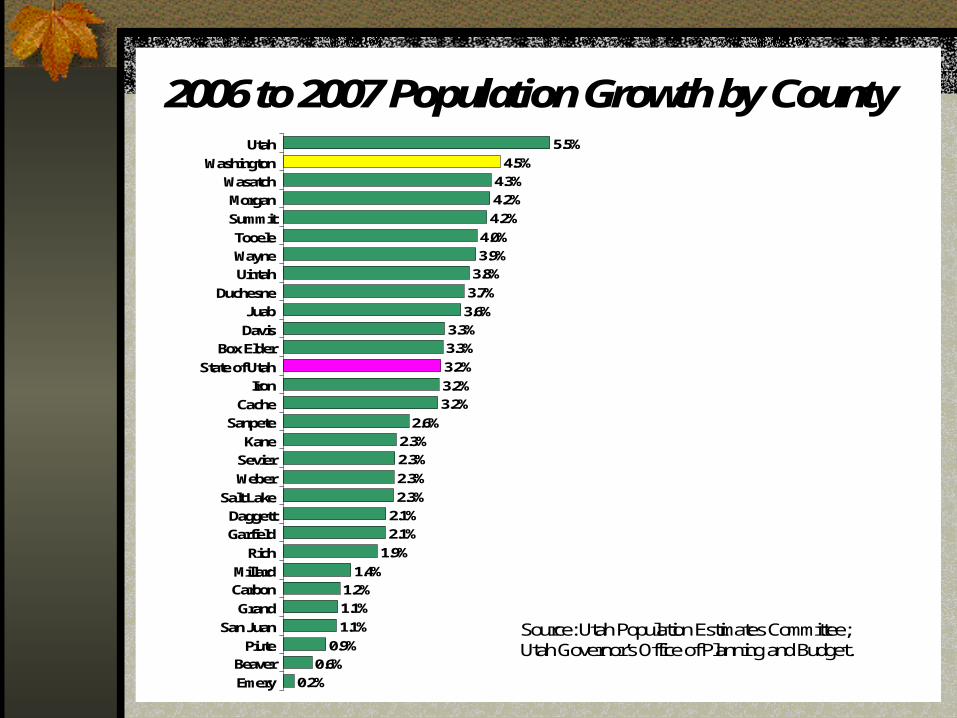
2006 to 2007 Population Growth by County5.5%
4.5%
4.3%
4.2%
4.2%
4.0%
3.9%
3.8%
3.7%
3.6%
3.3%
3.3%
3.2%
3.2%
3.2%
2.6%
2.3%
2.3%
2.3%
2.3%
2.1%
2.1%
1.9%
1.4%
1.2%
1.1%
1.1%
0.9%
0.6%
0.2%
Utah
Washington
Wasatch
Morgan
Summit
Tooele
Wayne
Uintah
Duchesne
Juab
Davis
Box Elder
State of Utah
Iron
Cache
Sanpete
Kane
Sevier
Weber
Salt Lake
Daggett
Garfield
Rich
MillardCarbon
Grand
San Juan
PiuteBeaver
Emery
Source: Utah Population Estimates Committee; Utah Governor’s Office of Planning and Budget.
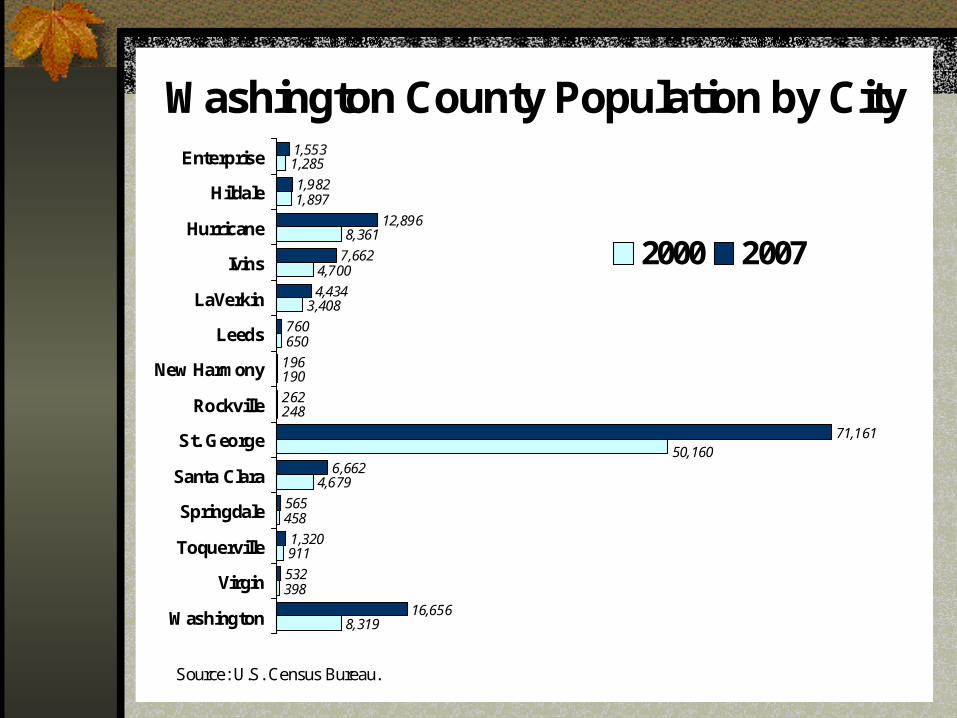
Washington County Population by City
Source: U.S. Census Bureau.
8,319
398
911
458
4,679
248
190
650
3,408
4,700
8,361
1,897
1,285
16,656
532
1,320
565
6,662
71,161
262
196
760
4,434
7,662
12,896
1,982
1,553
50,160
Washington
Virgin
Toquerville
Springdale
Santa Clara
St. George
Rockville
New Harmony
Leeds
LaVerkin
Ivins
Hurricane
Hildale
Enterprise
2000 2007
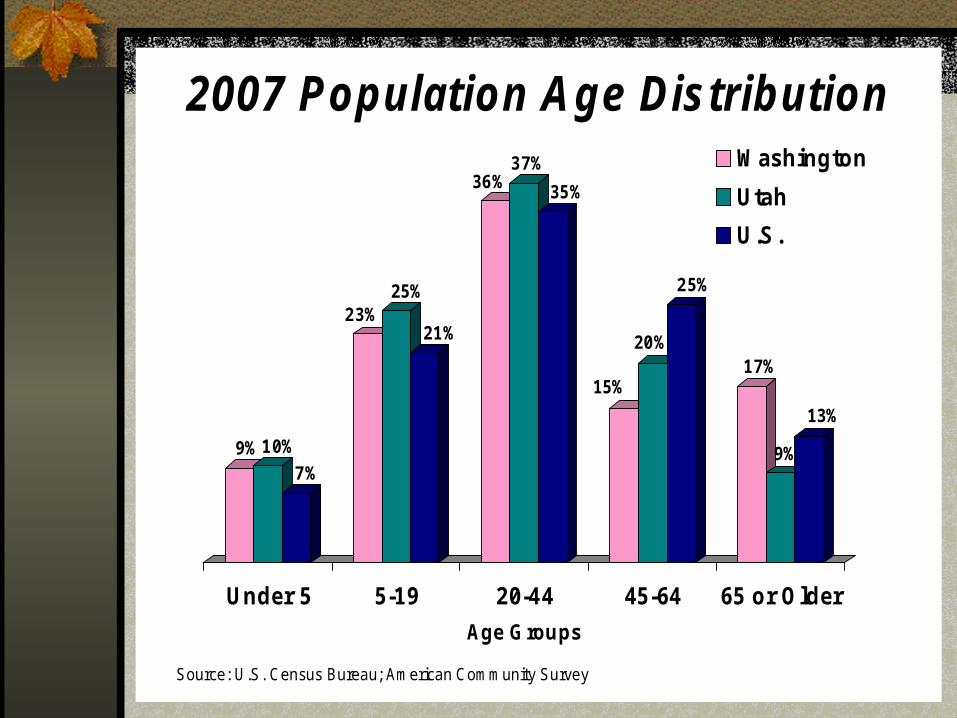
9% 10%
7%
23%25%
21%
36%37%
35%
15%
20%
25%
17%
9%
13%
Under 5 5-19 20-44 45-64 65 or Older
Age Groups
Washington
Utah
U.S.
2007 Population Age Distribution
Source: U.S. Census Bureau; American Community Survey

Washington County Race/Ethnic Distribution
Source: U.S. Census Bureau.
0.3% 0.2%
1.5% 1.4%
0.3% 0.4%0.3% 0.4%
1.8%
5.2%
1.2%
0.1%
1990 2000
Black American Indian Asian Pacific Islander
Hispanic Two or More Races Other Race

Economic Development Relies On Adequate Water Supplies
As in the past, the future of the area depends on a safe and reliable water system. The Lake Powell Pipeline water development project represents the future; either the area grows and prospers with it or is restrained and economically crippled without it.
The pioneers realized that economic development is not possible without sufficient water resources. Hopefully, today’s generation also has a keen appreciation for that reality.
Scott Hirschi – WCEDC Executive Director
The Pipeline – Spring / Summer 2008

Water Will Play A Major Role If Economic Growth Is To Continue
Water is a vital resource that we cannot take for granted. It is central to our daily personal needs, to manufacturing, agriculture, landscaping, recreation, tourism, health care and local businesses. Water shortages negatively impact industries, which in turn reduces job creation and job preservation. There is nothing to indicate that growth in Washington County is going to subside any time soon and we need to be ready to meet the projected water needs.
Today’s water development projects will meet tomorrow’s need. Tomorrow is never far in the future. A water development project must be planned years in advance if we are to be prepared to meet future demand.
Representative David ClarkThe Pipeline – Spring / Summer 2008

Lending
The number of recorded trust deeds (loans) continue to decrease, reaching a several year low of 577, down from this year’s previous low in July of 619. Wells Fargo, Zion’s First National Bank and Countrywide were the top three lenders in Washington County with approximately $91,000,000 (67 loans), $24,000,000 (38 loans) and $6,000,000 (32 loans) respectively.
Year-to-date (January thru July) loan volume is off 50% and totaled $1,391,000,000 in 2008 as compared to $2,779,000,000 in 2007.
Southern Utah Title - September 2008
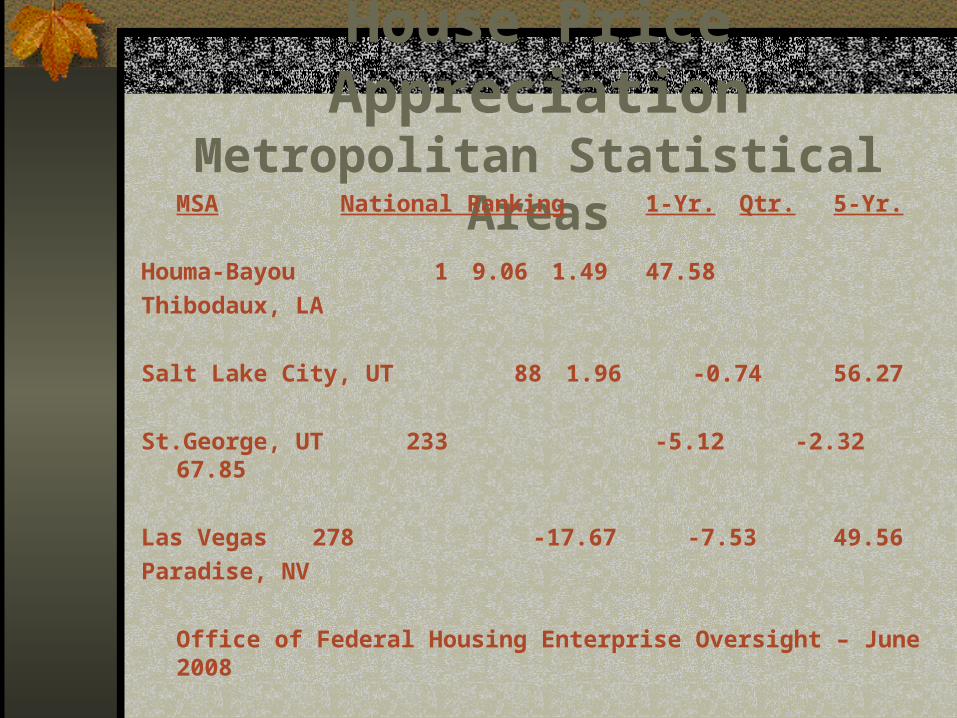
House Price AppreciationMetropolitan Statistical Areas
MSA National Ranking 1-Yr. Qtr. 5-Yr.
Houma-Bayou 1 9.06 1.49 47.58
Thibodaux, LA
Salt Lake City, UT 88 1.96 -0.74 56.27
St.George, UT 233 -5.12 -2.32 67.85
Las Vegas 278 -17.67 -7.53 49.56
Paradise, NV
Office of Federal Housing Enterprise Oversight – June 2008

OFHEO MSA-LevelHouse Price Indexes
YEAR QUARTER ST.GEORGE LAS VEGAS 2008 1 -3.65 -12.02007 4 -1.72 -6.042007 3 -0.85 -3.542007 2 2.71 -0.58 2007 1 4.79 1.61 2006 4 11.6 5.37 2006 3 17.9 9.53 2006 2 25.5 11.6 2006 1 37.2 15.7 2005 4 35.3 15.7 2005 3 33.2 14.22005 2 29.2 27.1 2005 1 19.8 34.92004 4 16.3 38.3 2004 3 12.4 43.5
Office of Federal Housing Enterprise Oversight – June 2008


1st Qtr. 2007 vs. 2nd Qtr. 2008 No. Sales No. Sales No. Sales Ave. Sales Ave. Sales Ave. Price 1st Qt 2008 2nd Qt 2008 Market Report 1st Qtr. 2nd Qtr. %Up/Dn. Price 1st Price 2nd %Up/Dn. Working Totals Working Totals
2008 2008 Qtr. 2008 Qtr. 2008
Brigham/Tremonton Area 108 138 27.78% $159,255 $177,902 11.71% 17,199,540 24550476
Cache/Rich 223 200 -10.31% $197,695 $198,600 0.46% 44085985 39720000
Carbon/Emery 55 67 21.82% $124,063 $142,795 15.10% 6823465 142795
Central Utah Area 33 43 30.30% $137,467 $136,513 -0.69% 4536411 5870059
Davis County homes 708 866 22.32% $254,862 $254,473 -0.15% 180442296 220373618 condos 49 91 85.71% $184,292 $191,490 3.91% 9030308 17425590
Grand homes 12 19 58.33% $294,166 $256,365 -12.85% 3529992 4870935 condos 16 12 -25.00% $286,125 $294,663 2.98% 4578000 3535956
Iron County Area homes 137 154 12.41% $219,384 $219,007 -0.17% 30055608 33727078 condos 21 30 42.86% $195,063 $150,353 -22.92% 4096323 4510590
Juab County homes 17 16 -5.88% $149,717 $175,928 17.51% 2545189 2814848
Morgan County homes 9 21 133.33% $328,377 $401,808 22.36% 2955393 8437968
Park City Area homes 113 126 11.50% $1,127,138 $1,020,063 -9.50% 127366594 128527938 condos 136 140 2.94% $859,425 $988,891 15.06% 116881800 138444740
Salt Lake County homes 1820 2591 42.36% $287,119 $293,817 2.33% 522556580 761279847 condos 464 589 26.94% $192,637 $189,285 -1.74% 89383568 111488865
SanJuan homes 11 15 36.36% $203,772 $137,263 -32.64% 2241492 2058945
Tooele County138 187 35.51% $195,001 $201,013 3.08% 26910138 37589431
Uintah Basin Area 165 166 0.61% $193,012 $193,719 0.37% 31846980 32157354
Utah County homes 715 984 37.62% $265,056 $270,131 1.91% 189515040 265808904 condos 186 234 25.81% $171,132 $168,475 -1.55% 31830552 39423150
Wasatch County44 50 13.64% $483,726 $400,162 -17.28% 21283944 20008100
Washington County homes 334 458 37.13% $314,480 $291,080 -7.44% 105036320 133314640 condos 101 95 -5.94% $180,588 $207,250 14.76% 18239388 19688750
Weber County homes 613 817 33.28% $189,262 $191,760 1.32% 116017606 156667920 condos 84 96 14.29% $131,556 $152,346 15.80% 11050704 14625216
1720039216 2227063713

Second Quarter No.Sales No Sales No. Sales Ave. Sale Ave. Sale Ave. Price 2007 Second Qtr. 2008 Second Qtr. 2008 Market Report 2nd Qtr. 2nd Qtr. %Up/Dn. Price 2nd Price 2nd %Up/Dn. Sales Volume Sales Volume
2007 2008 Qtr. 2007 Qtr. 2008
Brigham/Tremonton Area 179 138 -22.91% $174,963 $177,902 1.68% $31,318,377.00 $24,550,476.00
Cache/Rich 410 200 -51.22% $190,267 $198,600 4.38% $78,009,470.00 $39,720,000.00
Carbon/Emery 67 67 0.00% $75,632 $142,795 88.80% $5,067,344.00 $9,567,265.00
Central Utah Area 116 43 -62.93% $132,193 $136,513 3.27% $15,334,432.08 $5,870,059.00
Davis County homes 1138 866 -23.90% $263,888 $254,473 -3.57% $300,304,544.00 $220,373,618.00 condos 98 91 -7.14% $160,456 $191,490 19.34% $15,724,688.00 $17,425,590.00
Grand homes 29 19 -34.48% $236,765 $256,365 8.28% $6,866,185.00 $4,870,935.00 condos 17 12 -29.41% $290,847 $294,663 1.31% $4,944,399.00 $3,535,956.00
Iron County Area homes 237 154 -35.02% $200,826 $219,007 9.05% $47,595,762.00 $33,727,078.00 condos 68 30 -55.88% $169,230 $150,353 -11.15% $11,507,640.00 $4,510,590.00
Juab County homes 39 16 -58.97% $180,735 $175,928 -2.66% $7,048,665.00 $2,814,848.00
Morgan County homes 35 21 -40.00% $286,013 $401,808 40.49% $10,010,455.00 $8,437,968.00
Park City Area homes 229 126 -44.98% $947,715 $1,020,063 7.63% $217,026,735.00 $128,527,938.00 condos 171 140 -18.13% $878,682 $988,891 12.54% $150,254,622.00 $138,444,740.00
Salt Lake County homes 3486 2591 -25.67% $298,214 $293,817 -1.47% $1,039,574,004.00 $761,279,847.00 condos 844 589 -30.21% $192,050 $189,285 -1.44% $162,090,200.00 $111,488,865.00
SanJuan homes 137 15 -89.05% $185,600 $137,263 -26.04% $25,427,200.00 $2,058,945.00
Tooele County 284 187 -34.15% $207,886 $201,013 -3.31% $59,039,624.00 $37,589,431.00
Uintah Basin Area 138 166 20.29% $201,072 $193,719 -3.66% $27,747,936.00 $32,157,354.00
Utah County homes 1363 984 -27.81% $295,470 $270,131 -8.58% $402,725,610.00 $265,808,904.00 condos 419 234 -44.15% $171,690 $168,475 -1.87% $71,938,110.00 $39,423,150.00
Wasatch County 77 50 -35.06% $401,965 $400,162 -0.45% $30,951,305.00 $20,008,100.00
Washington County homes 585 458 -21.71% $329,180 $291,080 -11.57% $192,570,300.00 $133,314,640.00 condos 187 95 -49.20% $179,646 $207,250 15.37% $33,593,802.00 $19,688,750.00
Weber County homes 1441 817 -43.30% $182,665 $191,760 4.98% $263,220,265.00 $156,667,920.00 condos 156 96 -38.46% $133,840 $152,346 13.83% $20,879,040.00 $14,625,216.00
$3,230,770,714.08 $2,236,488,183.00
2863489357 1969515505
The Bright Side Of Real Estate
For awhile there, call it 2003-2006, we got used to expecting quick and huge appreciation, plentiful deals, easy funding, and abundance in general. Today doesn’t feel so great in comparison, but there is still much to celebrate.
Market adjustments (the polite term for real estate heart attacks) accomplish some very positive things: they force a return to more conservative and safer practices; they clear out the wannabe’s and charlatans; and they create opportunity for the little guys. Right now, if we look at our markets, it is clear that this is happening.
Certainly, lots of good folks (taxpayers for example) will have to bear the cost of this; it is a price of our democratic and capitalist society that we will make mistakes and have to fix them ourselves.
Craig Griffin – October 2008Coldwell Banker Commercial KGA

The Bright Side Of Real Estate One important silver lining is the return of available workforce housing. For many high growth communities, the boom saw investors gobbling up homes that were conceived and built for our workforce, seniors and new families. This pushed up prices and then rents, which made it hard for community services and businesses to attract and maintain a stable workforce.
Today however, most cities are seeing a good level of affordable housing which is critical for stable and sensible community and business growth. Developers are once again building for the market and for real people, not just throwing up product because “somebody will buy it.”
As always, there are good times ahead, new lessons, and opportunity.
Graig Griffin – October 2008Coldwell Banker Commercial KGA
SummaryShort sales and foreclosures continue to drive down existing home prices and put increased pressure on builders to supply low-cost new homes to compete with the reduced-priced existing homes. Lot sales and building permits continue to be slow allowing the market to absorb the more than ample supply of already built but not moved into new homes.
Banks and mortgage companies are still lending, the rates are still favorable, and those willing to navigate the effects of the foreclosure market on underwriter requirements are able to take advantage of bargain basement prices.
Total sales, new sales, and existing sales were all up in August over July. Despite a steep decline in total loans, they may rally back in light of the drop in interest rates in early September.
Developer Services – August 2008
Conclusion
The Washington County real estate market has been sustained for decades by selling attractive, affordable and quality homes in a premier, fun part of the country with deep moral values and a tremendous sense of community.
As foreclosures and the oversupply of lots and homes are absorbed, look for a flattening of home prices and a slow climb up sustained by well-priced homes in one of the nation’s premier Communities.
Developer Services – August 2008
AcknowledgementsSalt Lake REALTOR® Magazine
Southern Utah Title
defaults4you.com
Developer Services
Associated Press
MainStreet Business Journal
Terra Title Company
Utah Bureau of Business and Economic Research
The Pipeline – Washington County Water Conservancy District
Council for Community and Economic Research
Utah Governor’s Office of Planning and Budget
U.S. Census Bureau
Office of Federal Housing Enterprise OversightWashington County Board of REALTORS®
Utah Association of REALTORS®
Coldwell Banker Commercial KGA


