The “When” and “Where” Dimensions of Cherry Picking * Dinesh K. Gauri State University of New York at Buffalo K. Sudhir Yale University Debabrata Talukdar State University of New York at Buffalo This Draft: May 2005 * Dinesh Gauri and Debabrata Talukdar are doctoral student and Assistant Professor of Marketing respectively at SUNY, Buffalo. K. Sudhir is the James L. Frank Associate Professor of Private Enterprise and Management at the Yale School of Management. All three authors contributed equally to the paper. The authors are grateful to Arun K. Jain for providing the secondary data and financial support through the Center for Relationship Marketing at the School of Management, SUNY, Buffalo. The authors thank Jiwoong Shin and the participants at the 2004 Marketing Science Conference at Rotterdam for their comments.
Transcript
The “When” and “Where” Dimensions of Cherry Picking*
Dinesh K. Gauri State University of New York at Buffalo
K. Sudhir
Yale University
Debabrata Talukdar State University of New York at Buffalo
This Draft: May 2005
* Dinesh Gauri and Debabrata Talukdar are doctoral student and Assistant Professor of Marketing respectively at SUNY, Buffalo. K. Sudhir is the James L. Frank Associate Professor of Private Enterprise and Management at the Yale School of Management. All three authors contributed equally to the paper. The authors are grateful to Arun K. Jain for providing the secondary data and financial support through the Center for Relationship Marketing at the School of Management, SUNY, Buffalo. The authors thank Jiwoong Shin and the participants at the 2004 Marketing Science Conference at Rotterdam for their comments.
The “When” and “Where” Dimensions of Cherry Picking
Abstract
Due to the use of promotional pricing by supermarkets, there is considerable price
variation across weeks within a store and across stores within a week. Consumers may therefore
save on their groceries by (1) cherry picking over time (“when”) and (2) cherry picking across
stores (“where”). The research focuses on three substantive research questions associated with
cherry picking: (1) What variables explain the segmentation by consumer cherry picking patterns
on the “when” and “where” dimensions? (2) How much do the different segments save by cherry
picking? (3) How do cherry picking patterns affect store performance? A unique data collection
approach that allows us to have access to both observational and survey data on a set of
households enables us to demonstrate that findings from survey based research are comparable to
findings from objective behavioral data.
1
1. Introduction Due to the use of promotional pricing by supermarkets, there is considerable price
variation across weeks within a store and across stores within a week. While a household is
unlikely to find it cost-effective to exploit this price variation by searching for better prices on
any particular grocery item, the savings over a household’s entire basket can be potentially large
enough to be cost-effective. Due to the repeat and frequent nature of grocery purchases, the total
potential savings for consumers on groceries through diligent price search across time and across
stores can be very significant.1
Research on price search has had a long tradition in marketing (see extensive literature
reviews in Newman 1977 and Beatty and Smith 1987) because of its implications for a retailer’s
price and promotional strategy. However this research has been primarily focused on durable
goods. Research on price search in grocery markets, which involve repeated and frequent
purchases of multiple goods, has been more recent and limited.
Similar to the research in price search on durable goods, research on grocery markets
(e.g., Carlson and Gieseke 1983; Putrevu and Ratchford 1997) has also focused on cross-store
price search. But such a focus is restrictive in grocery markets, because extant research on store
competition at a single category level typically finds only weak or non-existent store-traffic
effects of promotions or pricing (e.g., Walters and Rinne 1986; Walter 1991; Bucklin and Lattin
1992). Some research has shown that cross-store effects tend to be visible only in higher cost
categories (Kumar and Leone 1988; Grover and Srinivasan 1992). Urbany, Dickson and Key
(1991) and Urbany, Dickson and Sawyer (2000) find that retail executives tend to
disproportionately emphasize cross-store effects of promotions and treat promotions primarily as
an offensive weapon to draw customers from the competing stores. However, this perception is
not consistent with actual underlying consumer store choice behavior as reflected in consumer
surveys. The proportion of consumers who shop at multiple stores on a regular basis is very
small at around 10-15% (Urbany, Dickson and Key 1991; Slade 1995).
In contrast to this focus on cross-store choice in the literature on price search, several
research studies find evidence of considerable store loyalty among consumers (e.g., Bell, Ho and
Tang 1998; Bell and Lattin 1999). Most importantly, the explanatory power of price promotions
1 The Food Marketing Institute (2004) reports that average grocery spending per week for a household is about $90.
2
in inducing store switching is dominated by the observed consumer loyalty towards stores.
Further, studies that focus on within store choice find evidence that many consumers change
their purchase timing and purchase quantities within a store in response to price promotions in
order to obtain lower average prices for goods consumed over time (e.g., Neslin, Henderson and
Quelch, 1985; Mela, Jedidi and Bowman 1998). Thus the use of price promotions can help a
store obtain a higher wallet share from even its price sensitive shoppers who for a variety of non-
price related reasons (e.g., location, preference for offered assortment etc.) prefer to shop at their
store. These studies suggest that price promotions serve as a “defensive” weapon to retain a
store’s price sensitive customers, rather than as an “offensive” weapon that serves to attract
customers from competing stores. At the same time, the store can charge higher prices from its
price insensitive customers who do not restrict their purchases only to promotional periods. Thus
price promotions simultaneously serve as an effective price discrimination device for a store
among single-store customers and as a competitive tool against competing stores for the cross-
store shopper.
Given the dual use of price promotions outlined above, a store manager needs to
understand the price search/cherry picking behavior of not only cross-store shoppers, but those of
shoppers who shift their purchase timing in order to take advantage of promotions at their
preferred store. We therefore expand the focus on cross-store price search in the extant literature
to also include inter-temporal price search. Hence we characterize price search and the resulting
cherry picking behavior in grocery shopping along two dimensions: (1) inter-temporal (when to
cherry pick?) and (2) across store (where to cherry pick?). Based on the “when” and “where”
dimensions of price search/cherry picking we divide the market into four segments. The four
segments are those who engage in: (1) cross-store cherry picking, (2) inter-temporal cherry
picking, (3) both and (4) neither. As discussed earlier, inter-temporal cherry picking behavior
and cross-store cherry picking behavior have substantively different effects on retailer
performance. Therefore it is critical for a supermarket manager to obtain a good understanding of
both the descriptive characteristics of these four segments of consumers and how their behavior
impacts store performance.
The first substantive research question that we address in the paper is a description of the
segments. What variables characterize the membership of consumers in one of the four price
search based cherry picking segments? We survey consumers on their search behavior and based
3
on survey responses classify them into one of four segments. We generate our hypotheses about
membership of the four segments, based on economic tradeoffs of price search. If price search
behavior is an outcome of consumers trading off the benefits of price search against the
opportunity costs of time for undertaking search (e.g., Urbany, Dickson and Kalapurakal 1996;
Putrevu and Ratchford 1997), then the relative location of the consumers with respect to the
stores, the distances betweens stores and the per unit time opportunity cost of search would be
very important in explaining search behavior. Yet, interestingly the role of relative geographic
location of consumers and stores on search behavior has received very limited attention. Many
store choice models using revealed preference data treat this as a form of unobserved
heterogeneity. Others using stated price data ask questions about motivations and attitudes of
consumers, but do not ask questions about consumer locations, relative to stores. In fact, with the
exception of the recent study by Fox and Hoch (2005), none of the existing price-search studies
include “consumer and store geography” in their analyses. Fox and Hoch, whose focus is on
cross-store search, find that cross-store cherry picking increases as the stores are located close
together. As we shall argue, the relative locations of consumers with respect to stores and the
distances between the stores interact with each other to generate a rich set of location based
hypotheses about search behavior along the two dimensions of price search. Indeed we find
strong support for our richer set of location hypotheses. We also test and find support for the
effects of household characteristics, personality traits and attitudes (e.g., unit opportunity cost,
perceived information search skill and market mavenism) as predictors of segment membership.
The second research question we seek to address is: What are the relative gains from
search for the different cherry picking segments? This enables us to answer several interesting
questions: Do inter-temporal or cross-store cherry pickers save more? How much do they save
relative to those who do neither inter-temporal nor cross-store price search? How much do cross-
store inter-temporal cherry pickers gain relative to those who do only inter-temporal or cross-
store cherry picking? For this purpose, we develop an objective measure of price search
efficiency. Briefly, it is the ratio of the actual savings relative to the maximum possible savings
that a household could obtain by perfect cherry picking.
The second research question is not only of substantive or empirical interest, but also
important from the point of view of research methodology on consumer search in grocery
markets. Thus far, there are two distinct methodological streams of research on price search in
4
the grocery market: one based on survey data measuring stated price search propensity and the
other based on revealed purchase behavior that allows us to make inferences about actual price
search efficiency of consumers. Examples of survey based papers are Urbany et al. (1996) and
Putrevu and Ratchford (1997). They measure stated search propensity and investigate its
antecedents, but do not verify whether actual price search is consistent with the stated search
measures. Examples of papers based on revealed purchases are Carlson and Giseke (1983) and
Fox and Hoch (2005) who find that consumers who purchase more across stores indeed find
greater savings. However, the open question is whether the two types of research are likely to
lead to similar conclusions. As Putrevu and Ratchford state: “…we have not addressed the related issue of whether the perceived behavior of consumers is a good measure of
their actual behavior. Since studies have documented differences between self-reported and actual search behavior
(Newman and Lockman 1975), and perceived and actual knowledge (Brucks 1985), it is not clear that self-reported
measures of grocery shopping and its antecedents of the type employed in this study will accurately track actual
behavior. This is an issue for further research.”
By investigating the link between stated price search and objective price search
efficiency, we seek to answer the question: Are self-reported measures of search by consumers
consistent with their actual behavior? Finding evidence that stated search behavior tracks
observed search behavior can be of importance in future research. This is because such a finding
suggests that either type of data can be used for research purposes, depending on data availability
and convenience of data collection. Further, each type of data has certain strengths and
depending on the research’s focus, one can use the appropriate type of data. Stated search
propensity data can provide insights on not just the final price search behavior, but also on the
underlying attitudes and personality traits of consumers. Though observed price search behavior
cannot help us understand underlying attitudes, it can help us understand how the different
segments affect store performance in terms of revenue and profits.
To this end, we collect survey data from households for whom we also have access to
their actual purchasing behavior. This is a particularly difficult task in practice, because widely
available panel data tends to be historic and this prevents us from doing surveys of these
households. We obtain the cooperation of one retailer to provide us a “live” panel of participants
for whom we were provided access to their transactions in real time. This allowed us to both
survey the households on their search behavior and keep track of their purchases in the weeks
where the study was conducted. We use the “live” data on what products were purchased by a
5
household at the focal retailer to obtain prices for the same products at the competing retailer.
This enabled us to obtain measures of potential benefits from price search by cross-store
shopping. This was an extremely labor intensive task since we obtain prices manually on about
8,500 distinct product items for three weeks (i.e., over 25,000 price observations) from the
competing retailer. By comparing prices across the two stores, we are able to make inferences
about the cross-store price search behavior. To address the inter-temporal dimension of price
search, we tracked each consumer over multiple purchase visits. We provide additional details of
our data collection approach in Section 3. This labor-intensive data collection approach enables
us to assess the empirical equivalence and validity of research using stated and revealed search
behavior for the first time in the literature.
The third and final research question we address is: How do the four cherry picking
segments differ in their impact on store performance? This question has hitherto not been
addressed in the literature (Fox and Hoch 2005), because typical scanner datasets have no
information on the profit margins of the products (the Dominicks database at the University of
Chicago has information on profit margins, but does not have household level data to analyze
cherry picking). Further, a complete analysis of profitability of consumer baskets is impossible
given that most scanner datasets have information only on a limited number of categories (even
the Stanford basket database does not cover all categories). Thus far, we only have speculation
(e.g. Dreze 1999; Mogelonsky 1994) that cherry picking behavior by grocery shoppers can have
a significant negative impact on retail profitability. Dreze (1999) suggests that “extreme” cherry
picking consumers can patronize a store to only buy deeply discounted items, while they go to
their preferred primary store/s to do the rest of their weekly grocery shopping; therefore these
households could be highly unprofitable for stores that use loss leader pricing to increase store
traffic. Even store loyal inter-temporal cherry picking consumers who disproportionately
purchase loss-leader items can be unprofitable to the store. Thus the efficacy of promotional
strategies cannot be evaluated without an analysis of the impact of cherry picking customers on
store profits. Using a unique dataset that has information on both profit margins and all
purchases (over a one year period) of households at a cooperating retailer, we are able to
evaluate how cherry picking affects retailer profits and other relevant store performance
measures (e.g., total profits, wallet share and trip frequency).
6
In summary, this paper helps to answer three substantive research questions and one
methodological research question. The three substantive questions are: (1) What variables
explain the segmentation by consumer cherry picking patterns? (2) What are the gains from
search for households with different cherry picking patterns? (3) How do cherry picking patterns
affect store performance? The methodological research question is: Are the findings from survey
based research comparable to research based on objective behavioral data?
The rest of the paper is organized as follows: Section 2 discusses the conceptual
framework and the hypotheses that we seek to test. Section 3 discusses the data collection
strategy and Section 4 presents the results of the empirical analysis. Section 5 concludes with the
implications of our findings and future research directions.
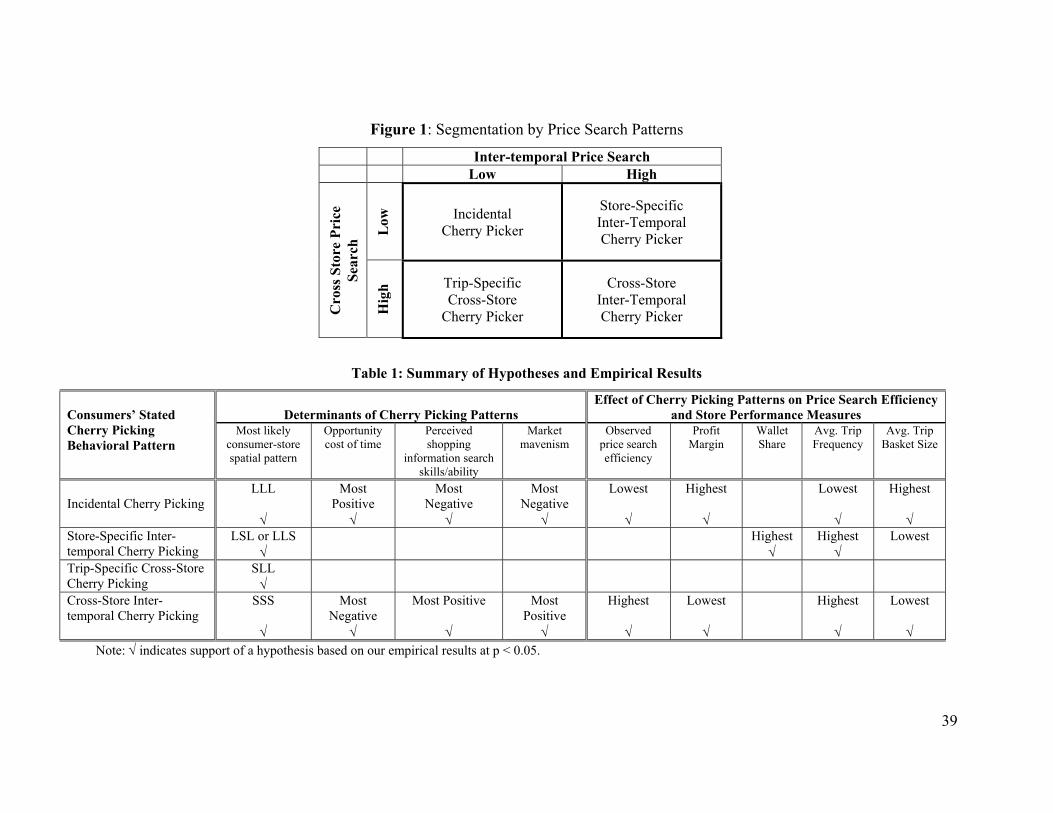
2. Conceptual Framework and Research Hypotheses 2.1 Segmentation by Price Search/Cherry Picking Patterns
Consider a duopoly grocery retail market where price variations occur both inter-
temporally (across weeks, since cycle time for price changes is weekly) within a store and across
stores. The duopoly assumption is reasonable and consistent with reality in many US markets
(Fox and Semple 2002) including the market we study. Since there are inter-temporal and cross-
store price variations in the market, consumers can benefit from both inter-temporal and cross-
store cherry picking. As discussed in the introduction, we split consumers into two categories
along the inter-temporal and cross-store price search/cherry picking dimensions to create four
segments of grocery shoppers (see Figure 1 below).
[Figure 1 about here]
Some shoppers do not search much and therefore do not take advantage of either inter-
temporal or cross-store cherry picking opportunities. However they still incidentally get low
prices on promoted products because these products happen to be available on sale at their
preferred store when they wanted to purchase them. These shoppers typically will be low on
stated overall price search propensity in both the inter-temporal and cross-store price search
dimensions. We label these shoppers as “incidental cherry pickers.”
A second type of shopper tends to be loyal to their preferred store and therefore do not take
advantage of cross-store cherry picking patterns. However, they shift purchases over time to
avail themselves of promotions at their preferred store and therefore score high on the inter-
7
temporal cherry picking dimension. We label these shoppers as “store-specific inter-temporal
cherry pickers.”
A third type of shopper takes trips across stores to pick the best contemporaneous prices (on
any given shopping trip) across stores to take advantage of any cross-store price differences. This
segment is the focus of the study by Hoch and Fox (2005). This segment may have less store
loyalty than the previous two segments; though it is quite possible they could buy most of their
(non-deal) purchases at a preferred store and buy only low-priced items at other competing
stores. We label these shoppers as “trip-specific cross-store cherry pickers”.
The fourth type of shopper takes advantage of both cross-store and inter-temporal price
variations by making regular weekly shopping trips to both stores. These shoppers will switch
between the two stores and shift their purchase timings in order to get the best price deals across
stores and over time for a grocery item. We label these shoppers as “cross-store inter-temporal
cherry pickers”.
2.2 What variables characterize the different cherry picking segments?
The answer to the question lies in why households in a segment choose their associated
price search patterns. We start with the premise that consumers choose that search pattern/cherry
picking behavior that maximizes potential savings for the household, net of their costs. We use a
cost-benefit framework that focuses on consumer and store locations and opportunity costs to
help develop hypotheses about the choice of consumer search patterns (e.g., Urbany, Dickson
and Kalapurakal 1996; Putrevu and Ratchford 1997). We also consider certain stated personality
characteristics and attitudes that can affect search behavior.
Benefits of Cherry Picking
In order to benefit from search, there should be price dispersion in the market. Several
papers have quantified the level of price dispersion in various product markets (e.g.,
Brynjolfsson and Smith 2000; Clemons et al. 2002; Ratchford et al. 2003). A common measure
of price dispersion is the maximum potential savings from price search. This is simply the range
of market prices in a given product market. The measure has been termed the “Information
Value” for the market in the sense that it represents the maximum value of savings possible given
that complete price information is available to a consumer in that market (Baye et al. 2003).
8
Existing studies on “information values” are only on durables goods. Therefore, the
benefits from price search in grocery markets have remained ambiguous and a source of debate
(Urbany et al. 2000). Conventional wisdom has been split as to whether grocery shoppers face
enough price savings incentive to search hard or not, given the low prices of grocery products.
To our knowledge, Fox and Hoch (2005) is the only study that has empirically investigated
consumer incentives for price search in grocery markets. They find the average savings realized
by shoppers on cross-store within trip cherry picking is about $15 and conclude that there is an
incentive for consumers with a median opportunity cost of time to indulge in cross-store within-
trip price search. Their empirical insights into consumers’ price search incentives however take
into account only the contemporaneous cross-store price search dispersion. However, for
frequently purchased goods like grocery products, an equally important incentive for consumers’
price search is to take advantage of inter-temporal price variations in the market place.
Accordingly, we extend Fox and Hoch’s analysis to quantify the benefits from consumers’ price
search in grocery markets under alternative cherry picking strategies used by the four segments
we described earlier.
We extend the definition of “information value” in durable goods which focuses only on
contemporaneous price dispersion, to account for both the “when” and “where” dimensions of
cherry picking. We define “information value” in terms of the range of prices in the market both
across stores and over a time window in which it makes sense for households to shift purchase
decisions.
One would expect the greatest savings for the inter-temporal cherry picking segment, and
the least savings for the incidental cherry picking segment. It is not a priori clear (without
looking at the relative level of price variation within and across stores) whether cross-store
within-trip cherry picking or inter-temporal cherry-picking leads to greater savings, but it is clear
that these two types of cherry picking should provide intermediate levels of benefits relative to
incidental cherry picking and inter-temporal cross-store cherry picking. We will look at the
extent of price variation in the market to examine the relative benefits of inter-temporal and
cross-store cherry picking behavior.
Costs of Cherry Picking
Location
9
The cost of search is the opportunity cost of time involved in performing the search. Let
W be the unit opportunity cost of travel time and T be the travel time to perform search. The
travel time to perform search may be further decomposed into T = D/S, where D is the distance
traveled to perform search and S is the speed of the typical mode of transport for grocery
shopping. Then the cost of search (C) is given by C = W T = W (D/S). In the context of grocery
shopping in suburban markets in the US, S can be assumed to vary little across consumers due to
widespread car ownership in these markets. Hence we focus on two variables: (1) D, the
distance traveled to perform search and (2) W, the unit opportunity cost of the household’s time.
Given that we consider the inter-temporal and cross-store price search dimensions, we
need to consider both the distance of the household from the store as well as the distances
between the competing stores. As we discussed earlier, very few studies consider geographic
locations. Fox and Hoch (2004) consider geography as a determinant of search, but treat the two
distances independently. We however hypothesize that both of these distances interact in
determining a household’s choice of search patterns.
We denote a consumer’s geographic locations and the distances between the two closest
stores for that consumer using a three dimensional vector (D12, D1, D2), where D12 is the distance
between the two stores, D1 is the distance between the consumer’s home and store 1, and D2 is
the distance between the consumer’s home and store 2. Rather than use the distances directly, we
use a median split of the distances to create a large (L) and small (S) dichotomous variable for
the distance in order to facilitate hypotheses generation and testing. To simplify exposition, we
will simply denote the three dimensional vector as D12D1D2, i.e., if there is a segment with D12=
L, D1= S, D2= L, we will refer to that segment as LSL segment.
We explain our rationale behind how the spatial configurations of the household and
stores affect their choice of search patterns. The pictorial descriptions below can be helpful in
understanding the logic of the hypothesis.
10
Search Pattern Spatial Layout of Most Likely Segment
Households of type LLL, who are far away from either store and also face large inter-
store distance are most likely to do incidental cherry picking because they can’t visit either store
often to take advantage of inter-temporal price variations and find it costly to also perform cross-
store price search. However, households of types LSL or LLS who are close to one of the stores
are more likely to perform inter-temporal cherry picking at their closest store because they can
visit it more often (which they will tend to use as their primary store), but do not perform much
cross-store price search due to the large inter-store distance.
For the SLL segment which is far away from either store, but where stores themselves are
close by, trip-specific cross-store cherry picking is very likely. As discussed earlier, this is the
behavior that Fox and Hoch (2005) focus on, and indeed they find that larger distances to the
store and shorter inter-store distances lead to greater cherry picking behavior. Our study nests
this hypothesis as part of a broader set of hypothesis.
Store 2
L
S
L
S
Household
Store 2
Household
SStore 2Store 1
Household
S S
L
S
Store 1
L
Store 2 Store 1
L Store 1
L
L
L
L
Store 1 Store 2
Household
Household
11
Finally, we expect that the SSS segment would most likely indulge in cross-store, inter-
temporal cherry picking to take advantage of both cross-store and inter-temporal price-variation,
given its close proximity to the stores as well as the small inter-store distances.
Personal Characteristics
An increase in unit opportunity cost of time for a household reduces the likelihood of
cross-store inter-temporal cherry picking most and increases the likelihood of incidental cherry
picking most. The net effect on the probabilities of choosing the other two types of cherry
picking patterns cannot be ordered, but should lie between the two extreme effects of incidental
cherry-picking and cross-store inter-temporal cherry picking patterns.
Some shoppers can be more skillful and able at organizing information in order to take
advantage of price variation both across stores and within stores inter-temporally. Similar to the
scales used in existing studies (e.g., Putrevu and Ratchford 1997), we develop a scale of
shopping information search skill/ability based on questions related to the shopper’s perceived
ability to remember prices and organize information in a manner that enhances their chances to
take advantage of market price variations. A person with greater perceived shopping information
search skill/ability is least likely to be an incidental cherry picker and most likely to be an inter-
temporal cross-store cherry picker.
We also consider the personal characteristic of market mavenism in the context of
shopping behavior of consumers. Market mavenism has been characterized in the literature as the
tendency of some shoppers to collect relevant marketplace information with the intent of sharing
it with others (Feick and Price 1987; Urbany et al. 1996). Market mavens are considered to be
motivated in their information search by “psychosocial” returns from sharing relevant market
information with others rather than by the direct economic benefit to themselves from such
information. As market mavenisim has been found to be associated with greater price search
behavior of grocery shoppers in previous research (Urbany et al. 1996), we expect this trait to be
least likely associated with an incidental cherry picker and most likely associated with an inter-
temporal cross-store cherry picker.
All of the above hypotheses are summarized in Table 1 on the left panel under the
heading “Determinants of Cherry Picking Patterns.”
[Table 1 about here]
12
2.3 How Much Do the Different Segments Actually Save by Cherry Picking?
To address this question, we develop an objective measure of price search efficiency that
captures the extent of savings from price search. The basic idea of the construct is similar to that
developed in studies for durable goods (e.g., Srinivasan and Ratchford 1993) in that the returns
to price search is the ratio of realized price savings relative to maximum potential savings given
the price dispersion in the market. Specifically, we use the following construct of “Price Search
Efficiency” (PSE) for a consumer on a given grocery shopping trip:
minmax
*max
BVBVBVBV
SavingsPotentialMaximumCapturedSavingsActualPSE
−−
==
where:
BVmax = Maximum possible $ value that could have been paid for the shopping basket
purchased on the trip, given the market price dispersion.
BVmin = Minimum possible $ value that could have been paid for the shopping basket
purchased on the trip, given the market price dispersion.
BV* = Actual $ value that was paid for the shopping basket purchased on the trip.
For computations of BVmax and BVmin values, we use both cross-sectional (across the
cooperating and competing chains) and inter-temporal (across three consecutive weeks including
the trip week) market price dispersion for all the items in the shopping basket under
consideration. Thus the construct PSE captures how efficient a consumer is in capturing the
potential price savings on grocery items in a market that presents savings opportunities both in
terms of store-specific inter-temporal price variations as well as cross-store contemporaneous
price variations.
2.4. Are Stated Search Patterns Consistent with Observed Behavior?
Based on the objective measure of price search efficiency developed above, we are able
to address the methodological question of whether the self-reported price search/cherry picking
patterns are consistent with actual price search behavior of the households. We do this by
relating the self-reported price search pattern against an objective measure of price search
efficiency. Effectively, we ask the question: Do consumers who claim to search more get lower
prices on average?
13
If consumers’ stated behavior matches actual price search behavior, the self-declared
“cross-store inter-temporal cherry picker” segment should obtain the lowest prices on average in
the actual data. In contrast, the self-declared “incidental cherry picker” segment should pay the
highest prices on average in the actual data. The other two segments should pay the intermediate
level of prices, though it is difficult to rank whether either the “store-specific inter-temporal
cherry picker” or “trip-specific cross-store cherry picker” would obtain the better prices on
average. If survey search measures match the objective search measure, we hypothesize that the
self-declared “inter-temporal cross-store cherry picker” should have the highest price search
efficiency and the “incidental cherry picker” will have the lowest price search efficiency. The
other two segments should have intermediate levels of price search efficiency.
In Section 2.2, we hypothesized that that households with certain spatial configurations are
most likely to pick a cherry picking pattern. Thus if the SSS segment is most likely to use the
cross-store inter-temporal cherry picking pattern, it should also have the greatest price search
efficiency. By the same logic the LLL segment should have the lowest price search efficiency.
The LSL and SLL segments would have intermediate levels of price search efficiency.
2.5 Impact of Cherry Picking Patterns on Store Performance
Our discussions so far have focused on understanding the determinants of stated cherry
picking patterns and how these patterns relate to their observed efficiency in taking advantage of
price variations in the market. While such insights into consumers’ price search behavior is
important and interesting in itself, supermarket managers would like to combine it with an
understanding of how cherry picking patterns affect store profits to devise optimal advertising
and price promotion strategies. Nevertheless, past research on cherry picking has ignored the
issue of profits because wholesale prices are typically not available (Fox and Hoch 2005).2 We
address this limitation in the extant research on cherry picking.
The average profit margin from a household is an obvious measure of store performance and
has been used in Ailawadi and Harlam (2004). We observe the average profit margins from the
household at the cooperating store. But since Store Profit Contribution = Profit Margin X Total
Expenditures in Store, profit margin is an incomplete measure of the impact of a household on a
store profits because it does not account for the total expenditures in a store. We therefore
2 The well known Dominicks dataset that has wholesale prices does not have household level data.
14
decompose total expenditures in the store in terms of observable variables that could be
reasonably correlated with cherry picking behavior. For example, Total Expenditures in Store =
Store Wallet Share X Total Grocery Expenditures across all Stores. We do not observe Total
Grocery Expenditures across All Stores, but we have information on Store Wallet Share from
our consumer surveys. An alternative way of decomposing Total Expenditures in Store is as
follows: Total Expenditures in Store = Trip Frequency X Average Basket Value Per Trip. We
can observe both these variables for each household at the focal store.
We now propose several hypotheses about how the four observable measures of store
performance (Profit Margin, Store Wallet Share, Trip Frequency and Average Basket Value Per
Trip) will differ across the four cherry picking segments we described earlier.
Profit Margin: We expect profit margins to be greatest for the incidental cherry pickers and
lowest for the inter-temporal cross-store cherry pickers. For the other two segments it will be
intermediate. Whether the focal store-loyal inter-temporal cherry pickers have higher profit
margins than the trip based cross-store cherry picker is an empirical question.
Store Wallet Share: We expect wallet share to be highest for store specific inter-temporal
cherry pickers, who use the cooperating chain’s store as their primary store. We have no specific
hypotheses regarding the ordering of wallet share for other segments.
Trip Frequency: We expect inter-temporal cherry pickers to have the greatest trip frequency.
Therefore store-specific inter-temporal cherry pickers (who use the cooperating chain’s store as
their primary store) and cross-store inter-temporal cherry pickers will have the highest trip
frequency. We have no specific hypothesis about the ordering of incidental cherry pickers or
trip-specific cross-store cherry pickers.
Average Basket Value Per Trip: Since Trip Frequency and Average Basket Value Per Trip
are negatively correlated by construction, inter-temporal cherry pickers will have the lowest
average basket value per trip. Therefore store-specific inter-temporal cherry pickers (who use the
cooperating chain’s store as their primary store) and cross-store inter-temporal cherry pickers
will have the lowest average basket value per trip. We have no specific hypothesis about the
ordering of incidental cherry pickers or trip-specific cross-store cherry pickers. The hypotheses
of Section 2.3 and 2.4 are summarized in Table 1 on the right panel under the title “The Effect of
Cherry Picking Patterns on Price Search Efficiency and Store Performance”.
15
We note that while we have developed specific hypotheses about the relative levels of several
drivers of store profit contribution across the different cherry picking segments, we have not
made any specific hypothesis about the total profits. We expect that either the incidental cherry
pickers (highest margins) or the focal store specific inter-temporal cherry pickers (highest wallet
share) will be the most profitable in terms of aggregate profits. However the specific ordering of
these two segments is an empirical question.
3. Data 3.1 Data Collection Strategy
The data for our study comes from four suburban areas of a mid-size city in the
northeastern U.S. in 2003. Each of the suburban areas is effectively a duopoly market with two
regional competing retail grocery chains accounting for more than 85% of the market share in
these areas. For this study, we were able to get cooperation from the management of one of the
retail chains, who provided us “live” access to customer transactions at its stores on a daily basis.
We label this cooperating chain as “Chain A” and the other competing chain as “Chain B.”
Chain A also provided historical transaction and profit contribution data of its customers for 52
weeks of the year 2002.
Now we outline our data collection strategy. First, we selected a group of four stores of
Chain A paying special attention to the relative geographic distance between those stores and
corresponding nearest stores from Chain B. Specifically, we chose two Chain A stores that had
competing Chain B stores within half a mile and another two Chain A stores that had competing
Chain B stores more than two miles away. This ensured that there was significant variation in
inter-store distances in the data to test our hypotheses.
Given our research purposes, we needed to augment the transactional data obtained from
Chain A in two ways. First, we needed to augment the observed transactional data of consumers
with survey data about their search behavior and other attitudinal measures. Second, we needed
information about prices in Chain B’s stores for the products that were purchased in Chain A in
order to obtain measures of price search efficiency.3
3 While we are able to obtain price information at Chain B by visiting Chain B’s stores, it was not possible to observe the purchases of the consumers at Chain B’s stores. While it would have been ideal to also obtain purchase information also from Chain B, we are able to investigate our research questions without this information. Since our objective was to compare stated price search propensity with observed search propensity, we accepted this tradeoff in data collection.
16
For this, we surveyed a random sample of customers on their visits to the four selected
Chain A stores over three months during September-November 2003. The surveys were
staggered over three months due to constraints on the number of interviewers available to us. For
this reason, we obtained permission from Chain A managers to do in-store interviews in a
staggered manner.
The interviewers met shoppers at random while they were leaving the selected Chain A
stores after their shopping trips and used “filter” questions to determine whether they qualify for
inclusion in the sample for our study. The qualifying criteria were (1) that the intercepted
shopper had to be the primary grocery shopper for his/her household and (2) should have a
“frequent shopper card” from Chain A. The second criterion was used to ensure we have the
necessary identifier information (loyalty card number) to scan the transaction data base of Chain
A for shopping visits by the respondent on a daily basis. If the intercepted shoppers met the
qualifying criteria, the interviewer collected the following information about them: (1) loyalty
card number (2) which store they considered their primary store and (2) relative expenditure
levels at the two competing chains. The interviewers then gave the qualified shoppers a detailed
survey questionnaire, containing relevant behavioral, attitudinal and demographic questions with
a request to return the finished questionnaires in pre-paid return envelopes. If the responses were
not returned within a month, we sent a reminder. We obtained responses from 255 shoppers at a
slightly less than 50% response rate.
After we received the completed mail-in survey questionnaire from a shopper, we used
the identifier information (loyalty card number) to scan the transaction data base of Chain A for
shopping visits by this respondent on a daily basis. Once we detected a shopping trip by this
respondent, we obtained the prices for all the items in the shopping basket of the respondent over
that week and the two following weeks at Chain A from the transaction database of Chain A for
those weeks. For the contemporaneous price data from Chain B, we visited the corresponding
competitive store of Chain B and directly obtained the prices for the products in that household’s
basket for the corresponding weeks. This systematic (and labor-intensive) data collection
approach ensured that we collected complete information on actual prices paid by a consumer as
17
well as the inter-temporal (over three weeks) and cross-store (across the two competing retail
chains) price variations for all the items purchased on any particular shopping trip.4
For each mail-in survey respondent, we performed the same process of obtaining price
information for purchased items in their baskets for multiple trips. For most households we
obtained information for 3 trips. For a few households, we were able to obtain only data on 2
trips within the data collection period. In all we collected data on about 8,500 distinct items over
710 shopping trips for the 255 households who responded to our survey. Considering each item
needed to be tracked over three weeks at Chain B by direct observation, we collected over
25,000 price observations manually during a period of about 6 months in 2003 and 2004.
As discussed earlier, the directly observed price information from both chains on items in
each shopper’s basket helped us develop measures of revealed price search efficiency. The
information from the mail-in surveys allows us to compare households’ revealed price search
efficiency against their self-stated price search propensity and other attitudinal and personal
characteristics measures. This serves to assess the comparability/validity of two alternative
methods (observation versus surveys) to collect information about price search.
Finally, in order to address the question of the impact of price search on chain’s
performance, we obtain information about revenues, profits and trip frequency of the 255 sample
households with respect to Chain A over the 52 weeks of 2002. To perform a profitability
analysis over a comprehensive and wider sample, we also obtained similar data for all bonus card
customers (21,963) from two of the sample stores of Chain A.
3.2 Development of Key Measures
As in the existing survey based studies of grocery shoppers’ price search behavior, we
use self-reported consumer data to construct the various attitudinal and behavioral measures. We
use identical or very similar multi-item scales used in the past studies (e.g., Putrevu and
Ratchford 1997; Urbany et al. 1996) for some of the measures and present a complete list of the
items used in each scale along with the corresponding scale reliability coefficients in the
4 We restricted data collection to baskets of only about 10 households in any given week to make the manual data collection practical. Even with about 10 households added in a given week, we had to collect about 600-700 prices in any given week, because we also needed to collect inter-temporal data for households we began tracking in previous weeks. When we received more than 10 survey responses in a given week, we delayed data collection related to baskets of the excess households until we had a “lean” capacity to perform the data collection.
18
Appendix. As Putrevu and Ratchford (1997) point out in their study, it is very difficult to
develop a multi-item scale for the unit opportunity cost measure exhibiting high scale reliability.
At the same time, using the respondent’s actual wage rate as a measure presents the problem of
imputing a wage rate for those who do not work. Accordingly, for unit opportunity cost of time,
we used a single item measure that asked respondents at what hourly wage rate they would be
willing to undertake an extra hour of work suitable to their skills (Marmorstein, Grewal and
Fishe 1992; Putrevu and Ratchford 1997).
As for measures of consumers’ stated propensity of price search, unlike the existing
studies that use a single overall construct, we use two constructs to distinguish between
consumers’ stated inter-temporal and cross-store price search propensities. Each construct is
based on a five-item scale exhibiting high alpha reliability score (see Appendix for item details).
We use a median-split of consumers’ stated propensity measures along both inter-temporal and
cross-store price search dimensions to classify consumers into high and low types along that
dimension (refer to Figure 1).
4. Empirical Analyses and Results 4.1 Are there potential benefits from price search?
Based on the 710 tracked shopping baskets in our data, Table 2 shows the “information
value” categorized for four different ranges of observed basket values as well as for the average
basket value. As noted in Section 2.2, the information value measures the range of relevant
market price dispersion in terms of the difference between the maximum and minimum purchase
costs of a shopping basket, (BVmax - BVmin), given the prevailing market price dispersion. In other
words, it shows the maximum potential savings or the savings that would be realized if one is
able to buy her shopping basket goods at the “best” (100% price search efficiency) rather than at
the “worst” (0% price search efficiency) possible market prices (Ratchford et al. 2003).
[Table 2 about here]
As expected, our data shows that the average information value or maximum potential
savings from search is greater for larger baskets than with smaller baskets. In fact the
information value is convex in basket size, i.e., the savings from larger baskets are more than
proportionately greater than for smaller baskets. On basket values of greater than $90, cross-
store inter-temporal cherry pickers could potentially save on average a maximum of $45. The
19
average of maximum potential savings drop to about $27 on basket values of $60-$90, to about
$16 on basket values of $30-$60, and to only about $5 on basket values less than $30.
To put in perspective what the above average information values or maximum potential
savings imply for economic incentives to actively engage in price search by grocery shoppers, let
us consider the case of a household which has the typical weekly grocery spending level of $90
(Food Marketing Institute 2004). Based on simple linear extrapolation from our findings
(maximum potential savings of $11.99 on average for basket value of $31.22) in Table 2, a
household with typical weekly grocery spending level of $90 can thus expect a maximum
potential savings of $34 if it engages in cross-store inter-temporal cherry picking strategy.
Arguably, even if the household uses passive or incidental cherry picking strategy (i.e., does not
actively engage in price search), it is still expected to capture part of the maximum potential
savings by chance rather than by design (Ratchford et al. 2003). If we assume such “incidental
capture” to be about half of the maximum potential savings of $34, that still implies that the
household can potentially save as much as an additional $17 per week through active cross-store
inter-temporal cherry picking strategy. 5
Now, whether $17 is enough of an incentive for the household will of course depend on
the household’s expected cost of engaging in cross-store inter-temporal cherry picking strategy.
To get an approximate but realistic insight to that question, following Fox and Hoch (2005), we
assume that the cost of price search for consumers is mainly in the opportunity cost of time for
shopping trips, and therefore ignore the time and mental cost of planning or the direct
transportation costs (e.g., gasoline, vehicle depreciation). As for the expected cost of cross-store
inter-temporal cherry picking strategy, the household has to make trips to both stores in each
week (assuming duopoly competition and the typical weekly price cycles in grocery markets).
InsightExpress.com (2003) estimates (also used by Fox and Hoch) the average time for a grocery
shopping trip to be 47 minutes; this implies about 1.5 hours a week on shopping trips to the two
stores. So for the price search to be economically justifiable, the unit opportunity cost of time
needs to be less than $11.33/hr ($17/1.5). Based on self-reported unit opportunity cost of time for
our sample households, $11.33/hr represents about 35th percentile. Also, we note that the SSS
households who are most likely to do cross-store inter-temporal cherry picking will need less
5 Later, in our empirical analysis, we do get estimates of such “incidental capture” consistent with this assumption.
20
than the average estimate of 47 minutes for a trip, because they are very close to the stores and
the stores are also very close to each other. Further, multiple store visits on a single shopping trip
are not independent; therefore the cost of shopping at both stores is likely to be less than double
the single-store trip time. Hence cross-store inter-temporal cherry picking may be beneficial even
with smaller baskets for SSS households.
In comparing benefits from trip-specific cross-store cherry pickers against store-specific
inter-temporal cherry pickers, we find that store-specific inter-temporal cherry pickers can save
more on average for all range of basket values. For example, the cross-store trip-specific cherry
picker with a basket value greater than $90 saves $28 relative to the store specific inter-temporal
cherry picker who saves $31. Thus the extent of dispersion of prices over time within stores is
greater than the extent of dispersion of prices between stores. So even a store loyal customer who
is willing to keep track of prices (and thus has to expend some time and mental costs) can save as
much as someone who physically shops at multiple stores, but does not shift purchases inter-
temporally. In other words, a store-loyal customer can potentially save as much (through shifts in
purchase timing) as a customer who “store-hops” to get the best price deals on any shopping trip.
Given the roughly equal potential benefit from either store-specific inter-temporal or cross-store
within-trip based price search, we should expect the price-search efficiency of these two
segments to be roughly equal. This finding underscores that a better understanding of grocery
shoppers’ revealed price search behavior should focus not only on cross-store price savings, as
has been the case in the existing literature, but on both cross-store and inter-temporal price
savings.
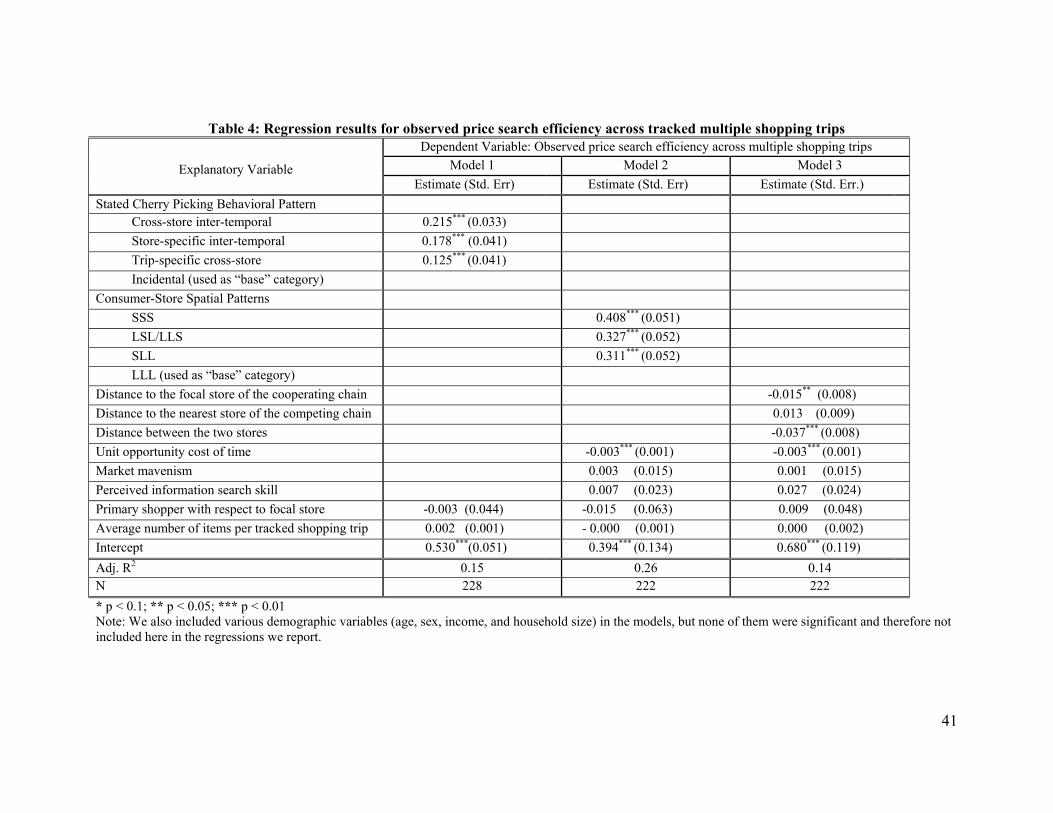
4.2 What variables characterize the different cherry picking segments?
We now test empirically our hypothesis about the determinants of households’ price
search patterns. We use a multinomial logit model for this test, where the dependent variable is
the stated choice of one of the four price search patterns. The explanatory variables are the cost
of search variables: (1) the location configuration of the households and stores and (2) unit
opportunity costs. Besides we use individual specific variables such as perceived information
search skills in shopping for prices, and shopping-related personality traits such as the self-
perception of being a “market maven.”
21
The percentage of households who adopt the four cherry picking patterns are: incidental
greater price search efficiency with respect to incidental cherry pickers; the corresponding
differences with respect to pure (i.e., only within-trip) cross-store cherry pickers and pure (i.e.,
store-loyal) inter-temporal cherry pickers are 9% and 4% respectively.
The above findings also suggest that a significant fraction of the maximum potential
savings can be obtained by conscientious shoppers who shop at one store and shift their
purchases to take advantage of price specials at their loyal store. At the same time, if they engage
in cross-store shopping as well, they can increase their potential savings by an additional 4% of
the average maximum potential savings. How are the observed price search efficiencies across
different cherry picking strategies translate in terms of realized dollar savings? As noted in
Section 4.1, our data shows that a household with the typical weekly grocery spending level of
$90 can expect a maximum potential savings of $34. So, a single percentage increase in its price
search efficiency would imply capture of an average additional savings of about $18/yr
(0.34x52) in its grocery bill for a typical household. In other words, our Model 1 results from
Table 4 indicates that a typical household who takes advantage of both cross-store and inter-
temporal price variations in grocery market is able to realize an additional savings of about
$162/yr ($18x9) and $72/yr ($18x4) compared to households using only cross-store or inter-
24
temporal cherry picking respectively. The additional saving jumps to about $396/yr ($18x22)
when compared to that of those who engage in only passive or incidental cherry picking. It is
interesting to note that even those households who take advantage of both cross-store and inter-
temporal price variations in grocery market still fails to capture on an average about 25% of
maximum potential savings or about $8.50/week at a spending level of $90/week.
In Model 2, rather than using stated price search patterns as explanatory variables, we use
the underlying “drivers” – location, opportunity cost and attitudinal variables that we had
identified earlier (see Table 3) to explain stated price search patterns. The results are consistent.
Interestingly, we find that these underlying location variables have greater explanatory power
than the stated price search patterns themselves. The R2 of the model increases from 0.15 to 0.26
when we include the underlying determinant variables of stated price search pattern, as well as
available and relevant demographic variables (age, sex, income and household size). However,
most of the explanatory power lies with the location and opportunity cost variables, which
together essentially captures the economic drivers of price search efficiency. Of the 0.26 R2, 0.21
comes from the location variables and 0.03 comes from unit opportunity cost of time.
Finally, we test the importance of including location variables in a manner that takes into
account the geographic interaction between household distances from the stores and the inter-
store distances. In Model 3, we therefore just include distance with primary store, secondary
store and inter-store distance instead of the distinct spatial configurations they produce in
combination. We find that expected distance to the focal store and the inter-store distance are
significant. These results are consistent with the regressions reported by Fox and Hoch (2005).
However the R2 for the model drops by nearly 50% from 0.26 to 0.14, suggesting that our theory
based hypotheses about how location configuration affects price search by accounting for the
interaction between household distances between stores and inter-store distances explains price
search behavior better compared to simply including these individual distances in a regression.
In all the three models, we do not find the average trip basket size to be significant. In
retrospect, this is not surprising because we have already shown in Table 2 that as basket values
increase the potential benefits increase; hence even though observed price search efficiency does
not change with basket size, the total savings obtained increases as basket size increases.
7 The coefficient for primary shopper and average number of items are insignificant and do not have any impact on
25
We note that our analysis differs from the analysis of Fox and Hoch (2005), who
demonstrate that households shop across stores more often when they have larger baskets to
purchase. Since we do not have data on whether consumers actually shopped at multiple stores,
we do not test for the endogeneity of trip size. Also, our focus in this research is to measure
objective price search efficiency of a household not in terms of any one trip, but in terms of
purchases over multiple trips. By using data over multiple trips extending over about a month,
we capture the profitability of the households over their steady state monthly purchasing
behavior. This information will enable firms to target cross-store cherry picking households
differentially compared to households that do inter-temporal cherry picking.
4.4. Are Stated Search Patterns Consistent with Observed Behavior?
Overall, our results from Model 1 suggest that stated price search patterns are consistent
with actual price search behavior by consumers, thus validating the use of either survey based
research or observed choice based research to understand household price search behavior.
Another interesting observation is that while in Section 4.2, we find that psychological
variables such as market mavenism help explain the stated cherry picking patterns, this variable
has no significant impact on the observed price search efficiency beyond the location variables
and opportunity costs. This suggests that even with a maven attitude, households may not be able
to take advantage of the price variations in the market and obtain greater efficiency, if their
geographic locations and opportunity cost of time are not favorable. Alternatively, one could
argue that a maven attitude is correlated with favorable geographic locations for cherry picking.
As in this paper, market mavenism has been found to be an important predictor of search
behavior in survey based research (Urbany et al. 1996). Our results suggest that attitudinal
variables such as market mavenism is endogenously related to underlying economic variables
such as location and opportunity cost and once these variables are accounted for, there is limited
need for using these variables in explaining observed price search efficiency.8
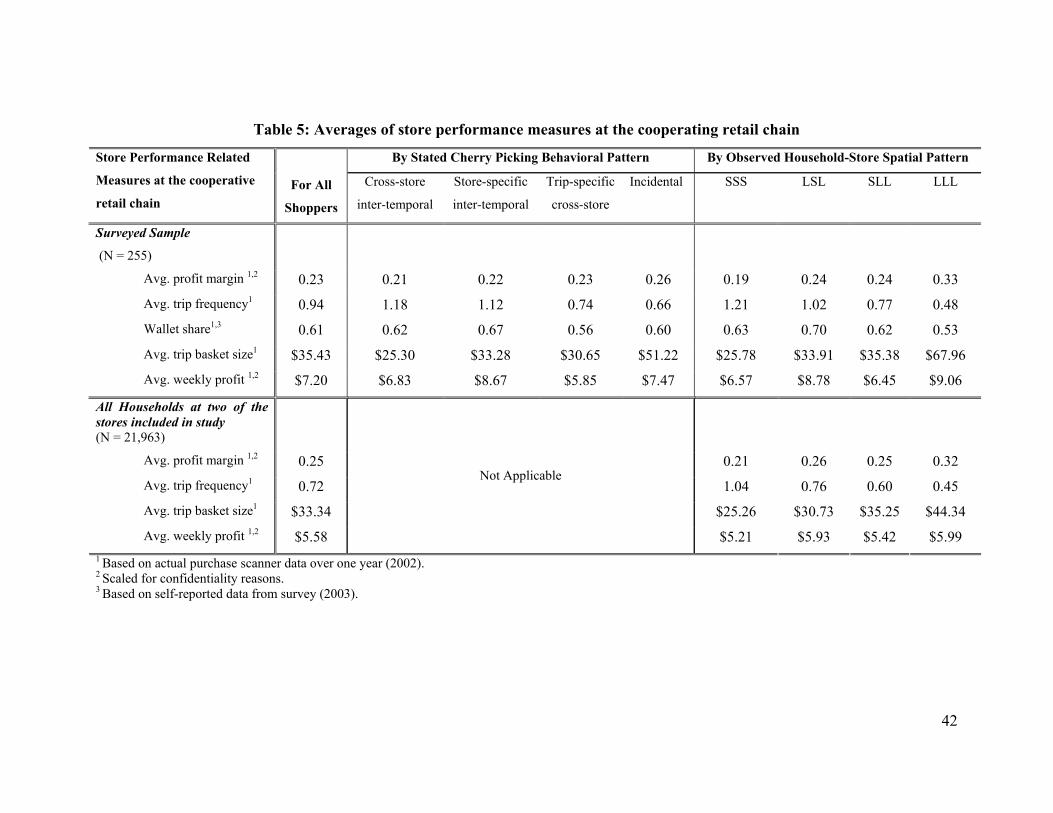
4.5 Impact of Price Search Behavior on Store Performance Measures
We next investigate how price search patterns affect the various drivers of store
performance outlined earlier. We use data on actual shopping trips at Chain A by the 255
the savings percentage reported when they are omitted from the regression. 8 Indeed we find that the average value of market mavenism for the LLL households is significantly lower (p<0.01) compared to households with other spatial configurations.
26
surveyed households over 52 weeks in the year 2002 to compute average profit contributions,
profit margins, trip frequency and trip basket size. By analyzing the data over the whole year, we
are able to provide more accurate and stable measures of these data than over a shorter time
period. For wallet share, we use self-reported values from the survey.
Averages
The top panel of Table 5 reports the averages for the various store performance measures,
broken down by stated cherry picking patterns as well as by observed household-store spatial
patterns. The averages across different cherry picking segments are consistent with our
hypotheses. For instance, the average profit margin is the highest for the incidental cherry
pickers (26%) and the lowest for the cross-store inter-temporal cherry pickers (21%), with a
difference in profit margins of about 20%. Consistent with our estimates of price search
efficiency, we find that consumers who are store loyal but do inter-temporal shopping and
within-trip cross-store shopping provide intermediate profit margins (22%-23%). However as
noted earlier, the store loyal inter-temporal shopper may be more valuable to the store in terms of
aggregate profits. Our results are also somewhat reassuring to retailers in the sense that even the
most intense cherry picking segment brings on average a positive contribution to the bottom line.
The average trip frequency per week at 0.63 to the primary store is the lowest for the
incidental cherry picker as we hypothesized. Also, as hypothesized, the trip frequency is greatest
for those who do inter-temporal cherry picking (1.18 for cross-store inter-temporal cherry
pickers and 1.06 for store-specific inter-temporal cherry pickers). Thus the inter-temporal cherry
pickers visit the store at least once a week, while incidental cherry pickers visit once in about 11
days on average. As for average trip basket size, we do find it to be the highest for incidental
cherry pickers and the lowest for cross-store inter-temporal cherry pickers as hypothesized.
As expected, the wallet share is the highest for focal store-specific inter-temporal cherry
pickers at 67%, while it is the lowest for trip-specific cross-store shoppers who purchase only
56% of their purchases at their self-designated primary store. Thus even though the profit
margins of the store-specific inter-temporal shopper and within-trip cross-store shoppers are
virtually identical, the store-specific inter-temporal shopper is considerably more valuable to the
store. This is reflected in the total profits from the different segments. The average profit from a
store-specific inter-temporal cherry picker is the highest and considerably greater than that of the
trip-specific cross-store cherry pickers. The next highest in terms of profits is the incidental
27
cherry picker, who makes up for lower wallet share with higher profit margins. We find that
these results are consistent with our hypotheses about the effects of cherry picking patterns on
store performance in Table 1.
The averages in Table 5 are also consistent with our expectations for the household-store
spatial patterns. For example, the profit margins are greatest for LLL households and lowest for
SSS households. In contrast, SSS households visit the store most often and LLL households visit
least often. As we expected, the basket sizes in each trip is reversed: LLL households had the
biggest baskets and SSS households had the smallest baskets. Most interestingly, the aggregate
profits per week were greatest for the LLL households and the LSL households. In other words,
the greatest aggregate profits were obtained from households when the two competing stores
were farther apart and cross-store shopping was least likely.
For further validation of our hypotheses, we perform a similar analysis above on a more
comprehensive set of households, who were not surveyed. This included all bonus-card holder
households at 2 stores (one with competitive store very close; the other with competitive store
much further away – they are also 2 of the 4 stores used in our actual sample study) of Chain A
for whom we have their 9 digit zip code data. These 21,963 households account for over 75% of
total sales in 2002 in each of the stores. We also infer whether these households use Chain A as
their primary grocery store.9 We develop the same store performance related measures as for the
in-sample households (except the self-reported wallet share measures). The averages for this
sample are reported in the bottom panel of Table 5.
[Table 5 about here]
The results from the comprehensive set of households are virtually identical to the in-
sample results in terms of relative magnitudes of average profit margins, trip frequency and
basket size for the different segments. For the weekly profit, the relative magnitudes are the
same, but the magnitudes are considerably smaller in the more comprehensive groups of
households, especially for the LSL and the LLL households. This suggests that that our sample
systematically over-sampled households who spent more at Chain A. Nevertheless, given that
9 Chain A is classified as primary (secondary) store for a household if the actual annual grocery spending of that household at Chain A in 2002 is at least 70% (less than 30%) of the average annual grocery spending for households residing in the same US “Census Block Group” (CBG) as the given household. The CBG level grocery spending data is available to Chain A from syndicated data services. The classification results using this criteria for our sample 255 households has a correlation of 0.87 with those based on consumers’ self-reports in our survey.
28
profit margins are virtually identical, we do not believe this causes any bias in the price search
efficiency regressions that we reported earlier.
While Table 5 reported the averages of the different segments, it is important to check
whether the relative differences in averages across segments in Table 5 are statistically
significant and consistent with our hypotheses. For this, we perform regressions with different
store performance measures as dependent variables and the stated cherry picking patterns/spatial
pattern as explanatory variables. We also included a few additional control variables. The results
for the surveyed sample of 255 households are shown in Tables 6a-b.10 As reflected in our
analysis of means, the regression results show the relative differences are consistent with our
hypotheses, but they are also statistically significant as well. Given that the results in Tables 6a-b
are based on only 255 surveyed households, the results from the comprehensive sample have
much greater statistical significance because of the larger number of households.
[Tables 6a-b about here]
Extreme cherry-picking: Do certain households provide negative net margins?
There has been speculation in the academic as well as trade press (e.g. Dreze 1999;
Mogelonsky 1994) that increased cherry picking behavior by grocery shoppers can have
significant negative consequences for retail performance. While, our results above show that
each of the cherry picking segments is profitable on average, we recognize that certain
households may indulge in “extreme” cherry picking and patronize a store to only buy deeply
discounted items and go to other (primary) store/s to do the rest of their weekly grocery
shopping. If these households are large enough, the use of loss leader pricing to increase store
traffic may be highly unprofitable to the store (Dreze 1999, Levy and Weitz 2004).
We now explore whether there are any “extreme” cherry picking households who take
advantage of only loss-leader products and cause negative net margins for the retailer. For this,
we analyze the price and profit contribution data covering all transactions over an entire year
(2002) for the 21,963 out-of sample households who buy from Chain A. We find that only 1.2%
10 The results for the more comprehensive sample are similar and available from the authors.
29
of the 21,963 households (i.e., 255 households) contribute a net negative profit to the store over
the one year period. They are all secondary shoppers with respect to the Chain A11.
What are the characteristics of these extreme cherry pickers? Their average trip basket
size is only $13.60 (vs. $33.34 for all households). Also a trip level analysis of these extreme
cherry pickers indicate that about 27% (70) of these 255 households of them engaged in at least
one almost exclusive “loss leader trip” during the year under study. We characterized a “loss
leader trip” as a shopping trip where at least 90% of all the items purchased by the customer on
that trip are loss-leader items and there are at least four such items in the basket. Finally, the
spatial pattern distribution for these 255 households is consistent with our expectations. Most of
the extreme cherry picking households belonged to the SSS location pattern (44%). This was
followed by the SLL with 38% and LSL with 18%.
We now evaluate how this extreme group of cherry pickers (who are all secondary
shoppers) affects the chain’s overall profits. The net loss from these households are about 0.2%
of the total aggregate positive profit to Chain A from the rest of their customers, about 0.8% of
profits from customers belonging to the SSS location pattern (the ones most likely to do cross-
store inter-temporal shopping) and about 1.2% of profits from the all secondary shoppers. We
therefore conclude that this group of extreme cherry pickers has little impact on the overall
profitability of the store.
4.5 Robustness Checks
In this section, we perform two additional analyses to check the robustness of our
findings.
Cherry Picking across Brands
In this study we focus on two dimensions of cherry picking- cross-store (the “where”
dimension) and inter-temporal (the “when” dimension). A third dimension in which consumers
can choose to get lower prices for their groceries is through brand-switching (the “what”
dimension). In other words, in our study, we focus on how efficient a consumer is in taking
advantage of inter-temporal and cross-sectional price variations for her purchased product item
11 We found that only 1.7% of in-sample households (i.e., 4 out of 255) contributed a net negative margin during 2002. All of these households were also secondary shoppers with respect to Chain A.
30
(e.g., 24 oz Coke bottle). But we do not consider the potential price savings that the consumer
might have gained by, say, making a brand-switch from Pepsi to Coke on that purchase occasion.
Accounting for this third dimension could mean that the information value and the
opportunity for savings in the market could be greater. However, there is considerable
heterogeneity among consumers about their brand preferences and their consideration sets within
a category. While a fall in price of Pepsi may not reflect an opportunity for a Coke-loyal
consumer who will never switch, it may reflect a big opportunity for households that are willing
to switch to Coke. Thus our current measure of information value would be accurate for
households loyal to a brand, but downward biased for switchers. On average, therefore
consumers may appear to be less efficient than they are.
Incorporating the “brand switching” dimension of price search in computing consumers’
empirically observed price search efficiencies will be extremely difficult as it will require
extensive purchase histories of consumer or subjective judgments by researchers to identify
household level “substitute brands and consideration sets” in each product category. Since our
study covered all possible product categories as long as they were purchased in the tracked
shopping trips of the sample households, it would have been practically impossible to get the
consideration set information for all households across all product categories (especially for light
users in a category or in categories with infrequent purchases).
Nevertheless, we seek to check whether our main findings are robust to the non-inclusion
of the brand-switching dimension. We therefore perform separate analysis by computing price
search efficiencies of branded and non-branded product categories. The non-branded categories
consisted of fresh meat, seafood, fruits, vegetables and baked goods. The idea is that the brand
switching dimension is likely to be irrelevant for non-branded product categories and thus we
can compare the differences in results. We expect that price search efficiency will on average be
greater in non-branded product categories, because we do not have a downward bias due to the
omission of brand switching in these estimates. But we expect the general ordering of the price
search efficiency of the different segments to be identical.
The results of the regression with price search efficiency for branded and non-branded
categories as the dependent variables are reported in Table 7. (The comparable results with all
categories pooled are in Table 4). As expected, the estimated price search efficiency is higher for
non-branded product categories, compared to branded product categories. However, the ordering
31
of the segments based on stated cherry picking patterns and spatial locations are identical across
the two categories. Hence we believe our primary findings about the relative differences in price
search efficiency are robust to whether the consumers have the opportunity to engage in brand-
switching based cherry picking behavior or not.
[Table 7 about here]
Retrospective Cherry Picking
Our measure of price search efficiency along the intertemporal dimension is based on
“prospective” inter-temporal time windows (i.e., purchase week + next 2 weeks). A possibly
better alternative would have been to use both “prospective” and “retrospective” (i.e., purchase
week +/- 2 weeks) time windows. Given our data collection procedure, it was impossible to
know the prices for the products purchased by the household at the competing retail chain in
weeks before our survey began and thus analysis based on a retrospective time window was not
feasible. Conceptually, we do not believe this should have any systematic effects on our results
because consumer inventory for the product during the survey week will be randomly distributed
across both consumers and purchased categories.
We verify this belief by restricting our analysis of price search efficiency only along the
inter-temporal dimension within Chain A, where we have data for earlier weeks before our
survey. We find that the average store-specific (Chain A) inter-temporal efficiency for sample
households using the 3-weeks and 5 week time window is virtually identical (0.728 vs, 0.726).
The correlation between the two measures is 0.99. We therefore conclude that the use of
prospective time windows for our analysis has no impact on our conclusions.
5. Conclusion Due to the use of promotional pricing, there is considerable price variation both over time
and across chains in most grocery markets. Our goal in this to paper was to gain insights into
how consumers take advantage of price variations in grocery markets. We now outline the key
contributions and empirical findings of the paper.
Contributions:
(1) While past research on price search focused on how consumers take advantage of price variations
across stores, we find that both “when” and “where” dimensions of price search/cherry picking are
32
important. In fact, we demonstrate that consumers can be even more efficient by taking advantage of
price variation over time within a store. Using the “when” and “where” dimensions of cherry picking,
we propose that households can belong to one of four cherry picking segments: (1) the incidental
segment (2) the store-specific inter-temporal segment (3) the within-trip cross-store segment and (4)
the cross-store inter-temporal segment.
(2) We develop a measure of revealed “price search efficiency” across stores and over time that
objectively summarizes the ability of households to take advantage of price variations in the market.
(3) We link the choice of price search patterns to the observed store locations and household locations. In
contrast to previous research which views distance between stores and distance between store and
household as independent, our approach considers how these two distances interact to make each of
the cherry picking patterns optimal for a household. This enables us to better predict cherry picking
patterns a household. Many store choice models treat locations as unobserved heterogeneity. Our
research suggests that including this information can serve to considerably enhance the predictive
power of extant store choice models. Unit opportunity cost is another variable that has considerable
predictive power in the consumer’s choice of search patterns. Locations and opportunity cost are
typically important variables in the development of theoretical models (e.g., Hotelling models), but
there has been little empirical support for these models in the context of grocery retailing.
(4) We link price search patterns to various measures related to store performance for the first time in the
literature. Since studies using household level databases do not typically have access to the retailer’s
wholesale prices, there has been no investigation of the profitability of households on the basis of
their price search behavior. While understanding the determinants of search patterns are of conceptual
and theoretical interest, the link to profits and other measures of store performance has greater
managerial implications.
(5) We demonstrate that stated price search patterns are consistent with the observed price search
behavior as quantified by our measure of price search efficiency. This is particularly important from a
research perspective, because the literature on price search thus far have used either stated price
search or objective behavioral data, without verifying if the results from the two sets of studies lead to
consistent results. We developed an innovative, but labor intensive data collection methodology to
demonstrate this consistency for the first time in the literature. Given the difficulty in obtaining both
objective and survey data for each household, we believe our results are of value to researchers
because it shows that either type of data leads to consistent insights about consumer price search
behavior in grocery markets.
33
Empirical Findings
(1) A household that does not consciously cherry pick (“incidental cherry picker”) obtains about 53% of
the maximum potential price savings in the market. A household that sticks to one store, but shifts
timing of purchases (“store-specific inter-temporal cherry picker”) saves about 71% of the potential
savings in the market. In contrast, the households that cannot shift purchases inter-temporally, but
attempts to take advantage of only contemporary price variations across store (“trip-specific cross-
store cherry picker”) saves only about 66% of potential savings. Finally consumers who take
advantage of both cross-store and cross-time variations (the cross-store inter-temporal cherry picker”)
saves about 75% of potential savings. Given that cross-store cherry picking is costlier, this suggests
that a consumer can get most of the potential gains at fairly low cost by shifting purchases over time,
while still being loyal to one’s preferred store.
(2) At the average weekly grocery spending level of $90, a household taking advantage of both cross-
store and inter-temporal price variations in grocery market stands to realize an additional savings of
about $160/yr and $70/yr compared to households using only cross-store or inter-temporal cherry
picking respectively. The additional saving jumps to about $396/yr when compared to that of those
who engage in only passive or incidental cherry picking.
(3) We find that the relative locations of households and stores can explain a significant proportion of the
variation in observed price search efficiency (21%). Interestingly, we find that while locations explain
both stated price search patterns and observed price search efficiency, survey measures such as
“perceived shopping information search skill” and “market mavenism” only have significant impact
on the stated price search patterns and not on the observed price search efficiency. This however does
not mean that survey based measures do not adequately capture observed behavior. What we found is
that households with high “perceived shopping information search skill” and “market mavenism” do
more cross-store shopping rather than inter-temporal shopping and therefore while they have little
impact on price search efficiency, they still are useful in understanding the actual shopping behavior
of consumers.
(4) Incidental cherry pickers and the store specific inter-temporal cherry pickers are the most profitable,
though for different reasons. Incidental cherry pickers provide the greatest margins, but somewhat
lower wallet share while store-specific inter-temporal cherry pickers have the greatest wallet share,
but somewhat lower margins. Even though cross-store inter-temporal cherry pickers have the largest
numbers of per-week trips, they have the lowest margins and the lowest weekly profits. Clearly this is
the most unattractive segment, in that they have an impact on store fixed cost (through their large
numbers of trips), but contribute the least to the bottom line. Nevertheless, cross-store inter-temporal
cherry pickers still contribute positive margins on average.
34
(5) Only about 1.2% of households are so efficient as to provide negative margins to the store. They are
all secondary shoppers. However, their net effect on store profits are relatively small, i.e., losses from
these households only amounts to 0.2% of all the profits made from all the other customers, about
0.8% of profits from customers belonging to the SSS spatial pattern (most likely to cross-store inter-
temporal cherry picking) and about 1.2% of profits from all secondary shoppers.
Limitations and Suggestions for Future Research
There are certain limitations in this study that suggest interesting possibilities for future
research. First, our study focused on four sets of competitive stores within one suburban market.
Clearly, it would make sense to investigate markets with different characteristics and see how
these affect price search efficiency. Second, we have focused on price search efficiency across
the entire basket of purchases made by households. While this does make sense as a first step, a
deeper investigation of how price search efficiency varies across categories (e.g., stockpilable
versus non-stockpilable; regularly versus irregularly purchased categories; impulse versus
planned purchases etc.) could provide additional insights to marketing managers. Examples of
studies on category characteristics are (Narasimhan, Neslin and Sen 1996, Bell et al, 1999). Also
it would make sense to study how price search efficiency is affected by the use of marketing mix
variables such as features and displays. One may expect features to affect cross-store efficiency
more, while displays may affect inter-temporal efficiency more. Overall, there is an opportunity
to understand how price search efficiencies vary as a function of (1) market characteristics, (2)
category characteristics and (3) marketing mix variables.
There has been a long research tradition in marketing that focuses on inferring consumer
preferences and sensitivity to prices and other marketing mix variables using consumer’s
observed choice behavior. Much of these analyses are at the single category level. There has
been a recent trend in studying choices across categories (e.g., Manchanda, Ansari and Gupta
1999, Chib, Seetharaman and Strijnev 2002).
In terms of store choice, a few papers model consumer store choice using data from a
single category (e.g., Bucklin and Lattin 1992). Venkataraman and Kadiyali (2004) investigate
store choice in a single category also taking into account the role of product assortments.
Recently, there has been interest in modeling store choice at the basket level on the grounds that
the consumer’s goal is to minimize the total costs of shopping for their entire basket. Bell and
35
Lattin (1998) model consumer choice between EDLP and High Low Store formats at the basket
level. This analysis accounts for cross-sectional cherry picking across stores, but does not model
inter-temporal cherry picking. A model incorporating inter-temporal cherry picking needs to
extend the current literature on dynamic structural models of consumer choice (e.g., Sun, Neslin
and Srinivasan 2003) both in terms of estimation methodology and modeling.
We believe that the insights gained from our descriptive analysis of cherry picking
patterns across stores at the basket level should be insightful in developing a structural model of
store competition that accounts for the fact that consumers choose stores on the basis of their
baskets of purchases and can choose from either inter-temporal or cross-store cherry picking
patterns. Further, with the increasing variety of retail formats available (e.g., mass
merchandisers, supermarkets, wholesale clubs) for grocery purchases, there has been an interest
in how consumers choose across retail formats depending on their locations and needs (e.g., Fox,
Montgomery and Lodish 2004). We hope our paper serves as an impetus for launching such an
interesting stream of research.
36
References
Ailawadi, K. L. and B. Harlam (2004), “An Empirical Analysis of the Determinants of Retail Margins:
The Role of Store Brand Share,” Journal of Marketing, Vol. 68 (1), 147-165.
Beatty, S. E. and S. M. Smith (1987), “External Search Effort: An Investigation across Several Product
Catregories,” Journal of Consumer Research, Vol. 14(June), 83-95.
Baye, M. R., J. Morgan and P. Scholten (2003), “The Value of Information in an Online Consumer
Electronics Market,” Journal of Public Policy & Marketing, Vol. 22(1), 17-.
Bell, D. R., G. Iyer and V. Padmanabhan (2002), “Price Competition under Stockpiling and Flexible
Consumption,” Journal of Marketing Research, Vol. 39 (3), 292-303.
Bell, D. R. and J. M. Lattin (1998), “Shopping Behavior and Consumer Preference for Store Price
Distance to the focal store of the cooperating chain -0.015** (0.008) Distance to the nearest store of the competing chain 0.013 (0.009) Distance between the two stores -0.037*** (0.008) Unit opportunity cost of time -0.003*** (0.001) -0.003*** (0.001) Market mavenism 0.003 (0.015) 0.001 (0.015) Perceived information search skill 0.007 (0.023) 0.027 (0.024) Primary shopper with respect to focal store -0.003 (0.044) -0.015 (0.063) 0.009 (0.048) Average number of items per tracked shopping trip 0.002 (0.001) - 0.000 (0.001) 0.000 (0.002) Intercept 0.530***(0.051) 0.394*** (0.134) 0.680*** (0.119) Adj. R2 0.15 0.26 0.14 N 228 222 222 * p < 0.1; ** p < 0.05; *** p < 0.01 Note: We also included various demographic variables (age, sex, income, and household size) in the models, but none of them were significant and therefore not included here in the regressions we report.
42
Table 5: Averages of store performance measures at the cooperating retail chain
By Stated Cherry Picking Behavioral Pattern By Observed Household-Store Spatial Pattern Store Performance Related
$5.21 $5.93 $5.42 $5.99 1 Based on actual purchase scanner data over one year (2002). 2 Scaled for confidentiality reasons. 3 Based on self-reported data from survey (2003).
43
Table 6a: Regression results for store performance related measures with respect to sample households at the cooperating chain
Dependent Variable: Store Performance Related Measures at the cooperating chain
Table 7: Robustness check with respect to branded versus non-branded items based observed price search efficiency across tracked multiple shopping trips
Dependent Variable: Observed price search efficiency across multiple shopping trips
• I usually plan the timing of my shopping trip to a particular grocery store in such a way so as to get the best price deals offered at that store.
• There are times when I delay my shopping trip to wait for a better price deal. • Although planned before making a shopping trip, I often do not buy some items if I think they
will be on better deal shortly. • I keep track of price specials offered for the grocery products at the stores I regularly buy from. • To get the best price deals for my groceries I often buy the items I need over 2 or 3 trips.
• I often compare the prices of two or more grocery stores. • I decide each week where to shop for my groceries based upon store ads/fliers. • I regularly shop the price specials at one store and then the price specials at another store. • Before going grocery shopping I check the newspaper for advertisements by various
supermarkets. • To get the best price deals for my groceries I often shop at 2 or 3 different stores.
• I like it when people ask me for information about products, places to shop, or sales. • I like it when someone asks me where to get the best buy on several types of products. • I know a lot of different products, stores, and sales and I like sharing this information. • I think of myself as a good source of information for other people when it comes to new products
or sales.
4. Perceived Shopping Information Search Efficiency and Ability (8 items; Cronbach’s alpha=0.71)
• I know what products I am going to buy before going to the supermarket • I am a well organized grocery shopper • Before going to the supermarket, I plan my purchases based on the specials available that week • I can easily tell if a sale/special price is a good deal • It is very difficult to compare the prices of grocery stores (reverse coded) • It is very difficult to compare the quality of meat and produce between grocery stores (reverse
coded) • I prepare a shopping list before going grocery shopping • I pre-sort my coupons before going grocery shopping