21
Public Policy Paper: The William C. Velásquez Institute Vol.1 No.1 July 1999 The State of Latinos in California

Public Policy Paper:
The William C. Velásquez InstituteVol.1 No.1 July 1999
The State of Latinosin California

The State of Latinosin California
A Publication of theWilliam C. Velásquez Institute
Made possible through the generous support of the
Carnegie Corporation of New York and
The Rockefeller Foundation
Any views presented herein are those of the authors and not necessarily of WCVI. Neither WCVI nor the workcontained herein is intended in any way to reflect any endorsement for, or opposition to, any candidate or politicalparty.
All rights reserved. Printed in the United States of America. No part of this publication may be reproduced ortransmitted in any form or by any means, electronic or mechanical, including photocopy, recording or anyinformation storage and retrieval system, without expressed, written consent from the William C. VelàsquezInstitute.
Copyright © 1999William C. Velásquez InstituteAll rights reservedPrinted in the United States of America
The William C. Velásquez Institute
Editor
Eddie JaureguiAviva ArgoteRodolfo DiazFrancisco V. Chavez
Angela Acosta
Compiled by:Barbara Sandoval Candelyn CandelariaAngela AcostaRichard Fajardo

TABLE OF CONTENTS
INTRODUCTION . . . . . . . . . . . . . . . . . . . . . . . . . . . . . . . 3
EDUCATION . . . . . . . . . . . . . . . . . . . . . . . . . . . . . . . 4
EMPLOYMENT . . . . . . . . . . . . . . . . . . . . . . . . . . . . . . . 7
ENTREPRENEURSHIP . . . . . . . . . . . . . . . . . . . . . . . . . . . . . . . 10
HEALTH . . . . . . . . . . . . . . . . . . . . . . . . . . . . . . . 13
HOUSING . . . . . . . . . . . . . . . . . . . . . . . . . . . . . . . 19
_______________________William C. Velásquez Institute

INTRODUCTION
The State of Latinos in California was compiled by the William C. Velásquez Institute(WCVI), in conjunction with issue experts from the Community Health Foundation, Fannie Mae,UCLA Extension Program, Torres & Torres Consulting and the Office of Supervisor GloriaMolina. Its purpose is to provide an objective measure of the socioeconomic wellbeing of Latinosin the state. This data and information is crucial at a time when Latinos are making great gainsin the political arena. More than ever before Latino elected and community leaders have thecapacity to exercise political muscle in a way that can positively impact the daily lives of theircommunity.
Despite this increasing political clout in a context of a robust economy, Latino communitiescontinue to be characterized by stubbornly high rates of poverty and corollary problems. WCVI iscommitted to providing a forum for informed dialogue and debate on a host of social, political, andeconomic issues that affect Latinos in California. Our growing political influence in thisimportant state positions us to address long unresolved issues and needs. It is in this spirit thatwe present you this report.
The State of Latinos in California covers the areas of: Education, Employment,Entrepreneurship, Health Care, and Housing. It provides a compendium of baseline data onLatino homeownership, drop-out rates, health insurance non-coverage, workforce participation,unemployment, per capita income, and business formation. It is also a useful tool to rate currentand future legislation and the performance of elected officials.
WCVI is a non-profit, non-partisan organization founded in 1985. The purpose of WCVI is toconduct research aimed at improving the level of political and economic participation in Latinoand other underrepresented communities. WCVI holds a unique position among national Latinoorganizations. In its tradition of working with grassroots organizations, academic institutionsand local elected officials, WCVI fills the gap between intellectual think tanks and communitygroups.
_______________________William C. Velásquez Institute 3

_______________________William C. Velásquez Institute
EDUCATION
Major Findings:
CALIFORNIAAccording to the California Department of Education, Latinos now comprise the majority (41%) ofpublic school children (grades K-12) in the state. However, Latino students are not graduating inproportion to their enrollment numbers or in comparable rates to white students. Only 54.3% ofthe total number of enrolled Latinos graduate statewide, while more than 73.8% of enrolled Anglostudents graduate from high school.
California K-12 Enrollment - 1998-1999
Enrollment Percentage
Hispanic 2,412,059 41.3%
White 2,210,940 37.8%
Total 5,844,111
California K-12 Graduates - 1998-99
Graduates Percentage
Hispanic 87,742 31.0%
White 128,405 45.4%
Total 282,897Source: California Department of Education, 1998-99.
The consequences of these graduation rates at the level of higher education are readily apparent-the majority population of the state will not be eligible for public higher education. Not only doLatinos graduate at a lower rate than do Anglo students, but the percentage of Latino studentsthat meet college entrance requirements is substantially lower. Statewide, 39% of Anglograduates meet UC and CSU entrance requirements in 1996-97, while only 22.8% of Latinograduates met those same requirements. (CBEDS, California Department of Education)
· Latinos Represent 41% K-12 in California· Graduation rate for Latinos 54%· Graduation rate for Anglos 74%· 22% Latino students are UC or CSU eligible vs. 39% for
White students· Latino SAT scores fall in the 25th percentile
4

_______________________William C. Velásquez Institute
Among the many issues affecting UC and CSU eligibility are the standardized tests. After thepassage of Proposition 209, competitive performance on such standardized tests became evenmore critical. Although originally the tests were intended to create an environment of meritocracyby eliminating the effect of background, it's clear that background plays a significant role inpreparation for the test itself. The results may be affected by the proliferation of privateenterprise test preparation courses at a cost of eight hundred to thousands of dollars. These costshave implications for students who must rely exclusively on public resources to prepare for collegeeligibility. (Tony Schwartz, "The Test Under Stress," New York Times, 10 January 1999, sec. 6,p. 30.) In response to these conditions, the California State Legislature has sought to mitigate thesituation by voting some $10 million for SAT test preparation for economically disadvantagedstudents. (Tony Schwartz, "The Test Under Stress," New York Times, 10 January 1999, sec. 6, p.30)
Graduation Rates - 1996-97
SAT 1 Scores in California, 1998
5
State Wide Enrollment Percentage
Hispanic 82,015 54.3%
White 124,495 73.8%
LA County Eligible Percentage
Hispanic 18,739 22.8%
White 49,692 39.0%Source: California Basic Educational Data System (CBEDS)Educational Demographics Unit of the California Department of Education
*SAT I Test Takers Who Described Themselves as: Verbal Math
*Mexican or Mexican American 442 452
*Latin American, South American, Central American 450 456or Other Hispanic, Latino
White 532 540
SAT 1 National Scores, 1998
Mean 75th Percentile 50th Percentile 25th Percentile
Verbal 505 580 500 430
Math 500 590 510 430
Source: 1998 College-Bound Seniors: A Profile of SAP Program Test Takers, California Report, The College Bourd, 1998.
Source: 1999 College-Bound Seniors: A Profile of SAP Program Test Takers, California Report, The CollegeBourd, 1998.

_______________________William C. Velásquez Institute
On average, Latinos score well below the median marks for both verbal and math scores. In bothcategories, they score closer to the nationwide 25th percentile than the 50th percentile. (1998College-Bound Seniors: A Profile of SAT Program Test Takers, California Report, The CollegeBoard, 1998)
Both CSU and UC are now considering guidelines that will rely less heavily on SAT scores.Earlier this year, UC eligibility requirements were changed to consider eligible the top 4% ofjuniors from all California high schools upon their graduation. This decision increased theeligibility pool by some 3600 students. (San Francisco Chronicle, 20 March 1999, pg. A22, final)
The controversy surrounding the recent Stanford 9 test scores in California point up thedifficulties in comparing data on Latinos with other populations while underscoring the need formore accurate measures even of test results. The situation of Latinos in education is generallydifficult to measure. Language issues as well as issues of self-identification and noncomparablecategorization by various data sources may affect interpretation.
Information and data compiled by Candelyn Candelaria, UCLA Extension and Aviva Argote, Office of Los Angeles County SupervisorGloria Molina
6

_______________________William C. Velásquez Institute
EMPLOYMENT
Major Findings:
NATIONALLYThe nation is currently enjoying a booming economy with the lowest unemployment rates and thehighest labor force participation rates in the 1990's. However, the benefits of this robust economyhave not reached all communities equitably. Although Latinos participate in the labor force inhigh rates, their poverty rates are disproportionately high. In other words, Latinos are workingbut still remain poor. This is reflected in the charts below.
Despite gains in per capita income and median household income in recent years, Latinos stillrank far below whites and slightly below African-Americans in almost all categories measuringfinancial success, according to the U.S. Census Bureau. The most recent data available from theCensus indicate that the median household income for Latinos in 1997-$26,628- is roughly$14,000 less than the white median household income. The median household income for Latinofamilies increased by 4.5% from 1996 to 1997 (an increase of $1,151).
The per capita income of Latinos is slightly over half the national average. The gap betweenLatino per capita income and that of the nation remains substantial, in fact it is larger now thanit was in 1985. This situation further burdens larger Latino families and limits spending to basicneeds, making it more difficult to purchase a home, invest in personal savings, and pay for highereducation for their children.
NATIONALLY:· 1997 Latino per capita income was $10,773 vs. $21,905 for Whites (less than half) · Latino poverty rates are more than twice as high as the national rateCALIFORNIA:· California unemployment is 5.9%, Latino unemployment is 8.5%· California Latino Household median income is $29,400 vs. $58,500 for Whites
Civilian Labor Force Participation Rate 1990 1995 1996* 1997
U.S. Total 62.8% 62.9% 63.2% 63.8%
U.S. Latino Total 61.9% 59.7% 60.6% 62.6%
U.S. Unemployment 5.6% 5.6% 5.4% 4.9%
U.S. Latino Unemployment 8.2% 9.3% 8.8% 7.7%
U.S. Bureau of Labor Statistics, Bulletin 2307; & Employment and Earnings, monthly, January issues. *Bureau of Labor
Statistics, Current Population Survey, February, 1998
7

_______________________William C. Velásquez Institute
Per Capita Income by Race and Hispanic Origin 1985-1995
Per Capita 1985 1985 Latino 1990 1995 1995 Latino 1997 1998 1998 LatinoIncome Gap Gap Gap
U.S. Total $11,013 $14,387 $17,227 $19,541 $20,120
40% 46% 43%
Latino $6,613 $8,424 $9,300 $10,941 $11,434
Source: U.S. Bureau of the Census, Current Population Reports, P60-193; P60-206 Issued September 1999
The number of Latinos living in poverty in 1998 was 8.0 million, or 22.7%. The number of poorHispanic families is higher than for any other racial or ethnic group. Statistically, Hispanics arepoorer as a group than whites (8.4% for whites vs. 24.7% for Hispanics) and blacks (23.6% vs.24.7%).
US Per Capita Income 1989 1997 1998
Latinos $10,605 $10,773 $11,434White $19,088 $21,905 $21,394
Black $11,231 $12,311 $12,957
Source: U.S. Bureau of the Census, Current Population Reports, P60-193; P60-206 Issued September 1999
Families below Poverty Level
1990 1995 1996 1997 1998 1995 Number *1996 Number 1997 Number 1998 Numberof Persons of Persons of Persons of Persons
U.S. Total 10.7% 10.8% 11.0% 10.3% 10.0%
Hispanic Origin 25% 27% 26.4% 24.7% 22.7% 7,370,000 7,468,000 8,300,000 8,070,000
Source: U.S. Bureau of the Census, Current Population Reports, P60-194 * February 1998, Current Population Survey, P60-198.
8

_______________________William C. Velásquez Institute
As in the case nationwide, Latinos in California participate in the labor force in high rates, butthe poverty rates they experience are disproportionately high.
The chart below outlines where Latinos are represented within the various professions. Latinosare overrepresented in the unskilled worker, clerical, sales and non-domestic service workercategories. These professions tend to pay minimum or just above minimum wage.
California Employment by Race/Ethnicity and Occupation, 1990
9
CALIFORNIAIn the state of California, the rate of Latinos participating in the Labor Force and the Latinounemployment rate are represented in the following tables.
California Labor Force Participation May 1999
California Labor Force Participation 65.8
California Latino Labor Force Participation 66.7
California Unemployment Rates 1990 1995 1996* 1998
California Unemployment* 5.6% 7.8% 7.2% 5.9%
California Latino Unemployment* 8.1% 10.7% 10.5% 8.5%
Source: California Employment Development Department, Department of Bureau & Labor Statistics*Fig. 7B Unemployment rates for Labor Force Groups in CA by Race & Ethinicity, Not seasonallyadjusted
California Persons below Poverty 1990 1997
State Total 13.9% 16.9%
Latino Total - 27.5%
White Total - 9.9%
Source: California Department of Finance, Current Population Survey, March 1998
Occupation Latino % White % Black Asian Total
Professional, Technical 225 6% 1,802 20% 158 250 2,435Manager, Administrator 229 6% 1,626 18% 90 171 2,116Clerical, Sales 734 21% 2,856 31% 260 403 4,253Skilled Worker 458 13% 943 10% 115 95 1,611Unskilled Worker 968 27% 830 9% 132 118 2,048Non-domestic Service Worker 595 17% 922 10% 145 146 1,808Farmer, Farm Manager 11 - 37 - - 2 50Farm Laborer 267 8% 110 1% 3 5 385Domestic Service Worker 68 2% 42 0% - 17 127
Total 3,555 9,168 903 1,207 14,833
Source: Latino Issues Forum, Latinos and a Sustainable California: Building a Foundation for the Future, Jan. 1997. Gey, F.C., Oliver, J.e.,Highton, B., Tu, D. and Wolfinger, R.E., 1992. “California Latina/Latino Demographic Data Book.
_______________________William C. Velásquez Institute
ENTREPRENEURSHIP
Major Findings:
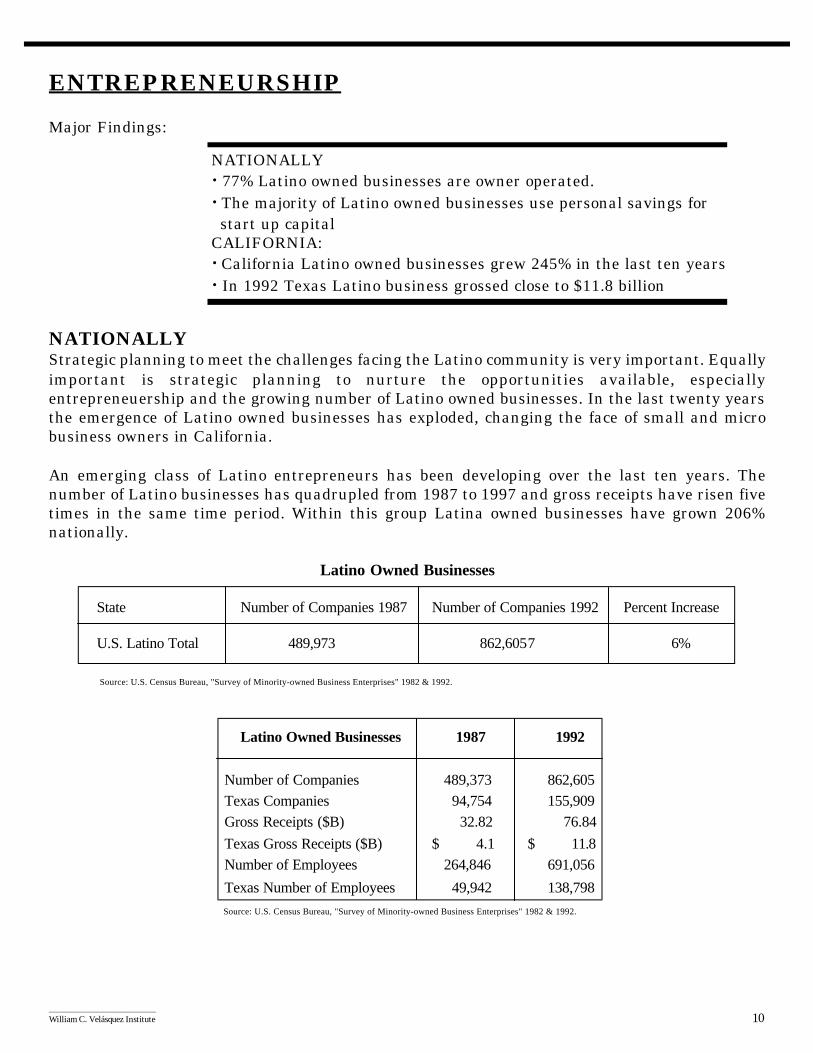
NATIONALLYStrategic planning to meet the challenges facing the Latino community is very important. Equallyimportant is strategic planning to nurture the opportunities available, especiallyentrepreneuership and the growing number of Latino owned businesses. In the last twenty yearsthe emergence of Latino owned businesses has exploded, changing the face of small and microbusiness owners in California.
An emerging class of Latino entrepreneurs has been developing over the last ten years. Thenumber of Latino businesses has quadrupled from 1987 to 1997 and gross receipts have risen fivetimes in the same time period. Within this group Latina owned businesses have grown 206%nationally.
Latino Owned Businesses
State Number of Companies 1987 Number of Companies 1992 Percent Increase
U.S. Latino Total 489,973 862,6057 6%
Source: U.S. Census Bureau, "Survey of Minority-owned Business Enterprises" 1982 & 1992.
Latino Owned Businesses 1987 1992
Number of Companies 489,373 862,605Texas Companies 94,754 155,909Gross Receipts ($B) 32.82 76.84Texas Gross Receipts ($B) $ 4.1 $ 11.8Number of Employees 264,846 691,056
Texas Number of Employees 49,942 138,798Source: U.S. Census Bureau, "Survey of Minority-owned Business Enterprises" 1982 & 1992.
NATIONALLY· 77% Latino owned businesses are owner operated.· The majority of Latino owned businesses use personal savings for
start up capitalCALIFORNIA:· California Latino owned businesses grew 245% in the last ten years· In 1992 Texas Latino business grossed close to $11.8 billion
10

_______________________William C. Velásquez Institute
This growing class of small business owners has made progress, yet 77% of the businesses areowner-operated or have no paid employees. These micro-businesses are very fragile with little orno access to capital. Working within the traditional banking system has offered few options.Access to technical assistance and capital pose serious limitations for potentially highly profitablebusinesses.
1997 Number of Companies by Employment
With no paid employees 1,252,881
With paid employees 214,283
No Employees* 43,125
1-4 employees 109,844
5-9 employees 32,200
10-19 employees 16,935
20-49 employees 8,255
50-99 employees 2,130
100 employees or more 1,794
Source: U.S. Census Bureau, "Survey of Minority -owned Business Enterprises" 1982 &1992. Numbers are conservative estimates based on past trends. *Companies indicated payroll but did not indicate employees.
Although this chart refers to Hispanic Business Magazine's top 500 businesses, based on asurvey, it reveals the source of capital of many Latino owned businesses. Latinos are dependingon personal savings and less on loans for their source of capital. This lack of interaction with thebanks and other mainstream financial services has limited the potential of existing and start upbusinesses.
Overall Financing of the 1994 Hispanic Business 500* National
Own Savings 56%
Bank Loan 20%
Personal Loan 17%
Venture Capital 4%
Private Placement 3%
*Hispanic Business annually reports the 500 largest Hispanic-owned businesses in the country.
By understanding both the challenges and the opportunities in Latino communities, civic leadersand Latino elected officials can be better prepared to strategize and use creative solutions toaddress the issues relevant to their community.
11
_______________________William C. Velásquez Institute
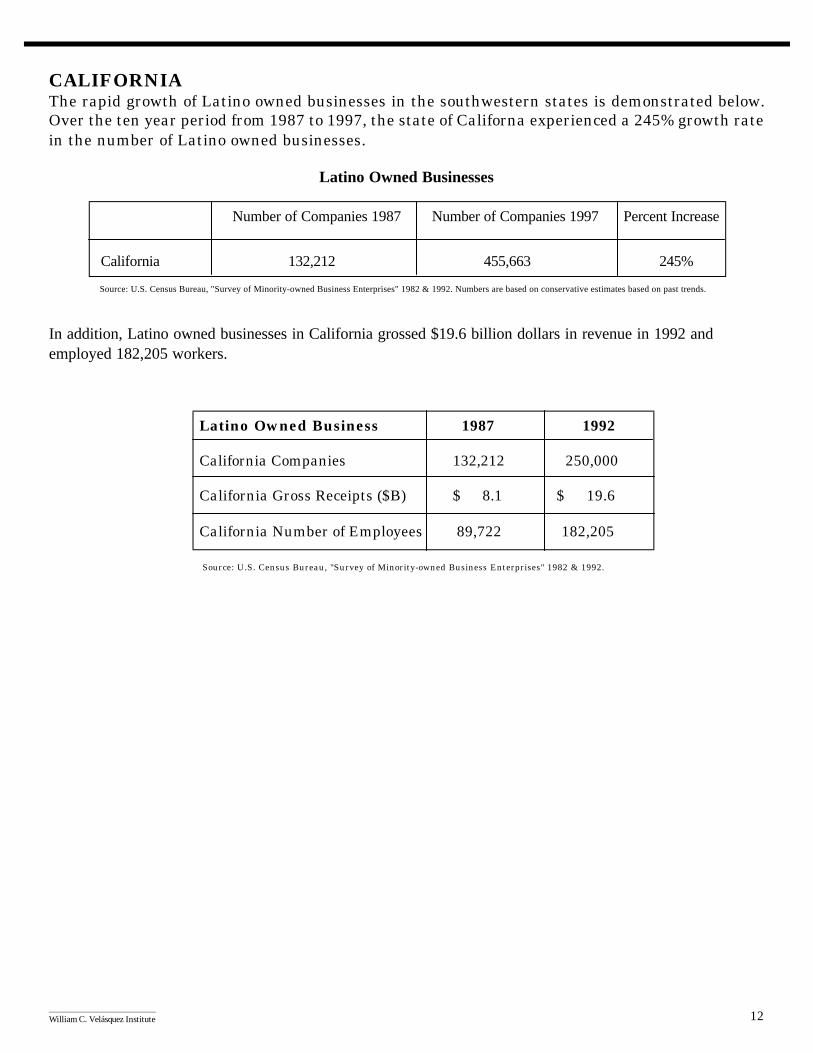
CALIFORNIAThe rapid growth of Latino owned businesses in the southwestern states is demonstrated below.Over the ten year period from 1987 to 1997, the state of Californa experienced a 245% growth ratein the number of Latino owned businesses.
Latino Owned Businesses
Number of Companies 1987 Number of Companies 1997 Percent Increase
California 132,212 455,663 245%
Source: U.S. Census Bureau, "Survey of Minority-owned Business Enterprises" 1982 & 1992. Numbers are based on conservative estimates based on past trends.
In addition, Latino owned businesses in California grossed $19.6 billion dollars in revenue in 1992 andemployed 182,205 workers.
Latino Owned Business 1987 1992
California Companies 132,212 250,000
California Gross Receipts ($B) $ 8.1 $ 19.6
California Number of Employees 89,722 182,205
Source: U.S. Census Bureau, "Survey of Minority-owned Business Enterprises" 1982 & 1992.
12

HEALTH
Major Findings:
CALIFORNIAHealth insurance coverage is key in evaluating the access Latinos have to health care inCalifornia. Latinos, including full-time working poor Latinos, have less access to health insurancecoverage.
Young adults (18-24 years, 25-34 years, and 35-44 years) have the highest rate of non-coverageamong Californians (35%, 29% and 24% respectively).
RATE OF HEALTH INSURANCE FOR CALIFORNIANS (1995)
Latinos have the highest rate of non-coverage of all ethnic groups in California (38%). AfricanAmericans have the next highest rate of non-coverage (22%).
Ethnicity Insured Uninsured
Latino 62% 38%
White 85% 15%
African American 78% 22%
_______________________William C. Velásquez Institute
CALIFORNIA:· Latinos have the highest non-coverage rate in California 38% to 15% for Whites · The rate of Non-citizens (44%) who are uninsured is twice as high than the rate of
uninsured US born citizens (17%) and naturalized citizens (20%)· Rate of non-insurance coverage for the near poor (100%-199% FPL) is 36%, the
rate of non-insurance coverage for the poor, (less than 100% FPL) is 37%· Majority of Latinos who are uninsured are working: more than half of the Latino
uninsured work at full-time jobs and more than a quarter of uninsured Latinoswork part-time or seasonally
Age Insured Uninsured
0-5 years 85% 15%
6-18 years 81% 19%
18-24 years 65% 35%
25-34 years 71% 29%
35-44 years 76% 24%
45-54 years 80% 20%
55-65 years 84% 16%
13
Source: California Health Care Foundation, California’s Uninsured:Understanding a Complex Issue (February 1998)
Source: California Health Care Foundation, California’s Uninsured: Understanding aComplex Issue (February 1998)

_______________________William C. Velásquez Institute
Lack of insurance coverage is not just a problem of those living below the Federal Poverty Level("FPL"). While those below 100% of the Federal Poverty Level had the highest rate of non-coverage (37%), those at 100-199% of the FPL had a comparable rate of non-coverage (36%).
Income Insured Uninsured
Under 100% Federal Poverty Level1 63% 37%
100% to 199% FPL 64% 36%
200%-299% FPL 77% 23%
300+ FPL 89% 11%
Single adults with or without children are at risk, this group is more likely to be uninsured.
Family Structure Insured Uninsured
Single Adult, no children 63% 37%
Married Adult, no children 84% 16%
Single Adult, with children 77% 23%
Married Adult, with children 81% 19%
Citizens, whether U.S. born or naturalized, have a comparable insurance coverage rate (83% and80% respectively). Non-citizens have dramatically lower insurance coverage (only 56%).
Citizenship Insured Uninsured
U.S.-born citizen 83% 17%
Naturalized citizen 80% 20%
Non-citizen 56% 44%
14
Source: California Health Care Foundation, California’s Uninsured: Understanding a Complex Issue(February 1998)
Source: California Health Care Foundation, California’s Uninsured: Understanding a Complex Issue(February 1998)
Source: California Health Care Foundation, California’s Uninsured:Understanding a Complex Issue (February 1998)
1 In 1995, Federal Poverty Level was $7,309 for a single adult, $10,259 for a family of two, $12,158 for a family of three, and $15,569 for a familyof four.
Health Insurance Coverage of Latinos and Non-Latino WhitesAges 0-64, California, 1996 and 1997 (average)
Latino Non-Latino Whites
Uninsured 36% 15%
Job-based insurance 41% 69%
Privately purchased insurance 2% 7%
Medi-Cal 20% 7%
Other public coverage 1% 2%Source: Levan, R., Brown, E.R., Hays, N., Wyn, R., Disparity in Job-Based Health CoveragePlaces, California’s Latino at Risk of Being Uninsured, April 1999.

_______________________William C. Velásquez Institute 15
Most non-Latino whites obtain health insurance from their employment (69%). While mostLatinos also obtain health coverage through employment, the rate is lower than for whites (41%).Latinos have a much higher rate of Medi-Cal coverage than their non-Latino white counterparts(20% versus 7%); and Latinos have more than twice the rate of non-coverage than their non-Latino white counterparts (36% versus 15%).
RATE OF HEALTH INSURANCE FOR NON-ELDERLY LATINOS IN CALIFORNIA 2
Of those Latinos not covered by health insurance, most (55%) are full-time, full-year employees.Part-year and part-time employees make up more than a quarter of the uninsured Latinopopulation (29%).
Family Work Status of Uninsured Non-Elderly Latinos, Ages 0-64, California 1995
Full-time, full-year employee 55%Full-time, part-year employee 19%Part-time employee 10%Self-employed 5%Non-working 11%
Job-Based Health Insurance by Earnings for Latino and Non-Latino White Full-TimeFull-Year Employees, Ages 18-64, California 1995
Latino Non-Latino WhitesLess than $12,000 28% 47%$12,000-$17,999 48% 74%$18,000-$23,999 68% 79%$24,000-$29,999 76% 82%$30,000 + 85% 90%
Family Incomes of Uninsured Non-Elderly Latinos, Ages 0-64, California 1995Latino California
Less than 100% FPL 37% 37%100%-199% FPL 41% 36%200%-299% FPL 14% 23%300%+ FPL 8% 11%
Latinos below the FPL have a comparable rate of non-coverage as all Californians. However,Latinos near the FPL have a higher rate of non-coverage than Latinos below the FPL (41% versus37%). Moreover, Latinos near the FPL have a higher rate of non-coverage than all Californians(41% versus 36%).
Without health insurance, Latinos are far less likely to obtain needed health care. Latinoswithout health insurance receive half as much medical care as those with health insurance.Uninsured Latinos wait longer and receive fewer physician services.3 Latinos without healthinsurance appear to be less healthy and to require more intensive care than those with insurance.Uninsured Latinos experience a high rate of hospitalization for conditions that could have beenprevented, treated or controlled with inexpensive and timely primary care.
2 Source: E. Richard Brown, Nadereh Pourat, Roberta Wyn, Beatriz Solis, 38% of California's Non-elderly Latinos Are Uninsured, UCLA Centerfor Health Policy Research (August 1997).3 R. Burciaga Valdez, Aida Giachello, Helen Rodriquez-Trias, Paula Gomez and Castulo de la Rocha in Improving Access to Health Care in LatinoCommunities; Special Section: Surgeon General's National Workshop: Implementation Strategies for Improving Hispanic-Latino Health, 108 PublicHealth Reports 534 (September 1996) (hereinafter 'Improving Access to Latino Health Care").

_______________________William C. Velásquez Institute
Although most Americans acquire health insurance as a fringe benefit of employment, this is notthe case in the Latino community despite the fact that Latinos are among the most activeparticipants in the labor force. Employment in small firms and in low wage sectors of theeconomy that do not offer fringe benefits account for some of the difference in coverage betweenLatinos and the general population.
MEDICALLY UNDERSERVED AREAS4
The Public Health Service defines medically underserved communities as:
Counties are classified as medically underserved based on a shortage of primary care physiciansand/or depressed health status measures, including infant mortality, low birth weight,immunizable disease, hepatitis, tuberculosis, and death from heart disease and pneumonia.
Medically Underserved Counties
In California, virtually all cases of communicable diseases-immunizable diseases, tuberculosis,hepatitis-occur in underserved counties. At stake is the health not only of those at risk forunderservice, but also the population at large. The attached map shows medically underservedareas and medically underserved populations in California.
"an urban or rural area...with a shortage of personal health services...infantmortality...other factors indicative of the health status of a population group orresidents of an area, the ability of residents of an area or of a population groupto pay for health services and their accessibility to them, and the availability ofhealth professionals to residents of an area or to a population group."
Total counties 58
Total medically underserved counties 44 (76% of all counties)
Total population 29,760,021
Total underserved population 6,400,925 (21.5% of total population)
16
4 National Association of Community Health Centers, Access to Community Health Care, National and State Data Book, George WashingtonUniversity (1996).

_______________________William C. Velásquez Institute
PRIMARY CARE HEALTH PROFESSIONAL SHORTAGE AREASPrimary care health professional shortage areas (HPSAs) are areas where the ratio of physicians topatients is greater than one doctor to 3,500 patients (1:3,500). Attached is a map showing HPSAs.While no firm data was available for this report, a review of the HPSAs within selected countiesshows how such areas tend to be within Latino, African American or rural communities.
Selected County HSPAs
Fresno County Orange CountyCoalinga (R) Central Santa Ana (U)Edison-Easton (low income population) (U) Dana Point/San Clemente/San Juan CapistranoFirebaugh/Mendota (R) (migrant and low income populations) (U)Huron (R)Keman (R)Laton/Riverdale (R)Orange Cove/Parlier/Reedley (poverty and migrant populations) (R)San Joaquin-Tranquility (R)
Los Angeles County Imperial CountyAvalon/Goodyear Main (U) Calexico (R)East Compton (U) East Imperial (R)East Los Angeles/Commerce (U) West Imperial (low income population) (R)El Sereno/Highland Park (low income population) (U) El Centro (R)Mission Hills/San Fernando (U) Brawley/Calipatri-Westmorland (R)N. El Monte/S. El Monte (U) Winterhaven-Bard (Medi-Cal eligibles) (R)Pacoima/Sun Valley North (U)Pico Rivera South (U)Avalon [Santa Catalina Island] (R)Venice/South Santa Monica (U)Watts/Figueroa/Firestone (U)Wilmington/East San Pedro/Los Beach (U)
17
Disease Rate in Underserved Counties
Disease or Condition Total Cases Underserved Cases Underserved % of TotalImmunizable diseases 4,369 4,346 99.47%Tuberculosis 14,074 13,795 98.02%Hepatitis 18,711 18,078 96.62%Births 487,495 467,460 95.8%
Low Birth Weight Rate and Infant Mortality Rate in Underserved Counties
Condition Total Non-Underserved Underserved Births 487,495 20,035 467,460Low Birth Weight (Per 1,000) 5.24 5.68Infant Mortality (Per 1,000) 9.16 9.07
_______________________William C. Velásquez Institute
San Diego CountyBorrego Springs (R) Ramona (R)City Heights/Downtown/Middletown/Oak Park (U) San Ysidro (U)El Cajon (low income population) (U) Vista East/San Marcos North Encanto/Lincoln Acres/National City/Paradise His West (U) (low income population) (U)Fallbrook (low income population) (R) Oceanside West/Carlsbad West Golden Hills/Logan Heights (U) (low income population) (U)Mountain Empire (R)
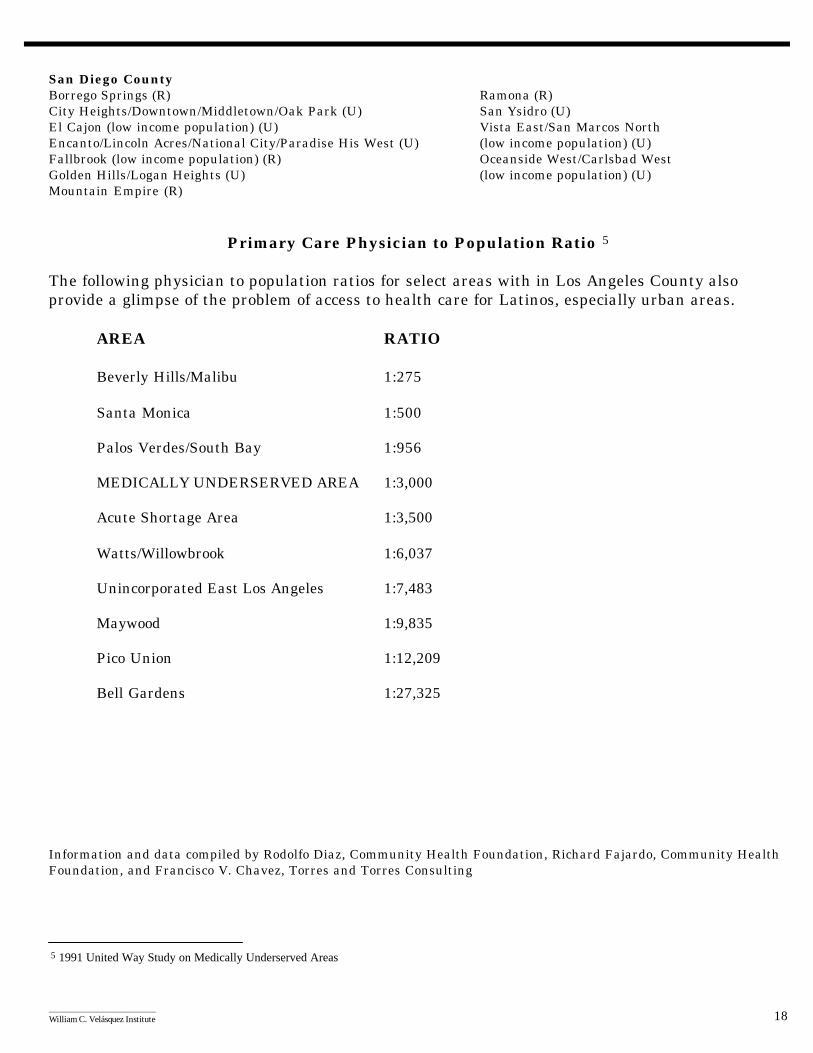
Primary Care Physician to Population Ratio 5
The following physician to population ratios for select areas with in Los Angeles County alsoprovide a glimpse of the problem of access to health care for Latinos, especially urban areas.
AREA RATIO
Beverly Hills/Malibu 1:275
Santa Monica 1:500
Palos Verdes/South Bay 1:956
MEDICALLY UNDERSERVED AREA 1:3,000
Acute Shortage Area 1:3,500
Watts/Willowbrook 1:6,037
Unincorporated East Los Angeles 1:7,483
Maywood 1:9,835
Pico Union 1:12,209
Bell Gardens 1:27,325
Information and data compiled by Rodolfo Diaz, Community Health Foundation, Richard Fajardo, Community HealthFoundation, and Francisco V. Chavez, Torres and Torres Consulting
5 1991 United Way Study on Medically Underserved Areas
18

_______________________William C. Velásquez Institute
HOUSING
Major Findings:
NATIONALLYThe last several years have been aperiod of tremendous growth forhomeownership, particularly forminorities. According to the JointCenter for Housing Studies at HarvardUniversity, minorities contributed42% of the growth in homeownership(nationally) between 1994 and 1997.The number of Hispanic homeownersincreased by 572,000 in that period, from 3,161,000 to 3,733,000. This trend is expected to growin the future, since more Hispanic households are in their peak homebuying years, and tend to belarger, than white or black households. Nonetheless, the homeownership rate for Latinos andblacks lags substantially behind whites. The total minority homeownership rate is 46%,compared to the white homeownership rate of 72%.
CALIFORNIAUnfortunately, the housing boom of the 1990s has not been able to stave off a housing crisis inthe State of California. California has one of the lowest homeownership rates in the country, 56%(compared to the national rate of 65%). The median home price in the state is currently $208,000,$56,000 higher than the U.S. average. Furthermore, the National Association of Home Buildersfound that in the first quarter of 1999, 13 of the 25 least-affordable markets nationwide are inCalifornia.
High Cost California Cities
NATIONALLY:· Latino Home Ownership 44.9%· White Home Ownership 72%CALIFORNIA:· California has one of the lowest homeownership
rates in the country, 56% compared to the national rate of 65%.
· Average home cost in California is $208,000· Latino families (based on median income) can
afford a $100,000 home or less
19
12 of the nation's 25 least affordable housing markets arelocated in California.* In order, they are:
1. San Francisco 7. Oakland2. Santa Cruz-Watsonville 8. Santa Barbara3. Santa Rosa 9. Los Angeles4. Salinas 10. Orange County5. San Luis Obispo 11. Ventura6. San Diego 12. Stockton
Source: National Association of HomeBuilders * For First quarter 1999.

_______________________William C. Velásquez Institute
For low-income Californians, the scenario is dramatically worse. California ranks last in thecountry in the provision of subsidized housing for families transitioning from welfare to work,with only 13% receiving housing assistance. The Center for Budget and Policy Prioritiesconcluded that Los Angeles and North Orange counties have the worst affordable housingshortage in the U.S., for example, the apartments renting for about $300 (in 1995) do not meet thegreat demand. Moreover, California is facing a serious "opt-out" emergency. Los Angeles aloneis expected to lose 16,000 privately-owned affordable units due to owner decisions to prepay theirFederal Housing Administration-insured mortgages or to opt-out of Section 8.
California Counties Most Likely to Experience Owner "Opt-Out" from Section 8
Latinos, specifically, face an additional housing burden. Overcrowding in Latino communities isrampant. The counties of San Jose and Los Angeles, and the Anaheim-Santa Ana area, all
experienced major increases in overcrowding in the lastdecade. Over 66% of overcrowded households and 75% ofseverely overcrowded households in the state wereHispanic, although Hispanics account for only 22% of thestate's metropolitan population. These data indicate that,
with regards to Latinos, there is a housing mismatch in the state; there is a high demand forlarge-sized, affordable rental and owner housing but a critical shortage of such units in the state.
Currently, there is housing legislation in the pipeline of the California State Legislature. SenatorRichard Alarcon (D-Los Angeles) has proposed a bill, SB 510, which would authorize the issuanceof bonds to be used toward several housing programs. Moreover, Governor Davis recently signeda budget which included $30 million for affordable housing.
20
Based on analysis of Section 8 contracts scheduled to expire between 1998-2000 which are at or below Fair Market Rents.
Alameda CountyContra Costa County
Los AngelesSacramentoSan Diego
San FranciscoSanta Clara
Source: The State of California's Housing Markets 1990-1997, California Department of Housing &Urban Development
· Over 66% of overcrowded households and 75% of severely overcrowded households in the state were Hispanic
· California will lose 16,000 affordable units


![Velásquez Rodríguez v. Honduras...2014] Velásquez Rodríguez v. Honduras 1917 hearing, and improper application of Articles 50, which provides that the Commission may draw up a](https://static.documents.pub/doc/80x56/5e6ad78914628a5cd809233f/velsquez-rodrguez-v-honduras-2014-velsquez-rodrguez-v-honduras-1917.jpg)