Africa Railway Concessions : Lessons Learned and Potential Solutions for a Revival of the Sector March 2011 Presented by: Pierre Pozzo di Borgo, Program Coordinator – Africa Transport The World Bank The World Bank Group 1
Transcript
Africa Railway Concessions : Lessons Learned and Potential Solutions for a Revival of the
Sector
March 2011
Presented by: Pierre Pozzo di Borgo, Program Coordinator – Africa TransportThe World Bank
The World Bank Group
1
-
0.5
1.0
1.5
2.0
2.5
3.0
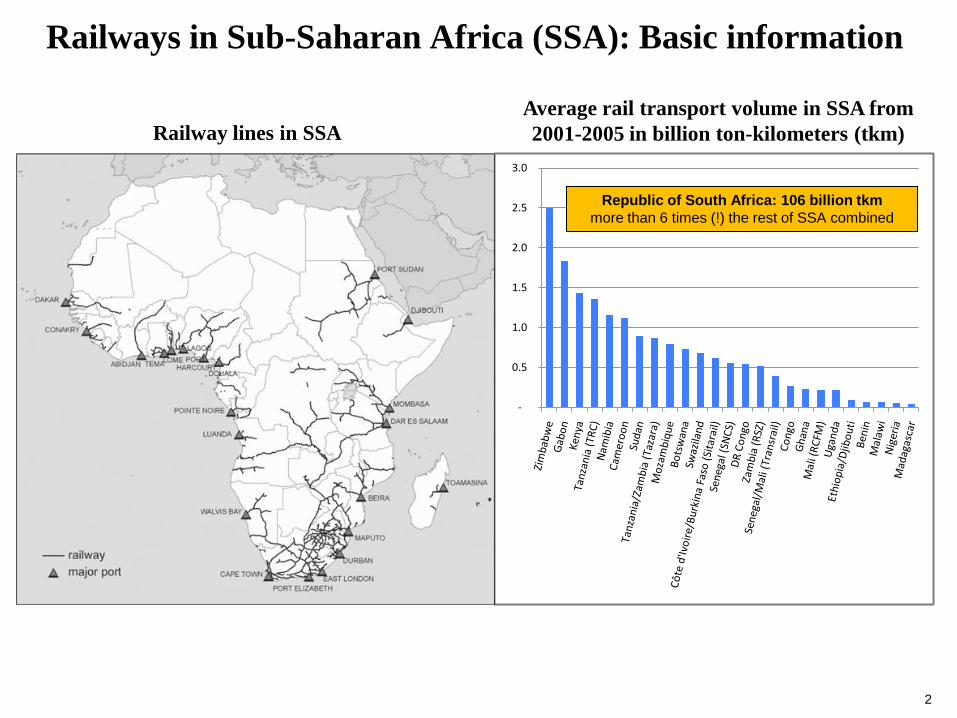
Railways in Sub-Saharan Africa (SSA): Basic information
Republic of South Africa: 106 billion tkmmore than 6 times (!) the rest of SSA combined
Average rail transport volume in SSA from 2001-2005 in billion ton-kilometers (tkm)Railway lines in SSA
2
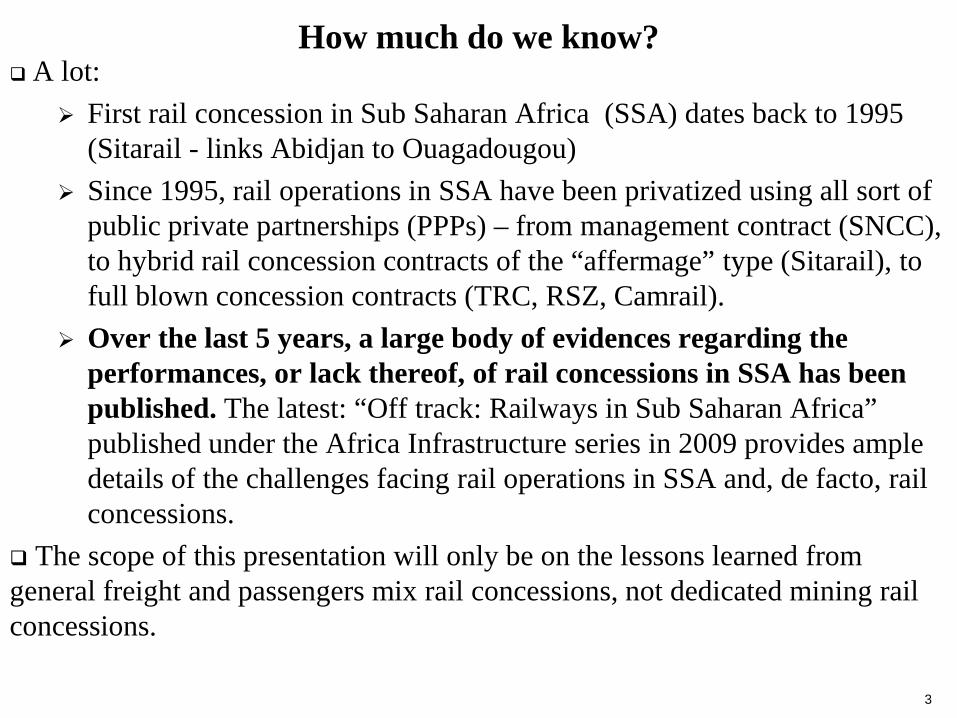
A lot: First rail concession in Sub Saharan Africa (SSA) dates back to 1995
(Sitarail - links Abidjan to Ouagadougou) Since 1995, rail operations in SSA have been privatized using all sort of
public private partnerships (PPPs) – from management contract (SNCC), to hybrid rail concession contracts of the “affermage” type (Sitarail), to full blown concession contracts (TRC, RSZ, Camrail).
Over the last 5 years, a large body of evidences regarding the performances, or lack thereof, of rail concessions in SSA has been published. The latest: “Off track: Railways in Sub Saharan Africa” published under the Africa Infrastructure series in 2009 provides ample details of the challenges facing rail operations in SSA and, de facto, rail concessions.
The scope of this presentation will only be on the lessons learned from general freight and passengers mix rail concessions, not dedicated mining rail concessions.
How much do we know?
3
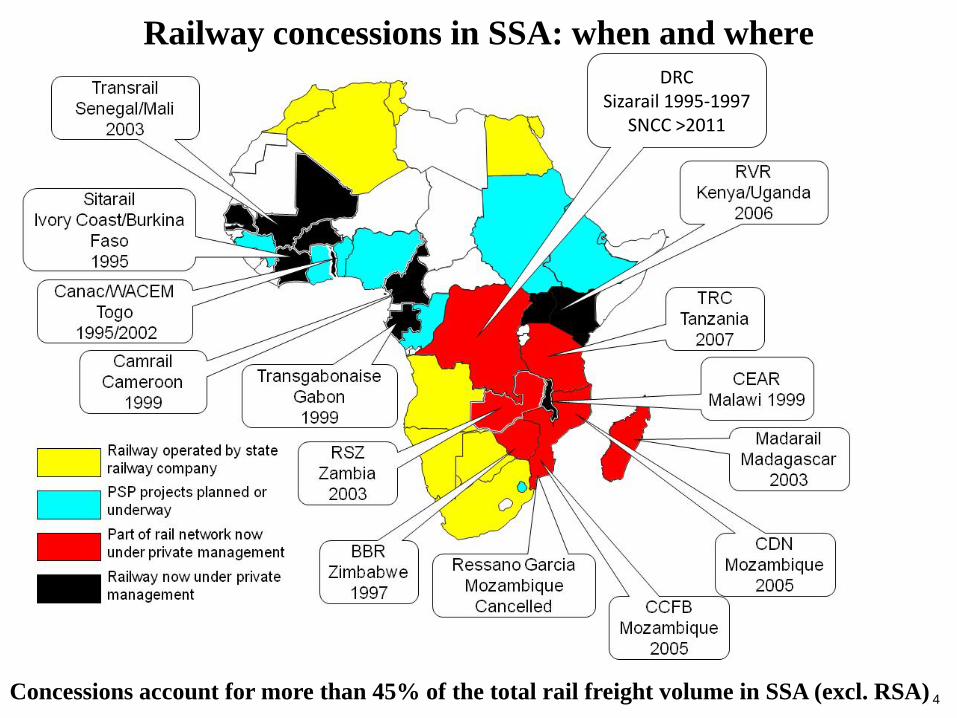
Railway concessions in SSA: when and where
Concessions account for more than 45% of the total rail freight volume in SSA (excl. RSA)
DRCSizarail 1995-1997
SNCC >2011
4
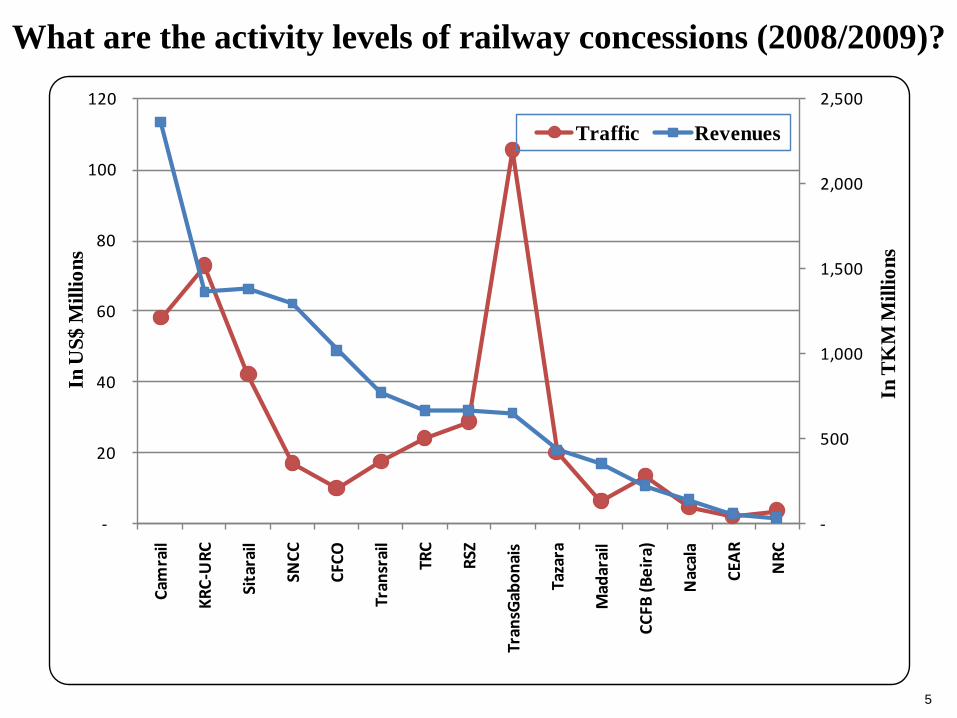
What are the activity levels of railway concessions (2008/2009)?
-
20
40
60
80
100
120
Cam
rail
KRC-
URC
Sita
rail
SNCC
CFCO
Tran
srai
l
TRC
RSZ
Tran
sGab
onai
s
Taza
ra
Mad
arai
l
CCFB
(Bei
ra)
Nac
ala
CEA
R
NRC
-
500
1,000
1,500
2,000
2,500 In
US$
Mill
ions
In T
KM
Mill
ions
Traffic Revenues
5
Concession Countries Year of concessioning
Network length (km)
Total support in US$ millions Current Performance 1/ Investment responsibility Canceled
concessions
IDA IFC Operational Financial Infrastructure Rolling Stock
Sitarail Ivory Coast, Burkina Faso 1995 1,245 21 none A C Public Private
Camrail Cameroon 1999 1,104 113 none B A Public Private
CEAR Malawi 2000 797 10 none D D Private Private X
RSZ Zambia 2002 1,273 35 none C C Private Private
Madarail Madagascar 2003 681 65 none B C Public Private
Transrail Senegal, Mali 2003 1,546 45 none C D Private Private
CCFB (Beira) Mozambique 2005 725 110 none C D Private Private X
TransGabonais Gabon 2005 814 0 none B C Public Private
Nacala Mozambique 2005 600 20 none C D Private Private
KRC-URC Kenya-Uganda 2006 2,454 74 32 C D Private Private
TRC Tanzania 2007 2,722 35 44 D D Private Private X
SNCC DR Congo 2011 3,641 219 none D D Public Private/PublicTOTAL 747 76
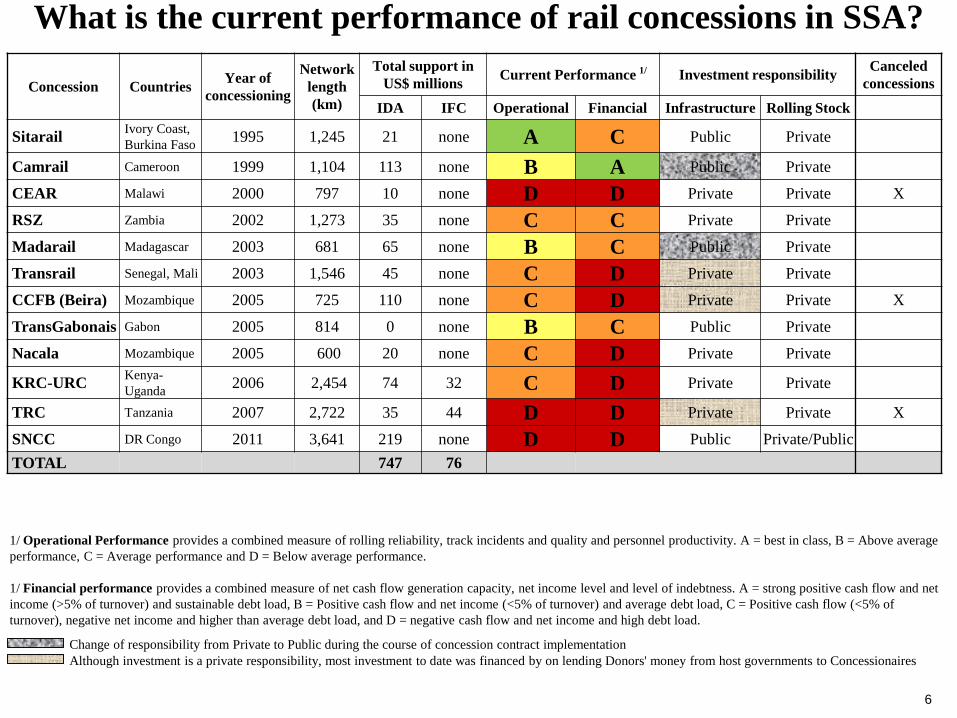
What is the current performance of rail concessions in SSA?
1/ Operational Performance provides a combined measure of rolling reliability, track incidents and quality and personnel productivity. A = best in class, B = Above average performance, C = Average performance and D = Below average performance.
1/ Financial performance provides a combined measure of net cash flow generation capacity, net income level and level of indebtness. A = strong positive cash flow and net income (>5% of turnover) and sustainable debt load, B = Positive cash flow and net income (<5% of turnover) and average debt load, C = Positive cash flow (<5% of turnover), negative net income and higher than average debt load, and D = negative cash flow and net income and high debt load.
Change of responsibility from Private to Public during the course of concession contract implementationAlthough investment is a private responsibility, most investment to date was financed by on lending Donors' money from host governments to Concessionaires
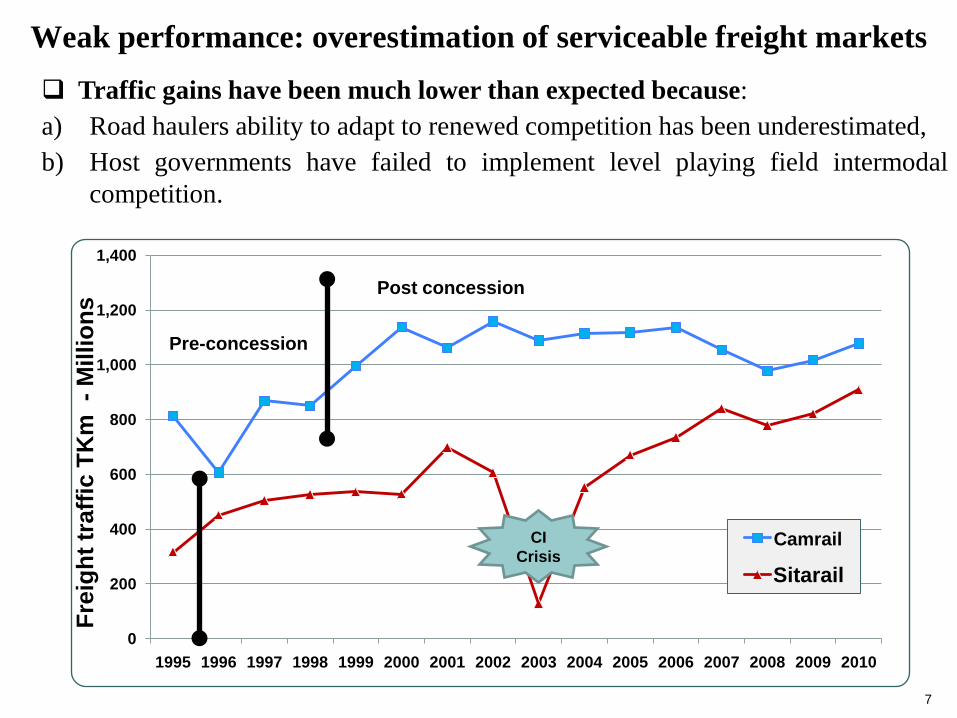
Weak performance: overestimation of serviceable freight markets
Pre-concession
Post concession
CI Crisis
Traffic gains have been much lower than expected because:a) Road haulers ability to adapt to renewed competition has been underestimated,b) Host governments have failed to implement level playing field intermodal
competition.
Frei
ght t
raffi
c TK
m-M
illio
ns
Camrail
7
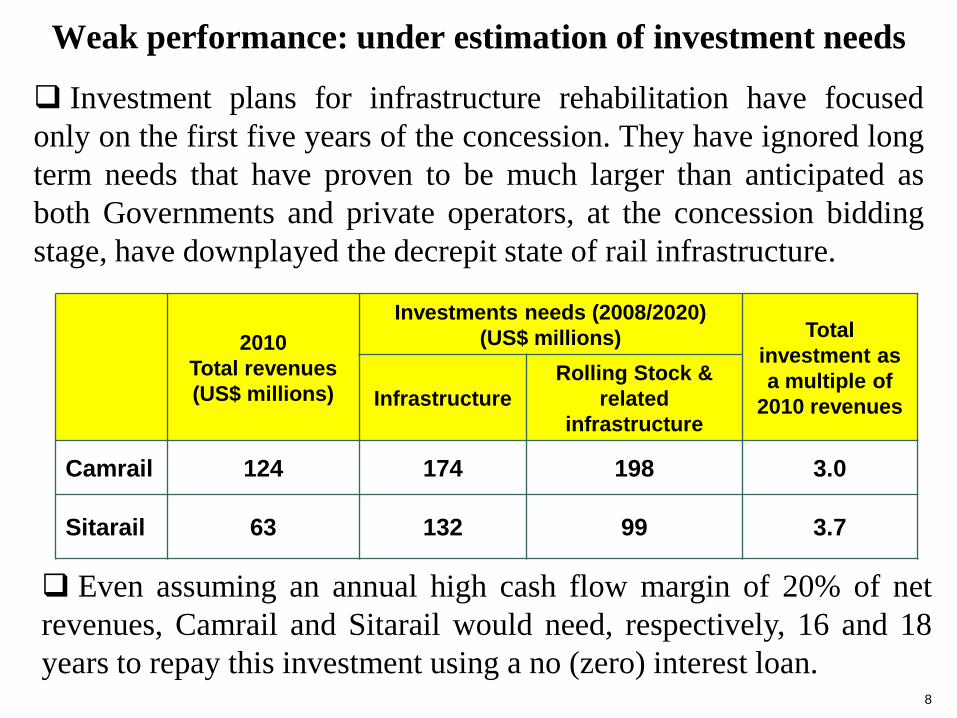
Weak performance: under estimation of investment needs
Investment plans for infrastructure rehabilitation have focusedonly on the first five years of the concession. They have ignored longterm needs that have proven to be much larger than anticipated asboth Governments and private operators, at the concession biddingstage, have downplayed the decrepit state of rail infrastructure.
2010Total revenues (US$ millions)
Investments needs (2008/2020) (US$ millions) Total
investment as a multiple of
2010 revenuesInfrastructureRolling Stock &
related infrastructure
Camrail 124 174 198 3.0
Sitarail 63 132 99 3.7
Even assuming an annual high cash flow margin of 20% of netrevenues, Camrail and Sitarail would need, respectively, 16 and 18years to repay this investment using a no (zero) interest loan.
8
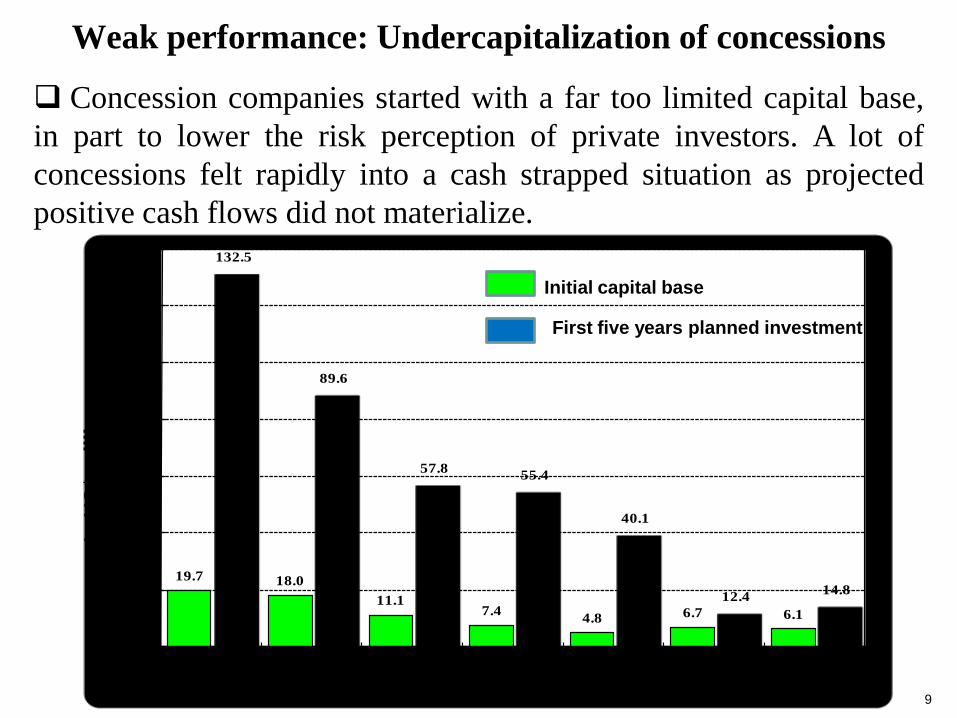
Weak performance: Undercapitalization of concessions
Concession companies started with a far too limited capital base,in part to lower the risk perception of private investors. A lot ofconcessions felt rapidly into a cash strapped situation as projectedpositive cash flows did not materialize.
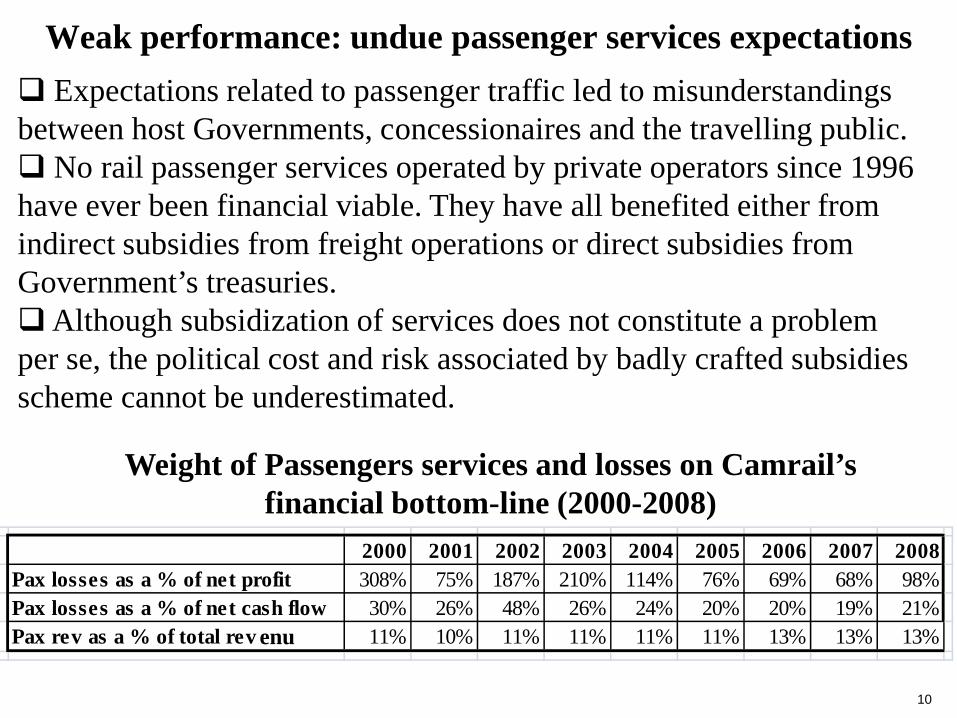
Weak performance: undue passenger services expectations Expectations related to passenger traffic led to misunderstandings between host Governments, concessionaires and the travelling public. No rail passenger services operated by private operators since 1996 have ever been financial viable. They have all benefited either from indirect subsidies from freight operations or direct subsidies from Government’s treasuries. Although subsidization of services does not constitute a problem per se, the political cost and risk associated by badly crafted subsidies scheme cannot be underestimated.
Weight of Passengers services and losses on Camrail’sfinancial bottom-line (2000-2008)
2000 2001 2002 2003 2004 2005 2006 2007 2008Pax losses as a % of net profit 308% 75% 187% 210% 114% 76% 69% 68% 98%Pax losses as a % of net cash flow 30% 26% 48% 26% 24% 20% 20% 19% 21%Pax rev as a % of total rev 11% 10% 11% 11% 11% 11% 13% 13% 13%enu
Cross border management presents specific challenges:
Accounting of transfer of infrastructure or rolling stock assets from one country to another;
Dependence of landlocked countries from their neighbor’s investment – how do we lock the commitment of one country vis-à-vis the other?
Synchronization of intermodal competition policies; and
Synchronization of long haul passenger services and deficit payments.
11
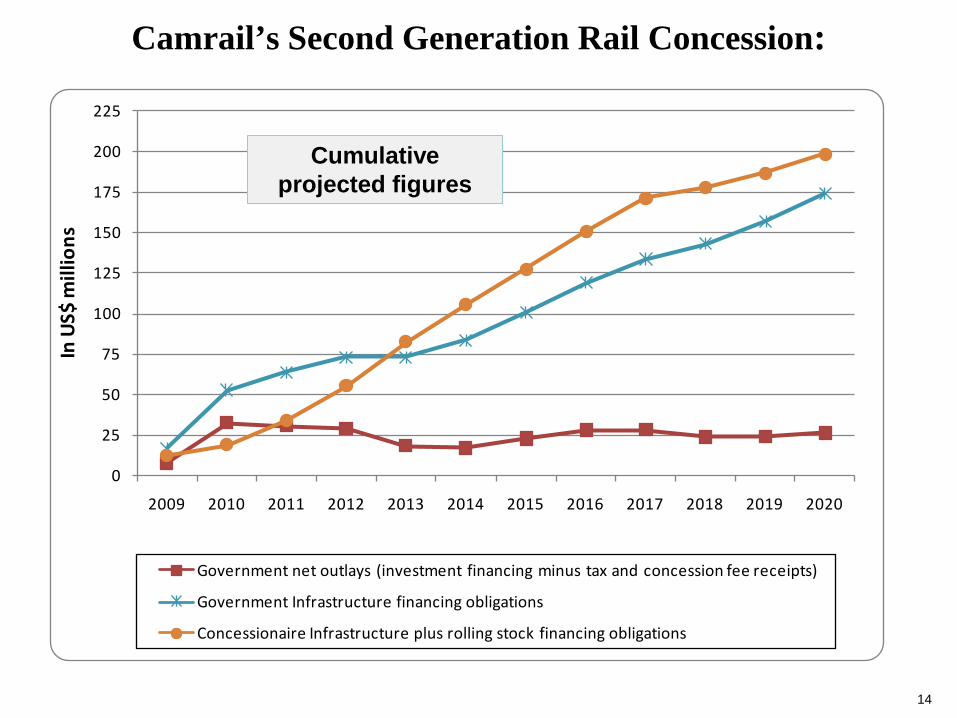
In spite of all the challenges facing rail concessions, rail operations and government's support to rail operations is still justified on economic ground for the following reasons:
Rail is still the most efficient transport mode for long haul freight; It generates a much lower set of externalities than do road traffic (accidents, pollution, etc.); On average the rehabilitation of a km of track cost 4 times less than the rehabilitation of a km of paved dual lanes road and last at least three times as much (20 years + versus 5 to 7 years); and If Concession traffic increase does materialize, overall net financial outlays for the host can be manageable (Camrail’s second generation concession contract case).
Government net outlays (investment financing minus tax and concession fee receipts)
Government Infrastructure financing obligations
Concessionaire Infrastructure plus rolling stock financing obligations
Camrail’s Second Generation Rail Concession:
Cumulative projected figures
14
0%20%40%60%80%100%120%140%160%
-
5
10
15
20
25
30
35
2009 2010 2011 Total(2009-2011)
US$
mill
ions
0%20%40%60%80%100%120%140%160%
-10 20 30 40 50 60 70 80
2009 2010 2011 Total(2009-2011)
US$
mill
ions
15
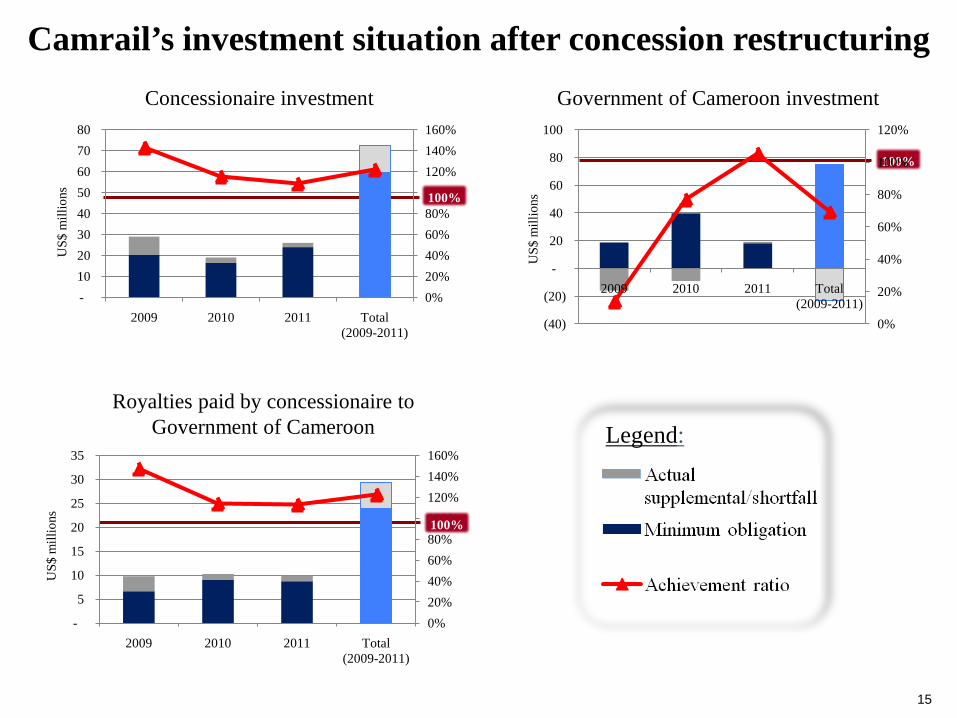
Concessionaire investment Government of Cameroon investment
Royalties paid by concessionaire to Government of Cameroon
100%
100%
100%
Camrail’s investment situation after concession restructuring
Legend:
0%
20%
40%
60%
80%
100%
120%
(40)
(20)
-
20
40
60
80
100
2009 2010 2011 Total(2009-2011)
US$
mill
ions
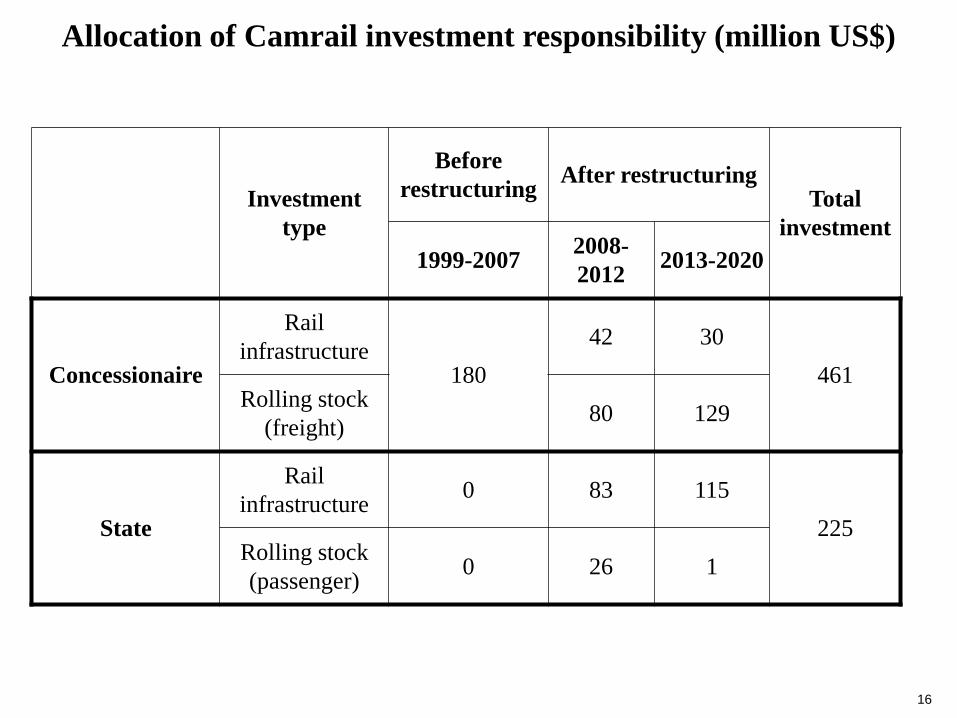
Investment type
Before restructuring After restructuring
Total investment
1999-2007 2008-2012 2013-2020
Concessionaire
Rail infrastructure
18042 30
461Rolling stock
(freight) 80 129
State
Rail infrastructure 0 83 115
225Rolling stock (passenger) 0 26 1
Allocation of Camrail investment responsibility (million US$)
16
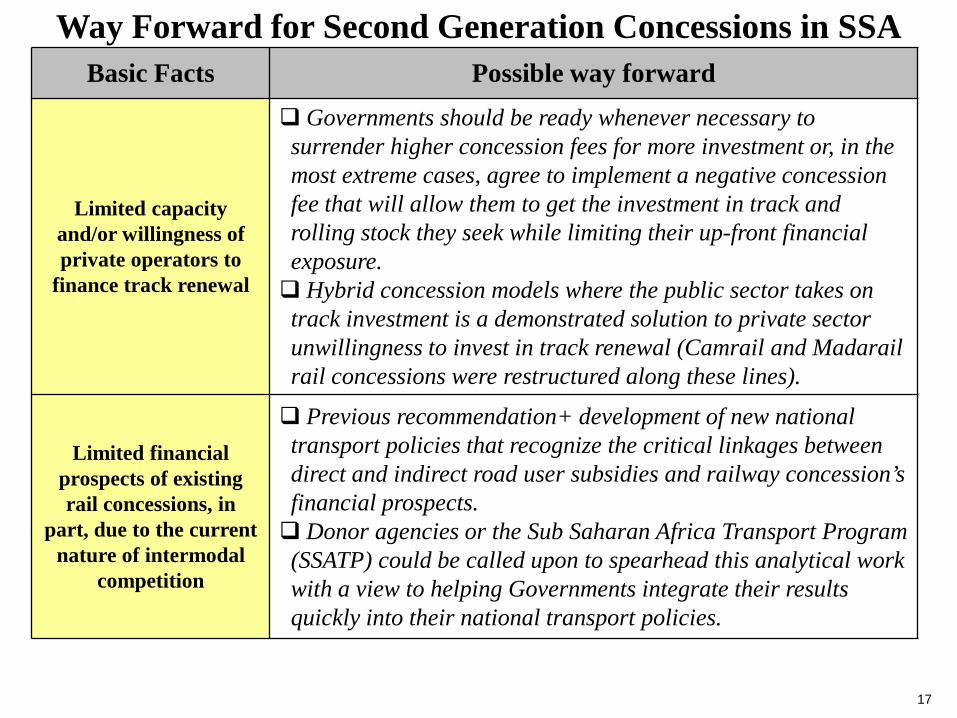
Basic Facts Possible way forward
Limited capacity and/or willingness of private operators to
finance track renewal
Governments should be ready whenever necessary to surrender higher concession fees for more investment or, in the most extreme cases, agree to implement a negative concession fee that will allow them to get the investment in track and rolling stock they seek while limiting their up-front financial exposure. Hybrid concession models where the public sector takes on track investment is a demonstrated solution to private sector unwillingness to invest in track renewal (Camrail and Madarailrail concessions were restructured along these lines).
Limited financial prospects of existing rail concessions, in
part, due to the current nature of intermodal
competition
Previous recommendation+ development of new national transport policies that recognize the critical linkages between direct and indirect road user subsidies and railway concession’s financial prospects. Donor agencies or the Sub Saharan Africa Transport Program (SSATP) could be called upon to spearhead this analytical work with a view to helping Governments integrate their results quickly into their national transport policies.
Way Forward for Second Generation Concessions in SSA
17
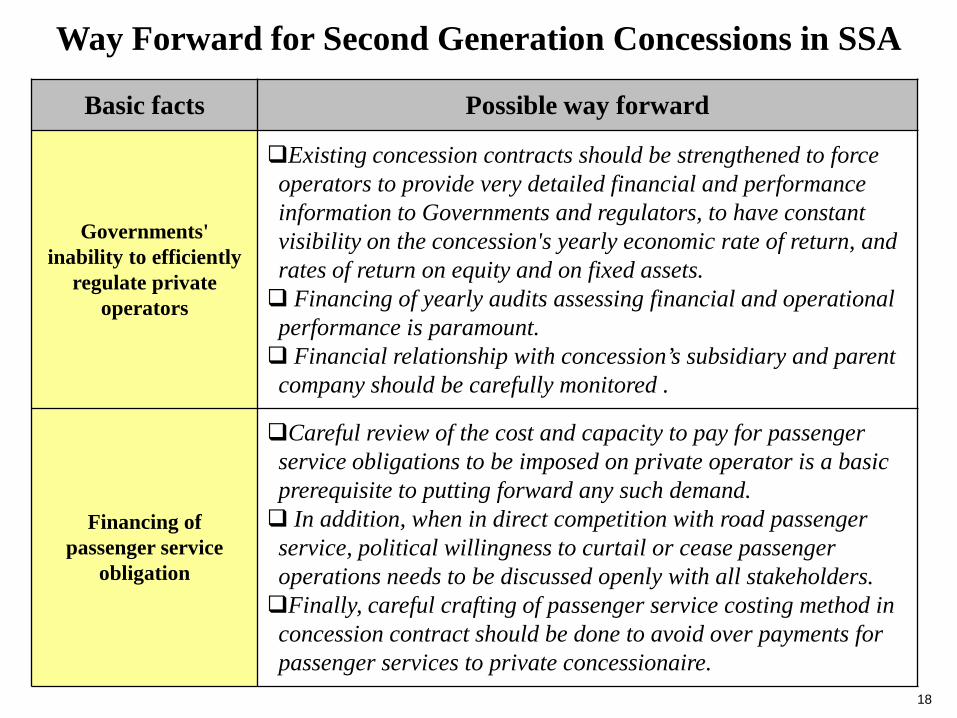
Basic facts Possible way forward
Governments' inability to efficiently
regulate private operators
Existing concession contracts should be strengthened to force operators to provide very detailed financial and performance information to Governments and regulators, to have constant visibility on the concession's yearly economic rate of return, and rates of return on equity and on fixed assets. Financing of yearly audits assessing financial and operational performance is paramount. Financial relationship with concession’s subsidiary and parent company should be carefully monitored .
Financing of passenger service
obligation
Careful review of the cost and capacity to pay for passenger service obligations to be imposed on private operator is a basic prerequisite to putting forward any such demand. In addition, when in direct competition with road passenger service, political willingness to curtail or cease passenger operations needs to be discussed openly with all stakeholders. Finally, careful crafting of passenger service costing method in concession contract should be done to avoid over payments for passenger services to private concessionaire.
Way Forward for Second Generation Concessions in SSA
18
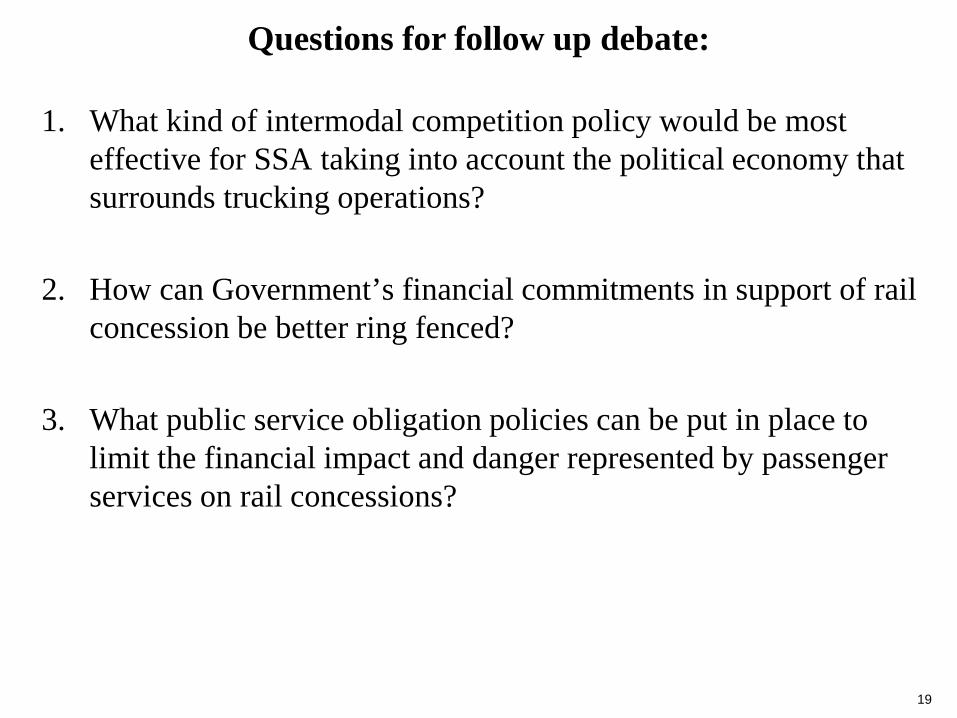
Questions for follow up debate:
19
1. What kind of intermodal competition policy would be most effective for SSA taking into account the political economy that surrounds trucking operations?
2. How can Government’s financial commitments in support of rail concession be better ring fenced?
3. What public service obligation policies can be put in place to limit the financial impact and danger represented by passenger services on rail concessions?