The World Gasification The World Gasification Industry 2004 Industry 2004 - - 2010 2010 Major Factors & Trends Major Factors & Trends Driving Growth Driving Growth Freiberg Germany Freiberg Germany June June James Childress James Childress Executive Director Executive Director Gasification Technologies Council Gasification Technologies Council
Transcript
The World Gasification The World Gasification Industry 2004Industry 2004--2010 2010
Major Factors & Trends Major Factors & Trends Driving GrowthDriving Growth
Freiberg GermanyFreiberg GermanyJune June
James ChildressJames ChildressExecutive DirectorExecutive Director
Gasification Technologies CouncilGasification Technologies Council
Gasification Technologies CouncilGasification Technologies Council
GTC MembersGTC MembersAFC Coal PropertiesAFC Coal PropertiesAir Liquide America*Air Liquide America*Air Products and Chemicals, Inc.*Air Products and Chemicals, Inc.*Allied Syngas Corporation*Allied Syngas Corporation*American Electric Power*American Electric Power*Aramco Services Company*Aramco Services Company*Bechtel Corporation*Bechtel Corporation*Black & Veatch Corporation*Black & Veatch Corporation*BOC Gases*BOC Gases*Boeing, Rocketdyne Propulsion & Power*Boeing, Rocketdyne Propulsion & Power*Calpine Corporation*Calpine Corporation*Cinergy Corporation*Cinergy Corporation*ConocoPhillips*ConocoPhillips*Constellation Energy*Constellation Energy*The Dow Chemical Company*The Dow Chemical Company*Eastman Chemical Company*Eastman Chemical Company*Ebara CorporationEbara CorporationEmery Energy CompanyEmery Energy CompanyFluor Corporation*Fluor Corporation*Foster Wheeler Energy International Inc.*Foster Wheeler Energy International Inc.*Gas Technology InstituteGas Technology InstituteGE Energy*GE Energy*
Global Energy, Inc.*Global Energy, Inc.*Kentucky Center for Applied Energy ResearchKentucky Center for Applied Energy ResearchLake Charles Cogeneration, LLCLake Charles Cogeneration, LLCLinde Process PlantsLinde Process PlantsLockwood Greene E&C / CH2M HillLockwood Greene E&C / CH2M HillLurgi Oel Gas Chemie GmbHLurgi Oel Gas Chemie GmbHMitretekMitretekNexant, Inc.Nexant, Inc.Parsons Energy & Chemicals Group Inc.*Parsons Energy & Chemicals Group Inc.*Porvair PLCPorvair PLCPraxair, Inc.*Praxair, Inc.*Sasol TechnologySasol TechnologySempra GenerationSempra GenerationShell Global Solutions B.V.*Shell Global Solutions B.V.*Siemens Westinghouse Power Corporation*Siemens Westinghouse Power Corporation*Snamprogetti S.p.A.Snamprogetti S.p.A.Tennessee Valley Authority* Tennessee Valley Authority* Uhde Corporation of America*Uhde Corporation of America*UOPUOPValvtechnologies, IncValvtechnologies, IncWaste Management & Processors Pty., LLC*Waste Management & Processors Pty., LLC*
* Denotes member of Board of Directors* Denotes member of Board of Directors
Gasification Technologies CouncilGasification Technologies Council
OverviewOverview
State of the gasification industryState of the gasification industry–– WorldwideWorldwide–– U.S.U.S.
Why Coal Gasification?Why Coal Gasification?Environmental performance: gasification vs. Environmental performance: gasification vs. combustioncombustionFactors driving gasification trendsFactors driving gasification trendsProspects for gasification in U.S.Prospects for gasification in U.S.
Gasification Technologies CouncilGasification Technologies Council
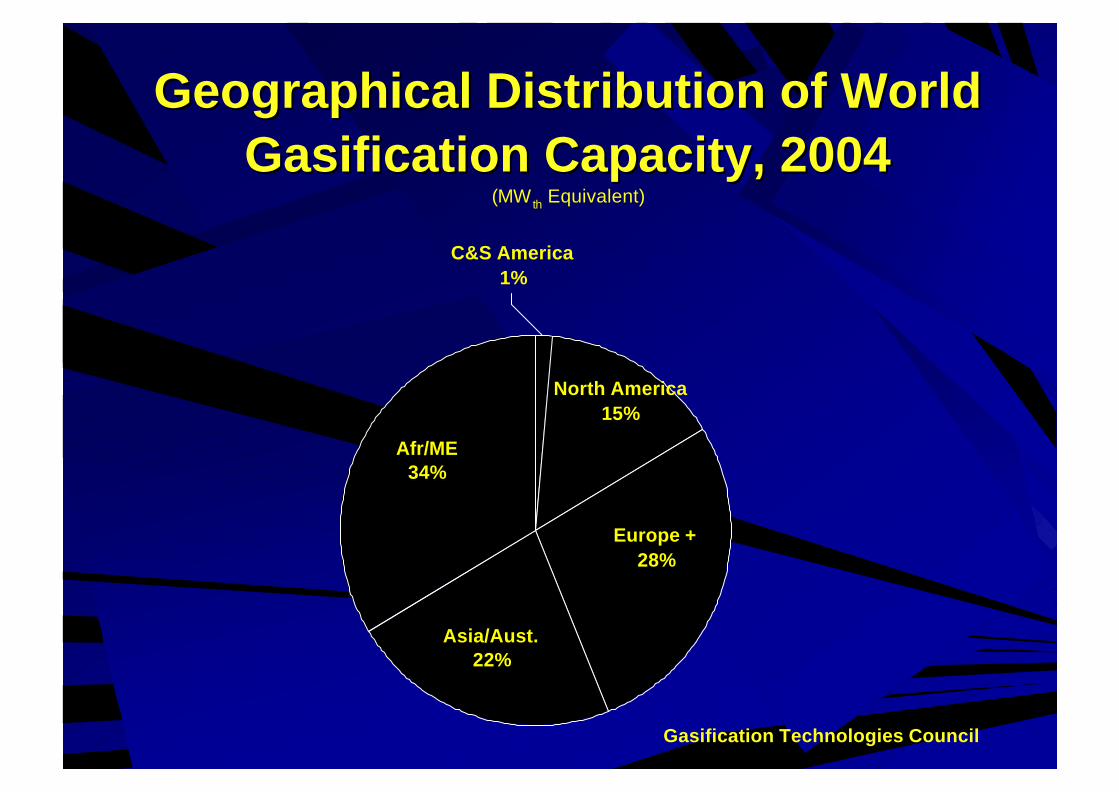
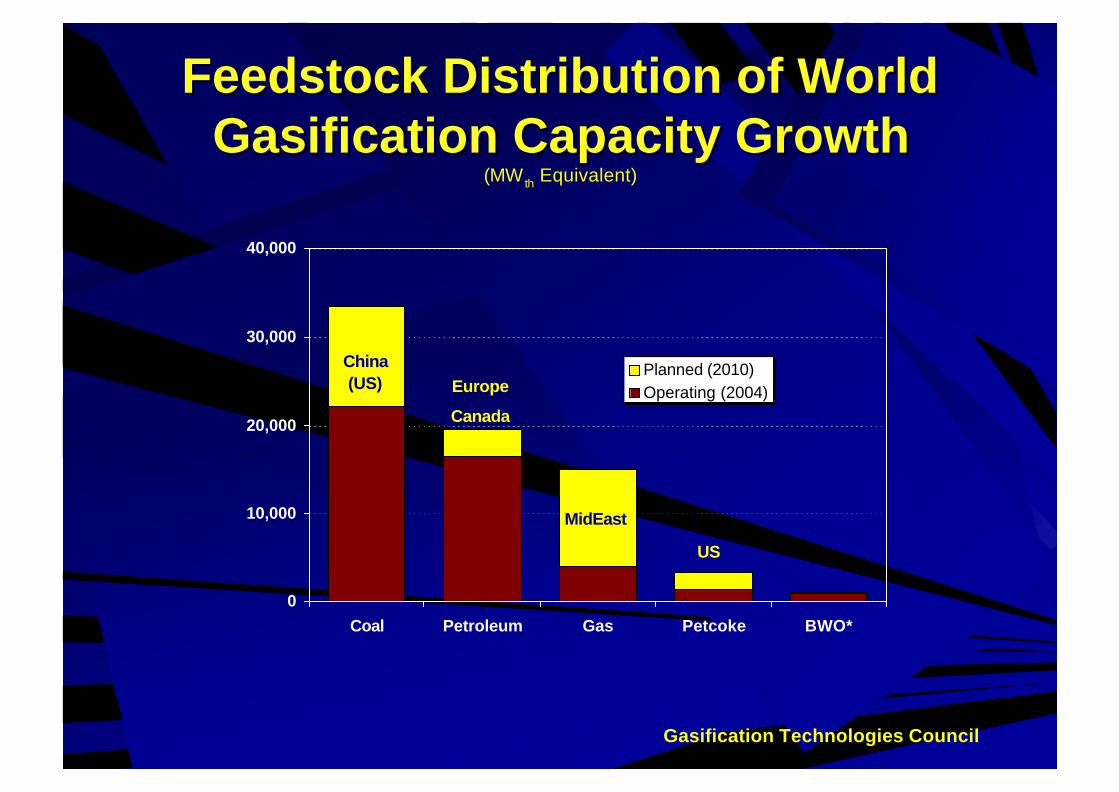
The Gasification IndustryThe Gasification Industry2004 World Gasification Survey2004 World Gasification Survey
North AmericaNorth AmericaNatural Gas Prices Natural Gas Prices U.S. Coal, Power, Environment (The AEP Model)U.S. Coal, Power, Environment (The AEP Model)U.S. Petcoke in Refineries (Hydrogen, Power)U.S. Petcoke in Refineries (Hydrogen, Power)Possible Public Sector Incentives ($$ + Regulations)Possible Public Sector Incentives ($$ + Regulations)Canada Canada –– Oil Sands, CoalOil Sands, Coal
Gasification Technologies CouncilGasification Technologies Council
U.S. Gasification DriversIncreasing demand for electricityIncreasing demand for electricityHigh natural gas & petroleum prices affecting power and High natural gas & petroleum prices affecting power and manufacturing industriesmanufacturing industriesDrive for cleaner fuels (refinery HDrive for cleaner fuels (refinery H22, F, F--T)T)Expectations of more stringent criteria emissions +Hg Expectations of more stringent criteria emissions +Hg limitslimitsExpectations of COExpectations of CO22 limitslimitsDesire to keep coal in the energy mixDesire to keep coal in the energy mixStrong Technology Providers, Alliances & Guarantees Strong Technology Providers, Alliances & Guarantees (ConocoPhillips, GE Energy, Shell Global Solutions)(ConocoPhillips, GE Energy, Shell Global Solutions)AEP, Cinergy announce plans to build commercial scale AEP, Cinergy announce plans to build commercial scale coalcoal--IGCC plants. Calpine considering petcoke IGCC.IGCC plants. Calpine considering petcoke IGCC.Other IGCC, Polygen projects in design, developmentOther IGCC, Polygen projects in design, development
Gasification Technologies CouncilGasification Technologies Council
U.S. Wellhead Natural Gas Price ($/mcf)U.S. Wellhead Natural Gas Price ($/mcf)