Page 1
Trade Negotiations & U.S.
Agriculture:
Prospects & Issues for the
Future Parr Rosson
Professor & Director
Center for North American Studies
Department of Agricultural Economics
Texas A&M University
CNAS
Page 2
Overview
International Setting & Trade Strategy
Role of Trade Agreements
The World Trade Organization Negotiations in Doha Development Agenda
DS 267, ‘Cotton Case’
Conclusions & Implications
Page 3
International Setting &
Trade Strategy
Page 4
World Population
US Census Bureau
1990 2000 2001 F2005 F2010 F2015 F2020 0
2
4
6
8
0
2
4
6
8
NA WE I. ASIA EE/FSU D. ASIA
ME AFR LA TOTAL
Billions
6,310
7,570
Ind. + 8%, Dev. + 31%
China, India,
Indonesia
Page 5
GDP Growth Projections
Source: International Financial Statistics January 2005 and projections after 2004 are from Global Insight
(formerly DRI-WEFA), FAPRI 2005 U.S. And World Agricultural Outlook.
5.6
4.94.6 4.5 4.4 4.3 4.2 4.1 4 4 3.9
3.2
2.5 2.5 2.5 2.4 2.4 2.4 2.4 2.4 2.3 2.4
2004 2006 2008 2010 2012 2014
0
1
2
3
4
5
6
7
% Change From Previous Year
Developed Countries Developing Countries
Page 6
Regional GDP Growth Projections
Source: International Financial Statistics January 2005 and projections after 2004 are from Global Insight
(formerly DRI-WEFA), FAPRI 2005 U.S. And World Agricultural Outlook.
2004 2006 2008 2010 2012 20140
1
2
3
4
5
6% Change From Previous Year
Africa Asia Latin America Middle East
China + 6.5%
India + 5.4%
Page 7
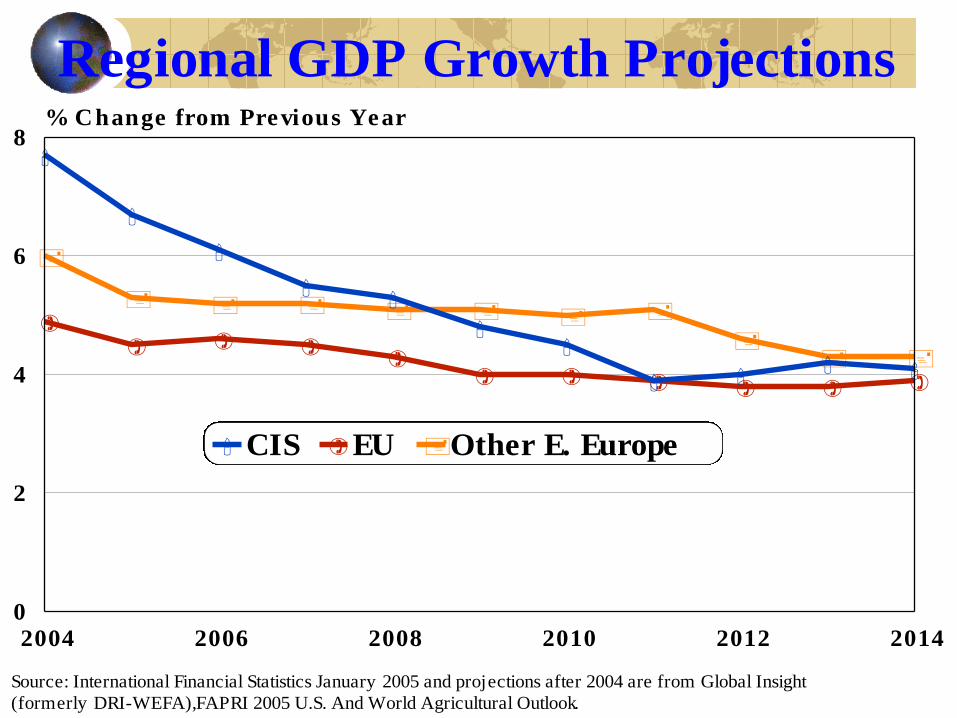
Regional GDP Growth Projections
Source: International Financial Statistics January 2005 and projections after 2004 are from Global Insight
(formerly DRI-WEFA), FAPRI 2005 U.S. And World Agricultural Outlook.
2004 2006 2008 2010 2012 2014
0
2
4
6
8% Change from Previous Year
CIS EU Other E. Europe
Page 8
U.S. Agricultural Trade, 1970 - 2005E
Source: U.S. Trade Internet System, www.fas.usda.gov/ustrade
1970 1975 1980 1985 1990 1995 2000 2005E
$0.0
$20.0
$40.0
$60.0
$80.0
-$20.0
-$40.0
-$60.0
Billion Dollars
Exports Imports Balance
Page 9
U.S. Tariffs, 1789-2004
Statistical Abstract of the United States
1789 1816 1820 1840 1860 1880 1900 1920 1940 1960 1980 2000 0
10
20
30
40
50
60
70 Percent
0
10
20
30
40
50
60
70
Tariff of Abominations, 1828
Morrill Act, 1861
Smoot-Hawley Tariff, 1930
Generalized System
of Preferences, 1968
Fordney-McCumber
Tariff, 1922
GATT, 1947
WTO,
1995
Page 10
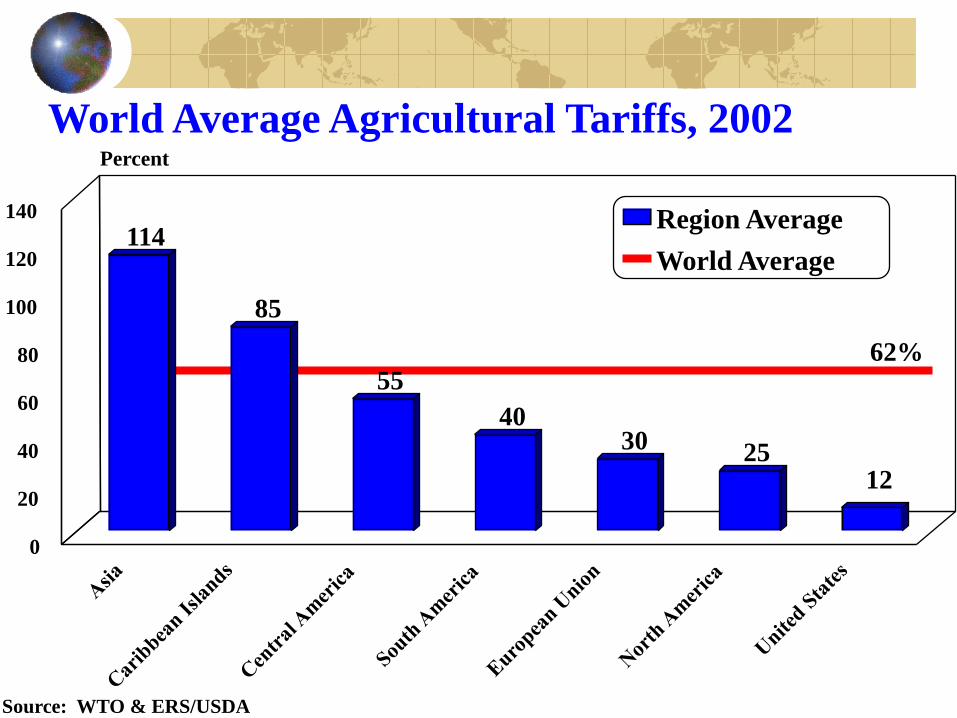
World Average Agricultural Tariffs, 2002
Source: WTO & ERS/USDA
114
85
55
40 30 25
12
0
20
40
60
80
100
120
140
Percent
Region Average
World Average
62%
Page 11
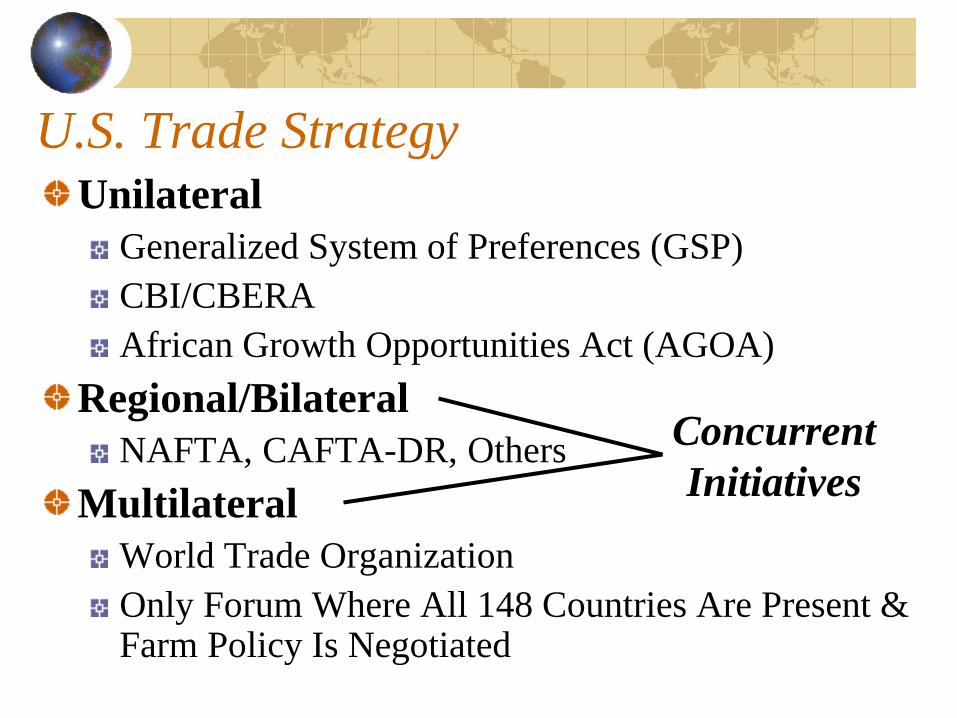
U.S. Trade Strategy
Unilateral
Generalized System of Preferences (GSP)
CBI/CBERA
African Growth Opportunities Act (AGOA)
Regional/Bilateral
NAFTA, CAFTA-DR, Others
Multilateral
World Trade Organization
Only Forum Where All 148 Countries Are Present & Farm Policy Is Negotiated
Concurrent
Initiatives
Page 13
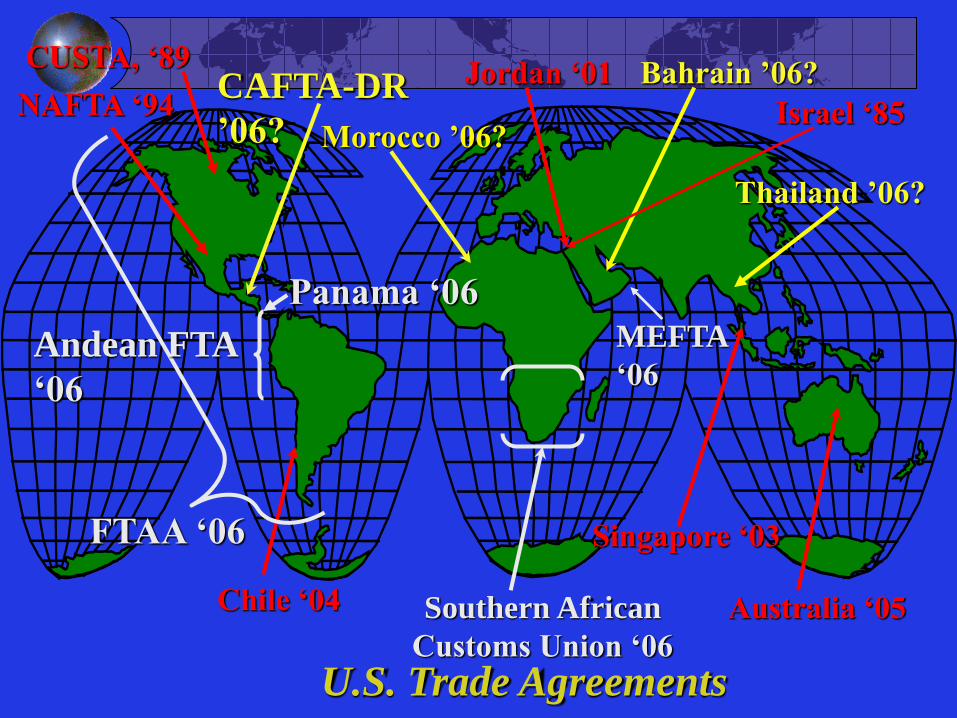
Australia ‘05
Bahrain ’06? CAFTA-DR
’06?
Chile ‘04
FTAA ‘06
Morocco ’06?
Southern African
Customs Union ‘06
Singapore ‘03
Jordan ‘01
U.S. Trade Agreements
NAFTA ‘94 Israel ‘85
CUSTA, ‘89
Andean FTA
‘06
Panama ‘06
Thailand ’06?
MEFTA
‘06
Page 14
Trade Agreements In-Place (7)
Israel-1985-1994
Canada-US
(CUSTA)-1989-1998
North America
(NAFTA)-1994-2008
US-Mexico
US-Canada
Canada-Mexico
Jordan-December
17, 2001-2010
Chile-January 1,
2004-2015
Singapore-May 6
2003-2012
Australia-January 1,
2005-2022
Page 15
Trade Agreements-Pending (9)
Morocco-President Signed 8/17/04, Pending Signature, King of Morocco
CAFTA-DR-Signed by President, Passed El Salvador, Guatemala, Honduras (20 Years)
Bahrain-Pending Submission to Congress
Panama-Nine
Negotiating Sessions
Held, Panama Delays
Colombia, Ecuador,
Peru (ANDEAN)-
Nine Rounds,
Negotiations Continue
Thailand-Three
Rounds Held
Page 16
Trade Agreements-Pending (9)
Southern African Customs Union (SACU): Botswana, Namibia, Lesotho, Swaziland, South Africa-Six Rounds Held
Oman-Two Rounds of Negotiations Held, Part of Middle East Free Trade Area (MEFTA)
United Arab Emirates-Two Rounds Held, part of MEFTA
Page 17
Why Regional Agreements?
2d Best After MTN WTO Has Been Slower than Desired
Outcome is Uncertain
Economic Incentives Open Markets
Increase Business Efficiency
Keep Pressure on MTN to Perform
Any One Agreement-Small Impact, Taken Together-Large Impact
Page 18
Strategic Considerations
Secure Key Strategic Materials
Oil, Fertilizer, Natural Gas
Stem Illegal Immigration by Creating
Economic Opportunity in Other Countries
Create ‘Buffer Zone’ Against Terrorism
(Thomas Barnett & 9/11 Commission
Report)
Page 19
Doha Development Agenda in the
World Trade Organization (2001-?
Preparing for the Hong
Kong Ministerial
December 8-13, 2005
Page 20
Three Pillars of Trade Reform
(Agreed in Concept August 1, 2004)
Market Access: Reductions in
Tariffs
Export Competition: Elimination
of Export Subsidies
Trade Distorting Domestic
Support: Reductions Over Time
Page 21
Market Access Highest Tariffs Cut the Most
U.S. Pushing for Deep Tariff Cuts by
Developing Countries (60-75%)
Issue: Many Developing Countries
Want ‘Special’ Treatment & Some
Reluctant to Agree to Large Cuts
Much Left ‘To Be Negotiated’ &
A Potential ‘Deal Breaker’
Page 22
Export Competition
Reduce & Eliminate Export Subsidies by Date Certain (Agreed)
EU Export Subsidies, $2+ Billion/Year
U.S. Export Credit Guarantees > 180 Days
Food Aid to Be Disciplined
Strong Support for Export Competition Reforms
Page 23
Trade Distorting Domestic Support Programs that Cause Production to Be Different
than Would Be Without Programs
Year 1 Cut of 20%
Subsequent Phased Reductions • 40-50% Range
Reductions from Allowable Support
Issue: Developing Countries Wanted Cuts Now, Tariff Reductions Later
If Big 3 Don’t Make Substantial Cuts, A ‘Deal Breaker’
Page 24
Agricultural Producer Support By Country 1986-88 and 2001-03
-Percent of Total Farm Receipts from Government-
Source: OECD's database (see www.oecd.org)
12%
33%
26%
40%
62%
71%
2%
20% 20%
39%
60% 65%
New Zealand Canada United States EU Japan Korea 0%
20%
40%
60%
80% 1986-1988
2001-2003
Page 25
Total Allowable Trade Distorting Domestic
Support, 'The Big 3,‘ 2002
WTO, Trade Policy Review and calculations.
$128
$49 $48
European Union United States Japan $0
$20
$40
$60
$80
$100
$120
$140
Billion $
Includes Amber + Blue Boxes, Product Specific
+ Non-product Specific De Minimis, Each Based
on 5% of Total Value of Agricultural Production
Page 26
Total Trade Distorting Domestic Support Remaining
After Year 1 Down Payment (calculated)
$100.2
$39.2 $38.4
European Union United States Japan $0.0
$20.0
$40.0
$60.0
$80.0
$100.0
$120.0
Billion $
Page 27
Total Trade Distorting Domestic Support
Assuming 50 Percent Reduction
Calculated
$50.1
$19.6 $19.2
European Union United States Japan $0.0
$10.0
$20.0
$30.0
$40.0
$50.0
$60.0 -Billion Dollars-
Page 28
Real Income Effects of Liberalization of Global Merchandise Trade, by Country, 2015
-Impacts in 2015 Relative to the Baseline (2001 dollars)-
Source: Anderson, Martin and van der Mensbrugghe (2005a, Table 12.3)
$60.4
$12.3
$52.2 $44.2
$10.9 $12.9
$190.9
$142.1
$277.9
EU 25
United States
Japan Korea and
Taiwan
Brazil
Middle East High-income
Countries Developing
Countries
World Total
$0.0
$50.0
$100.0
$150.0
$200.0
$250.0
$300.0
$350.0 -Billion Dollars-
Page 29
Impacts of Doha on Agricultural Output and
Employment Growth, by Country, 2005-2015
-Annual Average Growth Rate (Percent)-
Source: Anderson, Martin and van Mensbrugghe (2005a, Tables 12.12 and 12.13)
4.3%
1.7%
-0.4%
-1.4%
1.6%
4.4% 4.4%
1%
-1.4%
-2.8%
-4.1%
-2.1%
2.2%
1.1%
Canada
United States
EU 25
Japan
Korea and Taiwan
Brazil
New Zealand
0%
2%
4%
6%
-2%
-4%
-6%
Output
Employment
Page 30
Trade Liberalization Impacts on Factor Prices, 2015
Anderson, Martin, and van der Mensbrugghe (2005a, Table 12.7).
Skilled WagesUnskilled
Wages
Land Owner
RentInflation
EU 25 1.3 -0.1 -71 -1.2
United States 0.2 0 -24 -0.3
Japan 2.4 1.5 -67.2 -0.2
Korea and Taiwan 7.8 7.3 -45.8 -1.3
Brazil 1.4 2.8 35.9 2.8
Sub-Saharan Africa 5.7 8.4 6.4 -4.3
Thailand 6.3 13.4 12.5 -0.2
Vietnam 15.1 23.3 5.8 -0.2
New Zealand 1.1 3.5 20.9 1.5
Percent Change
Large
Gains
Page 31
Conclusions and Implications
Page 32
Conclusions & Implications
U.S. Market Is Open, Rest of World Is Not
U.S. Export Growth Lags Import Growth
Agricultural Trade Distorted by Tariffs, Export Subsidies, Trade Distorting Domestic Support
U.S. Pushing for Deep Tariff Cuts by Developing Countries To Open More Markets for U.S. Exports
Little Agreement on How Much Tariffs Might Be Cut
Page 33
Conclusions & Implications Reductions in Trade Distorting Domestic Support Likely Substantial
Some Adjustment for U.S. Producers
Absent WTO Progress, World Trade & Economic Growth Stifled, Especially in Agriculture-Not Good for U.S. Agriculture
Cotton Case Could Figure in Outcome U.S. Response
Other Cases (Rice, Soybeans??)
Trade Reform is at a Crossroads: Protection or Progress?
If Export Markets Are Important, Trade Agreements & WTO Progress Are Necessary
Page 34
Thank You!
Questions?
Parr Rosson
Department of Agricultural Economics
Texas A&M University
College Station, TX 77843-2124
E-mail: [email protected]
Telephone: 979-845-3070
CNASCNAS