The China Syndrome: Local Labor Market Effects of Import Competition in the US David Autor David Dorn Gordon Hanson MIT and NBER CEMFI and IZA UCSD and NBER June 2011 Autor-Dorn-Hanson (MIT-CEMFI-UCSD) The China Syndrome May 2011 1 / 50
Transcript
The China Syndrome: Local Labor Market Effects ofImport Competition in the US
David Autor David Dorn Gordon Hanson
MIT and NBER CEMFI and IZA UCSD and NBER
June 2011
Autor-Dorn-Hanson (MIT-CEMFI-UCSD) The China Syndrome May 2011 1 / 50
The China Syndrome Introduction
How has import competition affected US labor markets?
Trade and labor market, round one:
Literature on rising wage inequality in the early 1990s
Skill biased technical change is more important than tradeGlobal outsourcing affects demand for skill but only modestlyTrade with low income countries is too small to have major effects
Trade and labor market, round two:
Since 1990, trade with low wage countries has grown dramatically
Low-wage country share in US imports: 3% in 1991, 12% in 2007China accounts for 92% of this growthThe literature is just beginning to assess the consequences
Autor-Dorn-Hanson (MIT-CEMFI-UCSD) The China Syndrome May 2011 2 / 50
The China Syndrome Introduction
Ratio of Chinese imports to U.S. domestic consumption
Source: Gordon
Figure 1.Import Penetration Ratio for U.S. Imports from China.
Table 1. Value of Trade with China for the U.S. and Other Selected High-Income Countries and Value of Imports from all other Source Countries, 1991/1992-2007.
Notes: Trade data is reported for the years 1991, 2000, and 2007, except for exports to China which are first available in 1992. The set of "Other Developed Countries" in Panel B comprises Australia, Denmark, Finland, Germany, Japan, New Zealand, Spain, and Switzerland. Column 3 covers imports from all countries that have been classified as low-income by the World Bank in 1989, except for China. Column 4 covers imports from Mexico and the Central American and Carribean countries covered by the CAFTA-DR free trade agreement. Column 5 covers imports from all other countries (primarily from developed countries).
II. Imports from Other Countries (in BN 2007 US$)I. Trade with China (in BN 2007 US$)
B. 8 Other Developed Countries
A. United States
Autor-Dorn-Hanson (MIT-CEMFI-UCSD) The China Syndrome May 2011 4 / 50
Autor-Dorn-Hanson (MIT-CEMFI-UCSD) The China Syndrome May 2011 5 / 50
The China Syndrome Theoretical motivation
Agenda
1 Theoretical motivation2 Empirical strategy
Defining local labor markets, data sourcesRegression specification, IV strategy
3 Manufacturing employment results
IV estimatesGravity-based estimates, other results
4 Beyond manufacturing
Population, unemployment, labor force statusEmployment and earnings in non-manufacturingGovernment transfersNet imports, gravity (again), factor content of trade
5 Comparing gains from trade with trade-induced DWL
Autor-Dorn-Hanson (MIT-CEMFI-UCSD) The China Syndrome May 2011 6 / 50
The China Syndrome Theoretical motivation
Consider a commuting zone (CZ) as a small open economy
Each CZ supplies the broader US market (and rest of the world)
Suppose China has productivity growth or a fall in trade costs
What is the impact on the demand for goods produced by a CZ?
Motivate trade shocks using Eaton and Kortum ‘02
Xnij =Tij (wijτnij )
−θ
ΦnjXnj , Φnj ≡
∑h Thj(whjτnhj)
−θ
CZ i ’s sales in industry j to destination market n areTij is productivity of industry j in CZ iwij is unit production cost of industry j in CZ iτnij is trade cost between CZ i and market nΦnj captures productivity, unit costs, trade costs of suppliers to marketn (incl. China)Xnj is “toughness” of industry j in market nθ is productivity dispersion parameter
Autor-Dorn-Hanson (MIT-CEMFI-UCSD) The China Syndrome May 2011 7 / 50
The China Syndrome Theoretical motivation
Effect of China’s ∆TFP or ∆τ on CZ’s product demand
Impact of China imports on CZ’s outputProductivity growth in China or a reduction in US trade barriers onChinese goods increases market toughness facing CZ iDerive the log change in demand for goods produced by CZ i that isdue to China is given by
Qi = −∑
j
Xuij
Xuj
Xucj(Acj − θτcj)Qi
Xuij/Xuj is CZ i ’s sales as a share of US purchases in industry jQi is total output in CZ iXucj (Acj − θτcj ) is growth in US imports from China due to China’sproductivity growth and change in trade costs facing China
Qi is an exposure indexAllocates exogenous component of ∆China goods imports to CZ’saccording to their output of those goods
Autor-Dorn-Hanson (MIT-CEMFI-UCSD) The China Syndrome May 2011 8 / 50
The China Syndrome Theoretical motivation
Proxying for ∆ Chinese import exposure at CZ level
Empirical proxy for ∆ CZ’s import exposure:
∆IPWuit =∑
j
Eijt
Ejt
∆Mucjt
Eit
Allocates to each CZ a share of total national import growthDivides this import value by a CZ’s total employmentYields measure of “import growth per worker” (in $1,000’s of USD)
Note two sources of variation in this measure:Variation in CZ’s manufacturing industry mixOverall manufacturing employment share in CZ(By controlling for initial manufacturing employment in CZs,identification comes from variation in industry mix)
Autor-Dorn-Hanson (MIT-CEMFI-UCSD) The China Syndrome May 2011 9 / 50
The China Syndrome Theoretical motivation
IV strategy: Exogenous variation in Chinese import shocks
Concern:U.S imports from China may be affected by U.S. demand shocks ratherthan just China’s growing productivity and falling trade costs
Approach:Instrument for ∆IPWit using other high-income countries’ importsfrom China (and lagged CZ employment)
∆IPWoit = −∑
j
Euijt−10
Eujt−10
[∆Mocjt
Eit−10
]Rationale: China’s export growth driven by...
Rural to urban migration (over 150m migrants moved to cities)Opening to foreign investments, technology, imported inputsWTO accession in 2001 (reduction in trade barriers)
China’s opening allowed it to realize its latent comparative advantagewith result being similar export bundles going to high income markets
Autor-Dorn-Hanson (MIT-CEMFI-UCSD) The China Syndrome May 2011 10 / 50
The China Syndrome Empirical strategy
Agenda
1 Theoretical motivation2 Empirical strategy
Defining local labor markets, data sourcesRegression specification, IV strategy
3 Manufacturing employment results
IV estimatesGravity-based estimates, other results
4 Beyond manufacturing
Population, unemployment, labor force statusEmployment and earnings in non-manufacturingGovernment transfersNet imports, gravity (again), factor content of trade
5 Comparing gains from trade with trade-induced DWL
Autor-Dorn-Hanson (MIT-CEMFI-UCSD) The China Syndrome May 2011 11 / 50
The China Syndrome Empirical strategy
Definition of commuting zones (Tolbert and Sizer 1996)
Based on commuting patterns among countries in 1990Cluster all mainland U.S. counties in 722 commuting zones (CZ),characterized by strong commuting ties within a CZ and weakcommuting across CZsCan map Census Public Use Micro Areas to CZs
Autor-Dorn-Hanson (MIT-CEMFI-UCSD) The China Syndrome May 2011 12 / 50
The China Syndrome Empirical strategy
Data sources (time periods 1990-2000, 2000-2007)
Autor-Dorn-Hanson (MIT-CEMFI-UCSD) The China Syndrome May 2011 13 / 50
The China Syndrome Empirical strategy
Chinese import exposure by CZ
∆ China imports per worker (in 1,000s of US$) across CZs
Appendix Table 1. Descriptive Statistics for Growth of Imports Exposure per Worker across C'Zones
I. 1990-2000
A. Percentiles
Over all CZ’s:
75/25 pctile ∆: $1,510 in 2000-2007 (over 10 yrs)
75/25 pctile ∆: $700 in 1990-2000
Average per decade over 1990-2007: $1,105
Autor-Dorn-Hanson (MIT-CEMFI-UCSD) The China Syndrome May 2011 14 / 50
The China Syndrome Empirical strategy
Import exposure 1990-07 (cond’l on manufacturing emp)
(A) Largest Increase in Exposure
1. San Jose, CA 2. Raleigh, NC 3. Providence, RI
(B) Smallest Increase in Exposure
1. Detroit, MI 2. Grand Rapids, MI 3. SeaAle, WA
Among 50 Largest Commu1ng Zones
Autor-Dorn-Hanson (MIT-CEMFI-UCSD) The China Syndrome May 2011 15 / 50
The China Syndrome Empirical strategy
Estimation
Regression model:
∆yit = γt + β0∆IPWuit + X′itβ1 + eit
where:
∆yit is 10-year equivalent change of emp, pop, wages, or transfersγt is a period effect (time periods 1990–2000, 2000–2007)∆IPWuit is import exposureXit contains start of period CZ manufacturing employment share andCZ demographicsObservations weighted by CZ population; SEs clustered by state
Instrumental variable:∆IPWuit instrumented by ∆IPWoit
Autor-Dorn-Hanson (MIT-CEMFI-UCSD) The China Syndrome May 2011 17 / 50
The China Syndrome Results: Change in Manufacturing Employment
-10 0 10 20 30 40 50Change in Import Exposure per Worker (in kUSD)
Change in Manufacturing Emp by Commuting Zone, 1990-2007
coef = -.15170815, (robust) se = .05144987, t = -2.95
-10
-50
510
Chan
ge %
Man
ufac
turin
g Em
p in
Wor
king
Age
Pop
-10 -5 0 5 10Change in Import Exposure per Worker (in kUSD)
Change in Manufacturing Emp by Commuting Zone, 1990-2007
coef = -.23720656, (robust) se = .05186049, t = -4.57
Increase in Chinese import exposure related to decline in working agepop in manufacturing
Outliers in ∆IPWuiτ (small CZ’s) appear to attenuate estimates2nd graph drops 15 CZs > 5 SDs from median ∆IPWuiτ (< 1% of pop)
Autor-Dorn-Hanson (MIT-CEMFI-UCSD) The China Syndrome May 2011 18 / 50
The China Syndrome Results: Change in Manufacturing Employment
2SLS first stage and reduced form estimates
coeffse
Panel A: 2SLS 1st Stage Regression, Full Sample Panel B: OLS Reduced Form Regression, Full Sample
-10
010
2030
4050
Chan
ge in
Impo
rt Ex
posu
re p
er W
orke
r (in
kUS
D)
-10 0 10 20 30Chg in Predicted Import Exposure per Worker (in kUSD)
First Stage Regression, 1990-2007
coef = .81509554, (robust) se = .09176862, t = 8.88
-15
-10
-50
510
Chan
ge %
Man
ufac
turin
g Em
p in
Wor
king
Age
Pop
-10 0 10 20 30Chg in Predicted Import Exposure per Worker (in kUSD)
Change in Manufacturing Emp by Commuting Zone, 1990-2007
coef = -.33976267, (robust) se = .07116474, t = -4.77
Note: Plot controls for CZ’s initial manufacturing employment share
Autor-Dorn-Hanson (MIT-CEMFI-UCSD) The China Syndrome May 2011 19 / 50
The China Syndrome Results: Change in Manufacturing Employment
Agenda
1 Theoretical motivation2 Empirical strategy
Defining local labor markets, data sourcesRegression specification, IV strategy
3 Manufacturing employment resultsIV estimatesGravity-based estimates, other results
4 Beyond manufacturing
Population, unemployment, labor force statusEmployment and earnings in non-manufacturingGovernment transfersNet imports, gravity (again), factor content of trade
5 Comparing gains from trade with trade-induced DWL
Autor-Dorn-Hanson (MIT-CEMFI-UCSD) The China Syndrome May 2011 20 / 50
The China Syndrome Results: Change in Manufacturing Employment
2SLS estimates for 1990–2007 and prior decades
(1) (2) (3) (4) (5) (6)
-0.89 ** -0.72 ** -0.75 **(0.18) (0.06) (0.07)
0.43 ** -0.13 0.15(0.15) (0.13) (0.09)
Table 2. Imports from China and Change of Manufacturing Employment in Commuting Zones, 1970-2007: 2SLS Estimates.
Dependent Variable: 10 x Annual Change in Manufacturing Emp/Working Age Pop (in %pts)
1990-2000
2000-2007
1970-1980
1980-1990
I. 1990-2007 II. 1970-1990 (Pre-Exposure)
1990-2007
1970-1990
(! Current Period Imports from China to US)/Worker
Notes: N=722, except N=1444 in stacked first difference models of columns 3 and 6. The variable 'future period imports' is defined as the average of the growth of a CZ's import exposure during the periods 1990-2000 and 2000-2007. All regressions include a constant and the models in columns 3 and 6 include a time dummy. Robust standard errors in parentheses are clustered on state. Models are weighted by start of period commuting zone share of national population. ~ p ! 0.10, * p ! 0.05, ** p ! 0.01.
(! Future Period Imports from China to US)/Worker
Autor-Dorn-Hanson (MIT-CEMFI-UCSD) The China Syndrome May 2011 21 / 50
The China Syndrome Results: Change in Manufacturing Employment
Table 3. Imports from China and Change of Manufacturing Employment in CZs 1990-2007Dependent Var: 10 x Annual Change in Manufacturing Emp/Working Age Pop (in %pts)
(Δ Imports from China to US)/Worker
Percentage of employment in manufacturing-1
Notes: N=1444 (722 commuting zones x 2 time periods). Robust standard errors in parentheses are clustered on state. Models are weighted by start of period commuting zone share of national population. ~ p ≤ 0.10, * p ≤ 0.05, ** p ≤ 0.01.
Percentage of employment among women-1
Percentage of employment in routine occupations-1
Average offshorability index of occupations-1
Percentage of college-educated population-1
Percentage of foreign-born population-1
Autor-Dorn-Hanson (MIT-CEMFI-UCSD) The China Syndrome May 2011 22 / 50
The China Syndrome Results: Change in Manufacturing Employment
R2 0.20 0.29 0.39 0.43 0.47 0.48Notes: N=1444 (722 commuting zones x 2 time periods). The mean (and standard deviation) of the change in gravity residual is 1.402 (1.788). Robust standard errors in parentheses are clustered on state. Models are weighted by start of period commuting zone share of national population. ~ p ≤ 0.10, * p ≤ 0.05, ** p ≤ 0.01.
Percentage of employment among women-1
Percentage of employment in routine occupations-1
Average offshorability index of occupations-1
Gravity Residuals and Change of Manufacturing Employment in CZs: OLS Estimates.Dependent Variable: 10 x Annual Change in Manufacturing Emp/Working Age Pop (in %pts)
Δ Comparative Advantage China (Gravity Residual)
Percentage of college-educated population-1
Percentage of foreign-born population-1
Percentage of employment in manufacturing-1
Autor-Dorn-Hanson (MIT-CEMFI-UCSD) The China Syndrome May 2011 26 / 50
The China Syndrome Results: Change in Manufacturing Employment
Magnitudes: Impact on manufacturing employment
∆ U.S. manufacturing Emp/Pop fell by 33% between 1990 and 2007:
1990 - 2000: −2.07%. 2000 - 2007: −2.73%
∆ Chinese imports per U.S. worker:
1990 - 2000: $1,1402000 - 2007: $2,630Estimate ∼ 48% of ∆ Chinese imports driven by supply shock
∆ Chinese imports → ∆U.S. manufacturing Emp/Pop (pct points):1990-00 2000-07
OLS −0.33% −0.75%Gravity −0.18% −0.42%
Pct of ∆ U.S. Manuf Emp/Pop caused by ∆China exposure:1990 - 2000: 8% to 16%2000 - 2007: 14% to 28%1990 - 2007: 11% to 23%
Autor-Dorn-Hanson (MIT-CEMFI-UCSD) The China Syndrome May 2011 27 / 50
The China Syndrome Results: Change in Manufacturing Employment
Other results
1 Falsification exerciseRegress past change in manuf emp/pop on future import exposure
2 Expanding measure of importsImports from China plus other low income countriesImports from China plus Mexico and DR/CAFTA
3 Excluding industriesDrop computer industryDrop apparel, textiles, and footwearDrop industries used as inputs in construction
Autor-Dorn-Hanson (MIT-CEMFI-UCSD) The China Syndrome May 2011 30 / 50
The China Syndrome Beyond Manufacturing
Agenda
1 Theoretical motivation2 Empirical strategy
Defining local labor markets, data sourcesRegression specification, IV strategy
3 Manufacturing employment results
IV estimatesGravity-based estimates, other results
4 Beyond manufacturingPopulation, unemployment, labor force statusEmployment and earnings in non-manufacturingGovernment transfersNet imports, gravity (again), factor content of trade
5 Comparing gains from trade with trade-induced DWL
Autor-Dorn-Hanson (MIT-CEMFI-UCSD) The China Syndrome May 2011 31 / 50
The China Syndrome Beyond Manufacturing
Migration responses?
Does decline in manufacturing employment cause fall inworking-age pop?
∆ lnPopiτ = γτ + β1∆IPWuiτ + X ′itβ2 + ecτ
Local effects of import shocks may partly diffuse through migrationbetween CZs
Literature suggests that migration responses are sluggish (Blanchardand Katz, 1991; Bound and Holzer, 2000; Notowidigdo, 2010)
Autor-Dorn-Hanson (MIT-CEMFI-UCSD) The China Syndrome May 2011 32 / 50
The China Syndrome Beyond Manufacturing
Effect of import exposure on CZ working age pop
All College Non-College Age 16-34 Age 35-49 Age 50-64(1) (2) (3) (4) (5) (6)
Table 4. Imports from China and Change of Working Age Population within Commuting Zones, 1990-2007Dependent Variables: 10-Year Equivalent Log Changes in Headcounts (in log pts)
Notes: N=1444 (722 commuting zones x 2 time periods). Robust standard errors in parentheses are clustered on state. Models are weighted by start of period commuting zone share of national population. ~ p ≤ 0.10, * p ≤ 0.05, ** p ≤ 0.01.
II. By Age GroupI. By Education Level
B. Full Controls
A. No Census Division Dummies or Other Controls
(Δ Imports from China to US)/Worker
Autor-Dorn-Hanson (MIT-CEMFI-UCSD) The China Syndrome May 2011 33 / 50
The China Syndrome Beyond Manufacturing
Effect of import exposure on emp status by education
Table 5. Imports from China and Employment Status of Working Age Pop, 1990-2007: 2SLS Estimates
Dep Var: 10-Year Equivalent Changes in Pop Shares by Emp Status (%pts)
Notes: N=1444 (722 commuting zones x 2 time periods). All statistics are based on working age individuals (age 16 to 64). Robust standard errors in parentheses are clustered on state. Models are weighted by start of period commuting zone share of national population. ~ p ! 0.10, * p ! 0.05, ** p ! 0.01.
All Education Levels
(! Imports from China to US)/Worker
College Education
(! Imports from China to US)/Worker
No College Education
(! Imports from China to US)/Worker
Mfg Emp/Pop
Non-Mfg Emp/Pop
Unemp/Pop
NILF/Pop
Autor-Dorn-Hanson (MIT-CEMFI-UCSD) The China Syndrome May 2011 34 / 50
The China Syndrome Beyond Manufacturing
Emp and earnings ∆’s: Manufacturing and non-manuf
All Non- All Non-Workers College College Workers College College
Table 7. Employment and Wage Changes in Manufacturing and outside Manufacturing, 1990-2007Dep Vars: 10-Year Equiv. Changes in Log Workers (in Log Pts) and Avg Log Weekly Wages (in %)
I. Manufacturing Sector II. Other Sectors
Notes: N=1444 (722 commuting zones x 2 time periods). Models are weighted by start of period commuting zone share of national population. ~ p ≤ 0.10, * p ≤ 0.05, ** p ≤ 0.01.
A. Log Change in Number of Workers
(Δ Imports from China to US)/Worker
B. Change in Average Log Wage
(Δ Imports from China to US)/Worker
Autor-Dorn-Hanson (MIT-CEMFI-UCSD) The China Syndrome May 2011 37 / 50
The China Syndrome Beyond Manufacturing
Agenda
1 Theoretical motivation2 Empirical strategy
Defining local labor markets, data sourcesRegression specification, IV strategy
3 Manufacturing employment results
IV estimatesGravity-based estimates, other results
4 Beyond manufacturing
Population, unemployment, labor force statusEmployment and earnings in non-manufacturingGovernment transfersNet imports, gravity (again), factor content of trade
5 Comparing gains from trade with trade-induced DWL
Autor-Dorn-Hanson (MIT-CEMFI-UCSD) The China Syndrome May 2011 38 / 50
Table 8. Imports from China and Change of Government Transfer Receipts in Commuting Zones, 1990-2007Dep Vars: 10-Year Equivalent Log and Dollar Change of Annual Transfer Receipts per Capita (in log pts and US$)
Δ Chinese Imports/ Worker
Δ Chinese Imports/ Worker
Notes: N=1444 (722 commuting zones x 2 time periods), except N=1436 in column 2, panel A. Models are weighted by start of period commuting zone share of national population. ~ p ≤ 0.10, * p ≤ 0.05, ** p ≤ 0.01.
Total Xfers
TAA Benefits
A. Log Change of Transfer Receipts per Capita
B. Dollar Change of Transfer Receipts per Capita
SSA Dis-ability
Medical Benefits
Educ/ Training
Assist
Unemp-loyment Insure
SSA Re-tirement
Federal Income Assist
Other Income Assist
Autor-Dorn-Hanson (MIT-CEMFI-UCSD) The China Syndrome May 2011 39 / 50
Notes: N=1444 (722 commuting zones x 2 time periods). Per capita household income is defined as the sum of individual incomes of all working age household members (age 16-64), divided by the number of household members of that age group. Robust standard errors in parentheses are clustered on state. Models are weighted by start of period commuting zone share of national population. ~ p ≤ 0.10, * p ≤ 0.05, ** p ≤ 0.01.
Total
A. Relative Growth (%pts)
Δ Chinese Imports/ Worker
Table 9. Dependent Variable: 10-Year Equivalent Change in Average and Median Annual Household Income per Working-Age Adult (in %pts and US$)
TotalWage- Salary
Business Invest
SocSec +AFDC
Wage- Salary
Median HH Inc./Ad.Average HH Income/Adult by Source
Sources: U.S. Census and American Community SurveyAutor-Dorn-Hanson (MIT-CEMFI-UCSD) The China Syndrome May 2011 40 / 50
The China Syndrome Beyond Manufacturing
Net imports
We have so far ignored exports to China
Examine three measures of net imports1 Net imports per worker in USD (2SLS)
US imports from China – US exports to China
2 Gravity residual (OLS)
Change in China export productivity and trade costs relative to US
3 Net factor content of trade (2SLS)
(US imports from China – US exports to China) × (US labor used perdollar of gross output)
Autor-Dorn-Hanson (MIT-CEMFI-UCSD) The China Syndrome May 2011 42 / 50
Notes: N=1444 (722 commuting zones x 2 time periods). Models are weighted by start of period commuting zone share of national population. ~ p ≤ 0.10, * p ≤ 0.05, ** p ≤ 0.01.
B. 2SLS: Net Imports (Imports-Exports) per Worker (in $1,000s USD)
Δ Net Imports from China/ Worker
A. Reduced Form OLS: Change in China-US Gravity Residual
Δ Chinese Comparative Advantage (Gravity Resid)
Δ Factor Content Net Chinese Imports/ Worker
C. 2SLS: Net Factor Content per Worker (in Workers Equivalents)
Table 10. Key Estimates: Net $ Imports, Net Factor Content of Imports, and Gravity ResidualDependent Variables: 10-Year Equivalent Changes of Indicated Variables
II. Log Wages III. Transfers, Wage Inc
MfgNon-Mfg Mfg
Non-Mfg Wage Inc
Autor-Dorn-Hanson (MIT-CEMFI-UCSD) The China Syndrome May 2011 44 / 50
The China Syndrome Gains from Trade v. Trade-Induced DWL’s
Agenda
1 Theoretical motivation2 Empirical strategy
Defining local labor markets, data sourcesRegression specification, IV strategy
3 Manufacturing employment results
IV estimatesGravity-based estimates, other results
4 Beyond manufacturing
Population, unemployment, labor force statusEmployment and earnings in non-manufacturingGovernment transfersNet imports, gravity (again), factor content of trade
5 Comparing gains from trade with trade-induced DWL
Autor-Dorn-Hanson (MIT-CEMFI-UCSD) The China Syndrome May 2011 47 / 50
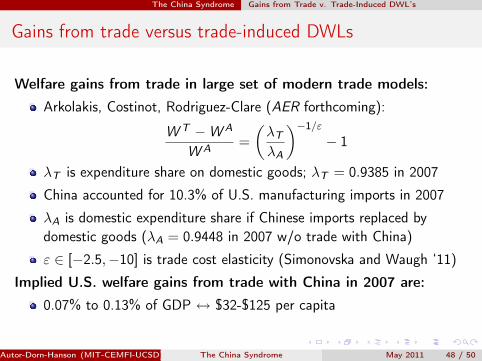
The China Syndrome Gains from Trade v. Trade-Induced DWL’s
Gains from trade versus trade-induced DWLs
Welfare gains from trade in large set of modern trade models:
Consequences for local labor markets:Unemployment and NILF riseJob losses in manufacturing, wage reductions in non-manufacturingDeclining household incomes
Large effect on transfers: ∆$1, 000 China exposure per worker:∆$58 per capita xfer benes (disability, Medicare/Medicaid, cash xfers)
Key implications:
DWLs one to two-thirds as large as estimated (static) gains from trade
Adjustment costs larger than previously appreciated
Autor-Dorn-Hanson (MIT-CEMFI-UCSD) The China Syndrome May 2011 50 / 50


![TheChinaSyndrome: LocalLaborMarketEffectsof ... · ujt j i + h ln ˝ cnjt ˝ unjt n i [ln z cjt z ujt j] isChina’srelativeTFPinindustryj yeart [ ln ˝ cnjt ˝ unjt n] isChina’srel.](https://static.documents.pub/doc/80x56/5e92fe1ef15bf82da619a3e4/thechinasyndrome-locallabormarketeiectsof-ujt-j-i-h-ln-cnjt-unjt.jpg)