\A LABORATORY EVALUATION OF THE DPD AND LEUCO CRYSTAL VIOLET METHODS FOR THE ANALYSIS OF RESIDUAL CHLORINE DIOXIDE IN WATER/ by Norma Jane\, Hood!; Thesis submitted to the Graduate Faculty of the Virginia Polytechnic Institute and State University in partial fulfillment of the requirements for the degree of MASTER OF SCIENCE in Environmental Sciences and Engineering APPROVED: f Grigory D. Boardman Robert C. Hoehn, Chairman October, 1977 Blacksburg, Virginia Robert E. Benoit
Transcript
\A LABORATORY EVALUATION OF THE DPD AND LEUCO
CRYSTAL VIOLET METHODS FOR THE ANALYSIS OF
RESIDUAL CHLORINE DIOXIDE IN WATER/
by
Norma Jane\, Hood!;
Thesis submitted to the Graduate Faculty of the
Virginia Polytechnic Institute and State University
in partial fulfillment of the requirements for the degree of
MASTER OF SCIENCE
in
Environmental Sciences and Engineering
APPROVED:
f Grigory D. Boardman
Robert C. Hoehn, Chairman
October, 1977
Blacksburg, Virginia
Robert E. Benoit
For my Mom and Dad
Their understanding and support
made it all possible.
ii
ACKNOWLEDGMENTS
The author would like to thank Dr. Robert Hoehn for his inspi-
ration and guidance throughout the course of this research, and for
his review of this manuscript. Sincere appreciation is also expressed
to Dr. Robert Benoit and Dr. Gregory Boardman for their help and
service as members of the graduate committee.
The value of the friendship and help given by Mr. Glen Willard
can never be underestimated or forgotten.
The assistance and understanding offered by fellow inmates of
325 Norris will be long remembered, and their friendships treasured.
The author would like to express special gratitude to John Riding,
Bill Elliott, Steve Clark, Ryland Brown, Bill and Jean Lorenz, Perry
Gayle, Pete Shelley, Don Barnes, and Barbara Thompson for their help
in maintaining a proper attitude towards research in particular, and
1 if e in genera 1 •
; ii
TABLE OF CONTENTS
DEDICATION . . .
ACKNOWLEDGMENTS
LIST OF TABLES .
LIST OF FIGURES
Chapter
I.
II.
III.
INTRODUCTION . . .
LITERATURE REVIEW
General Properties of Chlorine Dioxide . Reaction with Phenols ..... Reactions with Organic Compounds .. Taste and Order Control .... Manganese and Iron Remova 1 . . . . . Synthesis of Chlorine Dioxide .. Chlorine Dioxide as a Disinfectant . Alternative Disinfectants Considerations of Water Reuse Residual Analysis
MATERIALS AND METHODS . . . . . .
Basic Laboratory Procedures . Generation of Chlorine Dioxide Stock Chlorine Solutions Working Standards pH Studies . . • • . . . . . . . . . . . DPD Color Development . . . ... Leuco Crystal Violet . . . . .....•.... Statistical Method ...... . Cl02 in the Presence of Chlorine ....•.
iv
Page
ii
iii
vi
ix
1
3
3 6 8
10 11 12 14 20 23 24
35
35 35 37 39 39" 40 41 44 44
Chapter
IV.
v. VI.
APPENDIX
A
B
c VITA ••
ABSTRACT
Page
RESULTS AND DISCUSSION ...•. 47
pH Studies . . . • . • • . . • . . . • . . . . . . . 47 Spontaneous Color Development 54 Statistical Analyses . . . • . . . . . . . . . 64 Determination of c102 in the Presence
of Cl2 . . . . . . . . . . . . . . . 72
SUMMARY AND CONCLUSIONS
LITERATURE CITED . . . . .
REAGENTS
BUFFERS
RAW DATA TABLES
v
76
78
85
89
92
113
Table
l
2
3
4
5
6
7
8
9
LIST OF TABLES
Selected Properties of Chlorine Dioxide
Inactivation of Poliomyelitis Virus by Chlorine and Chlorine Dioxide ....
Relative Sporacidal Effectiveness of Chlorine and Chlorine Dioxide on the Basis of OTA Residual, mg/l, Required for 99 Percent Kill ...•.....
Calculating Formulae for Chlorine Species Determined by the DPD Titration Procedure
Chlorine Recovery in Demand-Free Water by Amperometric Titration ...
pH of DPD Reagents in Solution
Changes in Absorbance of DPD Reagent in Demand-Free, Unbuffered Water Resulting from Incremental Changes in pH ....
Timed DPD Titration of Cl02 and Cl2 in Demand-Free Water, as Volume (mls) of Standard FAS Required to Discharge Color in the Sample ......•...•..•
Timed DPD Titration of Cl02 and Cl2 in Secondary Effluent, as Volume (mls) of Standard FAS Required to Discharge Color in the Sample . . . . . . . . . . • . . .
10 Results of the T-Test on the Mean Recoveries of Free Chlorine and Total Chlorine by
11
LCV and DPD . . . . . . . . . . . . . . . . .
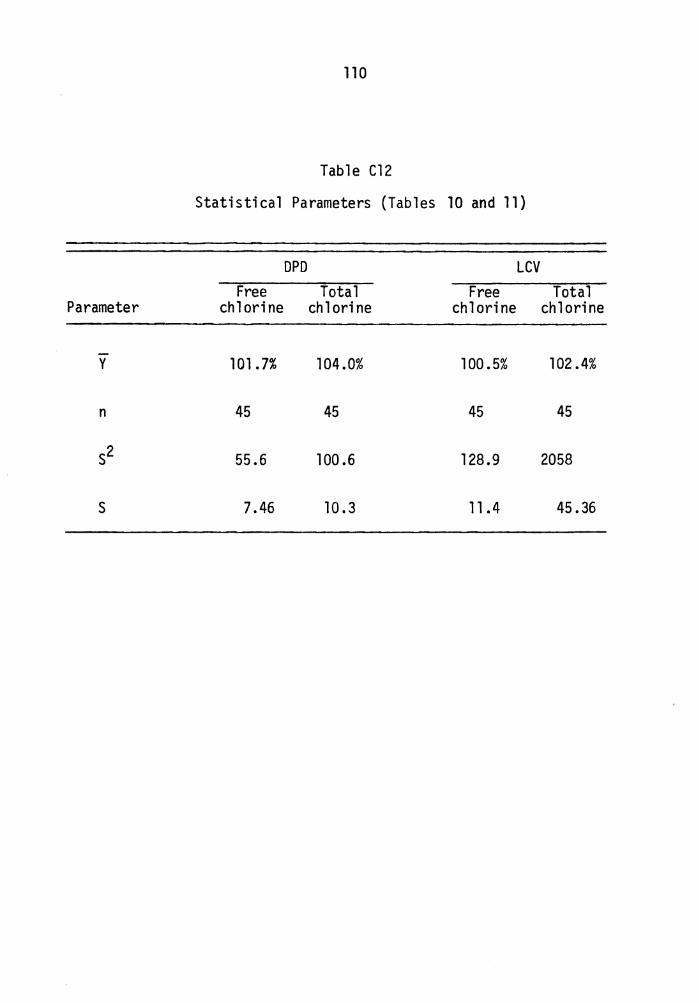
Results of the F-Test on the Sample Variances of the Free Chlorine and Total Chlorine Analyses by DPD and LCV . . . • . . . . . . .
vi
Page
4
19
21
30
36
48
50
62
63
69
71
Table Page
12 Results of the DPD Titration of Chlorine--Chlorine Dioxide Mixtures in Demand-Free
13
APPENDIX
Al
A2
Bl
B2
Cl
C2
C3
C4
C5
C6
Water . . . . . • . . . . . . . . . . . . .
The Determination of Chlorine Dioxide in the Presence of Chlorine in Demand-Free Water by Leuco Crystal Violet ..... .
Reagents for the DPD Method . . . . .
Reagents for the Leuco Crystal Violet Procedure • . . . • . . . .
S~rensen Phosphate Buffers
Mcilvaine Citrate-Phosphate Buffers
Increase in Absorbance with Time at Controlled pH ...•.•.....
DPD Timed Color Development in Demand-Free Water--Spectrophotometric Method ...
DPD Timed Color Development in Filtered Secondary Effluent--Spectrophotometric Method . . . . . . . . . . . . . .
Chlorine Dioxide as Total Available Chlorine by the DPD Method ....
Chlorine Dioxide as Free Available Chlorine by the DPD Method ....
Chlorine Dioxide as Total Available Chlorine by the Leuco Crystal Violet ~1ethod . . . . . . . . . . . . . . .
Cl Chlorine Dioxide as Free Available Chlorine by the Leuco Crystal Violet ~1ethod . . . . . . . . . . . . . . .
vii
73
74
86
87
90
91
93
94
96
98
99
100
101
Table Page
ca Absorbance and Percent Recovery Data for Chlorine Dioxide as Total Available Chlorine by DPD . . . . . . . . . . . . . . . . . . . 102
C9 Absorbance and Percent Recovery Data for Chlorine Dioxide as Free Available Chlorine by DPD • . . . . . . . . . . . . . . . . . . 104
ClO Absorbance and Percent Recovery Data for Chlorine Dioxide as Total Available Chlorine by LCV . . . . . . . . . . . . . . . . . . . 106
Cll Absorbance and Percent Recovery Data for Chlorine Dioxide as Free Available Chlorine by LCV . . . . . . . . . 108
Absorption secptrum of DPD-Cl02 color complex .......... .
Schematic diagram of the chlorine dioxide generator ....... .
Stability with time of the leuco crystal violet color complex ..
Change in absorbance with time of DPD reagent, without DPD buffer, in demand-free water at a controlled pH .....
Change in absorbance with time of DPD reagent, with DPD buffer, in demand-free water at a controlled pH .....
Change in absorbance with time of DPD reagent, with DPD buffer, in demand-free water at a controlled pH .....
Time color development of DPD in demand-free water containing Cl2 or r102. Sample left in instrument light path between readings ................ .
ix
31
32
38
43
51
52
53
55
Figure Page
13. Time color development of DPD in demand-free water containing Cl2 or Cl02. Sample placed in room light between readings. . . . . . . . 56
14. Time color development of DPD in demand-free water containing Cl2 or Cl02. Sample removed to darkness between readings . . . . . . . . 57
15. Timed color development of DPD in secondary effluent containing Cl2 or Cl02. Sample left in instrument light path between readings . . . . . . . . . . . . . . . . . . 58
16. Timed color development of DPD in secondary effluent containing Cl2 or Cl02. Sample placed in room light between readings. . . . . . . . 59
17. Timed color development of DPD in secondary effluent containing Cl2 or c102. Sample placed in darkness between readings. . . . . . . . . 60
18. Standard curve for Cl02 as total available chlorine by DPD, mean absorbance vs mean concentration . . . . . . . . . . . . . . . . . 65
19. Standard curve for Cl02 as free available chlorine by DPD, mean absorbance vs mean concentration . . . . . . . . . . . . . . . . . 66
20. Standard curve for Cl02 as total available chlorine by LCV, mean absorbance vs mean concentration . . . . . . . . . . . . . . . . . 67
21. Standard curve for Cl02 as total available chlorine by LCV, mean absorbance vs mean concentration . . . . . . . . . . . . . . . . . 68
x
I. INTRODUCTION
The disinfection of water and wastewater has been practiced
in the United States since the beginning of this century. The most
commonly employed disinfecting agents are chlorine and chlorine com-
pounds. Until recently, the only major problems thought to be
generated by the use of chlorine have been those of (1) tastes and
odors in community water supplies attributable to chlorophenolic
compounds generated by reactions between chlorine and phenolic
compounds and (2) the large quantities of chlorine required in sewage
treatment to produce a specific residual in the presence of high
concentrations of ammonia.
Recent investigations have indicated that potentially
carcinogenic compounds are formed when waters containing 11 precursor 11
organics are chlorinated (1, 2). These compounds include chloroform,
bromodichloromethane, dibromochloromethane, and bromoform.
A second problem that has been demonstrated is the failure
of chlorine to inactivate virus particles (3, 4). The escape of
viruses into a public water supply could be of immediate concern due
to the significance of water as a vector in certain viral diseases (5).
Many substitutes for chlorine have been investigated as
disinfectants. Among them are ozone, bromine, bromine chloride,
Figure 19. Standard curve for Cl02 as free available chlorine by DPD, mean absorbance vs mean concentration (15 replicates for each point).
C'\ C'\
0.5
0.4
0.3 Q) u c: ,.,
..a S-0 Vl ..a <t 0.2
o. l
I-
0.2 0.4 0.6 0.8 1.0
/
5.0 cm path length
;\ = 592 nm
1.2 1.4 .6 Concentration, mg/l Cl2
r:-s
Figure 20. Standard curve for Cl02 as total available chlorine by LCV, mean absorbance vs mean concentration (15 replicates for each point).
-I O'l .......
0.5
0.4
<1J 0.3 u s:: l'tS .0 s... 0 VI .0 c::(
0.2
0. 1
0.2 0.4 0.6 0.8 1.0
5.0 cm path length
>. = 592 nm
1.2 1.4 1.6 Concentration, mg/l Cl2
1.8
Figure 21. Standard curve for Cl02 as free available chlorine by LCV, mean absorbance vs mean concentration (15 replicates for each point).
2.0
°' o:>
0. 01
0.02
0.05
69
Table 10
Results of the T-Test on the Mean Recoveries of Free
Chlorine and Total Chlorine by LCV and DPD
2.643 45
2.375 45
1. 910 45
Note: Ho:µl = µ2
HA: µ1 = µ2
Free Chlorine Calculated t = 0.23
Fail to Reject
Fai 1 to Reject
Fail to Reject
l Yl - Y2l Reject if:
MSw~ l + 1' nl n2
Total Chlorine Calculated t = 0.595
Fail to Reject
Fail to Reject
Fail to Reject
> ta[n1 + n2 - 2]
70
The sample variance
[21] n - 1
where
Y = percent recovery value
n = number of observations
was calculated for the recovery of free and total chlorine dioxide
as chlorine by DPD and LCV, and these variances were compared using
the F-test at the a = 0.01 and 0.05 levels. As in the previous
statistical analysis, the sample variance of free chlorine recovery
by the DPD method was compared to the sample variance of free chlorine
recovery by LCV, and the sample variance of total chlorine recovery
by DPD was compared to the sample variance of total chlorine recovery
by LCV. The results of these analyses are given in Table 11.
Rejection of the hypothesis that the sample variances are
equal in all cases indicates that there is a significant difference
in the scattering of the data between the two methods.
Both methods give greater than 100 percent recovery of applied
chlorine dioxide dose, as standardized by amperometric titration, but
the lower sample variance values for the DPD procedures indicate less
scatter in the data. It can be concluded, therefore, that DPD is a
more precise analytical method for Cl02 as both free and total chlorine
than is leuco crystal violet.
71
Table 11
Results of the F-Test on the Sample Variances of the Free Chlorine
and Total Chlorine Analyses by DPD and LCV
a
o. 01
0.05
l/F a v2 = v1 F Free Chlorine 2 = n-1 Calculated F = 0.43
0.44
0.60
44 Reject
44 Reject
Note: H0 :a~ = a~ Reject if:
H ·a2 = a2 A. l 2
Total Chlorine Calculated F = 0.05
Reject
Reject
72
Determination of Cl02 in the Presence of C1 2
The DPD titration and LCV spectrophotometric procedures were
used in this section of the study. Titration allows for the rapid
determination of the desired chlorine fractions without the severe
problems of spontaneous color development encountered in the
colorimetric procedure.
Results of the DPD titration of solutions containing chlorine
and chlorine dioxide are given in Table 12. The values obtained for
Cl2:Cl02 ratios of 1:9, 2:8 and 3:7 (1 ml/l total available chlorine)
agree fairly well with those expected. As the Cl2:Cl02 ratio
approached 1:1 (4:6 and 5:5), the results become more erratic.
This may be due to reactions between chlorine and chlorine dioxide
(17):
Cl2 + H20 + HCl + HOCl
Cl02 + e- + Cl0-2
c10-2 + H+ + HC102
HCl02 + JH+ + 3Cl- ! 2Cl2 + 2H20
These two ratios are rarely found in actual practice, a 1:2 ratio
being preferred to avoid production of chlorite.
values obtained for the analyses with LCV indicator are given
in Table 13. As presently designed, this procedure does not permit
accurate distinction between chlorine and chlorine dioxide. Glycine
may either be ineffective for the suppression of free chlorine, or
the chloroaminoacetic acid formed may adversely affect the indicator.
Table 12
Results of the DPD Titration of Chlorine-Chlorine Dioxide Mixtures in Demand-Free Water
Concentration, mg/l
Ratio c1A: Cl o2, Free Available Total Available mg Cl02 NH2Cl NHCL2 Chlorine Chlorine Chlorite
0.1 :0.9 0.88 0.2 0.05 0.05 1.10 0
o.l:0.9 0.88 0. l 0.05 0. 10 1.10 0
0.2:0.8 0.75 0.2 0.025 0.05 1.05 0 ....... w
0.2:0.8 0.75 0.25 0.05 0.05 1.10 0
0.3:0.7 0.62 0.25 0.05 0. 10 1.02 0.05
0.3:0.7 0.62 0.25 0.05 0.10 1.02 0.05
0.4:0.6 0.38 0.30 0.05 0. 15 0.88 0.02
o.4:o.6 0.5 0.15 0.05 0.30 1.0 0
o.5:0.5 0.38 0.50 0.05 0.05 0.98 0. 12
o.5:o.5 0.25 0.30 0.05 0.20 0.80 0.05
74
Table 13
The Determination of Chlorine Dioxide in the Presence of Chlorine in
Demand-Free Water by Leuco Crystal Violet
Concentration, mg/l
Cl2:Cl02 Cl02a Cl02 + Cl2b Cl2c Total Available Chlorine
o. l : 0. 9 0.39 0.39 0 1.27
o. l : 0. 9 0.32 0.39 0.06 1.25
o.2:0.8 0;3 0.82 0.52 1.86
o. 2: 0 .8 0.3 0.64 0.34 1.82
0. 3: 0. 7 0.28 0.99 0.71 1. 97
o. 3: 0. 7 0.30 0.99 0.61 d
o. 4: 0. 6 0.25 1.46 1.21 d
o. 4: 0. 6 0.25 1.60 1.35 d
0.5:0.5 0.16 1.50 1.35 d
o.5:0.5 0.19 1.50 1.31 d
aglycine added
bwithout glycine
c(Cl02 + Cl2) - Cl2
dcould not be determined from standard curve.
75
The color developed in the total chlorine procedure was so
intense that a concentration could not be determined from the standard
curve used {Fig. 20). In no instance did the values obtained even
approximate the concentrations present in solution.
The structure of leuco crystal violet may contribute to the
problems encountered in this analysis. Chlorine dioxide has been
proven capable of cleaving ring structures {26), and this mechanism
may be involved in the color reaction. Attack on the rings possibly
occurs at a rate which increases rapidly with only a small increase
in Cl02 concentration as shown by the curvilinear line in Figure 20.
Mixtures of halogens, and the presence of KI in the total chlorine
buffer, may increase the rate of chloride substitution and hydride
transfer { Eqn. [17]) involved in the reduction to crystal violet,
explaining the intense color produced in the total chlorine analysis.
V. SUMMARY AND CONCLUSIONS
The spontaneous color development phenomenon exhibited by DPD
in solution was investigated as a function of pH and time. It was
found that close control of reaction and pH were essential to the DPD
spectrophotometric procedure. The absorbance of the DPD-Cl02 complex
increased with time in both demand-free water and secondary effluent.
When only the DPD reagent is present in buffer or demand-free water,
absorbance increases with time above pH 6.
A statistical comparison of the mean recovery of free and total
chlorine dioxide by both of the procedures was made, and they were not
found to be significantly different, but the sample variances calcu-
lated for the two procedures indicated a significant difference in the
data scatter.
The analysis of chlorine dioxide by DPD and LCV was studied,
and the capability of these two procedures to determine chlorine
dioxide in the presence of chlorine was investigated.
The significant conclusions that can be derived from this
project are:
1. Close control of reaction time and pH are essential to the
DPD spectrophotometric procedures.
2. In the titration of DPD with standard FAS, the spontaneous
development of color occurs at a relatively constant rate regardless
of the reaction medium and concentration or type of halogen present.
76
77
3. Both the DPD and LCV spectrophotometric procedures exhibit
greater than 100 percent recovery of applied chlorine dioxide dose as
standardized against amperometric titration. The mean recovery of
45 samples each of free and total chlorine by both procedures are not
significantly different, but DPD is the more precise analytical method.
4. Leuco crystal violet is not a satisfactory method for the
determination of chlorine dioxide in the presence of chlorine. The
figures obtained for free chlorine did not approximate the concentra-
tions actually in solution, and the color produced by the total chlorine
procedure was too intense to be read spectrophotometrically.
5. The DPD titrametric procedure is a satisfactory method for
the determination of chlorine dioxide in the presence of chlorine in
demand-free water, in the range of c1 2:c102 ratios of 1:9 to 3:7,
showing a 94 percent recovery as standardized against amperometric
titration.
LITERATURE CITED
78
79
VI. LITERATURE CITED
1. Miltner, R. J., "The Effect of Chlorine Dioxide on Trihalomethanes in Drinking Water. 11 M.S. Thesis, University of Cincinnati, (1976).
2. Bunn, W. W. et ll·, "Formation of Trihalomethanes by Chlorination of Surface Waters. 11 En vi r. Letters, JQ, 205 ( 1975).
3. McDermott, J. H., "Virus Problems and Their Relation to Water Supplies. 11 Jour. Amer. Water Works Assoc., 66, 693 (1974).
4. Weber, W. J., Jr., 11 Physicochemical Processes for Water Quality Control. 11 Wiley-Interscience Publishers, New York (1974).
5. Culp, G. L., and Culp, R. L., 11 Disinfection. 11 New Concepts in Water Purification, Van Nostrand Rheinhold Co., New York (1974).
6. Chance, J. C., "The Effect of pH and Exposure Time on the Bac-terial Efficiency of Bromine Chloride Against Streptococcus faecalis. 11 M.S. Thesis, VP! & SU (1976).
7. Augenstein, H. W., "Use of Chlorine Dioxide to Disinfect Water Supplies. 11 Jour. Amer. Water Works Assoc., 66, 716 (1974).
8. Diaper, E.W. J., "Disinfection of Water and Wastewater Using Ozone. 11 In 11 Disinfection--Water and Wastewater." J. D. Johnson [Ed.], Ann Arbor Publishers, Ann Arbor (1975).
9. McCarthy, J. A., 11 BromineandChlorine as Water Disinfectants." Jour. New Eng. Water Works Assoc., 58, 55 (1944).
10. Chang, S. L., and Morris, J. C., "Elemental Iodine as a Disinfec-tant for Drinking Water. 11 Ind. Eng. Chem., 45, 1009 (1953).
11. Oliver, B. G., and Carey, J. H., 11 A Scale-up Investigation of Ultraviolet Disinfection as an Alternative to Chlorination for Sewage Effluents." Can. Jour. Chem. Eng., 53, 711 (1975).
12. Murphy, R. A., Kakehi, K., and Sarkanen, K. V., "Studies on the Mechanism of Chlorine Dioxide Bleaching," TAPP!, 44, 465 (1961).
13. Aston, R. N., "Chlorine Dioxide Use in Plants on the Niagara Border. 11 Jour. Amer. Water Works Assoc., 39, 687 ( 1947).
80
14. White, G. C., "Handbook of Chlorination." Van Nostrand Rheinhold Co., New York (1972}.
15. Bernarde, M. A. et al., "Efficiency of Chlorine Dioxide as a Bactericide ... -Applied Micro., Jl., 5 ( 1976}.
16. McGhee, J. S., Jr., "The Behavior of Chlorine Dioxide in the Disinfection of E. coli and Its Determination by the DPD Method of Analysis." M-:-s.The'sis, VPI & SU (1976).
17. Gordon, G. et al., "The Chemistry of Chlorine Dioxide." In 11 Progressinlnorganic Chemistry." S. J. Lippard [Ed.], Wiley-Interscience Publishers, New York (1972).
18. Kesting, E., "The Manufacture and Properties of Chlorine Dioxide." TAPPI, ~' 166 (1953).
19. lngols, R. S., and Ridenour, G. M., "Chemical Properties of Chlorine Dioxide in Water Treatment." Jour. New Eng. Water Works Assoc., 40, 1207 (1948}.
20. Myhrstad, J. A., and Samdal, J. E., "Behavior and Determination of Chlorine Dioxide." Jour. Amer. Water Works Assoc., fil_, 205 (1969).
21. lngols, R. S., and Ridenour, G. M., "The Elimination of Phenolic Tastes by Chloro-Oxidation. 11 Water and Sewage Works, 95, 187 (1948).
22. Burttschell, R. H. et al., "Chlorine Derivatives of Phenol Causing Taste and Odor.-11 JOur. Amer. Water Works Assoc., 51, 205 (1959). -
23. Harlock, C.R., and Dowlin, M. R., "Chlorine and Chlorine Dioxide for the Control of Algae Odors. 11 Water and Sewage Works, 100, 74 (1953).
24. Faber, H. A., 11A Theory of Taste and Odor Reduction by Chlorine Dioxide. 11 Jour. Amer. Water Works Assoc., 39, 691 (1947).
25. Rosenblatt, D. H., "Chlorine and Oxychlorine Species Reactivity with Organic Substances." In 11 Disinfection--Water and Waste-water." J. D. Johnson [Ed.], Ann Arbor Science Publishers, Ann Arbor (1975).
26. Sarkanen, K. V. et al., "Studies on Oxidative Delignification Mechanisms. Par~I. Oxidation of Vanillin with Chlorine Dioxide. 11 TAPPI, 45, 24 (1962).
81
27. Dennis, W. H. et tl·, 110xi dati on of Amines. IV. Oxidative Frag-mentation. 11 Jour. Org. Chem., 32, 3783 (1967).
28. Coote, R., "Chlorine Dioxide Treatment at Valparaiso, Indiana. 11 Water and Sewage Works, 97, 13 (1950).
29. Ringer, W. C., and Campbell, S. J., 11 Use of Chlorine Dioxide for Algae Control at Philadelphia. 11 Jour. Amer. Water Works Assoc., 47' 740 (1955).
30. Synan, J. F., MacMahon, J. D., and Vincent, G. P., "Chlorine Dioxide--A Development in the Treatment of Potable Water. 11 Water and Sewage Works, 21., 423 (1944).
31. Granstrom, M. L., and Lee, G. F., "Generation and Use of Chlorine Dioxide in Water Treatment." Jour. Amer. Water Works Assoc., 50, 1453 (1958).
32. "Standard Methods for the Examination of Water and Wastewater. 11 14th ed., Amer. Pub. Health Assoc., Washington, D.C. (1976).
33. Aston, R. N., and Synan, J. F., 11 Chl ori ne Dioxide as a Bacteri-cide in Water Works Operation." Jour. New Eng. Water Works Assoc., 62, 80 (1948).
34. Ridenour, G. M., and Armbruster, E. H., "Bactericidal Effects of Chlorine Dioxide. 11 Jour. Amer. Water Works Assoc., 41, 537 (1949). . -
35. Bernarde, M. A. et al., "Kinetics and Mechanisms of Bacterial Disinfection by Chlorine Dioxide." Applied Micro., 1§_, 257 (1967).
36. Bernarde, M.A. et al., "Efficiency of Chlorine Dioxide as a Bac-tericide.11 Applied Micro., .11, 776 (1965).
37. Ridenour, G. M., and Ingols, R. S., "Inactivation of Poliomyelitis Virus by 'Free' Chlorine." Jour. New Eng. Water Works Assoc., 36 ' 6 39 ( 19 46 ) .
38. Ridenour, G. M., Ingols, R. S., and Annbruster, E. H., 11Sporicidal Properties of Chlorine Dioxide. 11 Water and Sewage Works, 96, 279 (1949).
39. Olivieri, V. P. et al., 11The Comparative Mode of Action of Chlorine, Bromine, and Iod1ne on f2 Bacterial Virus. 11 In "Disinfection--Water and Wastewater. 11 J. D. Johnson [Ed.], Ann Arbor Publishers, Ann Arbor (1975).
40. Solle, F. W. et al., "Bromine Disinfection of Wastewater Efflu-ents.11 In-irD1sinfection--Water and Wastewater. 11 J. D. Johnson [Ed.], Ann Arbor Publishers, Ann Arbor (1975).
82
41. Johnson, J. D. , and Sun, W. , "Bromine Disinfection of Wastewater. 11
In 11 Disinfection--Water and Wastewater." J. D. Johnson [Ed.], Ann Arbor Publishers, Ann Arbor (1975).
42. Stringer, R. P. et al., "Comparison of Bromine, Chlorine, and Iodine as Dis1nfectants for Amoebic Cysts." In "Disinfection--Water and Wastewater." J. D. Johnson [Ed.], Ann Arbor Pub-lishers, Ann Arbor {1975).
43. Mills, J. F., 11 Interhalogens and Halogen Mixtures as Disinfec-tants. 11 In "Di si nfection--Water and Wastewater. 11 J. D. Johnson [Ed.], Ann Arbor Publishers, Ann Arbor {1975).
44. Taylor, R. B., "A Comparison of Bromine Chloride and Chlorine for the Disinfection of Municipal Wastewater." M.S. Thesis, VPI & SU, Blacksburg (1975).
45. Black, A. P., Lackey, J. B., and Lackey, E. W., 11 Effectiveness of Iodine for the Disinfection of Swimming Pool Water. 11
Amer. Jour. Pub. Health, 49, 1060 (1959).
46. Black, A. P., "Swimming Pool Disinfection with Iodine." Water and Sewage Works, 108, 286 (1961).
47. Black, A. P. et al., 11 Use of Iodine for Disinfection." Jour. Amer. Water-Works Assoc., 57, 1401 (1965).
48. Holden, W. S., 11 Water Treatment and Examination. 11 J. and A. Churchill, London (1970).
49. Shuva l, H. I., and Gruener, N. , 11 Hea 1th Considerations in Renovating Water for Domestic Reuse. 11 Envir. Sci. Tech., 7, 600 ( 1973). -
50. Long, W. N., and Bell, F. A., Jr., "Health Factors and Reused Water." Jour. Amer. Water Works Assoc., 64, 220 {1972).
51. Brodtman, N. V., Jr., "Continuous Analysis of Chlorinated Hydro-carbon Pesticides in the Lower Mississippi River. 11 Bull. Envir. Cont. and Tox., Ji, 33 (1976). --
52. Foulk, C. W., and Bowden, A. T., 11A New Type of Endpoint in Electrometric Titration and Its Application to Iodimetry. 11
Jour. Amer. Chem. Soc., 48, 2045 (1926).
53. Marks, H. C. , and Glass, J. R. , "A New Method of Determining Residual Chlorine." Jour. Amer. Water Works Assoc., 34, 1227 (1942). -
83
54. Marks, H. C., "Residual Chlorine by Amperometric Titration." Jour. New Eng. Water Works Assoc., 66, l (1952).
55. Marks, H. C., and Bannister, G. L., "Amperometric Methods in the Control of Water Chlorination." Anal. Chem., ~' 200 (1949}.
56. Marks, H. C. et al., "Determination of Residual Chlorine Com-pounds. 11 JOuY:-:- Amer. Water Works Assoc. , 43, 201 ( 1951}.
57. Mahan, W. A., "Simplified Amperometric Titration Apparatus for Determining Residual Chlorine in Water." Water and Sewage Works, 96, 171 (1949}.
58. Haller, J. F., and Listek, S.S., "Determination of Chlorine Dioxide and Other Active Chlorine Compounds in Water." Anal. Chem., 20, 639 (1948}. --
59. Nicolson, N. J., "An Evaluation of the Methods for Determining Residual Ch 1 ori ne in Water. Part I. Free Ch 1 ori ne. 11 The Analyst, 90, 187 (1965}.
60. Moore, W. A., "Use of £_-Aminodimethylaniline as an Indicator of Free Chlorine." Jour. Amer. Water Works Assoc., 35, 427 ( 1943}.
61. Palin, A. T., "The Determination of Free and Combined Chlorine in Water by the Use of Oiethyl-p-pheny1ene Diamine. 11 Jour. Amer. Water Works Assoc., 49, 873 (1957).
62. Pa 1 in, A. T., "Co 1 orimetri c Determi nation of Ch 1 ori ne Dioxide in Water." Water and Sewage Works, 107, 457 (1960).
63. Pa 1 in, A. T. , "Methods for the Determination, in Water, of Free and Combined Available Chlorine, Chlorine Dioxide and Chlorite, Bromine, Iodine, and Ozone, Using Diethyl-p-Phenylene Diamine (DPD}. 11 Jour. Inst. Water Eng.,£1., 537 (1967).
64. Palin, A. T., "Determining Chlorine Dioxide and Chlorite. 11 Jour. Amer. Water Works Assoc., 62, 483 (1970).
65. Palin, A. T., "Analytical Control of Water Disinfection with Special Reference to Differential DPD Methods for Chlorine, Chlorine Dioxide, Bromine, Iodine, and Ozone." Jour. Inst. Water Eng., 28' 139 ( 197 4} .
66. Palin, A. T., "Current OPO Methods for Residual Halogen Compounds and Ozone in Water." Jour. Amer. Water Works Assoc., 67, 32 (1975).
84
67. Lin, S., Hullinger, D. L., and Evans, R. L., "Selection of a Method to Determine Residua 1 Ch 1 ori ne in Sewage Effluent. 11 Water and Sewage Works, 118, 360 (1971).
68. Black, A. P., and Whittle, G. P., "New Methods for the Colori-metric Detennination of Halogen Residuals. Part I. Iodine, Iodide, and Iodate. 11 Jour. Amer. Water Works Assoc., 59, 471 (1967). -
69. Black, A. P., and Whittle, G. P., 11 New Methods for the Determina-tion of Halogen Residuals. Part II. Free and Total Chlorine. 11
Jour. Amer. Water Works Assoc., 59, 607 (1967).
70. Layton, R. F., and Kinman, R. N., 11 A New Analytical Method for Ozone. 11 In "National Specialty Conference on Disinfection." American Society of Civil Engineers, Washington, D.C. (1970).
71. Post, M. A., and Moore, W. A., "The Determination of Chlorine Dioxide in Treated Surface Waters. 11 Anal. Chem., 31, 1872 (1959). -
72. Masschelein, W., "Spectrophotometric Determination of Chlorine Dioxide with Acid Chrome Violet K. 11 Anal. Chem., 38, 1859 (1966). -
73. Hodgden, H. W., and Ingels, R. S., "Direct Colorimetric Method for the Detennination of Chlorine Dioxide in Water. 11 Anal. Chem., 26, 1225 (1954).
74. Woodfin, W. L., 11A Comparison of the Bactericidal Efficiency of Chlorine and Bromine Chloride. 11 M.S. Thesis, VPI & SU (1975).
APPENDIX A
REAGENTS
85
86
Table Al
Reagents for the DPD Method
1. Phosphate Buffer Solution:
Dissolve 24 gm anhydrous Na2HP04 and 46 gm anhydrous KH2Po4 in 500 ml distilled water. Dissolve 800 mg Na2-EDTA in 100 ml dis-tilled water. Combine these two solutions in a one liter volumetric flask and dilute to the mark. Add 20 mg HgC1 2 to inhibit mold growth.
2. DPD Reagent:
Dissolve 200 mg Na2-EDTA in chlorine free water. Add 8 ml of 1+3 H2so4, and 1 gm of DPD oxalate powder (Eastman 7102). Dilute to 1 liter. Store in a brown bottle at 4°C. Discard when discolored.
3. Standard FAS titrant:
Add 1.106 gm ferrous ammonium sulfate to freshly boiled and cooled distilled water containing 1 ml 1+3 H2so4. Dilute to one liter. Standardize against potassium dichromate (0.00284 !:!_). Discard after one month.
87
Table A2
Reagents for the Leuco Crystal Violet Procedure
1. Free Chlorine Buffer
a. Potassium hydroxide, 4 M:
Dissolve 224.4 gm KOH and dilute to one liter with demand free water.
b. Citric Acid, 2 M:
Dissolve.384.3 gm c6H8o7 (or 420.3 gm c6H8o7 • H20) and dilute to one liter.
c. Potassium Citrate Solution.
Mix 4M KOH and 2M citric acid in the ratio of 1:2 (350 ml:700 ml). Use immediately and discard any remaining.
d. Acetate Solution
Dissolve 161.2 gm glacial acetic and 49.5 gm NaH2H3o2 (or 82.l gm NaC2H3o2 • 3H20) and dilute to one liter.
e. Final Buffer.
Mix equal volumes of potassium citrate (c) and acetate (d). Add 20 mg HgC1 2 to inhibit mold growth. Final pH = 4.0.
2. Total Chlorine Buffer
Dissolve 480 gm glacial acetic acid and 146 gm NaC2H302 (or 243 gm NaC~H~02 • 3H?O) in 300 ml distilled water. Dilute to one liter. Transfer to a brown bottle and add 3 gm KI. Avoid undue exposure to the air.
3. Leuco Crystal Violet Indicator
a. Stock reagent
Add 14.0 ml 85% orthophosphoric acid to 500 ml demand free water in a brown bottle (one liter capacity). While gently
88
Table A2--Continued
mixing with a magnetic stirring bar, add 3 gm 4,4' ,4"-methylidynetris-(N,N-dimethylaniline). Continue stirring until dissolved. Add 500 ml demand free water. Store in brown bottle away from direct sunlight. Discard after 6 months. Do not use a rubber stopper.
b. Saturated Mercuric Chloride
To 20 gm HgCl in a glass-stoppered 300 ml flask, add 200 ml demand free water and agitate gently. Let stand 24 hrs. (Caution: Mercuric chloride is poisonous and corrosive.)
c. Indicator
Mix 12 parts solution (a) with l part solution (b). Store in the manner prescribed for solution (a).