The Myocyte Expression of Adiponectin Receptors andPPARδ Is Highly Coordinated and Reflects Lipid Metabolism ofthe Human Donors
Anna-Maria Ordelheide, Martin Heni, Nadja Gommer, Lisa Gasse, Carina Haas,Alke Guirguis, Fausto Machicao, Hans-Ulrich Haring, and Harald Staiger
Division of Endocrinology, Diabetology, Angiology, Nephrology, and Clinical Chemistry, Department of Internal Medicine, EberhardKarls University Tubingen and German Center for Diabetes Research (DZD e.V.), Tubingen, Germany
Correspondence should be addressed to Hans-Ulrich Haring, [email protected]
Received 3 September 2010; Revised 21 December 2010; Accepted 5 January 2011
Muscle lipid oxidation is stimulated by peroxisome proliferator-activated receptor (PPAR) δ or adiponectin receptor signalling.We studied human myocyte expression of the PPARδ and adiponectin receptor genes and their relationship to lipid parameters ofthe donors. The mRNA levels of the three adiponectin receptors, AdipoR1, AdipoR2, and T-cadherin, were highly interrelated (r ≥0.91). However, they were not associated with GPBAR1, an unrelated membrane receptor. In addition, the adiponectin receptorswere positively associated with PPARδ expression (r ≥ 0.75). However, they were not associated with PPARα. Using stepwisemultiple linear regression analysis, PPARδ was a significant determinant of T-cadherin (P = .0002). However, pharmacologicalPPARδ activation did not increase T-cadherin expression. The myocyte expression levels of AdipoR1 and T-cadherin were inverselyassociated with the donors’ fasting plasma triglycerides (P < .03). In conclusion, myocyte expression of PPARδ and the adiponectinreceptors are highly coordinated, and this might be of relevance for human lipid metabolism in vivo.
1. Introduction
In states of increased circulating nonesterified fatty acids(NEFA), such as fasting, high dietary fat intake, or obesity,appropriate fatty acid oxidation by skeletal muscle andliver is crucial to maintain insulin sensitivity and glucosetolerance. Impairment of fatty acid oxidation, for example,due to genetics, provokes increments in plasma NEFA levels,ectopic lipid deposition in nonfat tissues, enhanced hepaticVLDL production, and finally hyperlipidaemia [1]. Insulinresistance, glucose intolerance, and type 2 diabetes may arisefrom enhanced fatty acid signalling in skeletal muscle andliver initiated by the elevated plasma NEFA levels per se orby the accumulation of ectopic lipids [2].
Peroxisome proliferator-activated receptor (PPAR) δ,a nuclear receptor and transcription factor, represents an
important regulator of fatty acid oxidation in rodent andhuman skeletal muscle. PPARδ is activated by long-chainNEFA and, in concert with coactivator proteins, such asPPARγ coactivator 1, induces the expression of genesinvolved in cellular fatty acid uptake, β-oxidation, andenergy uncoupling [3]. Alternatively, muscular fatty acidoxidation is stimulated by adiponectin, an insulin-sensitizingadipokine negatively associated with adipose tissue mass.Adiponectin signalling triggers phosphorylation and inac-tivation of acetyl-CoA carboxylase promoting a decline incytosolic malonyl-CoA levels and, thereby, enhancing fattyacyl-CoA import into mitochondria and β-oxidation [4, 5].The functions of adiponectin are mediated via three differentreceptors, that is, AdipoR1, AdipoR2, and T-cadherin, whichare abundant in skeletal muscle. AdipoR1 and AdipoR2 wereshown to bind trimeric full-length adiponectin as well as
2 Experimental Diabetes Research
its proteolytically cleaved globular domain, while T-cadherinbinds hexameric and high-molecular-weight oligomericforms of adiponectin [6].
Whether the PPARδ and adiponectin receptor signallingpathways are linked at any cellular level is currently un-known. In this gene expression study, we therefore investi-gated whether the expression of the genes encoding PPARδ(PPARD) and the adiponectin receptors AdipoR1 (ADI-POR1), AdipoR2 (ADIPOR2), and T-cadherin (CDH13) isinterrelated. To this end, we used in vitro differentiatedhuman skeletal muscle cells (myotubes) from 39 youngand healthy human donors. Since basal gene expression ofhuman myotubes was previously shown to reflect in vivophenotypes of the donors [7–9], we furthermore assessedwhether these genes’ expression levels associate with in vivolipid parameters of the donors.
2. Materials and Methods
2.1. Cell Culture. Primary human skeletal muscle cells weregrown from satellite cells obtained from vastus lateralismuscle biopsies and differentiated to myotubes, as previouslydescribed [10]. Some myotube cultures were treated for 20 heither with 0.1% DMSO for carrier control or with 1 μmol/Lof the PPARδ-specific agonist GW501516 (Alexis Biochemi-cals, Grunberg, Germany).
2.2. Myotube Donors. The 39 donors were young and healthyCaucasian participants of the Tubingen family study fortype 2 diabetes and gave informed written consent to thestudy. All individuals were metabolically characterised byan oral glucose tolerance test, as described earlier [11]. Thesubject characteristics are given in Table 1. The study was inaccordance with the principles of the Declaration of Helsinki,and the protocol was approved by the Ethics Committee ofthe Medical Faculty of the University of Tubingen.
2.3. Quantitative RT-PCR (qPCR). Myotubes were washedwith PBS and harvested by trypsinisation. RNA was isolatedwith RNeasy columns (Qiagen, Hilden, Germany). TotalRNA treated with RNase-free DNase I was transcribed intocDNA using AMV reverse transcriptase and the First StrandcDNA kit from Roche Diagnostics (Mannheim, Germany).qPCR was performed in triplicate with SYBR Green I dyeon a LightCycler (Roche Diagnostics, Mannheim, Germany).The primers were purchased from TIB MOLBIOL (Berlin,Germany): ADIPOR1 mRNA forward 5′-ATTGAGGTA-CCAGCCAGATG-3′, reverse 5′-GAGGTCTATGACCAT-GTAGC-3′; ADIPOR2 mRNA forward 5′-GATTGTCAT-CTGTGTGCTGG-3′, reverse 5′-CTGGAGACTGGTAGG-TATCA-3′; CDH13 mRNA forward 5′-TGCTGATAACCC-TGGAGGAC-3′, reverse 5′-ATGGGCAGGTTGTAGTTT-GC-3′; GPBAR1 mRNA forward 5′-GCTGCTTCTTCC-TGAGCCTAC-3′, reverse 5′-GTTGGGAGCCAAGTAGAC-GAG-3′; PPARD mRNA forward 5′-AAGAGGAAGTGG-CAGAGGCA-3′, reverse 5′-TGCCACCAGCTTCTTCTT-CT-3′; PPARA mRNA forward 5′-CCATCGGCGAGGATA-GTTCT-3′, reverse 5′-CTGCGGTCGCACTTGTCATA-3′;
28S-rRNA forward 5′-ACGGCGGGAGTAACTATGACT-3′,reverse 5′-CTTGGCTGTGGTTTCGCT-3′. The annealingtemperatures were ADIPOR1 mRNA −66◦C; ADIPOR2mRNA∗−64◦C; CDH13 mRNA −66◦C; GPBAR1 mRNA−68◦C; PPARD mRNA∗−67◦C; PPARA mRNA∗−67◦C;28S-rRNA −63◦C. All reactions contained 4 mmol/l MgCl2(reactions marked with asterisk additionally contained 5%DMSO) and were run for 45 cycles. Cellular mRNA contentsare given in fg mRNA (or rRNA)/μg total RNA. The basalexpression levels are given in Table 1. Furthermore, we per-formed probe-based qPCR (LightCycler, Roche Diagnostics)using probes from the Universal ProbeLibrary (Roche Diag-nostics) and primers from TIB MOLBIOL to determine themRNA expression levels of ADIPOR1, ADIPOR2, CDH13,PPARD, UCP3, TFAM, PPARGC1A, and the housekeepinggene RPS13 (primer sequences and PCR conditions can beprovided upon request).
2.4. Oral Glucose Tolerance Test (OGTT) and Hyperinsulinae-mic-Euglycaemic Clamp. Both procedures were performed aspreviously described in detail [11].
2.5. Laboratory Measurements. Glucose was determinedusing a bedside glucose analyzer (Yellow Springs Instru-ments, Yellow Springs, OH, USA). Insulin was determined bya microparticle enzyme immunoassay (Abbott Laboratories,Tokyo, Japan). NEFA and glycerol were measured using enzy-matic assays from WAKO Chemicals (Neuss, Germany) andSigma (Deisenhofen, Germany), respectively. Triglycerides,total, HDL, and LDL cholesterol were determined with stan-dard colorimetric methods using a Roche/Hitachi analyzer(Roche Diagnostics, Mannheim, Germany). Adiponectin wasdetermined by a radioimmunoassay (Linco Research, St.Charles, MO, USA).
2.6. Selection and Genotyping of Single Nucleotide Polymor-phisms (SNPs). To study the influence of genetic variation onPPARD, ADIPOR1, ADIPOR2, and CDH13 expression, weselected the unlinked PPARD SNPs rs2267668 A/G (intron2) and rs1053049 T/C (3′-untranslated region) and theADIPOR1 promoter SNP rs6666089 for which we previouslyreported in vivo functionality [11–13]. For genotyping,DNA was isolated from whole blood using a commercialDNA isolation kit (NucleoSpin, Macherey & Nagel, Duren,Germany). Genotyping was performed with TaqMan assays(Applied Biosystems, Foster City, CA, USA). All SNPs passedthe quality controls. Details on this as well as on minor allelefrequencies, genotyping success rates, and Hardy-Weinbergequilibrium are reported in the aforementioned references.
2.7. Statistics. To approximate normal distribution, all datawere loge transformed prior to statistical analysis. Two-groupcomparisons were performed using unpaired Student’s t-test.To adjust the dependent variable for confounding variables,multiple linear regression models were used (standard leastsquares method). Stepwise multiple linear regression analysiswas performed to identify the best predictor for the depen-dent variable. A P value <.05 was considered statistically
Experimental Diabetes Research 3
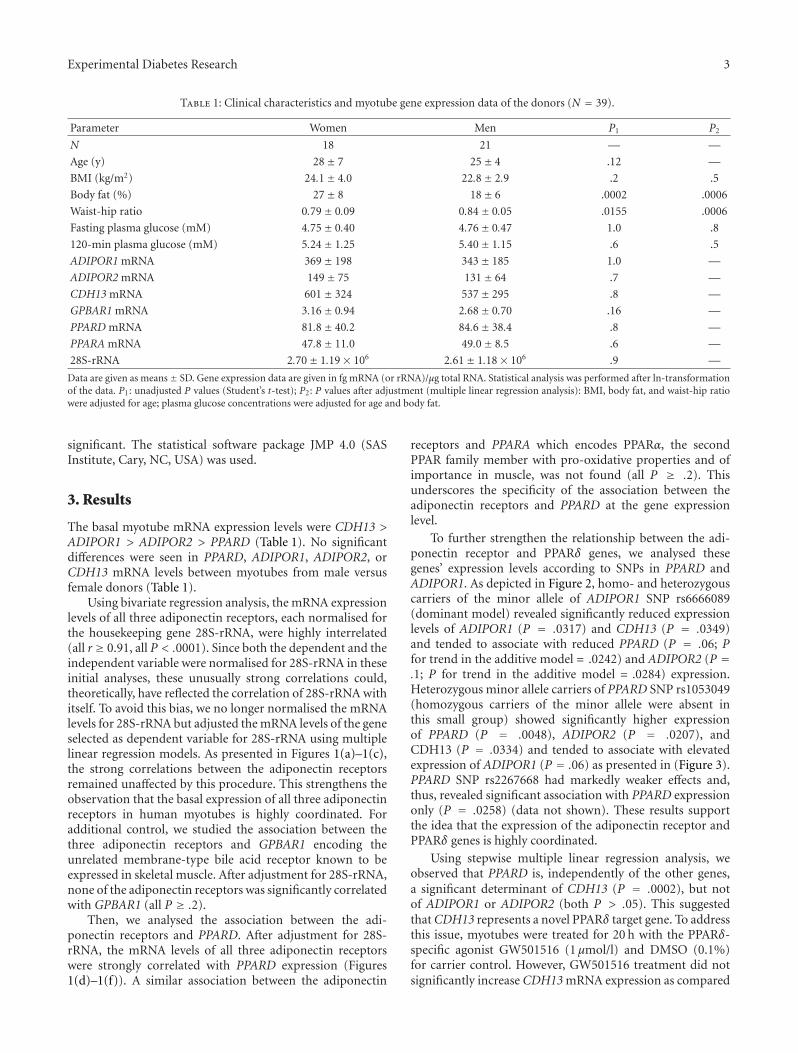
Table 1: Clinical characteristics and myotube gene expression data of the donors (N = 39).
Data are given as means± SD. Gene expression data are given in fg mRNA (or rRNA)/μg total RNA. Statistical analysis was performed after ln-transformationof the data. P1: unadjusted P values (Student’s t-test); P2: P values after adjustment (multiple linear regression analysis): BMI, body fat, and waist-hip ratiowere adjusted for age; plasma glucose concentrations were adjusted for age and body fat.
significant. The statistical software package JMP 4.0 (SASInstitute, Cary, NC, USA) was used.
3. Results
The basal myotube mRNA expression levels were CDH13 >ADIPOR1 > ADIPOR2 > PPARD (Table 1). No significantdifferences were seen in PPARD, ADIPOR1, ADIPOR2, orCDH13 mRNA levels between myotubes from male versusfemale donors (Table 1).
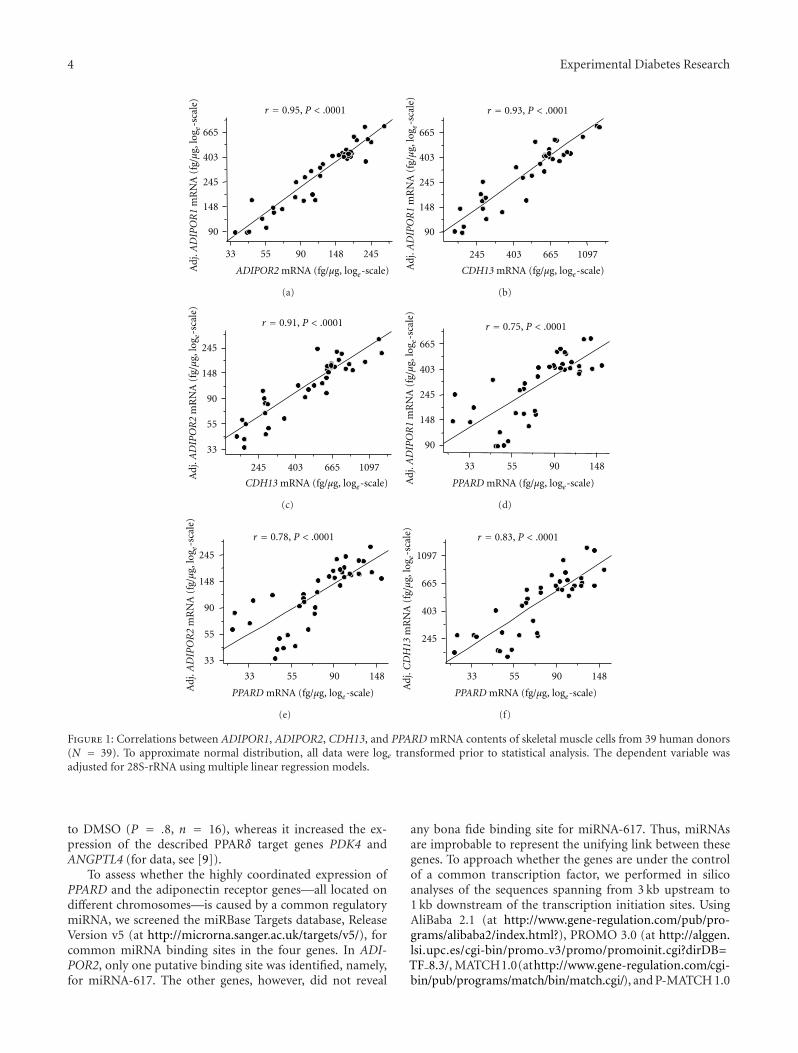
Using bivariate regression analysis, the mRNA expressionlevels of all three adiponectin receptors, each normalised forthe housekeeping gene 28S-rRNA, were highly interrelated(all r ≥ 0.91, all P < .0001). Since both the dependent and theindependent variable were normalised for 28S-rRNA in theseinitial analyses, these unusually strong correlations could,theoretically, have reflected the correlation of 28S-rRNA withitself. To avoid this bias, we no longer normalised the mRNAlevels for 28S-rRNA but adjusted the mRNA levels of the geneselected as dependent variable for 28S-rRNA using multiplelinear regression models. As presented in Figures 1(a)–1(c),the strong correlations between the adiponectin receptorsremained unaffected by this procedure. This strengthens theobservation that the basal expression of all three adiponectinreceptors in human myotubes is highly coordinated. Foradditional control, we studied the association between thethree adiponectin receptors and GPBAR1 encoding theunrelated membrane-type bile acid receptor known to beexpressed in skeletal muscle. After adjustment for 28S-rRNA,none of the adiponectin receptors was significantly correlatedwith GPBAR1 (all P ≥ .2).
Then, we analysed the association between the adi-ponectin receptors and PPARD. After adjustment for 28S-rRNA, the mRNA levels of all three adiponectin receptorswere strongly correlated with PPARD expression (Figures1(d)–1(f)). A similar association between the adiponectin
receptors and PPARA which encodes PPARα, the secondPPAR family member with pro-oxidative properties and ofimportance in muscle, was not found (all P ≥ .2). Thisunderscores the specificity of the association between theadiponectin receptors and PPARD at the gene expressionlevel.
To further strengthen the relationship between the adi-ponectin receptor and PPARδ genes, we analysed thesegenes’ expression levels according to SNPs in PPARD andADIPOR1. As depicted in Figure 2, homo- and heterozygouscarriers of the minor allele of ADIPOR1 SNP rs6666089(dominant model) revealed significantly reduced expressionlevels of ADIPOR1 (P = .0317) and CDH13 (P = .0349)and tended to associate with reduced PPARD (P = .06; Pfor trend in the additive model = .0242) and ADIPOR2 (P =.1; P for trend in the additive model = .0284) expression.Heterozygous minor allele carriers of PPARD SNP rs1053049(homozygous carriers of the minor allele were absent inthis small group) showed significantly higher expressionof PPARD (P = .0048), ADIPOR2 (P = .0207), andCDH13 (P = .0334) and tended to associate with elevatedexpression of ADIPOR1 (P = .06) as presented in (Figure 3).PPARD SNP rs2267668 had markedly weaker effects and,thus, revealed significant association with PPARD expressiononly (P = .0258) (data not shown). These results supportthe idea that the expression of the adiponectin receptor andPPARδ genes is highly coordinated.
Using stepwise multiple linear regression analysis, weobserved that PPARD is, independently of the other genes,a significant determinant of CDH13 (P = .0002), but notof ADIPOR1 or ADIPOR2 (both P > .05). This suggestedthat CDH13 represents a novel PPARδ target gene. To addressthis issue, myotubes were treated for 20 h with the PPARδ-specific agonist GW501516 (1 μmol/l) and DMSO (0.1%)for carrier control. However, GW501516 treatment did notsignificantly increase CDH13 mRNA expression as compared
4 Experimental Diabetes Research
r = 0.95, P < .0001
33 55 90 148 245
90
148
245
403
665
ADIPOR2 mRNA (fg/µg, loge-scale)Adj
.AD
IPO
R1
mR
NA
(fg/µ
g,lo
g e-s
cale
)
(a)
245 403 665 1097
r = 0.93,
90
148
245
403
665
CDH13 mRNA (fg/µg, loge-scale)Adj
.AD
IPO
R1
mR
NA
(fg/µ
g,lo
g e-s
cale
)
P < .0001
(b)
33
55
90
148
245
r = 0.91, P < .0001
245 403 665 1097
CDH13 mRNA (fg/µg, loge-scale)
Adj
.AD
IPO
R2
mR
NA
(fg/µ
g,lo
g e-s
cale
)
(c)
33 55 90 148
90
148
245
403
665
r = 0.75, P < .0001
PPARD mRNA (fg/µg, loge-scale)Adj
.AD
IPO
R1
mR
NA
(fg/µ
g,lo
g e-s
cale
)
(d)
33
55
90
148
245
33 55 90 148
PPARD mRNA (fg/µg, loge-scale)
r = 0.78, P < .0001
Adj
.AD
IPO
R2
mR
NA
(fg/µ
g,lo
g e-s
cale
)
(e)
245
403
665
1097
33 55 90 148
PPARD mRNA (fg/µg, loge-scale)
r = 0.83, P < .0001
Adj
.CD
H1 3
mR
NA
(fg/µ
g ,lo
g e-s
cale
)
(f)
Figure 1: Correlations between ADIPOR1, ADIPOR2, CDH13, and PPARD mRNA contents of skeletal muscle cells from 39 human donors(N = 39). To approximate normal distribution, all data were loge transformed prior to statistical analysis. The dependent variable wasadjusted for 28S-rRNA using multiple linear regression models.
to DMSO (P = .8, n = 16), whereas it increased the ex-pression of the described PPARδ target genes PDK4 andANGPTL4 (for data, see [9]).
To assess whether the highly coordinated expression ofPPARD and the adiponectin receptor genes—all located ondifferent chromosomes—is caused by a common regulatorymiRNA, we screened the miRBase Targets database, ReleaseVersion v5 (at http://microrna.sanger.ac.uk/targets/v5/), forcommon miRNA binding sites in the four genes. In ADI-POR2, only one putative binding site was identified, namely,for miRNA-617. The other genes, however, did not reveal
any bona fide binding site for miRNA-617. Thus, miRNAsare improbable to represent the unifying link between thesegenes. To approach whether the genes are under the controlof a common transcription factor, we performed in silicoanalyses of the sequences spanning from 3 kb upstream to1 kb downstream of the transcription initiation sites. UsingAliBaba 2.1 (at http://www.gene-regulation.com/pub/pro-grams/alibaba2/index.html?), PROMO 3.0 (at http://alggen.lsi.upc.es/cgi-bin/promo v3/promo/promoinit.cgi?dirDB=TF 8.3/, MATCH1.0(athttp://www.gene-regulation.com/cgi-bin/pub/programs/match/bin/match.cgi/), and P-MATCH 1.0
Experimental Diabetes Research 5
P = .0317
rs6666089
GG XA0
1
2
3
Nor
m.A
DIP
OR
1m
RN
A(A
U,l
oge-
scal
e)
(a)
P = .1
rs6666089
GG XA0
1
2
3
Nor
m.A
DIP
OR
2m
RN
A(A
U,l
oge-
scal
e)
(b)
rs6666089
GG XA
P = .0349
0
0.5
1
1.5
2
Nor
m.C
DH
13m
RN
A(A
U,l
oge-
scal
e)
(c)
rs6666089
GG XA
P = .06
0
1
2
3
Nor
m.P
PAR
Dm
RN
A(A
U,l
oge-
scal
e)
(d)
Figure 2: Impact of the ADIPOR1 promoter SNP rs6666089 on ADIPOR1, ADIPOR2, CDH13, and PPARD mRNA contents of humanskeletal muscle cells. mRNA data were normalised for 28S-rRNA and are given in arbitrary units (AUs). To approximate normal distribution,mRNA data were loge transformed prior to statistical analysis. The rs6666089 genotype was determined by TaqMan assay. Since there wereonly two homozygous carriers of the A-allele among the muscle cell donors, we joined them with the heterozygous subjects to form the “XA”group. Data are presented as means + SE.
(at http://www.gene-regulation.com/cgi-bin/pub/programs/match/bin/match.cgi/), and P-MATCH 1.0 (at http://www.gene-regulation.com/cgi-bin/pub/programs/pmatch/bin/p-match.cgi/) freeware for prediction of transcription factor bindingsites, we identified three transcription factors, that is, signaltransducer and activator of transcription 5A, specificity pro-tein 1, and CCAAT/enhancer-binding protein α, with puta-tive binding sites in all four gene sequences. RNA inter-ference-mediated knockdown of these candidates in C2C12myocytes did however not affect the expression of PPARDor the adiponectin receptor genes (data not shown). Addi-tionally, we knocked down FoxO1, one of the known tran-scriptional regulators of the murine Adipor1 and Adipor2genes [14]. This manipulation did however not affect the ex-pression of the adiponectin receptor and PPARδ genes either(data not shown). Thus, the common upstream regulatorymechanism remains elusive.
Since both adiponectin and PPARδ signalling regulatemuscle metabolism and mitochondrial biogenesis, we inves-tigated whether the expression of genes crucially involved inthese processes, that is, PPARGC1A (encoding PPARγ coac-tivator 1α), UCP3 (encoding uncoupling protein 3), andTFAM (encoding mitochondrial transcription factor A), iscorrelated with the expression of ADIPOR1, ADIPOR2,CDH13, and PPARD. After adjustment for the housekeepinggene, we found significant associations of ADIPOR1, CDH13,and PPARD expression levels with PPARGC1A, UCP3, andTFAM (all P < .045). ADIPOR2 was significantly associatedwith TFAM only (P = .007). This strengthens the role ofthese receptors in mitochondrial oxidative metabolism.
Finally, we assessed whether the basal myotube expres-sion levels of PPARD and the adiponectin receptor genes areof relevance in vivo and reflect fasting plasma lipid parame-ters of the myotube donors. After adjustment for gender, age,
6 Experimental Diabetes Research
Nor
m.P
PAR
Dm
RN
A(A
U,l
oge-
scal
e)P = .0048
rs1053049
TT TC0
1.6
2.7
4.5
(a)
Nor
m.A
DIP
OR
1m
RN
A(A
U,l
oge-
scal
e)
P = .06
rs1053049
TT TC0
2.7
7.4
20
(b)
Nor
m.A
DIP
OR
2m
RN
A(A
U,l
oge-
scal
e)
P = .0207
rs1053049
TT TC0
1.6
2.7
4.5
7.4
(c)
Nor
m.C
DH
13m
RN
A(A
U,l
oge-
scal
e)
P = .0334
rs1053049
TT TC0
2.7
7.4
20
(d)
Figure 3: Impact of PPARD SNP rs1053049, located in the 3′-untranslated region of the gene, on PPARD, ADIPOR1, ADIPOR2, and CDH13mRNA contents of the human skeletal muscle cells. mRNA data were normalised for 28S-rRNA and are given in arbitrary units (AUs). Toapproximate normal distribution, mRNA data were loge transformed prior to statistical analysis. The rs1053049 genotype was determinedby TaqMan assay. There were no homozygous C-allele carriers among the muscle cell donors. Data are presented as means + SE.
and BMI, the fasting plasma triglyceride concentrations wereinversely associated with the ADIPOR1 and CDH13 mRNAcontents normalised for 28S-rRNA (Figures 4(a) and 4(c)).Moreover, even though not significant, the ADIPOR2 andPPARD mRNA contents tended to inversely associate withplasma triglycerides (Figures 4(b) and 4(d)). No significantassociations were detected with fasting plasma NEFA, glyc-erol, total-, HDL-, or LDL-cholesterol concentrations (allP > .1).
In addition, we assessed these genes’ association with invivo parameters of glucose metabolism. However, we did notdetect any significant association of PPARD and adiponectinreceptors expression with fasting insulin concentrations (allP ≥ .3), fasting and 120-min glucose concentrations (all P ≥.3), or with insulin sensitivity indices derived from the OGTTand the hyperinsulinaemic-euglycaemic clamp (all P > .5),respectively. Serum adiponectin levels did not associate withthe expression of PPARD, ADIPOR1, ADIPOR2, or CDH13either (all P ≥ .3).
4. Discussion
In this study, we could demonstrate, also by assessing SNPeffects, that two signalling pathways known to mediate lipid-burning and formerly considered independent, that is, thePPARδ and the adiponectin pathway, are closely linked atthe gene expression level. The most obvious mechanism pos-sibly underlying this phenomenon, that is, transcriptionalregulation of the adiponectin receptor genes by PPARδ,could be excluded since PPARδ activation using a specificand well-described pharmacological agonist had no effecton adiponectin receptor expression. Therefore, we assessedother conceivable upstream regulatory factors. Using RNAinterference, transcription factors identified as putative can-didates for binding to all four promoters, such as signal trans-ducer and activator of transcription 5A, specificity protein1, and CCAAT/enhancer-binding protein α, turned out notto be involved in this highly coordinated gene regulation,neither did FoxO1, a known transcription factor regulating
Experimental Diabetes Research 7
33
55
90
148
r = −0.36, P = .0253A
dj.p
lasm
atr
igly
ceri
des
(mg/
dL,l
oge-
scal
e)
33 55
Norm. ADIPOR1 mRNA (AU, loge-scale)
2.7 4.5 7.4 12 20
(a)
33
55
90
148
P = .1
Adj
.pla
sma
tri g
lyce
ride
s(m
g/d L
,log
e-sc
ale)
1 1.6 2.7 4.5 7.4 12 20
Norm. ADIPOR2 mRNA (AU, loge-scale)
(b)
33
55
90
148
Adj
.pla
sma
trig
lyce
ride
s(m
g/dL
,log
e-sc
ale)
33 557.4 12 20
r = −0.41, P = .0114
Norm. CDH13 mRNA (AU, loge-scale)
(c)
33
55
90
148
Adj
.pla
sma
trig
lyce
ride
s(m
g/dL
,log
e-sc
ale)
1 1.6 2.7 4.5 7.4
P = .06
Norm. PPARD mRNA (AU, loge-scale)
(d)
Figure 4: Association of myotube ADIPOR1, ADIPOR2, CDH13, and PPARD mRNA contents with fasting plasma triglyceride concentra-tions of the 39 human donors (N = 39). mRNA data were normalised for 28S-rRNA and are given in arbitrary units (AUs). To approximatenormal distribution, all data were loge transformed prior to statistical analysis. Plasma triglycerides were adjusted for gender, age, and BMIusing multiple linear regression models.
the murine Adipor1 and Adipor2 genes. miRNAs targetingall four genes could also not be identified. Thus, the unify-ing regulatory mechanism responsible for our observationremains to be uncovered in further studies addressing other,for example, epigenetic mechanisms (DNA methylation,histone modification, and nucleosome positioning).
Most importantly, we could demonstrate that myotubeexpression of PPARD and the adiponectin receptors inverselyreflects the fasting plasma triglyceride concentration of thedonors. There may be two explanations to this: either circu-lating triglycerides via their products of lipolytic breakdown,that is, via NEFA, affect the expression of PPARD and theadiponectin receptor genes or increased expression of thesegenes reduces the plasma triglyceride concentration. At leastfor PPARD, we were recently able to show that, with theonly exception of stearate, no long-chain fatty acid is able to
change its expression [9]. Thus, an influence of triglyceride-derived NEFA on these genes’ coordinated expressionappears less plausible. Instead, it is well known that theadiponectin and PPARδ pathways stimulate β-oxidation and,in this way, may reduce the plasma triglyceride concentrationof the donors. Since plasma triglycerides are a well-knownreadout of the hepatic lipid load [15], this association isin line with the observation that an impairment of fattyacid oxidation provokes increments in plasma NEFA levels,ectopic lipid deposition in nonfat tissues, and enhancedhepatic VLDL production [1] and underscores the idea ofa muscle-liver axis with muscle fatty acid oxidation beingan important determinant of hepatic lipid storage. In thiscontext, metabolic signals from β-oxidation (acyl-carnitines)or muscle-derived humoral mediators (myokines) mayrepresent interesting candidate mediators of muscle-liver
8 Experimental Diabetes Research
crosstalk. Finally, this translational finding provides evidencethat our in vitro data are of relevance for humans in vivo andmay explain the biological variance between individuals interms of good versus bad fat burners.
5. Conclusions
Expression of PPARD, ADIPOR1, ADIPOR2, and CDH13 inhuman skeletal muscle cells is highly coordinated, and thismight be of relevance for human lipid metabolism in vivo,as reflected by these genes’ consistent inverse associationwith plasma triglycerides. Thus, the upstream regulatoryfactor(s) responsible for this coordinated gene expressioncould represent promising future targets for the control ofcirculating lipids and hepatic fat load.
Conflict of Interests
The authors have no conflict of interests related to this paperto declare.
The study was in part supported by a grant from the GermanFederal Ministry of Education and Research (BMBF) to theGerman Center for Diabetes Research (DZD e.V.).
References
[1] U. Julius, “Influence of plasma free fatty acids on lipoproteinsynthesis and diabetic dyslipidemia,” Experimental and Clin-ical Endocrinology and Diabetes, vol. 111, no. 5, pp. 246–250,2003.
[2] J. Delarue and C. Magnan, “Free fatty acids and insulin resis-tance,” Current Opinion in Clinical Nutrition and MetabolicCare, vol. 10, no. 2, pp. 142–148, 2007.
[3] S. Luquet, C. Gaudel, D. Holst et al., “Roles of PPAR deltain lipid absorption and metabolism: a new target for thetreatment of type 2 diabetes,” Biochimica et Biophysica Acta,vol. 1740, no. 2, pp. 313–317, 2005.
[4] T. Yamauchi, J. Kamon, Y. Minokoshi et al., “Adiponectinstimulates glucose utilization and fatty-acid oxidation byactivating AMP-activated protein kinase,” Nature Medicine,vol. 8, no. 11, pp. 1288–1295, 2002.
[5] E. Tomas, T. S. Tsao, A. K. Saha et al., “Enhanced muscle fatoxidation and glucose transport by ACRP30 globular domain:acetyl-CoA carboxylase inhibition and AMP-activated proteinkinase activation,” Proceedings of the National Academy ofSciences of the United States of America, vol. 99, no. 25, pp.16309–16313, 2002.
[6] C. Hug, J. Wang, N. S. Ahmad, J. S. Bogan, T. S. Tsao, and H.F. Lodish, “T-cadherin is a receptor for hexameric and high-molecular-weight forms of Acrp30/adiponectin,” Proceedings
of the National Academy of Sciences of the United States ofAmerica, vol. 101, no. 28, pp. 10308–10313, 2004.
[7] H. Staiger, S. Kaltenbach, K. Staiger et al., “Expression ofadiponectin receptor mRNA in human skeletal muscle cells isrelated to in vivo parameters of glucose and lipid metabolism,”Diabetes, vol. 53, no. 9, pp. 2195–2201, 2004.
[8] H. Staiger, N. Stefan, F. Machicao, A. Fritsche, and H. U.Haring, “PPARGC1A mRNA levels of in vitro differentiatedhuman skeletal muscle cells are negatively associated with theplasma oleate concentrations of the donors,” Diabetologia, vol.49, no. 1, pp. 212–214, 2006.
[9] H. Staiger, C. Haas, J. Machann et al., “Muscle-derivedangiopoietin-like protein 4 is induced by fatty acids viaperoxisome proliferator-activated receptor (PPAR)-δ and is ofmetabolic relevance in humans,” Diabetes, vol. 58, no. 3, pp.579–589, 2009.
[10] J. Krutzfeldt, C. Kausch, A. Volk et al., “Insulin signalingand action in cultured skeletal muscle cells from lean healthyhumans with high and low insulin sensitivity,” Diabetes, vol.49, no. 6, pp. 992–998, 2000.
[11] N. Stefan, F. Machicao, H. Staiger et al., “Polymorphisms inthe gene encoding adiponectin receptor 1 are associated withinsulin resistance and high liver fat,” Diabetologia, vol. 48, no.11, pp. 2282–2291, 2005.
[12] N. Stefan, C. Thamer, H. Staiger et al., “Genetic variationsin PPARD and PPARGC1A determine mitochondrial functionand change in aerobic physical fitness and insulin sensitivityduring lifestyle intervention,” Journal of Clinical Endocrinologyand Metabolism, vol. 92, no. 5, pp. 1827–1833, 2007.
[13] C. Thamer, J. Machann, N. Stefan et al., “Variations in PPARDdetermine the change in body composition during lifestyleintervention: a whole-body magnetic resonance study,” Jour-nal of Clinical Endocrinology and Metabolism, vol. 93, no. 4,pp. 1497–1500, 2008.
[14] A. Tsuchida, T. Yamauchi, Y. Ito et al., “Insulin/Foxo1 path-way regulates expression levels of adiponectin receptors andadiponectin sensitivity,” Journal of Biological Chemistry, vol.279, no. 29, pp. 30817–30822, 2004.
[15] N. Stefan, K. Kantartzis, and H. U. Haring, “Causes andmetabolic consequences of fatty liver,” Endocrine Reviews, vol.29, no. 7, pp. 939–960, 2008.