Synthesis, characterization and in vitro antimicrobial studies of Co(II), Ni(II) and Cu(II) complexes derived from macrocyclic compartmental ligand O.A. El-Gammal ⇑ , M.M. Bekheit, S.A. El-Brashy Department of Chemistry, Faculty of Science, Mansoura University, P.O. Box 70, Mansoura, Egypt highlights Co 2+ , Ni 2+ and Cu 2+ complexes of a new macrocyclic. DFT. Antibacterial activity. graphical abstract - 0.029841 - 0.12487 Mulliken population analyses of EDHDH. article info Article history: Received 11 May 2014 Received in revised form 30 June 2014 Accepted 7 August 2014 Available online 27 August 2014 Keywords: Macrocyclic Octahedral complexes Spectral characterization Thermal degradation In-vitro antibacterial Octahedral geometry abstract New Co(II), Ni(II) and Cu(II) complexes derived from tetradentate macrocyclic nitrogen ligand, (1E,4E,8E,12E)-5,8,13,16-tetramethyl-1,4,9,12-tetrazacyclohexadeca-4,8,12,16-tetraene (EDHDH) have been synthesized. The complexes have been characterized by elemental analysis, spectral (IR, UV–Vis, 1 H NMR and ESR (for Cu(II) complex)) mass, and magnetic as well as thermal analysis measurements. The complexes afforded the formulae: [Cu(EDHDH)Cl 2 ]2EtOH and [M(EDHDH)X 2 ]nH 2 O where M = Co(II) and Ni(II), X = Cl or OH , n = 1,0, respectively. The data revealed an octahedral arrangement with N 4 tet- radentate donor sites in addition to two Cl atoms occupying the other two sites. ESR spectrum of Cu 2+ complex confirmed the suggested geometry with values of a a 2 and b 2 indicating that the in-plane r-bonding and in-plane p-bonding are appreciably covalent, and are consistent with very strong r-in-plane bonding in the complexes. The molecular modeling is drawn and showed the bond length, bond angle, chemical reactivity, energy components (kcal/mol) and binding energy (kcal/mol) for all the title com- pounds using DFT method. Also, the thermal behavior and the kinetic parameters of degradation were determined using Coats–Redfern and Horowitz–Metzger methods. Moreover, the in vitro antibacterial studies of all compounds screened against pathogenic bacteria (two Gram +ve and two Gram ve) to assess their inhibiting potential. The assay indicated that the inhibition potential is metal ion dependent. The ligand, EDHDH, Co(II) and Cu(II) complexes exhibited a remarkable antibacterial activity against Streptococcus Pyogenes as Gram +ve and Proteus vulgaris as Gram ve bacterial strains. On the other hand, Ni(II) complex revealed a moderate antibacterial activity against both Gram +ve organisms and no activ- ity against Gram ve bacterial strain. Ó 2014 Elsevier B.V. All rights reserved. http://dx.doi.org/10.1016/j.saa.2014.08.016 1386-1425/Ó 2014 Elsevier B.V. All rights reserved. ⇑ Corresponding author. Tel.: +20 1226712958. E-mail address: [email protected](O.A. El-Gammal). Spectrochimica Acta Part A: Molecular and Biomolecular Spectroscopy 137 (2015) 207–219 Contents lists available at ScienceDirect Spectrochimica Acta Part A: Molecular and Biomolecular Spectroscopy journal homepage: www.elsevier.com/locate/saa
Transcript
Spectrochimica Acta Part A: Molecular and Biomolecular Spectroscopy 137 (2015) 207–219
Contents lists available at ScienceDirect
Spectrochimica Acta Part A: Molecular andBiomolecular Spectroscopy
journal homepage: www.elsevier .com/locate /saa
Synthesis, characterization and in vitro antimicrobial studies of Co(II),Ni(II) and Cu(II) complexes derived from macrocyclic compartmentalligand
http://dx.doi.org/10.1016/j.saa.2014.08.0161386-1425/� 2014 Elsevier B.V. All rights reserved.
New Co(II), Ni(II) and Cu(II) complexes derived from tetradentate macrocyclic nitrogen ligand,(1E,4E,8E,12E)-5,8,13,16-tetramethyl-1,4,9,12-tetrazacyclohexadeca-4,8,12,16-tetraene (EDHDH) havebeen synthesized. The complexes have been characterized by elemental analysis, spectral (IR, UV–Vis,1H NMR and ESR (for Cu(II) complex)) mass, and magnetic as well as thermal analysis measurements.The complexes afforded the formulae: [Cu(EDHDH)Cl2]�2EtOH and [M(EDHDH)X2]�nH2O where M = Co(II)and Ni(II), X = Cl� or OH�, n = 1,0, respectively. The data revealed an octahedral arrangement with N4 tet-radentate donor sites in addition to two Cl atoms occupying the other two sites. ESR spectrum of Cu2+
complex confirmed the suggested geometry with values of a a2and b2 indicating that the in-planer-bonding and in-plane p-bonding are appreciably covalent, and are consistent with very strong r-in-planebonding in the complexes. The molecular modeling is drawn and showed the bond length, bond angle,chemical reactivity, energy components (kcal/mol) and binding energy (kcal/mol) for all the title com-pounds using DFT method. Also, the thermal behavior and the kinetic parameters of degradation weredetermined using Coats–Redfern and Horowitz–Metzger methods. Moreover, the in vitro antibacterialstudies of all compounds screened against pathogenic bacteria (two Gram +ve and two Gram �ve) toassess their inhibiting potential. The assay indicated that the inhibition potential is metal ion dependent.The ligand, EDHDH, Co(II) and Cu(II) complexes exhibited a remarkable antibacterial activity againstStreptococcus Pyogenes as Gram +ve and Proteus vulgaris as Gram �ve bacterial strains. On the other hand,Ni(II) complex revealed a moderate antibacterial activity against both Gram +ve organisms and no activ-ity against Gram �ve bacterial strain.
� 2014 Elsevier B.V. All rights reserved.
208 O.A. El-Gammal et al. / Spectrochimica Acta Part A: Molecular and Biomolecular Spectroscopy 137 (2015) 207–219
Introduction
The chemistry of macrocyclic complexes has received muchattention in recent years [1] due to their potential analytical,industrial and medical applications as well as coordination chem-istry [2]. Macrocycles are important and powerful ligands, ubiqui-tous in transition metal coordination chemistry as they weredeveloped as natural mimic important biological ligands such asthe porphyrin prosthetic group of many metalloproteins [3]. Mac-rocyclic compartmental ligands have a great advantage over acy-clic ligands for this purpose because macrocyclic heterodinuclearcores can be thermodynamically stabilized and kinetically retardedtoward metal dissociation and substitution by the so-called ‘mac-rocyclic effect’ [4]. They are best prepared by the aid of metal ionsas templates to direct the condensation reaction toward ring clo-sure [5–7]. Nitrogen-containing macrocycles have a strong ten-dency to form stable complexes with transition metals and havebeen reported to exhibit potent antibacterial, antifungal and anti-HIV activities [8–11]. Macrocyclic nickel complexes were used inDNA recognition and oxidation [12] while macrocyclic coppercomplexes are employed in DNA binding and cleavage [13]. Cu(II)complexes with isatin Schiff base ligands obtained by the conden-sation of aromatic amines with isatin were found to be powerfulanticonvulsant, antiviral, antibacterial, antifungal and antitumoragents [14–16]. Also, macrocyclic Mn(II), Co(II), Ni(II), Pd(II) andPt(II) complexes derived from isatin or acetylacetone and ethylene-diamine were found to exhibit noble antifungal activities than theligand [17,18]. The present work is focused on preparation, struc-tural elucidation and antibacterial activity of a new macrocyclictetraaza Schiff base, 5,8,13,16 tetramethyl-1,4,9,12-tetraazacyclo-hexdeca-4,8,12,16-tetraene(EDHDH) as well as its complexes withCo(II), Ni(II) and Cu(II) metal ions.
Experimental
Instrumentation and materials
The compounds used were purchased from Aldrich and Flukaand used without further purification. Elemental analyses (C, H,N) were performed with a Perkin–Elmer 2400 series II analyzer.The determination of metal and chloride contents in complexeswas carried out according to the standard methods [19]. Molarconductance values (10�3 mol L�1) of the complexes, in DMSO,were measured using a Tacussel conductivity bridge modelCD6NG. FTIR spectra (4000–400 cm�1) were recorded on a Mattson5000 FTIR spectrophotometer. Electronic spectra were recorded ona Unicam UV–Vis. spectrophotometer UV2. 1H NMR measurementsin d-CDCl3 at room temperature were carried out on a Varian Gem-ini WM-200 MHz spectrometer at the Microanalytical Unit, CairoUniversity. The ESR spectra of Cu2+ complex was recorded on a Bru-ker EMX spectrometer working in the X-band (9.78 GHz) with100 kHz modulation frequency. The microwave power and
Table 1Analytical and physical data of EDHDH and its Co(II), Ni(II) and Cu(II) complexes.
Compound Empirical formula F.wt. Found (Calcd) Color M.p.
EDHDH 274.38 Buff 137C16H28N4 (276.4)[Co(EDHDH)Cl2]�H2O 421.54 Reddish brown >300C16H30Cl2CoN4O (424.26)[Cu(EDHDH)Cl2]�2EtOH 496.37 Dark brown >300C20H40Cl2CuN4O2 (502.90)[Ni(EDHDH)(OH)2] 371.45 Brown >300C16H30Cl2NiN4O2 (369.13)
modulation amplitudes were set at 1 mW and 4 Gauss, respectively.The low field signal was obtained after four scans with 10 foldsincrease in the receiver again. A powder spectrum was obtainedin a 2 mm quartz capillary at room temperature. Magnetic suscep-tibilities were measured with a Sherwood scientific magnetic sus-ceptibility balance at 298 K. Thermogravimetric measurements(TGA, DTA, 20–1000 �C) were recorded on a DTG-50 Shimadzuthermogravimetric analyzer at a heating rate of 10 �C/min andnitrogen flow rate of 20 ml/min.
Synthesis of macrocyclic Schiff base (EDHDH)
The tetradentate macrocyclic nitrogen ligand (EDHDH) wasobtained by (2 + 2) condensation of 2,5-hexanedione (2.4 ml,0.02 mol) and ethylene diamine (1.5 ml, 0.02 mol) in hot ethanolsolution with constant stirring. The mixture was refluxed at 80 �Cfor 8 h in the presence of few drops of conc. HCl (pH–3–4). Uponcooling a cream colored compound precipitated. The precipitatewas filtered, washed several times with cold EtOH and dried undervacuum over anhydrous CaCl2. The purity of the product waschecked was by TLC. Yield: 70% and the melting point is 137 �C.
Synthesis of metal complexes
Hot ethanolic solution (20 ml) of the corresponding metal chlo-rides (0.001 mol) and a hot ethanolic solution (20 ml) of therespective ligand (0.001 mol) were mixed together with constantstirring. The reaction mixture was refluxed for 6 h at 80 �C. Oncooling a dark brown precipitate was formed in each case. Theproduct was filtered, washed several times with cold ethanol anddried under vacuum anhydrous CaCl2.
Computational details
We performed cluster calculations using DMOL3 program [20]in Materials Studio package [21], which is designed for the realiza-tion of large scale density functional theory (DFT) calculations. DFTsemi-core pseudopods calculations (dspp) were performed withthe double numerical basis sets plus polarization functional(DNP). The DNP basis sets are of comparable quality to 6-31GGaussian basis sets [22]. Delley et al. showed that the DNP basis setsare more accurate than Gaussian basis sets of the same size [23].The RPBE functional [23] is so far the best exchange–correlationfunctional [24], based on the generalized gradient approximation(GGA), is employed to take account of the exchange and correlationeffects of electrons. The geometric optimization is performedwithout any symmetry restriction.
Antibacterial activity
Four bacterial strains (2 Gram-positive and 2 Gram-negative)were selected on the basis of their clinical importance in causing
O.A. El-Gammal et al. / Spectrochimica Acta Part A: Molecular and Biomolecular Spectroscopy 137 (2015) 207–219 209
diseases in humans. The strains selected for the study are Strepto-coccus pyogenes and Staphylococcus epidermidis (as Gram-positivebacteria) while Proteus vulgaris and Klebsiella spp. (as Gram-negative bacteria). These strains were screened for evaluationof antibacterial activities of the synthesized compounds. Theantibacterial activity of the macrocyclic complexes was evaluatedby agar well diffusion method [25]. The tested compounds weredissolved in DMSO which have no inhibition activity to get concen-trations of 200 mg/ml. A hot nutrient agar solution (20 ml) waspoured into the sterilized petri dishes and allowed to attain roomtemperature. The seed layer medium was melted and cooled to
ca. 45 �C with gentle shaking. The previously grown subculturewas added to the seed layer medium aseptically and mixed well.It was immediately raked into the petri dish and allowed to attainroom temperature. Then wells were made with a sterile cork borerand to these wells, 50 ll in concentration of 200 mg/ml of thetested compound was added and the plates were allowed to coolfor 1 h to facilitate the diffusion. The plates were incubated at37 �C for 48 h. Antibacterial activity of all the complexes was eval-uated by measuring the diameter of zone of inhibition in mm. Themedium with dimethylsulphoxide (DMSO) as solvent was used asa negative control whereas media with ciprofloxacin (standardantibiotic for Gram-positive) and gentamicin (standard antibioticfor Gram-negative) were used as positive control. The experimentswere repeated three times and the values recorded are the meanaverage.
Results and discussion
All complexes gave satisfactory elemental analyses results andshown in Table 1. The test forthe anions were positive after
Structure II. (a) Molecular structure of [Co (EDHDH) (Cl)2]H2O, (b) electron density of [Co (EDHDH)(Cl)2]H2O, (c) HOMO of [Co (EDHDH)(Cl)2]H2O, and (d) LUMO Of [Co(EDHDH)(Cl)2]H2O.
210 O.A. El-Gammal et al. / Spectrochimica Acta Part A: Molecular and Biomolecular Spectroscopy 137 (2015) 207–219
decomposition of the complexes, indicating their presence insidethe coordination sphere. The complexes are insoluble in water orin nonpolar organic solvents and partially soluble in DMSO orDMF solutions. The molar conductance of the solid complexesmeasured by sandwich technique using keithly electrometer indi-cated the nonelectrolytic nature of the complexes [26]. Variousattempts, such as crystallization using mixtures of solvents andlow temperatures, were unsuccessful for the growth of a singlecrystal suitable for X-ray crystallography. However, the analytical,spectroscopic and magnetic data enabled the possible structure ofthe synthesized complexes to be predicted.
IR spectra
The Important FTIR bands and their assignments of the ligand),EDHDH (Structure I) (Supplementary material, Fig. 1S), EDHDH(Structure I) and its complexes are listed in Table 2. The IRspectrum of the ligand does not exhibit any band in the region3200–3390 cm–1 corresponding to the m(NH2) group or near1716 cm–1 characteristic to C@O group indicating the absence ofthese groups and the complete condensation of the amino groupwith the keto group and the formation of a macrocyclic Schiff’sbase [27]. This is further supported by the strong band at1575 cm–1 which is attributed to the t(C@N) stretching vibration.This band is shifted toward higher wavenumber in the IR spectraof metal complexes (Structures II–IV) and may be explained by adrift of the lone pair electron density of the azomethine nitrogentoward the metal atom [28]. Thus suggesting the participation of
azomethine groups in coordination to the metal ions [28]. Theintense bands at 29701, 2932 and 2888 cm�1 are attributed tosymmetric and asymmetric stretching vibrations of aliphatic CH2
and CH3 groups. In the IR spectrum of Ni(II) complex the sharpband appeared at 3406 cm�1 is attributed to t(OH) mode whilethe two bands observed at �3438 and 1392 cm�1 in the spectrumof Cu(II) complex are assignable to m(OH) and d(OH) of ethanolmolecule. The new bands at 419 and 422 cm�1 are assignable tom(MAN) vibration [28] confirming the proposed mode of coordina-tion. On the other hand, the broad band centered at 3500 cm�1 inthe IR spectrum of Co(II) complex may be due to hydrated water.This notification will be supported by thermal analysis.
1H NMR Spectrum
The 1H NMR spectrum (Fig. 1) of the ligand EDHDH in CDCl3 as asolvent does not give any signal corresponding to the primary amineprotons. The spectrum exhibits three singlets, one at ca. d 2.00 ppm(S, 12H, 4CH3), second at ca. d 3.84 ppm (S, 4H, 2CH2) and third at ca.d 5.72 ppm (S, 8H, 4CH2). These signals indicate the presence of threetypes of the different protons in the ligand [29].
Electronic spectra
The electronic spectra were measured in dimethylsulfoxide(DMSO) solution for EDHDH and in Nujol for its metal complexes.The tentative assignments of the significant spectral absorption
Structure III. (a) Molecular structure of [Ni (EDHDH)(OH)2], (b) electron density of [Ni(EDHDH)(OH)2], (c)HOMO of [Ni (EDHDH)(OH)2], and (d) LUMO of [Ni(EDHDH)(OH)2].
O.A. El-Gammal et al. / Spectrochimica Acta Part A: Molecular and Biomolecular Spectroscopy 137 (2015) 207–219 211
bands, magnetic moments and ligand field parameters of metal com-plexes are given in Table 3. The intra ligand bands viz p ? p* andn ? p* transitions due to (C@N)azomethine groups observed at40,000–33,557 (250–298 nm) and 29411–27624 cm–1 (340–362 nm) regions [30]. A red shift is observed for the n ? p* transitionin the spectra of complexes as a result of the participation of the lonepairs of C@N groups in bonding [31]. The Cl ? M2+ transition is gen-erally found in the 29585 cm�1() region and would contribute to thehigher energy n ? p* band [30]. The band located at 22424–20325 cm�1 (445.9–492.0 nm) in the spectra of the complexesmay be due to LMCT.
The electronic spectrum of Co(II) complex shows bands at 14662(682 nm) and 18248 cm�1 (548 nm) assignable to 4T1g(F) ? 4A2g
(F)(m2) and 4T1g(F) ? 4T1g(P)(m3) transitions, respectively resembleto those reported for distorted octahedral cobalt(II) complexes [32].The assignment of the first spin-allowed band (m1) seems plausiblesince the first band appears at approximately half the energy of thevisible band. The calculated values of the ligand field parameters(Dq, B and b) are: 784, 825 cm�1 and 0.85 cm�1 and the magneticmoment value (4.87 B.M.) are in accordance with the proposedgeometry. Also, the reduction of b value from 1 indicates the cova-lency of the metal–ligand bond [32].
The spectrum of Ni(II) complex exhibited a well-discernabletwo bands observed at ca. 17301 and 24154 cm–1 () assigning to3A2g ?
3T1g(F) (m2) and 3A2g ? 3T1g(P) (m3) transitions, respec-
tively [33]. The intense higher energy band at ca. 34,000 cm–1
(294 nm) may be due to a p ? p* transition of the (C@N) group.The spectrum is consistent with the distorted octahedral natureof the complex. The calculated ligand field parameters, Dq, B andb (1075, 614 and 0.58) can be taken as an additional evidence forthe supposed geometry. Also, the magnetic moment value,leff. = 2.90 B.M. lies in the range reported for octahedral [33]. Theelectronic spectrum of the copper complex exhibited band at�18516 cm–1 (540 nm) with a shoulder on the low energy side at�16556 cm–1 (604 nm), which showed that the complex was dis-torted octahedral [34]. Assuming tetragonal distortion in the mol-ecule, the d-orbital energy level sequence for these complexes maybe: x2 � y2 > z2 > xy > xz > yz and the shoulder can be assigned toz2, x2 � y2 (2B1g ?
2B2g) and the broad band contained both thexy, x2 � y2 (2B1g ?
2Eg) and xz, yz ? x2 � y2 (2B1g ?2A2g) transi-
tions [35]. Therefore, it may be concluded that all the complexesformed by the macrocycles with Cu(II) metals are distorted octahe-dral which is consistent with the work reported [35]. Also, themagnetic moment of the copper complex (2.1 B.M.) is an additionalevidence of the suggested geometry.
ESR spectra
ESR spectrum of Cu(II) complex was recorded in the solid state atroom temperature and is shown in Fig. 2. The spin Hamiltonian
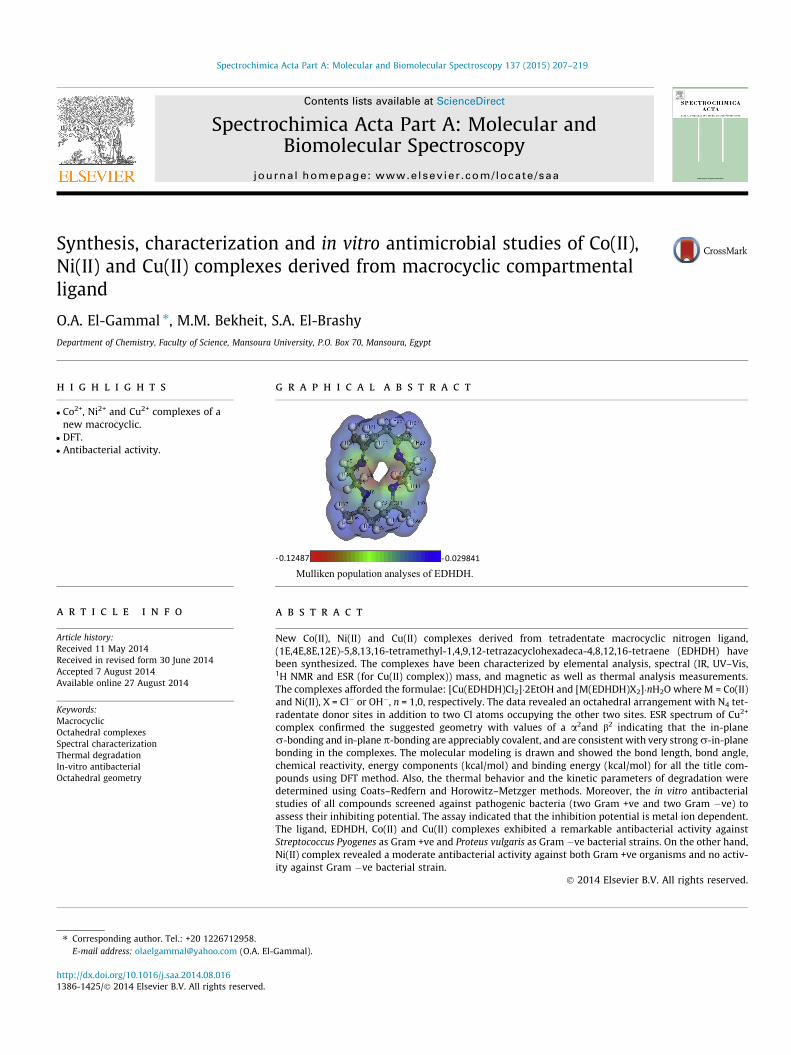
Structure IV. (a) Molecular structure of [Cu (EDHDH)(Cl)2]�2EtOH, (b) electron density of [Cu(EDHDH)(Cl)2]�2EtOH, (c)HOMO of [Cu (EDHDH) (Cl)2]�2EtOH, and (d) LUMO of[Cu(EDHDH)(Cl)2]�2EtOH.
212 O.A. El-Gammal et al. / Spectrochimica Acta Part A: Molecular and Biomolecular Spectroscopy 137 (2015) 207–219
parameters of the complex were calculated. The spectrum exhibitsan axially symmetric g-tensor parameters with g||(2.021) >g\(2.014) > 2.0023 indicating that the copper site has a dx2�y2
ground-state characteristic of square planar or octahedral stereo-chemistry [36]. In axial symmetry, the g-values are related by theexpression, G = (g|| � 2)/(g\ � 2) = 4. According to Hathaway [37],as value of G is greater than 4, the exchange interaction betweencopper(II) centres in the solid state is negligible, whereas when itis less than 4, a considerable exchange interaction is indicated inthe solid complex. The calculated G value for the copper complexis less than 4 suggesting copper–copper exchange interactions.The absorption signal for the present complex consists of a broadband centered at about g = 2 which is attributable to dipolar broad-ening and enhanced spin lattice relaxation [38]. This line broadeningis probably due to insufficient spin-exchange narrowing toward thecoalescence of four copper hyperfine lines to a single line, note that,the same kind of powder ESR line shapes, have also been observedfor many square planar or distorted octahedral Cu(II) complexeswith a considerably strong intradimer spin-exchange interaction[39]. Hyperfine splitting due to the spin of the copper nucleus wasnot detected because of the broadness of signal. A forbidden mag-netic dipolar transition for the complex is observed at half-field(ca. 1600 G, g � 4.0) but the intensity is very weak. In order to
quantify the degree of distortion of the copper(II) complex, we calcu-lated the f-factor (g||/A||) which is considered as an empirical index oftetrahedral distortion [37] and found to be 143.6, which is character-istic for slight to moderate distortion [38] demonstrating the pres-ence of significant dihedral angle distortion in the xy-plane andthe results are consistent with distorted octahedral geometryaround the copper site and supports the coordination through azo-methine nitrogen which in turn enforces the structure to remainin a nearly octahedral geometry [39]. This is further confirmed bymolecular modeling.
Molecular orbital coefficients, a2 (A measure of the covalence ofthe in-plane bonding between a copper 3d orbital and the ligandorbitals) and b2 (covalent in-plane p-bonding), were calculatedby using the following equations [40]:
where k = �828 cm�1 for the free copper ion and E is the electronictransition energy. The values of a2 and b2 (0.64 and 0.81) indicatesthat the in-plane p-bonding are appreciably ionic. These data arewell consistent with other reported data [41].
Fig. 1. H NMR spectrum of EDHDH.
Table 3Spectral absorption bands, magnetic moments and ligand field parameters of EDHDH and its metal complexes.
Compound Band position (cm�1) Assignment Ligand field parameters leff (B.M.)
Dq (cm�1) B (cm�1) b
EDHDH 35460 (282), 33220 (301) p ? p* – – – –28090 (356) n ? p⁄
O.A. El-Gammal et al. / Spectrochimica Acta Part A: Molecular and Biomolecular Spectroscopy 137 (2015) 207–219 213
Mass spectra
The mass spectra of EDHDH and its complexes and the molecu-lar ion peaks that confirm the proposed formulae are listed inTable 1. As a typical example, the mass spectrum of EDHDH(Fig. 3) which showed peaks corresponding to the successive deg-radation of the molecule. The appearance of a molecular ion peakat m/e = 274.386 (15.80%) is in accordance with the molecularmass of the present compound (C16H28N4) [42]. The second peakat m/e = 209.8(60.50%) corresponding to the removal of C3H5Nfragment after which multi peaks are observed. The base peak afterdegration at m/e = 57.1(82.80%) represents C5H10N moiety [42].
Fig. 3. Mass spectrum of EDHDH.
Table 4Decomposition steps with the temperature range and weight loss for EDHDH and its metal complexes.
Complex Step Temp. range (�C) Removed species Wt. loss
214 O.A. El-Gammal et al. / Spectrochimica Acta Part A: Molecular and Biomolecular Spectroscopy 137 (2015) 207–219
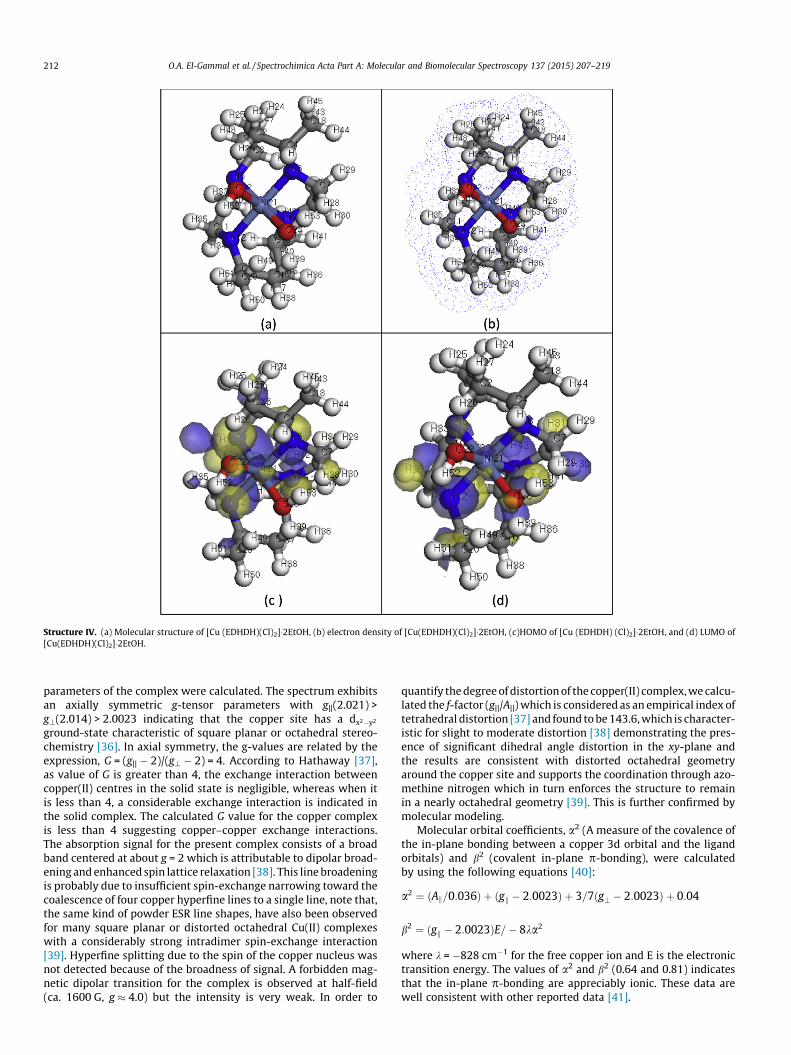
Thermogravimetric studies
The stages of decomposition, temperature range, decomposi-tion product as well as the weight loss percentages of the com-plexes are given in Table 4. Fig. 4 shows the TGA curves of themetal complexes. [Co (EDHDH)(Cl)2]H2O complex is chosen as arepresentative example since it contains water of crystallization.TG thermogram of this complex displayed three degradation
stages. The first stage at 25–69 �C with weight loss of 12.96(Calcd. 12.84%) is corresponding to the loss of one lattice watermolecule and HCl molecule. The second stage with weight lossof 55.71 (Calcd. 55.81%) at 70–470 �C is attributed to the elim-ination of 2N2 + HCl + 2C2H6 + 3C2H4 fragments. The third one at471–500 �C with weight loss of 6.70 (Calcd. 6.14%) is referringto the removal of C2H2 fragment. The residual part is Co + 4C(Found 25.25, Calcd. 25.22%). An inspection of the data
DH)Cl2]�H2O, (c) [Ni(EDHDH)(OH)2], and (d) [Cu(EDHDH)Cl2]�2EtOH.
Table 5Kinetic parameters evaluated by Coats–Redfern equation for EDHDH and its metal complexes.
Complex Peak Mid Temp (K) Ea (kJ/mol) A (S�1) DH (kJ/mol) DS (kJ/mol K) DG (kJ/mol)
Fig. 5. Coats–Redfern plots of 1st step degradation of: (a) EDHDH, (b) [Co(EDHDH)Cl2]�H2O, (c) [Ni(EDHDH)(OH)2], and (d) [Cu(EDHDH)Cl2]�2EtOH.
O.A. El-Gammal et al. / Spectrochimica Acta Part A: Molecular and Biomolecular Spectroscopy 137 (2015) 207–219 215
Fig. 6. Horowitz–Metzger plots of 1st step of (a) EDHDH, (b) [Co(EDHDH)Cl2]�H2O, (c) [Ni(EDHDH)(OH)2], and [Cu(EDHDH)Cl2]�2EtOH.
Table 7Calculated EHOMO, ELUMO, electronegativity (v), chemical potential (l), global hardness (g), global softness (S), global electrophilicity index (x) and softness (r) for EDHDH and itsmetal complexes.
216 O.A. El-Gammal et al. / Spectrochimica Acta Part A: Molecular and Biomolecular Spectroscopy 137 (2015) 207–219
represented in Table 4 indicates that TG thermograms displayed ahigh residual part for the studied complexes reflecting a higher ther-mal stability owing to the existence of five membered rings.
Kinetic data
The kinetic and thermodynamic parameters of thermal degra-dation process have been calculated using Coats–Redfern andHorowitz–Metzger models [43,44]. Coats–Redfern relation is asfollows:
ln � lnð1� aÞT2
� �¼ ln
ARbE
� �� E
RTð1Þ
where a represents the fraction of sample decomposed at time t,defined by:
a ¼ W0 �W t
Wo �W1
In which W0, Wt and W1 are the weight of the sample beforethe degradation, at temperature t and after total conversion,
respectively. T is the derivative peak temperature. b is the heatingrate = dT/dt, Ea and A are the activation energy and the Arrhenius
pre-exponential factor, respectively. A plot of ln � lnð1� aÞ=T2h i
versus 1/T gives a straight line whose slope (Ea/R) and the pre-exponential factor (A) can be determined from the intercept.
The Horowitz–Metzger relation [44] used to evaluate thedegradation kinetics is:
ln � lnð1� aÞ½ � ¼ Eh
RT2s
ð2Þ
where h = T � Ts, Ts is the DTG peak temperature, T is the temper-ature corresponding to weight loss Wt. A straight line should beobserved between ln½� lnð1� aÞ� and h with a slope of Ea/RT2. Anumber of pyrolysis processes can be represented as a first orderreaction. Particularly, the degradation of a series of complexeswas suggested to be first order, therefore we assume n = 1 forthe remainder of the present text. The other thermodynamicparameters of activation can be calculated by Eyring equation[45]:
Fig. 7. Comparison of inhibition zone (in mm) of compounds against Gram-negative and Gram-positive bacterial stains.
O.A. El-Gammal et al. / Spectrochimica Acta Part A: Molecular and Biomolecular Spectroscopy 137 (2015) 207–219 217
DH ¼ Ea � RT ð3Þ
DS ¼ R lnhAkBT
ð4Þ
DG ¼ DH � TDS ð5Þ
Thermodynamic parameters such as activation energy (Ea), pre-exponential factor (A), entropy of activation (DS⁄), enthalpy of acti-vation (DH⁄) and free energy of activation (DG⁄) of decompositionsteps were calculated using Coats–Redfern [43] and Horowitz–Metzger [44] methods (Tables 5 and 6). In both methods, the liftside of Eqs. (3) and (4) are plotted against 1/T and h, respectively(Figs. 5 and 6). A glance at the tables indicates that the high valuesof the energy of activation, Ea of the complexes reveals the highstability of such chelates due to their covalent bond character[46] and the increase of Ea on going from Cu(II) complex to Co(II)complex reflects the greater thermal stability of second complexthan the first one as Ea depends on the strength of (N ? M N)and increases with increasing the cation radius. The positive signof DG⁄ for the investigated complexes reveals that the free energyof the final residue is higher than that of the initial compound, andall the decomposition steps are non-spontaneous processes. Also,the values of the activation, DG⁄ increases significantly for the sub-sequent decomposition stages of a given complex. This is due toincreasing the values of TDS⁄ significantly from one step to anotherwhich overrides the values of DH⁄. On the other hand, the negativevalues of DS⁄ for the degradation process indicates more orderedactivated complex than the reactants or the reaction is slow [47].
Chemical reactivity
Global reactivity descriptorsThe determination of energies of the HOMO (p donor) and
LUMO (p acceptor) are important parameters in quantum chemical
Table 8Antibacterial activities in terms of inhibition zone diameter (mm) of ligand and its metal
Compound Zone of inhibition of bacterial growth (mm)
calculations. The HOMO is the orbital that primarily acts as anelectron donor and the LUMO is the orbital that largely act asthe electron acceptor. These molecular orbitals are also called thefrontier molecular orbitals (FMOs).
i. The EHOMO and ELUMO and their neighboring orbitals are allnegative, which indicate that the prepared molecules arestable [48].
ii. The overlap between the HOMO and the LUMO is a govern-ing factor in many reactions. We can indicate that from thecalculation by searching for the largest values of molecularorbital coefficients. So, orbitals of the ligand with the largestvalue of molecular orbital coefficients may be considered asthe sites of coordination. This conclusion is confirmed by thedata obtained from the calculation because the nitrogen ofthe C@N group has the largest values of molecular orbitalcoefficients.
iii. The HOMO level is mostly localized on the protonated N (8),N (15) and N (16) atoms (Structure c and d) revealing thatthese atoms are the preferred sites for nucleophile attackat the central metal ion.
iv. The energy gap (EHOMO � ELUMO) is an important stabilityindex helps to characterize the chemical reactivity andkinetic stability of the molecule [48]. A molecule with asmall energy gap is more polarized and is known as soft mol-ecule. Soft molecules are more reactive than hard onesbecause they easily offer electrons to an acceptor. Theenergy gap is small in EDHDH indicating that charge transfereasily occurs in it which influences the biological activity ofthe molecule. Low value of energy gap is also due to thegroups that enter into conjugation [49]. DFT method conceptthe chemical reactivity and site selectivity of the molecularsystems. The energies of frontier molecular orbitals (EHOMO,ELUMO), energy band gap which explains the eventual chargetransfer interaction within the molecule, electronegativity(v), chemical potential (l), global hardness (g), global soft-ness (S) and global electrophilicity index (x) [49] are listedin Table 7.
v ¼ �1=2ðELUMO þ EHOMOÞ ð6Þ
l ¼ �v ¼ 1=2ðELUMO þ EHOMOÞ ð7Þ
g ¼ 1=2ðELUMO � EHOMOÞ ð8Þ
S ¼ 1=2g ð9Þ
x ¼ l2=2g ð10Þ
The inverse value of the global hardness is designed as the soft-ness as follow:
218 O.A. El-Gammal et al. / Spectrochimica Acta Part A: Molecular and Biomolecular Spectroscopy 137 (2015) 207–219
Geometry optimization with DFT method
The molecular structure along with atom numbering of EDHDHand its metal complexes are shown in structures (I–IV). Analysis ofthe data in Tables 1S–9S including the bond lengths and bondangles, one can conclude the following remarks:
i. N(7)AC(19), N(8)AC(17), N(15)AC(18) and N(16)AC(20)bond lengths become slightly longer in complexes as thecoordination takes place via N atoms of AC@NA group inall complexes [50].
ii. The CAN bond distances in all complexes becomes longerdue to the formation of MAN bond which makes the CANbond weaker [50].
iii. The bond angles of the hydrazone moiety of EDHDH arealtered somewhat upon coordination; the largest changeaffects C(9)AC(11)AN(15), C(14)AC(11)AN(15), C(10)AC(12)AN(16), C(13)AC(12)AN(16), C(11)AN(15)AC(18),C(12)AN(16)AC(20), N(8)AC(17)AC(18), N(15)AC(18)AC(17), N(7)AC(19)AC(20) and N(16)AC(20)AC(19) angleswhich are reduced or increased on complex formation as aconsequence of bonding [50].
iv. The bond angles, N(7)AM(21)AN(8), N(7)AM(21)AN(15),N(7)AM(21)AN(16) and N(8)AM(21)A N(16) {M = Co(II)and Cu(II)} and N(5)ANi(21)AN(6), N(5)ANi(21)AN(9),N(5)ANi(21)AN(12) and N(6)ANi(21)AN(12) in case ofNi(II) complex have values of (176.7–170.6�), (88.2–81.4�),(95.6–83.0�) and (90.5–78.3�), respectively. These bondangles in addition to those of ClAMACl in all complexesindicate that the complexes adopt a distorted octahedralarrangement predicting sp3 d2 hybridization. The Cu(II) cen-ter may be considered to be in an axially compressed alongN(15)ACu(12)AO(10) Jahn–Teller distorted octahedralgeometry [50].
v. The complexes can be arranged according to MANazomethine
bond lengths as follows: Ni(21)AN(5) < Co(21)AN(7)< Cu(21)AN(7); Ni(21)AN(6) > Co(21)AN(8) > Cu(21)AN(8);Ni(21)AN(9) > Co(21)AN(15) > Cu(21)AN(15) and Ni(21)AN(12) > Co(21)AN(16) > Cu(21)AN(16)reflecting the greatstrength of the CoAN and CuAN bonds.
vi. The bond angles within the hydrazone backbone do notchange significantly but the angles around the metalundergo appreciable variations upon changing the metalcenter [51–53].
vii. The lower HOMO energy values show that molecules donat-ing electron ability is the weaker. On contrary, the higherHOMO energy implies that the molecule is a good electrondonor. LUMO energy presents the ability of a moleculereceiving electron [51–53].
Other molecular propertiesThe calculations of the binding energy revealed that the
increase of the value of the calculated binding energy of complexescompared to that of the ligand. This reveals the higher stability ofthe formed metal complexes than that of ligand. Also, the energycomponents were calculated by DFT method shown in Table 9S.
Antibacterial activity
An insight on the data obtained for diameter of inhibition zone(Fig. 7 and Table 8), it was found that all the complexes have var-iable activity against both types of bacterial strains. The ligand,EDHDH, Co(II) and Cu(II) complexes exhibited a remarkable anti-bacterial activity against S. Pyogenes as Gram +ve and P. vulgarisas Gram �ve bacterial strains. Ni(II) complex revealed a moderateantibacterial activity against both Gram +ve organisms and no
activity against Gram �ve bacterial strain. The following importantcomments can be concluded:
1. The variation in the effectiveness of different compoundsagainst different organisms depends on either the impermeabil-ity of the cells of the microbes or on differences in ribosome ofmicrobial cells [54].
2. The tested complexes were more active against Gram-positivethan Gram-negative bacteria, it may be concluded that the anti-microbial activity of the compounds is related to cell wall struc-ture of the bacteria. It is possible because the cell wall isessential to the survival of bacteria and some antibiotics areable to kill bacteria by inhibiting a step in the synthesis of pti-doglycan. Gram-positive bacteria possess a thick cell wall con-taining many layers of peptidoglycan and teichoic acids, butin contrast, Gram negative bacteria have a relatively. Thin cellwall consisting of a few layers of peptidoglycan can surroundby a second lipid membrane containing lipopoly–saccharidesand lipoproteins. These differences in cell wall structure canproduce differences in antibacterial susceptibility and someantibiotics can kill only Gram-positive bacteria and is infectiveagainst Gram-negative pathogens [55].
3. The negative results can be attributed either to the inability ofthe complexes to diffuse through the cell wall of the bacteriumand hence unable to interfere with its biological activity or theycan diffuse and inactivated by unknown cellular mechanism i.e.bacterial enzymes. The complexation reaction reduces thepolarity of the metal ion by the partial sharing of metal ion posi-tive charge with donor groups and electron delocalization overthe chelate ring [56]. Thus, the lipophilic character of the cen-tral metal atom is enhanced which results in a higher capabilityto penetrate the microorganisms through the lipid layer of thecell membrane.
4. The importance of such work lies in the possibility that the newcompounds might be more effective drugs against bacteria forwhich a thorough investigation regarding the structure–activityrelationship, toxicity and in their biological effects which couldbe helpful in designing more potent antibacterial agents fortherapeutic use.
Conclusion
The tetradentate macrocyclic nitrogen ligand (EDHDH)obtainedby (2 + 2) condensation of 2,5-hexanedione and ethylene diamineand its metal complexes with Co(II), Ni(II) and Cu(II) were preparedand characterized. EDHDH behaves as neutral tetradentate in bind-ing to all metal ions affording a distorted octahedral geometry forall complexes. The molecular modeling is drawn and showed thebond length, bond angle, chemical reactivity, energy components(kcal/mol) and binding energy (kcal/mol) for all the title com-pounds using DFT method. The antibacterial studies of the pre-pared compounds screened against pathogenic bacteria provedthat these compounds exhibit selective antibacterial activity.
Appendix A. Supplementary material
Supplementary data associated with this article can be found, inthe online version, at http://dx.doi.org/10.1016/j.saa.2014.08.016.
References
[1] S. Chandra, R. Kumar, Transition Met. Chem. 29 (2004) 269.[2] S. Chandra, R. Gupta, N. Gupta, S.S. Bawa, Transition Met. Chem. 31 (2006) 147.[3] S. Chandra, D. Sharma, Transition Met. Chem. 27 (2002) 732.[4] G.A. Melson, Coordination Chemistry of Macrocyclic Compounds, Plenum, New
York, 1979.[5] A.K. Singh, R. Singh, P. Saxena, Transition Met. Chem. 29 (2004) 867.
O.A. El-Gammal et al. / Spectrochimica Acta Part A: Molecular and Biomolecular Spectroscopy 137 (2015) 207–219 219
[6] D.K. Dey, D. Bandhopadhya, K. Nandi, S.N. Paddan, G. Mukhopadhay, G.B.Kauffman, Synth. React. Inorg. Met. Org. Chem. 22 (1992) 1111.
[7] W. Ma, Y. Tian, S. Zhang, J. Wu, Transition Met. Chem. 31 (2006) 97.[8] R.N. Prasad, S. Gupta, J. Serb. Chem. Soc. 67 (2002) 523.[9] M.B. Ferrari, C. Pelizzi, G. Pelosi, M.C. Rodriguez, Polyhedron 21 (2002) 2593.
[10] D.P. Singh, R. Kumar, P. Tyagi, Transition Met. Chem. 31 (2006) 970.[11] A. Chaudhary, R. Swaroop, R. Singh, Bol. Soc. Chile Quim. 47 (2002) 203.[12] J.G. M}uller, X. Chen, A.C. Dadig, S.E. Rokita, C.J. Burrows, Pure Appl. Chem. 65
(1993) 545.[13] J. Liu, T.B. Lu, H. Deng, L.N. Ji, L.H. Qu, H. Zhou, Transition Met. Chem. 28 (2003)
116.[14] B. Contabrana, A. Baamonde, F. Andras-Irellas, H. Hidalgo, Gen. Pharm. 21
(1990) 89.[15] W. Zhang, Y. Zhao, H. Qigang, Shengzhi Biyun 9 (1989) 16.[16] G. Cerchiaro, A.M. Ferreira, J. Brazil, Chem. Soc. 17 (2006) 1473.[17] D.P. Singh, V. Grover, K. Jain, R. Kumar, Russ. J. Coord. Chem. 34 (2008) 233.[18] M. Tyagi, S. Chandra, Sunil Kumar Choudhary, J. Chem. Pharm. Res. 3 (1) (2011)
56–63.[19] A.I. Vogel, Vogel’s Text Book of Quantitative Chemical Analysis, fifth ed.,
Longmans, London, 1989.[20] X. Wu, A.K. Ray, Phys. Rev. B 65 (2002) 85403–85409.[21] W.J. Hehre, L. Radom, P.V.R. Schleyer, J.A. Pople, Ab Initio Molecular Orbital
Theory, John Wiley, New York, 1986.[22] Materials Studio, Accelrys software Inc., San Diego, USA, 2011.[23] B. Hammer, L.B. Hansen, J.K. Nørskov, Phys. Rev. B 59 (1999) 7413.[24] A. Matveev, M. Staufer, M. Mayer, N. Rösch, Int. J. Quant. Chem. 75 (1999) 863–
873.[25] I. Ahmad, A.Z. Beg, J. Ethnopharmacol. 74 (2001) 113–123.[26] W.J. Geary, Coord. Chem. Rev. 7 (1971) 81–122.[27] J.R. Dyer, Application of Absorptions Spectroscopy of Organic Compounds,
sixth ed., Georgia Institute of Technology, 1987.[28] S. Chandra, L.K. Gupta, Spectrochim. Acta A 60 (2004) 3079.[29] P.S. Kalsi, Spectroscopy of Organic Compounds, New Age, International(P) Ltd.,
New Delhi (India), 1999.[30] H. Jeffrey, Organic Structure Determination Using 2-D NMR Spectroscopy,
Elsevier, 2008.[31] O.A. El-Gammal, G.M. Abu El-Reash, S.E. Ghazy, A.H. Radwan, J. Mol. Struct.
[33] A.B.P. Lever, Inorganic Electronic Spectroscopy, Elsevier, Amsterdam, 1984.[34] D.P. Singh, K. Kumar, S.S. Dhiman, J. Sharma, J. Enzyme Inhib. Med. Chem. 24
(2009) 795.[35] A.B.P. Lever, E. Mantovani, Inorg. Chem. 10 (1971) 40.[36] D.K. Demertzi, P.N. Yadav, J. Wiecek, S. Skoulika, T. Varadinova, M.A.
Demertzis, J. Inorg. Biochem. 100 (2006) 1558.[37] B.J. Hathaway, D.E. Billing, Coord. Chem. Rev. 5 (1970) 143.[38] H. Yokoi, M. Chikira, J. Am. Chem. Soc. 97 (1975) 3975.[39] S. Pal, Proc. Ind. Acad. Sci. (Chem. Sci.) 114 (4) (2002) 417.[40] D.X. West, Y. Yang, T.L. Klein, K.I. Goldberg, A.E. Liberta, J. Valdes-Martinez, R.A.
Toscano, Polyedron 14 (1995) 1681.[41] R.C. Chikate, A.R. Belapure, S.B. Padhye, D.X. West, Polyhedron 24 (2005) 889.[42] T. Mitkina, V. Fedin, R. Llusan, I. Sorribe, C. Vicent, J. Am. Soc. Mass Spectrom.
18 (2007) 1863–1872.[43] A.W. Coats, J.P. Redfern, Nature 201 (1964) 68–69.[44] H.H. Horowitz, G. Metzger, Anal. Chem. 25 (1963) 1464–1468.[45] A. Broido, J. Polym. Sci. A-2 (1969) 1761–1773.[46] A.A. Frost, R.G. Pearson, Kinetics and Mechanism, John Wiley, NewYork, 1961.[47] T. Hatakeyama, F.X. Quinn, Thermal Analysis Fundamentals and Applications
to Polymer Science, second ed., John Wiley & Sons, Chichester, 1994.[48] O.A. El-Gammal, T.H. Rakha, H.M. Metwally, G.M. Abu El-Reash, Spectrochim.
Acta A 127 (2014) 144–156.[49] M. Govindarajan, S. Periandy, K. Carthigayen, Spectrochim. Acta A 97 (2012)
411–422.[50] O.A. El-Gammal, Spectrochim. Acta A 75 (2010) 533–542.[51] D.X. West, J.K. Swearingen, J. Valdés-Martinez, S. Hernández-Ortega, A.K. El-
Sawaf, F.v. Meurs, A. Castiñeiras, I. Garcia, E. Bermejo, Polyhedron 18 (1999)2919–2929.
[52] S. Mondal, S. Naskar, A.K. Dey, E. Sinn, C. Eribal, S.R. Herron, S.K.Chattopadhyay, Inorg. Chim. Acta 398 (2013) 98–105.
[53] A.A.R. Despaigne, J.G.D. Silva, A.C.M.D. Carmo, O.E. Piro, E.E. Castellano, H.Beraldo, J. Mol. Struct. 920 (2009) 97–102.


![Theoretical considerations of static and dynamic ...prem.hanyang.ac.kr/down/Theoretical considerations of...Tribology International ] (]]]]) ]]]–]]] Theoretical considerations of](https://static.documents.pub/doc/80x56/5aa5e7d57f8b9a7c1a8e0cba/theoretical-considerations-of-static-and-dynamic-prem-considerations-oftribology.jpg)
