Theoretical and Experimental Thermal Performance Analysis of Complex Thermal Storage Membrane Containing Bio-Based Phase-Change Material (PCM)Jan Kosny, PhD Therese Stovall, PEMember ASHRAE Member ASHRAE
Som Shrestha, PhD David Yarbrough, PhD, PEAssociate Member ASHRAE Member ASHRAE
ABSTRACT
A research team at Oak Ridge National Laboratory (ORNL) has been testing different configurations of PCM-enhanced build-ing envelope components to be used in residential and commercial buildings. During 2009, a novel type of thermal storagemembrane was evaluated for building envelope applications. Bio-based PCM was encapsulated between two layers of heavy-duty plastic film, forming a complex array of small PCM cells. Today, a large group of PCM products are packaged in such complexPCM containers or foils containing arrays of PCM pouches of different shapes and sizes. The transient characteristics of PCM-enhanced building envelope materials depend on the quality and amount of PCM, which is very often difficult to estimate becauseof the complex geometry of many PCM heat sinks. The only widely used small-scale analysis method to evaluate the dynamiccharacteristics of PCM-enhanced building products is the differential scanning calorimeter (DSC). Unfortunately, this methodrequires relatively uniform, and very small, specimens of the material. However, in numerous building thermal storage appli-cations, PCM products are not uniformly distributed across the surface area, making the results of traditional DSC measurementsunrealistic for these products. In addition, most of the PCM-enhanced building products contain blends of PCM with fire retardantsand chemical stabilizers. This combination of nonuniform distribution and nonhomogenous composition makes it nearly impos-sible to select a representative small specimen suitable for DSC tests. Recognizing these DSC limitations, ORNL developed a newmethodology for performing dynamic heat flow analysis of complex PCM-enhanced building materials. An experimental-analyt-ical protocol to analyze the dynamic characteristics of PCM thermal storage makes use of larger specimens in a conventionalheat flow meter apparatus, and combines these experimental measurements with three-dimensional (3D) finite-difference model-ing and whole-building energy simulations. Based on these dynamic tests and modeling, ORNL researchers then developed asimplified one-dimensional (1D) model of the PCM-enhanced building component that can be easily used in whole-building simu-lations. This paper describes this experimental-analytical methodology as used in the analysis of an insulation assembly contain-ing a complex array of PCM pouches. Based on the presented short example of whole-building energy analysis, this paperdescribes step by step how energy simulation results can be used for optimization of PCM-enhanced building envelopes. Limitedresults of whole-building energy simulations using the EnergyPlus program are presented, as well.
INTRODUCTION
Since the late 1980s, the ORNL research team has beenworking to evaluate different types of PCM-enhanced build-ing insulation and board products, including dynamic thermalinsulations blended with micro-encapsulated PCMs (Tomlin-son et al. 1992: Kosny et al. 2006; Miller and Kosny 2007). Inaddition, several new products containing arrays of PCM
micro-containers were laboratory and field tested. Most ofthese PCM-enhanced materials function as lightweight ther-mal-mass components of buildings. It is expected thatdynamic envelope systems of this type will contribute toreducing energy use in buildings and to the development of“net-zero-energy” buildings through their ability to reduceenergy consumption for space conditioning and peak loads.
Jan Kosny was previously a senior research scientist at the Oak Ridge National Laboratory, Oak Ridge, TN, and is currently at the FraunhoferCenter for Sustainable Energy Systems (CSE), Cambridge, MA. Therese Stovall, Som Shrestha, and David Yarbrough are research scientistsat the Oak Ridge National Laboratory, Oak Ridge, TN.
Other anticipated advantages of PCMs are improvement ofoccupant comfort, compatibility with traditional wood andsteel framing technologies, and potential for application inretrofit projects. Previous studies (Salyer and Sircar 1989;Tomlinson et al. 1992; Feustel 1995; Kissock et al. 1998;Zhang et al. 2005; Kosny et al. 2007a, 2007b) have demon-strated that the use of PCMs in well-insulated buildings canreduce heating and cooling energy in US residential buildingsby as much as 25% in locations with useful diurnal tempera-ture variations.
PCM-enhanced interior sheathing based on n-octadecanehas been considered in the past (Salyer and Sircar 1989;Tomlinson et al. 1992; Kissock et al. 1998), but concerns aboutflammability led the project team to pursue the developmentof ignition-resistant micro- and macro-encapsulated PCMs. Inaddition, in several ORNL projects, PCM was moved awayfrom the interior sheathing. In a series of experiments carriedout in a manufacturing environment, PCM was blended withfibrous insulations intended for use in walls and attics. As aresult, the first two PCM-enhanced fiber insulations wereready for market introduction in the United States in 2009(Kosny et al. 2009).
PCMs and other thermally massive materials are promi-nent in most plans for the advanced building envelope, andshould be carefully characterized. No nationally acceptedsmall-scale (in the order of 0.25 m or 0.82 ft) testing procedureis currently available to analyze the dynamic thermal charac-teristics of conventional thermal mass systems or PCM-enhanced materials. At the same time, data on these charac-teristics are required for whole-building simulations, energyanalyses, and energy codes.
The main goal of this work was the experimental andtheoretical analysis of the energy performance of a relativelycomplex array of PCM cells, in this case comprising an insu-lation assembly (Figure 1). Numerous publications reportobtaining the thermal characteristics of PCM materials usinga differential scanning calorimeter (DSC).
In this project, a standard testing procedure using a heatflow meter apparatus (HFMA) was modified to allow dynamictesting. (Normally, the HFMA is used for steady-state thermalconductivity tests of horizontally homogenous materials asspecified in ASTM Standard C518, Standard Test Method forSteady-State Thermal Transmission Properties by Means ofthe Heat Flow Meter Apparatus.) Dynamic HFMA testing wasfollowed by finite-difference simulations. A detailed 3Dcomputer model was developed to simulate the dynamic ther-mal ramp process carried out and monitored in the HFMA. Inthis computer model, the enthalpy data generated during theDSC tests were modified to represent the proportional weightsof PCM and fire retardant in the PCM cells. Simplified 1Dmodels were then developed based on the dynamic HFMAtests and 3D transient thermal simulations. One of thesesimplified 1D models was later used in whole-building energysimulations.
DESCRIPTION OF TESTED PCM TECHNOLOGY
In this project, an organic PCM was packed in plastic, asshown in Figure 1. The PCM product formed an assembly of4.45 cm × 4.45 cm × 1.2 cm (1.75 in. × 1.75 in. × 0.47 in.) plas-tic cells containing PCM separated by 1.2 cm (0.47 in.) fiber-glass strips. For testing purposes (and because the specimenhad an irregular shape), the array of PCM cells was sand-wiched between 1.9 cm (0.75 in.) thick dense, industrial-gradefiberglass on the top and 1.2 cm (0.47 in.) thick extruded poly-styrene foam on the bottom, having thermal conductivities of0.030 W/(m·K) and 0.039 W/(m·K) (0.017 Btu/h·ft·°F and0.023 Btu/h·ft·°F), respectively.
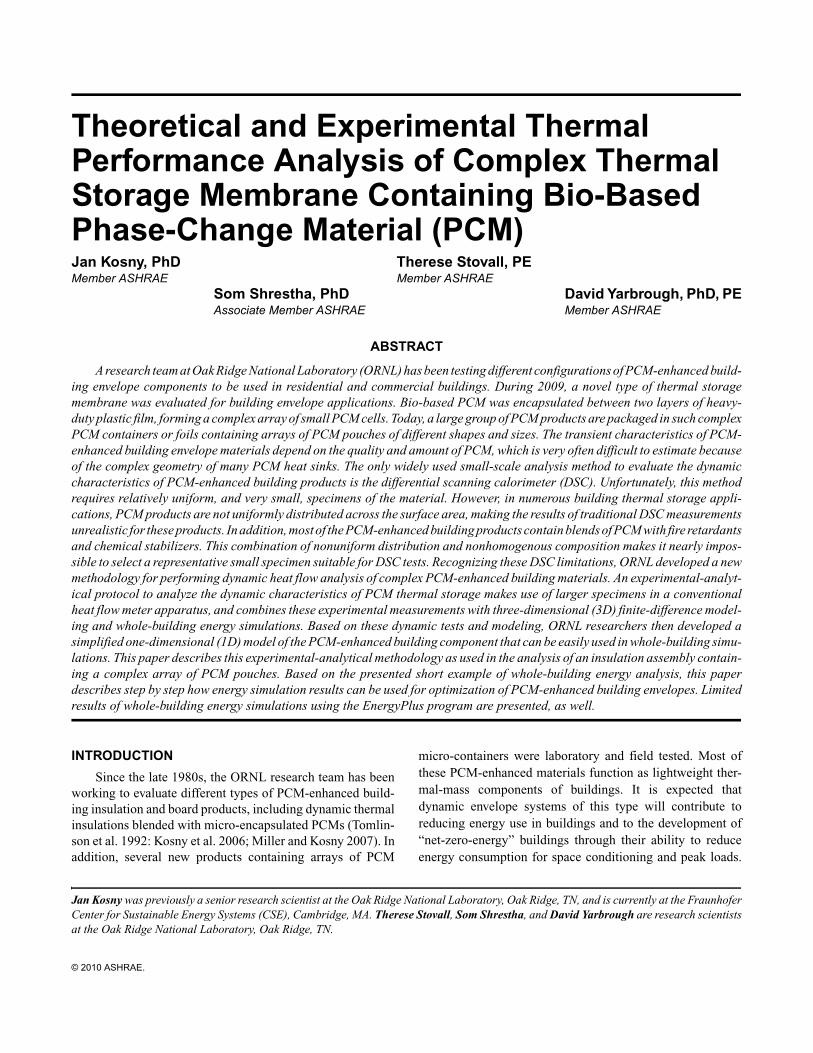
First, researchers conducted a detailed analysis of thedistribution of PCM in the individual cells. The cells, whichcontain fire retardant as well as PCM, were cut open, and thecontent was removed and weighed. The tested cells containedabout 80 wt% of the organic PCM, with the balance being fireretardant, and about 20% of each PCM cell volume was filledwith air. Researchers found that the PCM was not uniformlydistributed among the individual plastic cells in these testsamples (Figure 2). On average, there was about 11 g(0.024 lb) of PCM per cell, or about 176 g (0.388 lb) for theentire 30 cm × 30 cm (12 in. × 12 in.) test specimen. Assumingthe total enthalpy of PCM was about 112 J/g (48.1 Btu/lb), thetotal heat storage capacity of the tested area was about 20 kJ(19 Btu).
SMALL-SCALE DSC TESTING OF PCM SAMPLES
The heat storage capacity of a PCM-enhanced product isa key indicator of its future dynamic thermal performance. Formost common materials, a theoretical model of the material
Figure 1 Array of tested PCM cells packed in densefiberglass insulation.
2 Buildings XI
with temperature-dependent specific heat can be used. The 1Dheat transport equation for such a case is as follows:
(1)
where t and x are time and distance, ρ and λ are materialdensity and thermal conductivity, and h and T are enthalpydensity and temperature.
The enthalpy derivative with respect to temperature,, represents an effective heat capacity having phase-
change energy as one of its components:
(2)
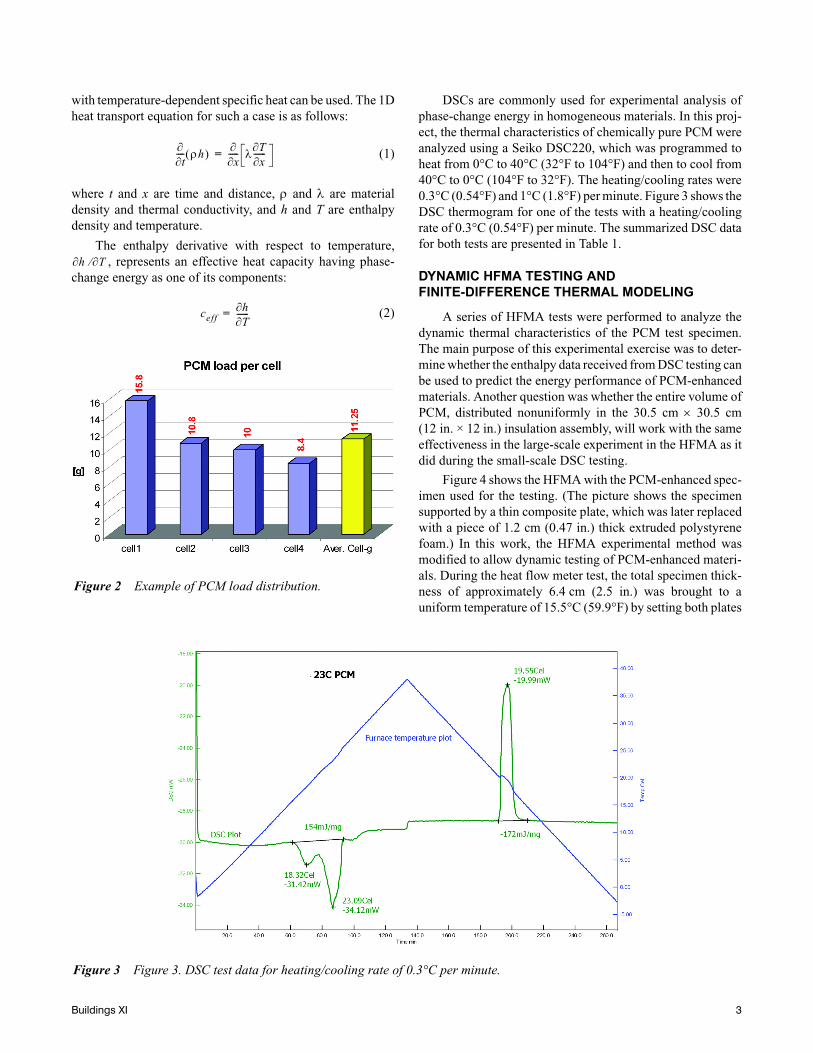
DSCs are commonly used for experimental analysis ofphase-change energy in homogeneous materials. In this proj-ect, the thermal characteristics of chemically pure PCM wereanalyzed using a Seiko DSC220, which was programmed toheat from 0°C to 40°C (32°F to 104°F) and then to cool from40°C to 0°C (104°F to 32°F). The heating/cooling rates were0.3°C (0.54°F) and 1°C (1.8°F) per minute. Figure 3 shows theDSC thermogram for one of the tests with a heating/coolingrate of 0.3°C (0.54°F) per minute. The summarized DSC datafor both tests are presented in Table 1.
DYNAMIC HFMA TESTING AND FINITE-DIFFERENCE THERMAL MODELING
A series of HFMA tests were performed to analyze thedynamic thermal characteristics of the PCM test specimen.The main purpose of this experimental exercise was to deter-mine whether the enthalpy data received from DSC testing canbe used to predict the energy performance of PCM-enhancedmaterials. Another question was whether the entire volume ofPCM, distributed nonuniformly in the 30.5 cm × 30.5 cm(12 in. × 12 in.) insulation assembly, will work with the sameeffectiveness in the large-scale experiment in the HFMA as itdid during the small-scale DSC testing.
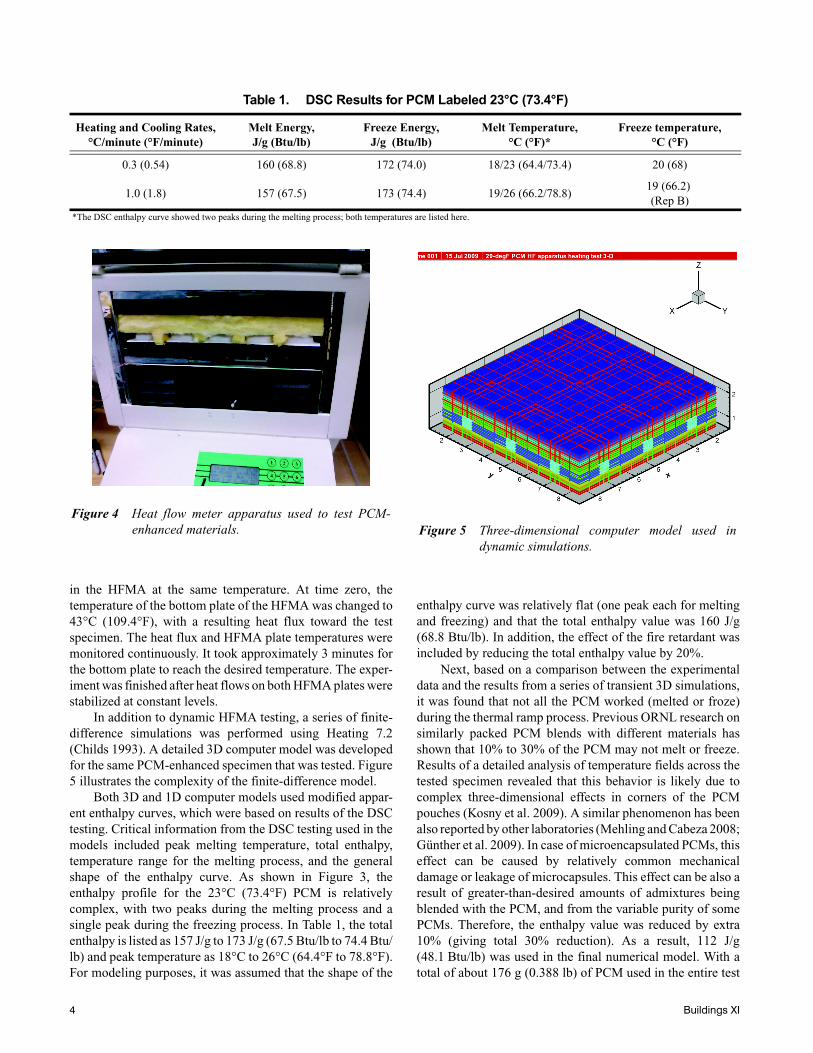
Figure 4 shows the HFMA with the PCM-enhanced spec-imen used for the testing. (The picture shows the specimensupported by a thin composite plate, which was later replacedwith a piece of 1.2 cm (0.47 in.) thick extruded polystyrenefoam.) In this work, the HFMA experimental method wasmodified to allow dynamic testing of PCM-enhanced materi-als. During the heat flow meter test, the total specimen thick-ness of approximately 6.4 cm (2.5 in.) was brought to auniform temperature of 15.5°C (59.9°F) by setting both plates
Figure 2 Example of PCM load distribution.
∂t∂---- ρh( ) ∂
x∂----- λ T∂
x∂------=
h T∂⁄∂
ceffh∂T∂------=
Figure 3 Figure 3. DSC test data for heating/cooling rate of 0.3°C per minute.
Buildings XI 3
in the HFMA at the same temperature. At time zero, thetemperature of the bottom plate of the HFMA was changed to43°C (109.4°F), with a resulting heat flux toward the testspecimen. The heat flux and HFMA plate temperatures weremonitored continuously. It took approximately 3 minutes forthe bottom plate to reach the desired temperature. The exper-iment was finished after heat flows on both HFMA plates werestabilized at constant levels.
In addition to dynamic HFMA testing, a series of finite-difference simulations was performed using Heating 7.2(Childs 1993). A detailed 3D computer model was developedfor the same PCM-enhanced specimen that was tested. Figure5 illustrates the complexity of the finite-difference model.
Both 3D and 1D computer models used modified appar-ent enthalpy curves, which were based on results of the DSCtesting. Critical information from the DSC testing used in themodels included peak melting temperature, total enthalpy,temperature range for the melting process, and the generalshape of the enthalpy curve. As shown in Figure 3, theenthalpy profile for the 23°C (73.4°F) PCM is relativelycomplex, with two peaks during the melting process and asingle peak during the freezing process. In Table 1, the totalenthalpy is listed as 157 J/g to 173 J/g (67.5 Btu/lb to 74.4 Btu/lb) and peak temperature as 18°C to 26°C (64.4°F to 78.8°F).For modeling purposes, it was assumed that the shape of the
enthalpy curve was relatively flat (one peak each for meltingand freezing) and that the total enthalpy value was 160 J/g(68.8 Btu/lb). In addition, the effect of the fire retardant wasincluded by reducing the total enthalpy value by 20%.
Next, based on a comparison between the experimentaldata and the results from a series of transient 3D simulations,it was found that not all the PCM worked (melted or froze)during the thermal ramp process. Previous ORNL research onsimilarly packed PCM blends with different materials hasshown that 10% to 30% of the PCM may not melt or freeze.Results of a detailed analysis of temperature fields across thetested specimen revealed that this behavior is likely due tocomplex three-dimensional effects in corners of the PCMpouches (Kosny et al. 2009). A similar phenomenon has beenalso reported by other laboratories (Mehling and Cabeza 2008;Günther et al. 2009). In case of microencapsulated PCMs, thiseffect can be caused by relatively common mechanicaldamage or leakage of microcapsules. This effect can be also aresult of greater-than-desired amounts of admixtures beingblended with the PCM, and from the variable purity of somePCMs. Therefore, the enthalpy value was reduced by extra10% (giving total 30% reduction). As a result, 112 J/g(48.1 Btu/lb) was used in the final numerical model. With atotal of about 176 g (0.388 lb) of PCM used in the entire test
Table 1. DSC Results for PCM Labeled 23°C (73.4°F)
*The DSC enthalpy curve showed two peaks during the melting process; both temperatures are listed here.
Figure 4 Heat flow meter apparatus used to test PCM-enhanced materials. Figure 5 Three-dimensional computer model used in
dynamic simulations.
4 Buildings XI
specimen, the total latent heat capacity of the tested specimenwas then about 20 kJ (19 Btu). A comparison of HFMA testresults and the 3D and 1D simulations is shown in Figure 6,where the heat flows from both the top and bottom plates of theHFMA are in good agreement with the model when theadjusted enthalpy curve is used.
In order to enable whole-building simulations, a simpli-fied 1D computer model was developed using the equivalentwall procedure from Kossecka and Kosny (1997) andASHRAE (2002) Research Project RP-1145. Most whole-building energy computational models have 1D algorithms fortransient thermal simulations. ASHRAE (2002) provides adetailed description of a theoretical procedure that can be usedto convert 3D thermal models into simplified 1D models. Thisprocess can generate a family of different solutions (severaldifferent 1D models) having similar transient characteristics.
Energy stored during the HFMA experiment wascomputed as well. Heat flows for each of the HFMA plateswere integrated over time based on the test data recordedduring the dynamic HFMA experiment. The differencebetween the integrated top and bottom plate heat flow was20.1 kJ (19.1 Btu). In a similar way, the simulated heat flowswere integrated over the time. The stored energy was 21.0 kJ(19.9 Btu) for the 3D model and 20.9 kJ (19.9 Btu) for the 1Dmodel. This yielded 4.5% and 4.1% differences, respectively,when compared to the test results.
EXAMPLE OF NUMERICAL WHOLE-BUILDING ENERGY ANALYSIS USING ENERGYPLUS WHOLE-BUILDING ENERGY SIMULATIONS
In this section, an example of the application of whole-building energy simulation is presented in order to describedifferent theoretical methods that can be used for optimizationof PCM technologies for walls and roofs. A series of whole-building energy simulations was performed using a previouslydeveloped simplified 1D model of a PCM-enhanced assembly.The energy performance of a residential building with andwithout PCM-enhanced assembly in exterior wall was studiedusing the building energy simulation tool EnergyPlus 4.0. Thebuilding considered for the study was a 16.8 m × 8.4 m (55 ft× 27.5 ft) single-story ranch house with three bedrooms, oneliving room, and an attic. Figure 7 shows the building used forthe study.
The conventional conduction transfer function (CTF)heat balance algorithm used by EnergyPlus assumes constantthermal properties of all construction materials. Therefore,this method cannot be used to simulate any building with aPCM-enhanced envelope assembly. Hence, for both buildingmodels, the model without PCM (case 1), and the model withPCM-enhanced exterior walls (case 2), the conduction finitedifference (CondFD) heat balance algorithm was used tocalculate heat transfer across the building envelope.
Simulated exterior walls of the building without PCMwere composed of the exterior layer, the air gap with
Figure 6 Comparisons of simulated and tested heat flows on both HFMA plates for the 23°C PCM.
Buildings XI 5
0.33 (m2·K)/W (1.88 ft2·°F·h/Btu) thermal resistance, and theframing layer (representing a conventionally insulated 2 × 4stud wall), as shown on Figure 8. Exterior walls of the buildingwith the PCM-enhanced assembly have three additional layersof fictitious materials: the blue layer, green layer, and PCMlayer, situated between the air gap and the framing layer. Thiscombination of three layers, produced by the theoreticalprocedure developed by Kossecka and Kosny for ASHRAERP-1145 (ASHRAE 2002), represents a simplified one-dimensional model of these complex PCM pouches. In thisfictitious 1D model, the material physical characteristics donot represent a real material (Kossecka and Kosny 1997;
Kosny et al. 2009). Figure 8 shows the composition of the exte-rior walls for case 1 and case 2 and the thermal properties ofeach layer. The enthalpy-temperature relationship of the phasechange material layer is presented in Figure 9.
In the building model, a direct-expansion type coolingcoil was used for cooling and a combination of heat pump withelectric heater was used for heating. Minimum outdoor dry-bulb temperature was set at –8°C (17.6°F) for the heat pump.Building heating and cooling temperatures were set at 22°C(71.6°F) and 26°C (78.8°F), respectively. EnergyPlus simula-tions of both building models were performed using an Atlantaweather file, and the results were used to calculate seasonal
Figure 7 Building model used for the study: 16.8 m × 8.4 m (55 ft × 27.5 ft) single-story ranch house.
Figure 8 Composition of exterior walls and thermal properties of each layer.
6 Buildings XI
and annual heating/cooling load associated with heat flowthrough exterior walls, windows/doors, floor, ceiling, infiltra-tion/ventilation, and internal load.
Exterior-wall heat gains and heat losses for heating andcooling periods were calculated for each hour to determine thenet heat gains during the cooling period and the net heat lossduring the heating period. Annual heating/cooling load asso-ciated with heat flow through exterior walls is the sum of thenet heat gain during the cooling period and the net heat lossduring the heating period. A similar approach was used to
calculate whole-building loads. Annual heating/cooling loaddistributions for case 1 and case 2 are shown in Figure 10. Thecomparisons between energy performances of the case 1 (non-PCM) and case 2 (PCM) buildings are presented in Table 2.This preliminary EnergyPlus simulation showed that, for thebuilding configuration studied, PCM with the effective phase-change heat storage density of 112 kJ/kg (48.1 Btu/lb) appliedin all exterior walls has the potential to save about 13.5% of theheating/cooling loads associated with the exterior walls in thatclimate.
Figure 9 Enthalpy-temperature relationship of the phase-change material used in energy analysis.
Table 2. Comparisons between Performances of the Building with and without PCM
Heating / Cooling LoadExterior Wall
% Change from Case 1Case 1 Case 2
Annual heating/cooling load associated with exterior wall heat transfer, kJ
4,907,363 4,246,543 –13.5%
Annual exterior wall load, as % of annual whole-building heating/cooling load
10.2% 9.2% –9.8%
Figure 10 Load distribution to each source for the case 1 and case 2 buildings.
Buildings XI 7
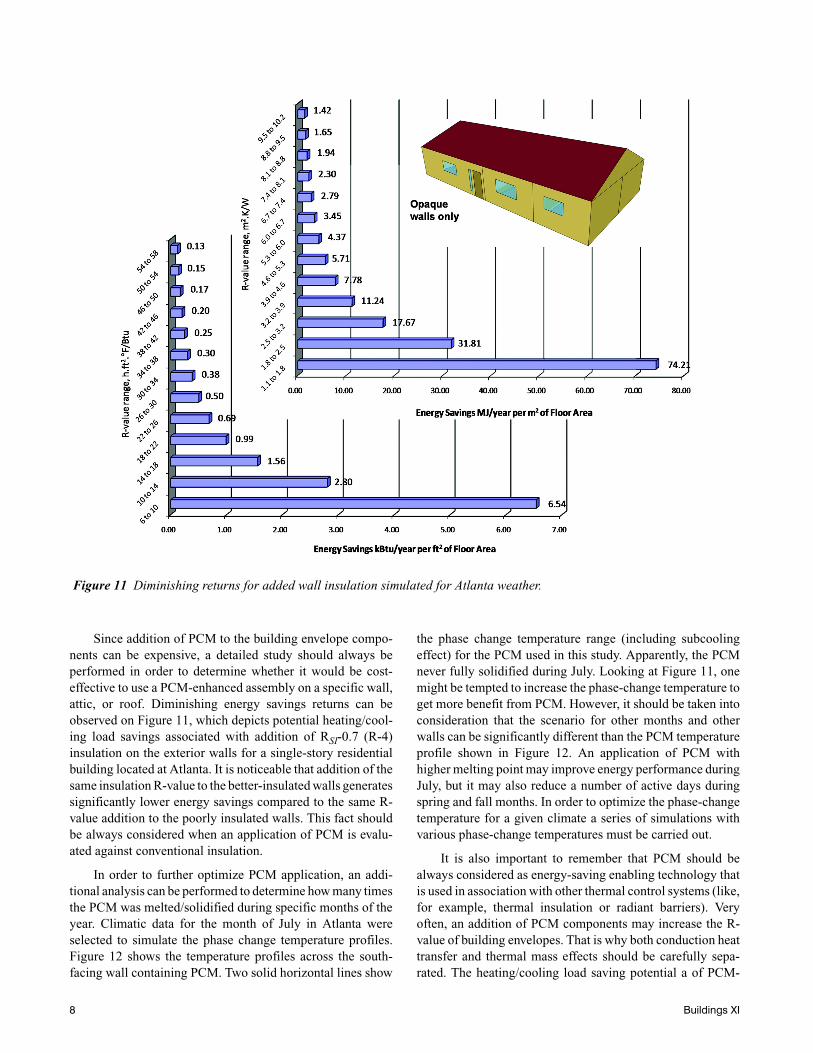
Since addition of PCM to the building envelope compo-nents can be expensive, a detailed study should always beperformed in order to determine whether it would be cost-effective to use a PCM-enhanced assembly on a specific wall,attic, or roof. Diminishing energy savings returns can beobserved on Figure 11, which depicts potential heating/cool-ing load savings associated with addition of RSI-0.7 (R-4)insulation on the exterior walls for a single-story residentialbuilding located at Atlanta. It is noticeable that addition of thesame insulation R-value to the better-insulated walls generatessignificantly lower energy savings compared to the same R-value addition to the poorly insulated walls. This fact shouldbe always considered when an application of PCM is evalu-ated against conventional insulation.
In order to further optimize PCM application, an addi-tional analysis can be performed to determine how many timesthe PCM was melted/solidified during specific months of theyear. Climatic data for the month of July in Atlanta wereselected to simulate the phase change temperature profiles.Figure 12 shows the temperature profiles across the south-facing wall containing PCM. Two solid horizontal lines show
the phase change temperature range (including subcoolingeffect) for the PCM used in this study. Apparently, the PCMnever fully solidified during July. Looking at Figure 11, onemight be tempted to increase the phase-change temperature toget more benefit from PCM. However, it should be taken intoconsideration that the scenario for other months and otherwalls can be significantly different than the PCM temperatureprofile shown in Figure 12. An application of PCM withhigher melting point may improve energy performance duringJuly, but it may also reduce a number of active days duringspring and fall months. In order to optimize the phase-changetemperature for a given climate a series of simulations withvarious phase-change temperatures must be carried out.
It is also important to remember that PCM should bealways considered as energy-saving enabling technology thatis used in association with other thermal control systems (like,for example, thermal insulation or radiant barriers). Veryoften, an addition of PCM components may increase the R-value of building envelopes. That is why both conduction heattransfer and thermal mass effects should be carefully sepa-rated. The heating/cooling load saving potential a of PCM-
Figure 11 Diminishing returns for added wall insulation simulated for Atlanta weather.
8 Buildings XI
enhanced assembly applied on exterior walls shown in Table2 can be subdivided into two parts: (1) savings due to addedinsulation, and (2) savings due to heat storage potential ofPCM. While ignoring phase-change enthalpy of PCM, ther-mal resistance of added PCM-enhanced assembly is equiva-lent to RSI-0.6 (R-3.2), as depicted in Figure 8. Simulation ofthe case 1 building with RSI-0.6 (R-3.2) insulation addedbetween the air gap and framing showed annual heating/cool-ing load associated with wall heat transfer as 4,728,4 kJ. In thatlight, a total 13.5% heating/cooling load savings associatedwith an addition of the PCM-enhanced layers to the exteriorwalls can be divided into 3.65% load saving achieved due toadded insulation and 9.85% load saving achieved due to ther-mal performance of PCM.
In yet another study, the dynamic R-value equivalentprocedure developed by Kosny et al. (2001) for energy perfor-mance analysis of thermal mass systems was used. In order tocalculate the effect of the PCM-enhanced assembly applied onthe residential attic floor, a series of whole-building energysimulations were performed on a single-story ranch houselocated in Atlanta. Two configurations of the attic floor insu-lation were considered for the study:
• Conventional attic floor insulation within a range of RSI-6.7 (R-38) to RSI-17.3 (R-98) considered with R-valueincrements of RSI-2.2 (R-12)
• Attic floor with PCM-enhanced assembly installed ontop of the RSI-6.7 (R-38) insulation. Table 3 shows theannual heating/cooling load associated with heat trans-fer through the ceiling for each case. Figure 13 presentsthe data for ceiling without PCM-enhanced assembly.
Without considering the thermal storage capability ofPCM due to phase change, the equivalent thermal resistance ofthe ceiling with PCM-enhanced assembly on top of RSI-6.7(R-38) insulation is RSI-7.3 (R-41.2). Interpolation using thecurve-fit equation is shown on Figure 13 for data presented inTable 3. It gives an annual heating/cooling load generated bythe attic with RSI-7.3 (R-41.2) insulation as 5,333,609 kJ. Forthe PCM-enhanced assembly installed on top of the RSI-6.7(R-38) insulation, the annual heating/cooling load is4,588,337 kJ, which is 14% less than the load with RSI-7.3 (R-41.2) conventional attic floor insulation. Next, the dynamic R-value equivalent was computed based on results from the para-metric energy simulations. As shown on Figure 13, conven-tional attic floor insulation of approximately RSI-10.3 (R-58.3) would be required to achieve the same level of heating/cooling loads (associated with the ceiling heat transfer) as incase of the PCM-enhanced RSI-6.7 (R-38) insulation for thislocation. In other words, an additional RSI-3.7 (R-22.1) ofconventional insulation would be required on top of the RSI-6.7 (R-38) conventional insulation in order to generate thesame annual loads as in case of the RSI-6.7 (R-38) PCM-
Figure 12 Simulated temperature profiles across the south-facing wall for July.
Buildings XI 9
enhanced insulation for this climate. This would require about15 cm (6 in.) of extra space.
SUMMARY
A novel type of thermal storage membrane was evaluatedfor building envelope applications. Bio-based PCM wasencapsulated between two layers of heavy-duty plastic film,forming a complex array of small PCM cells. This paperdiscusses a novel experimental-analytical methodology thatcan be used in the analysis of an insulation assembly contain-ing a complex array of PCM pouches. Based on the shortexample of whole-building energy analysis presented, thispaper describes step by step how energy simulation results canbe used to optimize PCM-enhanced building envelopes.
A heat flow meter apparatus (HFMA) designed forsteady-state thermal conductivity measurements was used toobserve the performance of PCM imbedded in an insulation
assembly. The HFMA test results and the DSC data werecombined with a 3D finite difference model to determine theeffective heat capacity of the system. The procedure that wasdeveloped permits an evaluation of the heat storage capacity ofa PCM-enhanced building component and its response tochanging temperatures. In order to enable whole-buildingsimulations, a simplified 1D computer model was developedusing the equivalent wall procedure.
An example of energy performance analysis based onresults of whole-building energy simulations of a 141.12 m2
(1512.5 ft2) residential building located in Atlanta with andwithout PCM on exterior walls and attic was presented.Energy simulations were performed using EnergyPlus build-ing energy simulation software. The results of preliminaryenergy simulations showed about a 10% reduction in annualwall-generated heating and cooling loads for the building withPCM-enhanced exterior walls in this location. An applicationof PCM in exterior walls was compared against an applicationof a similar wall using conventional insulations of equivalentR-value. The dynamic R-value equivalent procedure was usedfor analysis of the PCM-enhanced attic insulation. In order tocalculate the effect of the PCM-enhanced assembly applied onthe residential attic floor, a series of whole-building energysimulations was performed on a single-story ranch houselocated in Atlanta. Results of the limited energy modelingdemonstrated that, in Atlanta, a conventional attic floor insu-lation of approximately RSI-10.3 (R-58.3) would be requiredto achieve the same level of heating/cooling loads as in case ofthe PCM-enhanced RSI-6.7 (R-38) insulation. For the consid-ered case of the RSI-6.7 (R-38) PCM-enhanced insulationresults of the whole-building energy simulations demon-strated a potential for about 14% reduction of the attic-generated annual loads comparing to the conventional RSI-6.7(R-38) insulation.
Figure 13 Comparisons of attic-generated annual heating/cooling loads.
Table 3. Annual Heating Cooling Load from Ceiling
Ceiling ConfigurationAnnual Heating/Cooling Load Associated with Ceiling Heat
Transfer, kJ
Ceiling with R-38 insulation 5,506,583
Ceiling with R-50 insulation 4,906,446
Ceiling with R-62 insulation 4,452,029
Ceiling with R-74 insulation 4,120,299
Ceiling with R-86 insulation 3,878,320
Ceiling with R-98 insulation 3,706,999
Ceiling with PCM-enhanced assembly on top of
R-38 insulation4,588,337
10 Buildings XI
The bio-based PCM samples used for the heat flow meterapparatus tests described in this work were early prototypes.The manufacturer’s current products use enhanced formula-tions with better energy management properties and are manu-factured to higher tolerances. The results presented in thispaper can be only considered as an example of the energyperformance analysis of PCM-enhanced building envelopetechnologies. The PCM system used in this analysis was opti-mized neither for the wall nor for the attic applications.
REFERENCES
ASHRAE. 2002. Modeling two- and three-dimensional heattransfer through composite wall and roof assemblies inhourly simulation programs. Report, Research ProjectRP-1145. Atlanta, GA: American Society of Heating,Refrigerating and Air-Conditioning Engineers, Inc.
ASTM. 2006. ASTM Standard C518, Standard Test Methodfor Steady-State Thermal Transmission Properties byMeans of the Heat Flow Meter Apparatus. West Con-shohocken, PA: American Society of Testing and Mate-rials.
Feustel, H.E. 1995. Simplified numerical description oflatent storage characteristics for phase change wall-board. Berkeley: Lawrence Berkeley National Labora-tory, Indoor Environmental Program, Energy andEnvironment Division.
Günther, E., S. Hiebler, H. Mehling, and R. Redlich. 2009.Enthalpy of phase change materials as a function of tem-perature: Required accuracy and suitable measurementmethods. International Journal of Thermophysics 30(4).
Kissock, J.K, M.J. Hannig, and T.I. Whitney. 1998. Testingand simulation of phase change wallboard for thermalstorage in buildings. Proceedings of 1998 InternationalSolar Energy Conference, Albuquerque. Sponsored byAmerican Society of Mechanical Engineers, New York.
Kosny, J., D. Gawin, and A. Desjarlais. 2001. Energy bene-fits of application of massive walls in residential build-ings. DOE, ASHRAE, ORNL Conference—ThermalEnvelopes VIII, Clearwater, FL.
Kosny, J., D. Yarbrough, and K. Wilkes. 2006. PCM-enhanced cellulose insulation: thermal mass in light-
weight fibers. International Energy Agency and Depart-ment of Energy Ecostock 2006 Conference, StocktonUniversity.
Kosny, J., D. Yarbrough, T.W. Petrie, and A. Syed. 2007a.Performance of thermal insulation containing microen-capsulated phase change material. 2007 InternationalThermal Conductivity Conference, Birmingham, AL.
Kosny, J., D. Yarbrough, W. Miller, T. Petrie, P. Childs, andA. Syed. 2007b. Thermal performance of PCM-enhanced building envelope systems. DOE, ASHRAE,ORNL Conference—Thermal Envelopes X, Clearwater,FL.
Kosny, J., T. Stovall, and D. Yarbrough. 2009. Dynamic heatflow measurements to study the distribution of phase-change material in an insulation matrix. Proceedings ofthe 2009 International Thermal Conductivity Confer-ence (ITCC) and the International Thermal ExpansionSymposium (ITES), Pittsburgh, PA.
Kossecka, E. and J. Kosny. 1997. Equivalent wall as adynamic model of the complex thermal structure. Jour-nal of Thermal Insulation and Building Envelopes20:249–68.
Mehling, H. and L.F. Cabeza. 2008. Heat and cold storagewith PCM: An up to date introduction into basics andapplications. Springer.
Miller, W.A., and J. Kosny. 2007. Next generation roofs andattics for residential homes. Proceedings of the 2007ACEEE Summer Studies on Energy Efficiency, PebbleBeach, CA.
Salyer, I. and A. Sircar. 1989. Development of PCM wall-board for heating and cooling of residential buildings.Thermal Energy Storage Research Activities Review, USDepartment of Energy, New Orleans, pp. 97–123.
Tomlinson, J., C. Jotshi, and D. Goswami. 1992. Solar ther-mal energy storage in phase change materials. Proceed-ings of Solar ’92: The American Solar Energy SocietyAnnual Conference, Cocoa Beach, FL, pp. 174–79.
Zhang, M., M.A. Medina, and J. King. 2005. Developmentof a thermally enhanced frame wall with phase-changematerials for on-peak air conditioning demand reductionand energy savings in residential buildings. Interna-tional Journal of Energy Research 29(9):795–809.