Theoretical Maximum Capacity as a Benchmark for Empty Vehicle Redistribution in Personal Rapid Transit John D. Lees-Miller 1,2 Dr. John C. Hammersley 2 Dr. R. Eddie Wilson 1 1 University of Bristol 2 Advanced Transport Systems Ltd. 89 th Annual Meeting of the Transportation Research Board (2010) 1
Transcript
Theoretical Maximum Capacity as a Benchmark for Empty Vehicle
Redistribution in Personal Rapid TransitJohn D. Lees-Miller1,2
Dr. John C. Hammersley2
Dr. R. Eddie Wilson1
1 University of Bristol2 Advanced Transport Systems Ltd. 89th Annual Meeting of the Transportation Research Board (2010)
longest-waiting passenger (he just arrived, but he’s the only passenger )
[L-M, H, W 2010]
Longest-Waiting Passenger First (3)17
[L-M, H, W 2010]
Longest-Waiting Passenger First (4)18
longest-waiting passenger
[L-M, H, W 2010]
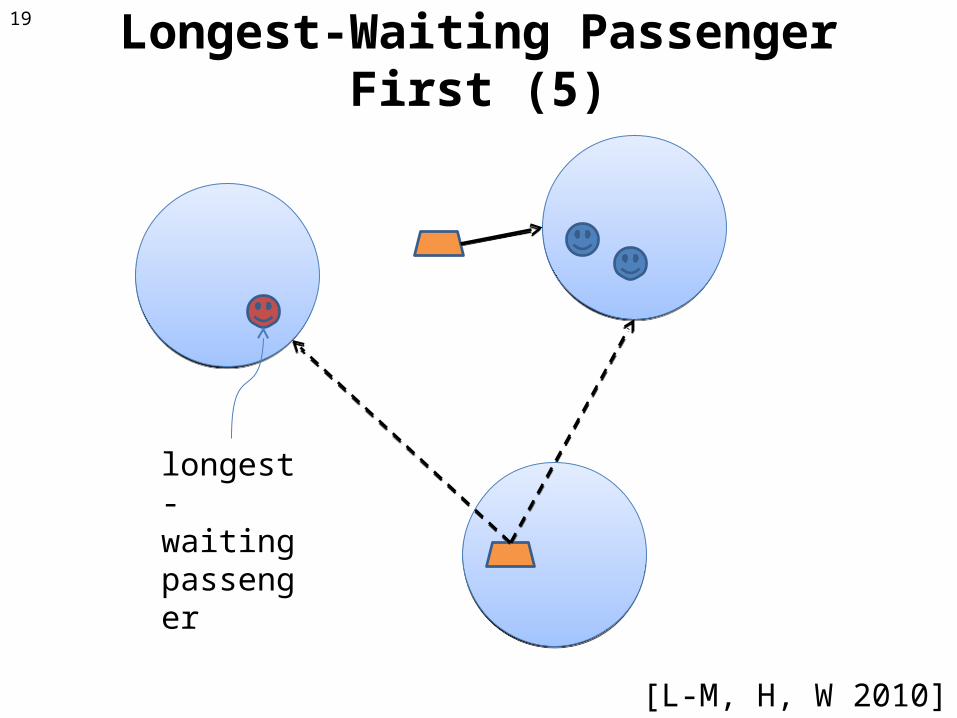
Longest-Waiting Passenger First (5)19
longest-waiting passenger
[L-M, H, W 2010]
Longest-Waiting Passenger First (6)20
it would have been quicker to go to this station, but we chose the longest-waiting passenger instead
[L-M, H, W 2010]
Case Study Networks21
Corby Network (15 stations)[Bly 2005]
‘Grid’ Network (24 stations)
[L-M, H, W 2010]
Case Study Demand Patterns22
‘Grid’ Network (24 stations)
[L-M, H, W 2010]
Corby Network (15 stations)[Bly 2005]
Saturation Intensities from Simulations23
intensity intensity
[L-M, H, W 2010]
fleet size (Cmax) = 200; error bars are below the resolution of the graphs
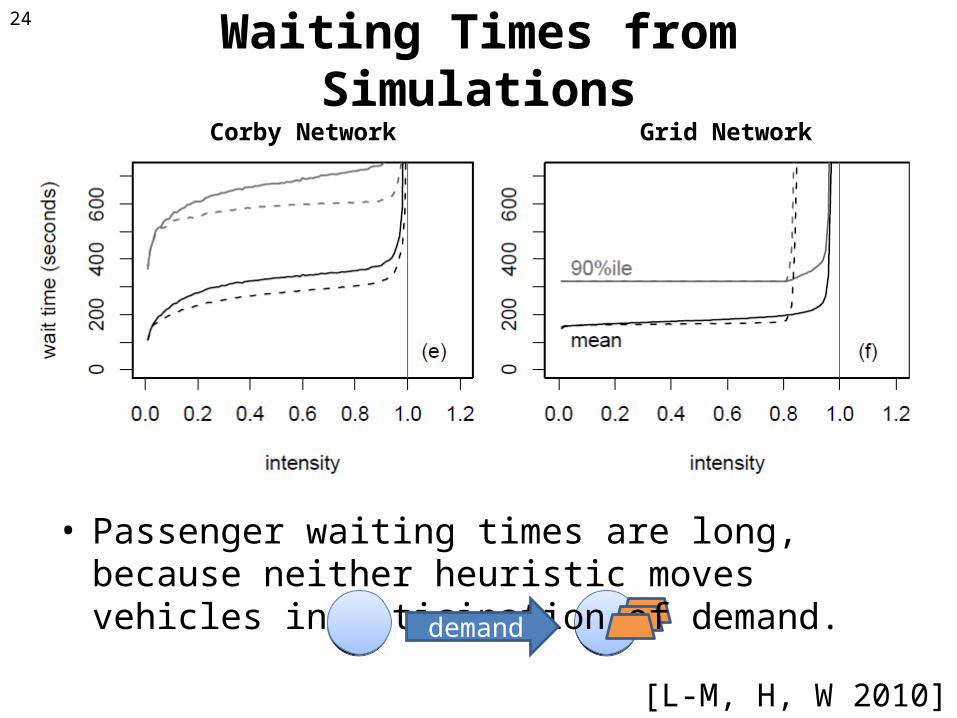
Waiting Times from Simulations
• Passenger waiting times are long, because neither heuristic moves vehicles in anticipation of demand.
24
Corby Network Grid Network
demand
[L-M, H, W 2010]
Conclusions
• Can use fluid limit analysis to benchmark EVR algorithms in terms of throughput.
• Cannot yet assess absolute performance of EVR algorithms in terms of passenger waiting time, but the fluid limit analysis is useful for interpreting simulation results.
• A simple nearest-neighbors strategy is quite strong, in terms of throughput, but it delivers fairly poor waiting times.
25
Acknowledgements
• Prof. Martin V. Lowson (ATS Ltd.)• Prof. Frank P. Kelly (Cambridge)
26
References
Lees-Miller, J. D., J. C. Hammersley and R. E. Wilson. Theoretical Maximum Capacity as a Benchmark for Empty Vehicle Redistribution in Personal Rapid Transit. To appear in the proceedings of the 89th Annual Meeting of the Transportation Research Board, 2010.