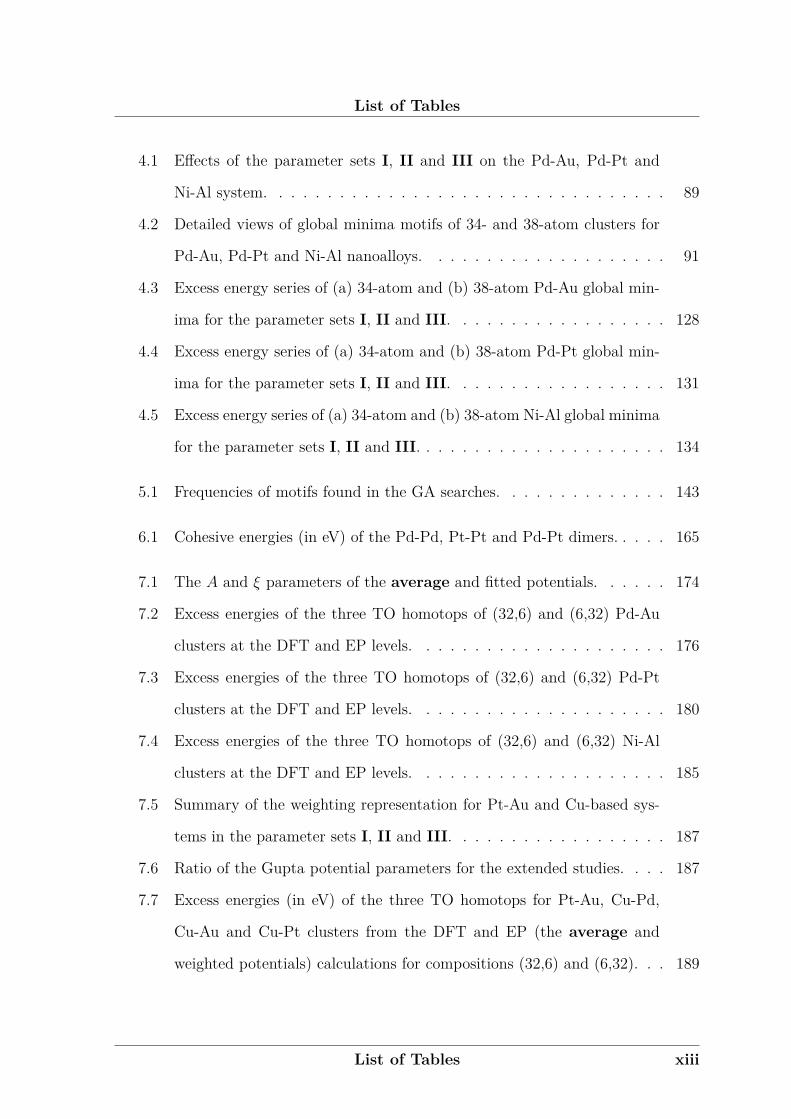
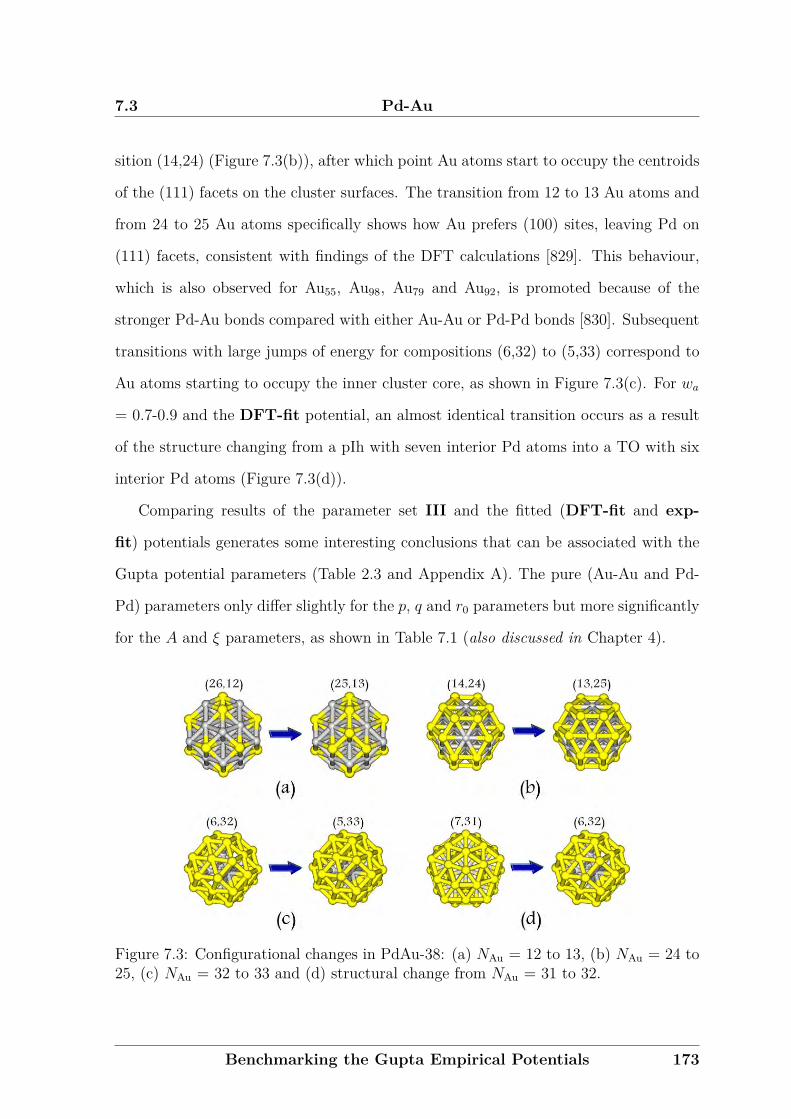
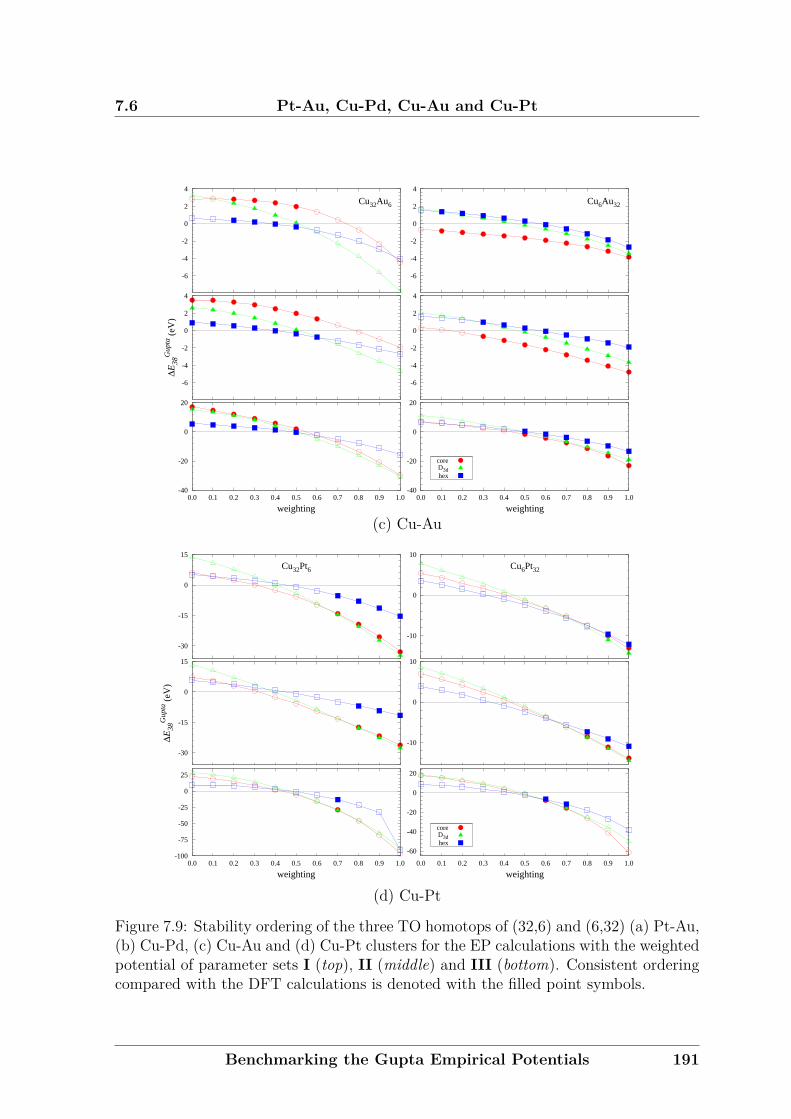
Theoretical Studies of Free and Supported Nanoalloy Clusters by Ramli Ismail A thesis submitted to The University of Birmingham for the examination of DOCTOR OF PHILOSOPHY School of Chemistry University of Birmingham July 2012
Transcript
Theoretical Studies of Free and Supported
Nanoalloy Clusters
by
Ramli Ismail
A thesis submitted to
The University of Birmingham
for the examination of
DOCTOR OF PHILOSOPHY
School of ChemistryUniversity of BirminghamJuly 2012
University of Birmingham Research Archive
e-theses repository This unpublished thesis/dissertation is copyright of the author and/or third parties. The intellectual property rights of the author or third parties in respect of this work are as defined by The Copyright Designs and Patents Act 1988 or as modified by any successor legislation. Any use made of information contained in this thesis/dissertation must be in accordance with that legislation and must be properly acknowledged. Further distribution or reproduction in any format is prohibited without the permission of the copyright holder.
Abstract
Nanoclusters offer unique physical and chemical behaviour, with the possibility of
fine-tuning size and structures. Clusters of transition metals of group 10 (Ni, Pd, Pt),
group 11 (Cu, Ag and Au), and crossover combinations (nanoalloys) between the two
groups are of importance for their excellent physical, catalytic, optical, electronic and
magnetic properties. Upon alloying, activity, selectivity and stability enhancement is
possible and another dimension arises – chemical ordering (i.e., mixed vs. segregated
phases). Detailed theoretical studies can extend our understanding of these compli-
cated systems, giving a better understanding of experimental observations and allowing
prediction of chemical and physical properties. In this research, a good balance be-
tween accuracy and computational cost in describing electronic structure was sought
via a combined Empirical Potential (EP) - Density Functional Theory (DFT) method.
At the EP level, global optimisation searches were performed using the Birmingham
Cluster Genetic Algorithm and Basin-Hopping Monte Carlo algorithm coupled with
potentials derived from the semi-empirical Gupta potential. The sensitivity of the
potentials was further studied for various potential parameterisations. The DFT cal-
culations were performed with the NWChem and Quantum ESPRESSO codes. At the
EP level, exploration of Pd-Au, Pd-Pt and Ni-Al clusters evidence the transition from
polyicosahedra – decahedra – face-centered cubic (fcc), for small (≤ 100 atoms) clus-
ters, but interrupted at 38- and 98-atoms, due to the magic size of the fcc truncated
octahedron (TO) and Leary tetrahedron, respectively. Below 50 atoms, these motifs
are energetically very competitive, which led to a detailed structural study for the 34-
and 38-atom clusters, as a function of composition. A qualitatively good agreement
between EP and DFT was found, with a prevalence towards core-shell Dh34 and TO38
structure for Pd-Au and Pd-Pt clusters. The performance of empirical calculations
varies with composition and these were investigated by calculations on a TO motif at
fixed compositions – (32,6) and (6,32). The DFT calculations showed that the aver-
age potential gave a good estimation of the heteronuclear interactions of Pd-Au and
Pd-Pt systems. However, biased parameters exhibit better behaviour for Ni-Al, Pt-Au,
Cu-Pd and Cu-Pt clusters. On an MgO support, Pd-Au clusters showed significant size
and composition effects, based on 30- and 40-atom cluster models with variation in the
bimetallic compositions (Pd-rich, Au-rich and medium composition). Consistent with
the available experimental findings, Pd atoms preferentially bind to the oxygen sites
at the interface and good cluster-substrate epitaxy was observed. The results gave fair
confidence for application of the empirical potential for larger clusters, for which global
exploration with the ab initio methods was not feasible.
Abbreviations and Acronyms
ANND average nearest-neighbour distance
BCGA Birmingham Cluster Genetic Algorithm
BHMC Basin-Hopping Monte Carlo
DFT Density Functional Theory
DZ basis sets of double-ζ
EAM Embedded-Atom Model
ECP effective core potentials
EP-DF Empirical Potential - Density Functional Theory approach
[16] and wire/tube [17–20]. Transformation of shapes leads to modification in the ra-
tio of facets (corners, edges, kinks, steps), which are significant for their reactivity,
especially in catalysis [21, 22].
Smaller NPs have a higher catalytic activity due to the higher proportion of sur-
face atoms [23–27]. There is much evidence for how evolution in size and/or struc-
Introduction 3
1.3 Cluster Chemistry
ture change the optical, electronic, magnetic, chemical and other physical properties
(e.g., crystallinity, melting point, thermodynamics) of NPs [1, 3, 4]. Studies of NPs
with well-defined size and structure are critical for the understanding of their structure-
activity interplay and can suggest possible modification for a better performance.
The rapid increase in NP-related publications is due to their unique properties.
There is a great promise for their utilisation in photochemistry, nanoelectronics, optics,
catalysis, sensors, biological labelling, photonics, optoelectronics, information storage
and magnetic device applications [1, 3, 28–30]. In catalysis, different charge and elec-
trical properties [31] make it possible for certain NPs to be involved in reactions which
may not occur for the bulk, for example, reactions involving cross-coupling, electron
transfer, hydrogenation and oxidation [23].
It is interesting to mention that rare colour characteristics of NPs have been ex-
ploited since the middle ages, particularly in stained glass windows of cathedrals (Eu-
rope), colouring vases and other ornaments (China). But it is only recently that sci-
entists could explain the vibrant colour as being due to the collective oscillation of the
electrons at the interface, called the surface plasmon. The distinct optical properties
of NPs are of interest, for their use in consumer products such as home pregnancy test
devices, digital imaging and display systems [2, 3, 23].
1.3 Cluster Chemistry
Nanoclusters are classified as assemblies of ∼10 to 106 atoms or molecules within a
nanometre size range [32]. The component could be neutral or ionic and either single
or more species, stabilised in certain (physical or chemical) media. Examples of some
different types of clusters are fullerenes, metal clusters, molecular clusters and ionic
clusters [32–34].
The most remarkable feature of clusters is the size-dependent evolution of structure
[5, 32, 35, 36]. It is fascinating that such evolution is non-monotonic, making it very
Introduction 4
1.3 Cluster Chemistry
appealing to study [37]. Furthermore, electronic energy levels of clusters are quantised,
giving rise to atomic-like character [38, 39]. These phenomena have been connected to
the enhancement in the optical and electrical properties of some clusters [40, 41].
Nanometre-size clusters can present both crystalline (e.g., face-centred cubic (fcc),
octahedra or TO) and noncrystalline (e.g., icosahedra, decahedra, polytetrahedra and
polyicosahedra) structures. The noncrystalline shapes normally exist at small sizes,
with icosahedra and Marks truncated decahedra dominating for noble and transition
metals [42]. For large clusters, these structures are not favourable due to the strain
arising from their noncrystalline packing, which is proportional to the cluster volume
[34]. This strain, however, can be released by locating a smaller atom in the core of
the nanoalloy [43].
Clusters of transition metals group 11 (Cu, Ag, Au) have completely filled d orbitals,
leaving a single s electron in the valence shell [37]. It leads to similar shell effects [44–
48] as observed experimentally for clusters of the alkali elements (Li, Na, K, Rb, Cs)
[49–51]. Shell closing has also been reported for bimetallic nanoalloys of the coinage
metals (e.g., Cu-Ag [52, 53]). On the contrary, shell closing behaviour for clusters of
transition metals with unfilled d-shells is accounted for geometric shell of concentric
polyhedra [42]. Examples of magic size clusters commonly found for the transition
metals are shown in Figure 1.1 [54].
The spherical jellium model [55] can be used to describe shell closing behaviour. In
Figure 1.1: High symmetry cluster structures: (a) 38-atom truncated octahedron, (b)55-atom Mackay icosahedron and (c) 75-atom Marks’ decahedron [54].
Introduction 5
1.4 Mono-metallic Clusters
this model, core electrons and the nuclei are modelled as positive ions and the delo-
calised valence electrons are treated as the interacting component. Cluster orbitals are
described by a principal quantum number, n = 1, 2, ... and orbital angular momentum,
l = 0(S), 1(P), ..., (capital letters are used for cluster orbitals to avoid confusion with
electronic orbitals) in which the maximum number of electrons for each shell is 2(2l +
1). Similarly to inert gas atoms, fully filled shells (shell closing) are relatively stable and
give rise to magic sizes that correspond to n= 2, 8, 18, 20, 34, 40, 58, ... electrons, which
are explained by a shell filling sequence of (1S)2(1P)6(1D)10(2S)2(1F)14(2P)6(1G)18...
[56]. Shell closing effects have been identified as the main reason for the occurrence of
even-odd effects in the mass spectral abundance, ionisation potential and other prop-
erties of clusters [57, 58].
1.4 Mono-metallic Clusters
1.4.1 Gold
Gold has received considerable attention in the clusters study. In the size range of
less than 250 atoms (∼2 nm), there is variation from “molecular” to decahedral and
bulk-like fcc. The fcc structures are normally stabilised by truncations, e.g., TO motif
[59].
Preparation of clusters via a chemical reaction route is likely to produce co-struc-
tures (decahedral (Dh), TO, icosahedron and amorphous) as has been the case for gold
reduction at the oil-water interface with the presence of a surface passivating agent.
The Marks and Ino-decahedra, however, are favoured for particles of a few nanometres
diameter, with Marks decahedra prevailing at sizes ∼15 Å. Meanwhile, the existence
of small fcc clusters are at the expense of truncation of the octahedron edges [60].
The complexity in the structural characterisation of clusters can be aided by a com-
bined experimental-theoretical approach. For example, Cleveland et al. [61] utilised
atomistic modelling in describing stable truncated-decahedral motif of gold clusters
Introduction 6
1.4 Mono-metallic Clusters
from the X-ray powder diffraction analyses. Of the 1 − 2 nm size range clusters, they
have been able to single-out Marks decahedra of 75, 101 and 146-atoms.
1.4.2 Palladium
Palladium has fcc symmetry in the bulk phase but, depending on the diameter, its clus-
ters can be stabilised as icosahedral, decahedral or fcc motifs [62]. For small sizes, the
stability of Pd clusters decreases from linear, to planar and further to three-dimensional
clusters [63]. Moreover, icosahedral structures are preferred for N = 55 and 147 [64].
Large clusters are likely to adopt bulk-like fcc structures, with the exception for N =
147, 231 and 309, where magic clusters of icosahedra (N = 147), octahedra (N = 231)
and cuboctahedra (N = 309) prevail [65].
Experimentally, several motifs appeared to be separated by a very small energy gap
and a co-existence of structures has been reported. For example, colloidal methods by
José-Yacamán et al. [66] give fcc cuboctahedra, icosahedra and truncated decahedra in
the range of 1-5 nm, as shown in Figure 1.2 [66]. Stabilisation of the decahedra and
cuboctahedral particles is enhanced because the extent of truncation makes them close
to spherical in structure. Icosahedra, which are only expected for very small clusters
(due to high strain), are also present due to kinetic trapping effects.
1.4.3 Platinum
Studies of small Pt clusters have found low-energy planar isomers for the trimer,
tetramer and pentamer [67]. Theoretical simulations mainly found Pt behaviour being
close to Au, with the preference for very small icosahedral clusters before fcc prevails
[68].
In the intermediate size range, Pt clusters composed of 13, 38 and 55 atoms are
of interest due to significantly different ground state structures [69]. Of these sizes,
the EP calculations exhibit icosahedral minima [68], however, the DFT predicts the
shrinking of (100) faces of close-packed structures (which are optimised at N = 38)
Introduction 7
1.4 Mono-metallic Clusters
Figure 1.2: High resolution electron microscopy (HREM) images of 1-5 nm Pd particleswith (a) fcc, (b) decahedra and (c) icosahedra structures from different orientations.The corresponding fast Fourier transform (FFT) is included in each case [66].
Introduction 8
1.4 Mono-metallic Clusters
giving considerable stability of D4h and Oh configurations for Pt13 and Pt55 clusters,
respectively [69]. This unique property is the evidence of intermediate finite-size effects
in small clusters [70].
1.4.4 Nickel
Icosahedral clusters that were first observed for small rare-gas clusters [71] are also
adopted by Ni, with a very strong increase in the abundance of photoionisation peaks
at N = 55, 147, 309 and 561 [72]. Chemical probe experiments indicate that these
icosahedral clusters are derivatives of the 13-atom icosahedron units [73]. The stability
of Ni13 and Ni19 icosahedral clusters is further proved by chemical probe experiments
with nitrogen [73–75] and CO [76].
The great stability of Ni13 is confirmed by DFT calculations [77] but computational
limitations require empirical calculations for larger sizes. The Embedded-Atom Model
(EAM), which correctly predicted the bulk nickel structure [78], is one of the earliest
to be applied to clusters. It shows a preference for icosahedral packing in small clusters
of up to a hundred atoms, with magic stabilisation of 13- and 19-atom clusters [79–81].
Structural diversity is possible, with variation in size as has been seen in the fcc-
icosahedron transition from Ni38 to Ni39 clusters [82]. Even for magic icosahedra of 13
and 19, the DFT calculations show a strong competition between icosahedra, Dh and
fcc structures [83]. Similar results have also been reported using a semi-empirical tight-
binding method [84, 85] for larger clusters (N ≤ 55). Doye and Wales [54] postulate
that the ground-state may adopt structures far from the usual packing (icosahedral,
decahedral, close packed). Moreover, the DFT study by Wetzel and DePristo [86] sug-
gests the structures that differ from rare gas clusters. An EAM study for a broader
range of sizes exhibits the prevalence of small icosahedral clusters before the transfor-
mation to Marks decahedra (intermediate sizes N > 2,300) and fcc (very large sizes,
N > 11,700) [87].
Introduction 9
1.5 Nanoalloy Clusters
1.4.5 Aluminium
Studies of aluminium clusters are of importance as its represent a simple metal system
and are of interest for microelectronics or nanocatalysis [88]. For neutral clusters,
photoionisation spectroscopy by Schriver et al. [89] confirms the electronic shell effects
in Al clusters, with exceptionally strong peaks at N = 14, 17, 23 and 29. Further
electronic shell closings are reported for N = 36, 46 and 66, as the prominent maxima
in the melting temperatures [90].
Clusters of only a few atoms are predicted to be stable in a planar shape (N ≤ 5) [91]
and increasing size stabilises compact icosahedral motifs, with the magic size at N = 13.
This is supported by many ab initio (mostly based on the DFT) calculations [92–104], as
well as empirical models [104–106], although differences in functional, pseudopotential
and/or basis set in the DFT calculations [107–110] suggested the decahedron as the
more stable structure.
The DFT studies also indicate stable icosahedral clusters of around N = 55 [92] and
icosahedra-based onion-like Al77 [111]. However, many local minima on the potential
energy surface (PES) are observed, give rise to the structural variation. Hexagonal
[112], bulk-like fcc [92, 93, 113], decahedral and disordered structure [88] clusters are
observed as competitive candidates for small to medium sizes (N ≤ 80), due to interplay
between structural and electronic effects. Small fcc clusters were eventually observed
by Breaux et al. [114] based on the calorimetry measurements of the multi-collision
induced dissociation experiment.
1.5 Nanoalloy Clusters
There are remarkable uses of noble metals in various technologically important areas for
their excellent catalytic, electronic and magnetic properties [115–121]. Enhancement
of properties is possible when two or more of these metals are combined [116, 122, 123].
The use of nanoalloys has been reported since the 19th century, when Michael Faraday
Introduction 10
1.5 Nanoalloy Clusters
studied optically active Au-Ag nanoparticles [124] but without a clear understanding
of the underlying physics and chemistry [125]. Advancement in methods and charac-
terisation made it possible for modern research to utilise the diversities in nanoalloy
compositions [34, 116, 122] and chemical ordering: intermetallic, random, non-random
or phase segregation [126–136], in addition to size, atomic order and structure.
Theoretically, the combination of two or more non-alike atoms increases the com-
plexity of the PES landscape due to the increased number of possible isomers especially
“homotops” (permutation of unlike atoms – i.e., similar in composition and geometry
but differing in atomic arrangement in configurational space) [33, 137–139]. However,
there is also an economic driving force for nanoalloy research as low cost (Ni, Cu
and Co) metal can be combined with an expensive noble-metal such as palladium,
platinum and ruthenium without reduction in the activity [140]. Careful selection of
method and alloy combination have proved to give enhancement over mono-metallic
clusters [23, 32, 122, 141].
Much emphasis on structure-activity relationships is made in experimental and
theoretical research, with the aim of fabricating new materials with well-defined and
controllable properties. Synergistic effects are dependent on many factors, e.g., size and
structure [142–145] and, for catalysis, in addition to activity, improvement in selectivity
and stability (resistance to poisoning) [146] is achievable with nanoalloys. Intermetal-
lic interactions produce different neighbouring atoms [147] and new activated sites
(e.g., point defects, interfaces, edges) [148–150]. Furthermore, electronic, geometric,
ligand and ensemble effects [151–154] affect the d-band centre position which is crucial
for catalytic activity [155].
The electronic and/or geometric effects and their interplay with structure-activity
relationships of nanoalloys are very interesting due to the possibility to fine-tune cata-
lysts which need optimum strength (neither too strong nor too weak) of adsorbate-metal
interaction [156]. Electronically, this is possible via electron transfer by a flow of charge
Introduction 11
1.5 Nanoalloy Clusters
[157] or modifications of the d-band [158–161]. The latter is supported by X-Ray Pho-
toelectron Spectroscopy (XPS) and X-ray Absorption Near Edge Structure (XANES)
experiments coupled with theoretical calculations but some researchers [162, 163] dis-
agree, stating that the improvement arises from dilution of the metal surface. Likewise,
geometric effects also contribute to catalysis, as changes in size and/or geometry of the
cluster lead to alteration of electron bandwidth and core electrons, as well as the ex-
posed planes and the surface topology [156, 164, 165]. Large clusters contain mainly
high coordination sites (facets, planes) but reduction in size introduces more activated
sites (kinks, edges, corners) [164, 166, 167], which are demonstrated to provide a more
active catalyst [168–171]. Moreover, in nanoalloys, more than one type of metal may
occupy active sites, which is required in some reactions [156].
Meanwhile, magnetic properties can be induced in non-magnetic metals (4d metals:
Rh, Pd, Ag or 5d metals: Pt, Au) or even insulators in nanoalloys containing magnetic
3d metals (Cr, Fe, Co and Ni) [37, 116]. Co-Rh is a candidate for application in high-
density magnetic recording [172]. Moreover, enhanced improvement by nanoalloys have
also benefited biomedical applications, for example in bioconjugation, cellular labels,
bioassays and DNA/protein markers [173, 174].
Cluster production (including mono-metallics) can be classified into two domains:
chemical – involving metal reduction followed by particle stabilisation and physical
– usually involving vapour deposition. Cost-wise, chemical methods such as chemi-
cal reduction (co-reduction, successive reduction, reduction of co-complexes), thermal
decomposition, ion implantation, electrochemical synthesis (electrodeposition at liquid-
liquid interfaces), radiolysis, sonochemical synthesis or biosynthesis (biomimetic syn-
thesis, in-vivo biogeneration) are more effective but agglomeration is always a major
issue [2, 23]. This, however, is solved by the introduction of stabilisers in the reactions,
such as ligands [175], polymers [176] or tetraalkylammonium salts [177]. Meanwhile,
physical methods such as molecular beams are obviously more expensive but “free”
Introduction 12
1.5 Nanoalloy Clusters
clusters (in an interaction-free environment) can be studied. Other physical means
include laser vaporisation, pulsed arc cluster ion source, ion sputtering/scattering and
magnetron sputtering.
Variation in the parameters of experiment gives variation in the structural-proper-
ties of clusters. For instance, large icosahedral clusters (up to 11 nm in diameter) of Ag
are observed by the inert-gas aggregation technique [52, 178] but at high temperature
and pressure transform into mainly fcc clusters [179]. Likewise, the introduction of ni-
trogen to the argon sputtering produced single-crystalline, instead of multiply twinned
particles of Fe-Pt clusters [180]. For Au clusters, the same method gives icosahedra
as the most frequent morphology, followed by decahedra [181]. Interestingly, subse-
quent landing on the carbon surface gave stabilisation of fcc clusters, identified by
High-Resolution Transmission Electron Microscopy (HRTEM) and supported by the-
oretical calculations [182]. Size-wise, varying the flow rates of inert gas (Ar and/or
He) corresponded to increasing particle size, as have been reported for Pd clusters
with decahedral shape [183]. For Ag-Au clusters, size-tuning in the laser vaporisation
method have been carried out with the cooling scheme [184, 185].
The information about particle size, structure and chemical ordering of clusters
can be gathered via electron microscopy (Scanning Electron Microscopy (SEM), field-
emission SEM (FESEM), Transmission Electron Microscopy (TEM), High-Resolution
TEM (HRTEM), Scanning Transmission Electron Microscopy (STEM), STEM-Elec-
tronic Energy Loss Spectroscopy (STEM-EELS)) and scanning probe microscopy (Sc-
anning Tunnelling Microscopy (STM), Atomic Force Microscopy (AFM)) techniques.
For example, the High-Angle Annular Dark-Field Imaging (HAADF)-STEM exploits
the difference in atomic number of metals and chemical ordering (mixed, segregated
or intermediate) can be determined by the “Z-contrast” [186, 187]. Also, X-ray spec-
troscopy (X-ray Absorption Spectroscopy (XAS), Extended X-ray Absorption Fine
Structure (EXAFS), Near-edge X-ray Absorption Fine Structure (NEXAFS), X-ray
clear Magnetic Resonance (NMR), Electrochemical NMR (EC-NMR), while specific
magnetic (SQUID magnetometry) and electrochemistry (Cyclic-voltammetry (CV), in
situ (XAS, SEM and STM)) are also available. (For a detailed review of synthetic
methods and characterisation techniques, see Refs. [4, 29, 116])
1.6 Chemical Ordering in Nanoalloys
The design of physically and/or chemically unique nanoalloy materials is further en-
hanced by the possibility to fine tune the chemical ordering (mixing pattern). Chem-
ical ordering is dependent upon structure, size and composition, among others [188].
Generally, combination of bimetallic A and B can lead to four main possible types
of chemical ordering patterns [116, 188]: core-shell, subcluster segregated, mixed and
multiple shell, as outlined in Figure 1.3.
Figure 1.3: Cross section of the four main types of chemical ordering patterns; (a)core-shell, (b) subcluster segregated, (c) mixed and (d) multishell [116].
Introduction 14
1.6 Chemical Ordering in Nanoalloys
In Figure 1.3(a), A and B phases are segregated in which element A (red colour)
resides in the core and is surrounded by a shell of B (yellow colour), though this
core-shell arrangement may give some inter-mixing between the shells. Subcluster seg-
regated nanoalloys (or “Janus” nanoparticles) are shown in Figure 1.3(b) for which two
patterns can be classified, mixed A-B interface (left) and limited A-B interface (right).
A-B nanoalloys can mix (Figure 1.3(c)) in two ways, ordered (left) or random (i.e., a
solid solution, right). Lastly, it is also possible for layered or onion-like alternating
A-B-A or B-A-B shells in a multishell nanoalloy as in Figure 1.3(d). This arrangement
has been observed for Pd-Au [189], Au-Ag [190], Pd-Pt [191] and trimetallic Au-Pt-Ag
[192] nanoparticles and theoretically predicted for Au-Cu [193], Co-Rh [172] and Pd-
Pt [194] nanoalloys. Moreover, simulations of Cu-Ag, Ni-Ag and Pd-Ag clusters found
this ordering as a metastable state [195]. Alternating layers of dielectric and metal
(e.g., Au-SiO2 [196, 197] and CdSe-ZnMnS [198]) also known as “nanomatryushkas”
are also based on this type of ordering and yield interesting plasmonic responses. In the
chemical ordering classification, it should be noted, however, that imperfect patterns
are likely to be observed, giving some intermediate arrangements.
The adopted chemical arrangement of an A-B nanoalloy may be influenced by a
complex competition between many factors. Relative strengths of homo- and heteronu-
> Esurf, Pd) and PtcoreNishell (εcoh, Pt > εcoh, Ni, Esurf, Pt > Esurf, Ni). In a similar fashion,
Table 1.2: Bulk chemical ordering of the studied bimetallic systems (Review by [116]based on Refs.[228–234]), with segregated/immicible (i), disordered/solid solutions (s)or ordered (o) mix phases. Some ordering only observed at either high (ht) or low (lt)temperatures.
Cu Ag Au Ni Pd Pt
Cu -Ag s -Au o s -Ni s i s -Pd sht, olt s s sht, olt -Pt sht, olt i sht, i lt sht, olt o -
Introduction 18
1.7 Transition Metal Nanoalloys
Table 1.3: Various chemical orderings of bimetallic clusters prepared via chemical(chem.) or physical (phys.) means or with external (ext.) (i.e., ligand, seed, support)effects, along with the theoretical (EP and DFT) predictions.
A B AcoreBshell BcoreAshell ordered mix. disordered mix.
group 10Ni Pd chem. [225, 235,
236], DFT [237]chem. [238],ext. [239]
chem. [240]
Ni Pt EP [241] ext. [242–244] DFT [245] chem. [246]Pd Pt chem. [247, 248] chem. [144, 249–
tions, along with the chosen parameters. Post-calculation analyses (2.8 – energetic, 2.9
– bonding, 2.10 – ordering and 2.11 – point group symmetry) will also be described.
2.1 Electronic Structure Theory
Mathematical and theoretical principles have been applied to solve many chemical prob-
lems and the introduction of computers sped-up the process along with giving better
prospects of studying more complicated systems. The behaviour of individual molecules
can be described, for which a better understanding of experimental observations can
be achieved. Theoretical methods are alternatives for impractical experiments, mea-
surements or characterisations. Moreover, having a good theoretical understanding of
certain reactions before they are ever studied in the laboratory is far cheaper than
a trial-and-error approach [32, 33, 37, 371, 489]. The heats of formation, energies
(bond, reaction, activation), structures (thermodynamics, kinetics and mechanisms),
Theoretical Background and Methods 29
2.1 Electronic Structure Theory
mechanisms (transition states, pathways, charges) and molecular spectra (IR, Raman
spectra, UV/Visible, NMR spectra) [490] are candidates for theoretical calculations and
are commonly combined with the electron [491] and X-ray [492] diffraction patterns,
photoelectron spectra [493] or cluster mobility data [494] for structural determinations.
Electronic structure can be described by either ab initio Molecular Orbital (MO)
or semi-empirical atomistic potentials with the aim to find a GM [188, 495]. The GM
is the most preferred structure to be found experimentally [496] but other structures
(metastable) are frequently observed due to kinetic effects [497], in agreement with the
theoretical searches which give many competitive structural motifs [54, 498–504]. As
a result, calculations are computationally heavy and a good balance between accuracy
and calculation time is becoming the main objective.
Some high level ab initio theory methods (e.g., DFT) have been shown to give ac-
curate predictions for catalyst improvements (activity, selectivity and stability) [505]
and complex systems (e.g., enzymes, biological compounds) [506, 507]. However, high
accuracy in the ab initio methods generally comes at a high computational cost and is
only feasible for small systems (tens of atoms). For medium-sized systems (hundreds
of atoms), less rigorous calculations are more reasonable and can be done by using the
empirical or semi-empirical methods. Here, instead of solely quantum physics (as in the
ab initio), experimental parameters and extensive approximations (e.g., by consider-
ing only valence electrons) are incorporated. On the other hand, Molecular Mechanics
(MM) is more suitable for very large (thousands of atoms) and non-symmetric chemical
systems, such as enzymes, proteins and polymers. This modelling technique, however,
only studies motions of the nuclei and does not involve the explicit treatment of elec-
trons. Less computational effort is needed, although it is system-dependent, limited
(often involving commercial software) and not suitable for systems or processes which
involve bond breaking mechanisms.
Theoretical Background and Methods 30
2.1 Electronic Structure Theory
2.1.1 First Principles Methods
Ab initio (Latin term meaning “from the beginning”) or first principles methods are the
electronic structure methods that are based upon the principles of quantum mechanics.
They take into account the laws of quantum mechanics, atomic properties (masses,
electron charges, atomic nuclei), electronic properties (structure, spin states) and the
values of fundamental physical constants, without any approximations or experimental-
based data. The methods give accurate and consistent estimations of a variety of
molecular systems – for diverse properties, ground states, excited states and reactions.
A system can be studied quantitatively either by short single-point energy calculation
or by letting the system geometrically relax to a more stable configuration.
In quantum theory, the distribution of electrons in an atom can only be described
probabilistically as a complex-valued function – the wave function. This mathematical
function satisfies the Schrödinger equation. However, due to the nature of electrons,
a solution for the equation is very complex and there is a need of knowledge and
experience, so that the calculations are feasible and reliable. With more electrons
involved in a system, the complexity of the solution grows rapidly. In “Molecular
Orbital” methods, a set of mathematical functions (called the “basis set”) is used and
depending on the required accuracy of calculation, there are options in choosing the
basis sets. A better approximation can be obtained using a large basis set but at the
expense of more computer resources.
There are two major sub-classes of Ab initio methods, where the first are methods
that treat the wave function directly, with the simplest being a solution for just a single-
particle. Reasonable accuracy can be achieved with the Hartree-Fock (HF) method
[508–510] but for better approximation of the electronic structure, more expensive
Configuration Interaction (CI) method can be used [511]. The second class of methods
involved a solution of a wave function indirectly, using objects related to the wave
function, such as the electronic density (e.g., DFT) [512].
Theoretical Background and Methods 31
2.2 Density Functional Approach
2.1.2 Empirical Methods
Empirical methods are an alternative to computationally-demanding ab initio meth-
ods. The methods, however, show inaccuracy when encountering hydrogen-bonding,
chemical transitions or nitrated compounds [513, 514] and are system-dependent, in
which the results are doubtful for general situations. Satisfactory accuracy levels may
be obtained, for example with a validation against the ab initio results.
Semi-empirical techniques are useful in preliminary theoretical studies when the
complexity of a system is unknown. Since it is still, at present, relatively too expensive
for ab initio methods to be applied to large systems, the development of empirical
atomistic potentials continues to be relevant [188].
In the study of nanoalloys, “homotop” issues give an additional reason to implement
semi-empirical methods. Among highly efficient unbiased optimisation methods that
have been developed for clusters are the genetic algorithm (GA) [515–517], the basin
hopping (BH) method and its variants [495, 518, 519]. The inter-atomic potential is
described by several models (e.g., Gupta, Sutton Chen, Morse, EAM) [188] and for
clusters of transition metals (metallic and bimetallic), Gupta-based potentials have
shown to give convincing results [43, 203, 277, 280]. The main problem with these
optimisations is the need for an extensive sampling of the PES. A common solution is
a combined empirical-ab initio approach, in which unbiased searches are carried out at
empirical level before some of the candidate structures (global and local minima) are
chosen for the optimisation at the ab initio level [116].
2.2 Density Functional Approach
2.2.1 The Schrödinger Equation
The N interacting electrons of the many-body problem are defined by the Schrödinger
equation,
Theoretical Background and Methods 32
2.2 Density Functional Approach
−h2
2me
N∑
i=1
∇2i +
12
N∑
i,j=1,j 6=i
e2
| ri − rj |+
N∑
i=1
vext(ri)
ψ(x1, .., xN) = Eψ(x1, .., xN) (2.1)
where E is the total energy, ψ is the wave function, vext(ri) is the external potential
and xi = (ri, σi) represents a set of both position and spin values for the i-th electron.
Other terms are electron mass, me, electron charge, e, reduced Planck constant, h and
Laplacian, ∇2i . In the operator form, the equation becomes,
(
T + Vee + Vext
)
ψ(x1, .., xN) = Eψ(x1, .., xN) (2.2)
where the kinetic energy operator, T , the electron-electron interaction Vee and the
external potential, Vext are,
T = −h2
2me
N∑
i=1
∇2i (2.3)
Vee =12
N∑
i,j=1,j 6=i
e2
| ri − rj |(2.4)
Vext =N∑
i=1
vext(ri) (2.5)
The Coulombic attraction is normally used as the external potential for solid-state
physics and chemistry,
vext(r) = −N∑
j=1
Zje2
| r −Rj |(2.6)
where for nuclei j, Rj are the locations and Zj are the charges. The positions of the
nuclei can be treated as static due to the considerable difference in mass between the
nucleus and the electron (Born-Oppenheimer approximation [520]). Hence, only the
Theoretical Background and Methods 33
2.2 Density Functional Approach
electronic part needs to be solved in the Schrödinger equation and the total density of
electrons is defined as,
ρ(r) = N∑
σ1,..,σN
∫
dr2, .., drN | ψ(x1, .., xN) |2 (2.7)
2.2.2 Variational Principle
Many theoretical calculations rely on the variational principle in finding the solution
for the ground-state structure,
E0 = minψ
〈ψ | H | ψ〉/〈ψ | ψ〉 (2.8)
The algorithm searches for the total energy minimum from a trial wave function to
get the true ground-state wave function, ψ [521]. HF and CI theory are based on this
minimisation.
2.2.3 Hohenberg-Kohn Theorem
In principle, the ground-state electronic structure can be solved starting from the ex-
ternal potential of Eq. 2.1, to give the wave function and subsequently other related
properties. Solution of the many-body wave function, however, is not easy and theo-
retically, the functionals of the electronic density, F [ρ(r)] can be used as an alternative.
F [ρ(rtrial)] ≥ E0 (2.9)
Assuming that the ground-state is non-degenerate, one-to-one connection between this
functional and the potential is proven by “reductio ab absurdum” [522].
Theoretical Background and Methods 34
2.2 Density Functional Approach
2.2.4 Levy-Constrained Search Proof
In 1979, further proof that density uniquely characterises a system was presented by
Levy [523]. By rewriting the variational principle, Eq. 2.8, the total energy now be-
comes,
E[ρ(r)] = minn
[
F [ρ(r)] +∫
d3r vext(r) ρ(r)
]
(2.10)
where the functionals of the electronic density, F [ρ(r)] are from the minimisation over
all many-body wave functions,
F [ρ(r)] = minψ→n
〈ψ | T + Vee | ψ〉 (2.11)
F [ρ(r)] is universal and independent of the external potential. Using the variational
principle, the ground state density satisfies the stationary principle,
δ{F [ρ(r)] +∫
d3r vext(r)ρ(r) − µ∫
d3r ρ(r)} = 0 (2.12)
and establishes a relationship between the external potential and the electron density,
vext(r) = µ−δF [ρ(r)]δρ(r)
(2.13)
Splitting F [ρ(r)] into kinetic, T [ρ(r)] and interaction, Vee[ρ(r)], parts, the total
energy is expressed as a functional of the density,
E[ρ(r)] = T [ρ(r)] + Vee[ρ(r)] +∫
d3r vext(r) ρ(r) (2.14)
By assuming F [ρ(r)] is approximated accurately, there will be equivalence between
Eq. 2.14 and the Schrödinger equation (Eq. 2.1) but here involving three components
with only one variable, the electronic density.
Theoretical Background and Methods 35
2.2 Density Functional Approach
2.2.5 Thomas-Fermi (TF) Model
The Thomas-Fermi (TF) model is a simple approach, writing the total energy as a
functional of the electronic density [524, 525],
E[ρ(r)] = TTF [ρ(r)] + UH [ρ(r)] +∫
d3r vext(r) ρ(r) (2.15)
with
TTF [ρ(r)] =310
(2π2)2
3
∫
d3r ρ5
3 (r) (2.16)
is from the kinetic energy of a uniform non-interacting electron gas and,
UH [ρ(r)] =12
∫
d3r∫
d3r′ ρ(r) ρ(r′)
| r − r′ |(2.17)
is the classical Hartree term. The approximation of this theory remains inaccurate
mainly due to the way kinetic energy is represented. It, however, still made a major
contribution towards the development of modern DFT.
2.2.6 Kohn-Sham Equation
The realisation of DFT implementation only happened in 1965 when Kohn-Sham (KS)
[526] developed the fictitious non-interacting system with the same (exact) density as
the real system. A Slater determinant of single-particle orbitals, φs is used,
Ts[ρ(r)] = minφs→n
〈φs | T | φs〉 (2.18)
and the functional, F [ρ(r)], is the sum of this non-interacting kinetic part, the classical
Hartree contribution and the exchange-correlation term, EXC [ρ(r)] (or separated parts,
EX [ρ(r)] and EC [ρ(r)]). The total energy now becomes,
Theoretical Background and Methods 36
2.2 Density Functional Approach
E[ρ(r)] = Ts[ρ(r)] + UH [ρ(r)] + EXC [ρ(r)] +∫
d3r vext(r) ρ(r) (2.19)
and the Euler-Lagrange variation with constrained electron number gives the KS equa-
tion,
vKS(r) = µ−δTs[ρ(r)]δρ(r)
(2.20)
which is equivalent to,
(
−12
∇2 + vKS([ρ(r)]; r))
φi(r) = ǫiφi(r) (2.21)
and the KS orbitals are,
vKS(r) = vext(r) + vH(r) + vXC(r) (2.22)
with
vH(r) =δUH [ρ(r)]δρ(r)
(2.23)
vXC(r) =δEXC [ρ(r)]δρ(r)
(2.24)
and electronic density,
ρ(r) =∑
i
θ(µ− ǫi) | φi(r) |2 (2.25)
Starting with the initial guess via a self-consistent scheme, the solution of the KS
equation (2.21) can be achieved. This equation solves the complex many-electron
problem, e.g., total energy calculations. For the occupied KS orbitals,
Theoretical Background and Methods 37
2.3 Density Functional Theory (DFT)
E[ρ(r)] =∑
occ
ǫKS+UH [ρ(r)]+EXC [ρ(r)]−∫
d3r vH(r) ρ(r)−∫
d3r vXC(r) ρ(r) (2.26)
The exchange-correlation functional, EXC , however, must be approximated, either by
local or semi-local representations [527, 528]. The local density approximation (LDA)
is the simplest one but over-emphasis on the metallic character made it only suitable
for a homogeneous electron gas [529]. Meanwhile, generalised gradient approxima-
tion (GGA) includes both density and the gradient of the density. Improvement in
exchange-correlation functionals has been found for hybrid functionals, e.g., by Becke
[530] and Ernzerhof [531] to solve many issues with molecular calculations, including
bond lengths and vibration frequencies.
2.3 Density Functional Theory (DFT)
DFT, the density-based description of matters is a new approach to quantum mechan-
ics. Compared to the wave function, electron density is more manageable and practical,
for which larger systems can be considered. Table 2.1 shows the significant landmark
towards the development of the modern DFT. The DFT and HF scaled at N3 or even
N (N is the calculation effort over the number of electrons), as compared with N5 for
approximate CI methods (full CI would be as high as exp(N)). [511].
Generally, DFT methods can be applied to many systems of different type of bond-
ing (metallic, covalent and ionic). Classical troublesome systems of super-conductivity
[556], magnetic properties of alloys [557, 558], quantum fluid dynamics [559], molecu-
lar dynamics [560] and nuclear physics [561, 562] are now being well-handled by DFT.
However commonly used DFT functionals fail to deal adequately with dispersion forces,
even when they are corrected by the gradient of the electron density [563].
There are a large number of benchmarks which can be used for DFT validation,
either against experiments [typically cohesive energy (∆Ecoh) or atomisation energy;
Theoretical Background and Methods 38
2.3 Density Functional Theory (DFT)
Table 2.1: Timeline of historical landmarks in DFT development.
1926 Quantum state physics description by Schrödinger [532].1927 Introduction of the density-based Thomas and Fermi model [524,
525].1928 Dirac adds an exchange energy functional term to the Thomas-
Fermi model [533].Hartree proposed a method for a solution of problems in atomicstructure, which became an approximation to the self-consistentfield Hartree-Fock method [508, 534, 535].
1930 Work of Hartree perfected by Slater [536] and Fock [537].1933 Pioneering electronic structure calculation of sodium by Wigner
and Seitz [538, 539].1935 First gradient density functional by von Weizsäcker [540].1937 Augmented plane wave method (APW) is developed by Slater
[541].1951 Important simplification of Hartree-Fock theory by Slater with the
use of Xα approximation [542].1959 Introduction of the pseudopotential method [543].1964 Hohenberg and Kohn justified Slater’s work [522] and suggested
the contribution of the Kohn-Sham non-interacting particles,which can be approximated by LDA, a known approximation fromuniform gas exchange-correlation energy [526, 539, 544, 545].
1972 Spin-polarised DFT [546].1975 Linear augmented plane waves (LAPW) and linear muffin-tin or-
bitals (LMTO) methods are introduced [547].1979 Constrained minimisation approach by Levy proves the existence
of a universal functional in the DFT [523, 548].1984 Formal foundation of the time-dependent DFT by Runge and
Gross [549, 550].1985 Implementation of DFT in Car-Parrinello molecular dynamics
[551].1988 DFT successfully used for chemical problems with the Becke [552]
and Lee-Yang-Parr (LYP) [553] functionals.GGA is adopted to improve the LDA description of the bindingenergy of molecules [552, 553].
1989 Significant use of ab initio programs by non-theorists with the im-plementation of the DFT in the Pople’s electronic structure code,Gaussian [554].
1998 Nobel Prize in Chemistry for Walter Kohn “for his development ofthe density-functional theory” and John A. Pople “for his develop-ment of computational methods in quantum chemistry” [555].
Theoretical Background and Methods 39
2.3 Density Functional Theory (DFT)
equilibrium volume (V0); elastic properties such as bulk modulus (B0) and elastic con-
stants (Cij); and thermal quantities such as melting temperature (Tm) and thermal
expansion coefficient, (αV,rt)] or against high-level wave-function based calculations,
although there are no conclusive results when comparing LDAs, GGAs and hybrid
functionals.
LDA functionals are the simplest but are effective for many applications, in par-
ticular, for solid-state physics [564], where accurate phase transitions in solids [565]
and liquid metals [566, 567] are predicted and lattice crystals within 1% precision are
successfully achieved [568].
Development of more accurate functionals allowed for more complex calculations,
e.g., involving reactions, complex molecules or sterically hindered sites. For example,
GGA (e.g., PW91 [569–571], Becke-Lee-Yang-Parr functional (BLYP) [553] and PBE
[572]) gives comparable results to CI for which strong bonds, bond angles, dihedral an-
gles, binding energies and vibrational frequencies can be calculated within errors of only
a few percent of experimental measurements [573]. The introduction of the electron
density gradient in GGA improves the exchange-correlation (XC) energy approxima-
tion, e.g., giving better lattice constants. Although the advancement is significant for
systems such as atoms and molecules, PBE for example, shows inaccuracy in predicting
surface jellium energies [574].
A better approach, using hybrid functionals (e.g., B3LYP), in which nonlocal Fock
exchange is mixed in with local or semi-local DFT exchange, is one of the alternatives.
Better agreement with experiments is reported [575] for the B3LYP hybrid functional,
which is commonly used in organic chemistry.
However, for metallic systems, the performance for main group metals is quite
distinct from that for transition metals. Studied by Paier et al. [576] indicate the failure
(worse compared to, for example PBE) of B3LYP in describing the localised-delocalised
electron transition in transition metals of Rh, Pd, Cu and Ag. In contrast, agreement
Theoretical Background and Methods 40
2.4 Genetic Algorithm (GA)
between PBE’s predecessor, PW91 [577] and experiments [578] has been found for the
properties of bond length, binding energy, vibration frequency of the dimers of Cu, Ag
and Au. The PW91 functional also shows better accuracy in predicting the the bulk
moduli (of Cu, Ag, Ta and W) [579] and cohesive energies (of 3d transition metals)
[580]. Most striking is the work by Schultz et al. [581, 582], where a database for
transition metal dimers of Zr, V, Cr, Mo, Ni, Cu and Ag was built based on various
different density functionals (local spin density approximations (LSDAs); GGAs: BP86,
The quantity demonstrates relative stability of a cluster AmBn, with respect to its
neighbours.
When studying a fixed-size bimetallic cluster of A-B, the excess (or mixing)
energy as a function of composition, ∆GuptaN , is a useful quantity. For binary nanoalloys
with fixed size (N = 34 or 38) but different compositions, it is defined as:
∆GuptaN = EGupta
N (AMBN−M) −MEGuptaN (AN)
N− (N −M)
EGuptaN (BN)
N(2.36)
Theoretical Background and Methods 59
2.9 Bonding Profile Analyses
where EGuptaN (AMBN−M) is the total energy of a bimetallic cluster and EGupta
N (AN) and
EGuptaN (BN) are the total energies for clusters of A and B metals. The excess energy
is an unbiased quantity, defined as zero for the pure clusters and negative for a mixed
cluster.
At the DFT level, the average binding energy was calculated from the total and
single atom energy as follows:
∆DFTb = −
1N
(
EDFTtotal (AMBN−M) −M
{
EDFTatom (A)
}
− (N −M){
EDFTatom (B)
}
)
(2.37)
whereN is the total atom in AMBN−M binary clusters. Meanwhile, the excess energy,
∆DFTN was calculated in similar way as at the EP level, using Eq. 2.36.
2.9 Bonding Profile Analyses
For a complete structural analysis, the radial distribution functions (RDF), were taken
into account and, are defined as follows:
gr(r) =1m
n∑
k=1
δ(kdr − ri) (2.38)
where m is a normalisation factor; k is the number of increments in length (dr) in the
distance r measured from the centre of mass (c.m.) of the cluster and ri is the distance
from the ith-atom to the c.m.
For quantitative purposes, the pair distribution functions (PDF), gp(r), were
calculated as follows:
gp(r) =V
N2
⟨
N∑
i
N∑
j 6=i
δ[r − rij]
⟩
(2.39)
where N is the total number of atoms, V is the volume, rij denotes the distance between
atoms i and j and the brackets represent a time average. The gp(r) function gives the
Theoretical Background and Methods 60
2.10 Bonding Profile Analyses
probability of finding an atom of any type at a distance r and it allows characterisation
of the lattice structure during the generation of the nanoalloy [632]. The calculated
PDF generally shows the pattern in Figure 2.4 for metals such as Cu [633], Pd [634],
Pt and Au [632].
From the gp(r), the average nearest-neighbour distance (ANND) can be
defined as:
ANND =∫ rc
0 rg(r)4πr2dr∫ rc
0 g(r)4πr2dr(2.40)
where the cut-off rc was chosen to be half way between the average nearest- and next
(2nd)-nearest-neighbour distances in the cluster [633]. This term can be simplified as
the sum of the nearest neighbour atomic distances divided by the number of bonds in
a cluster [635].
Figure 2.4: A generic pair distribution function for a metal cluster [632–634].
Theoretical Background and Methods 61
2.11 Chemical Ordering
2.10 Chemical Ordering
For A-B alloy systems, the mixing degree, σ is defined as;
σ =NA-A +NB-B −NA-B
NA-A +NB-B +NA-B
(2.41)
whereNA-B is the number of nearest-neighbour A–B bonds, whileNA-A andNB-B denote
the numbers of homonuclear bonds in the binary cluster. The σ value is positive for
phase separation (segregation), close to zero for disordered mixing and negative for
mixing (also for layer-like structures) [636].
In Chapter 4, a new formulation for chemical ordering parameter will be proposed.
The new approach gives clearer values, as σ is only significant for clusters of medium
compositions.
2.11 Symmetry Analysis
Symmetry plays very significant role in life and, in science the ancient Greeks applied
this concept to understand pitch and harmony. Later on, Kepler used a mathematical
description to explain the elliptical geometry of planetary orbits [637].
The word symmetry comes from the Greek “symmetria”, meaning “the same mea-
sure” [638] and, is defined as “(Beauty resulting from) right proportion between the
parts of the body or any whole, balance, congruity, harmony, keeping” in the Concise
Oxford Dictionary [639]. The beauty concept [640, 641] of symmetry is understandable
as generally high symmetry (or high similarity) is related to high stability, although it
means losing a degree of diversity.
Many symmetries are observed as nature’s way of preserving harmony and stability.
The periodicity of the DNA structure [642], the symmetrical spiral tubes of α-helices
of myoglobin [643] and the high symmetry (2- and 3-fold symmetry) of zinc insulin
hexamer [644] are a few examples of symmetry adoption in biomolecules.
Theoretical Background and Methods 62
2.11 Symmetry Analysis
In cluster studies, the very well-known cage-like fullerene molecules are stabilised
due to the symmetry principle [645]. Moreover, the high-symmetry (Td) tetrahedral
clusters of 20-atom gold clusters show very large energy gap and electron affinity by
the photoelectron spectroscopy experiments [646]. The stability of this motif was
previously predicted by DFT calculations for Na20 [647]. However, there are cases
in which the most stable cluster has low symmetry, for example due to the Jahn-Teller
effect. This is understood to exist in very small clusters of Al, Sn and As, based on
ab initio studies [103]. Interestingly, these calculations show that the low-symmetry
ground state structure is derived from the high symmetry configuration.
Symmetry has a direct relationship with many other properties, for example en-
ergetics in which symmetrical structures (e.g., protein [644], crystal [648]) generally
have the lowest energy. Higher symmetry is also correlated with a higher degree of
similarity (indistinguishability) and entropy. Sometimes, symmetry is misinterpreted
as an “order”; more “order”, less entropy – based on thermodynamic entropy (second
law of thermodynamics) [649]. Correlation between symmetry and entropy has broad
relevance, for example in statistical mechanics; higher symmetry – higher stability
and higher symmetry – lower entropy relations [648, 650]. In 1952, Schrödinger [651]
indicated that negative entropy corresponds to asymmetry, broken symmetry or less
symmetry [652, 653]. Symmetry can also be explained based on the equilibrium con-
cept, in which the system is at the highest state of indistinguishability (a symmetry,
the highest similarity) at equilibrium or a fully relaxed system, which has of course the
maximum entropy. Leaving this state means reduction of both the total entropy and
the symmetry [648, 654, 655].
To correlate symmetry and entropy, the Curie-Rosen symmetry principle [656] con-
troversially rejected statements by Gibbs [657], Prigogine’s entropy theory [649] and
von Neumann [658] (high similarity, low entropy). Based on their observations [648],
alternative correlation is suggested – the higher similarity, the higher entropy and the
Theoretical Background and Methods 63
2.11 Symmetry Analysis
higher stability [659–661]. However, these principles have in common the idea that
high symmetry basically corresponds to high stability.
For theoretical research, symmetry greatly simplifies many calculation problems,
for example, the existence of crystal lattices in solids. In a 2D analog of NaCl, the
lattice is invariant under inversion (x, y) → (−x,−y), reflections about the x (x, y) →
(x,−y) and y (x, y) → (−x, y) axes, etc. Degeneracy of points saves computational
expense by a factor of 8, for example in band structure calculations. In 3D systems,
greater reduction in calculation effort is possible from 8 operations of group theory:
identity, inversions, reflections (about x-axis, y-axis and x = y), rotations, inversion-
reflections and inversion-rotations [199]. In this research, clusters are classified based
on point group symmetries as follows:
Table 2.5: Classification of clusters based on point group symmetry.
Symbol Meaning
Cj (j=1,2,3,4,6) j-fold rotation axisSj j-fold rotation-inversion axisDj j 2-fold rotation axes ⊥ to a j-fold principle rotation axisT 4 three-and 3 two-fold rotation axes, as in a tetrahedronO 4 three-and 3 four-fold rotation axes, as in a octahedron a centre
of inversionCs a mirror plane
Theoretical Background and Methods 64
Chapter 3
Small Pd-Au and Pd-Pt Clusters
This chapter will discuss the theoretical study of small Pd-Au (Subsection 3.3.1) and
Pd-Pt (3.3.2) bimetallic clusters (N ≤ 100) at the empirical level, using the Gupta-
based potentials. Results for clusters of 1:1 compositions will be presented. The study
focused on the structural (geometry and point group symmetry), energetics/stabilities
(binding energy, second difference in binding energy) and ordering (mixed/segregated).
A brief discussion of a fixed-size 98-atom Pd-Pt clusters will also be included (3.3.3).
3.1 Introduction
Studies of many transition metal clusters agree that the progression of structural motifs
is small icosahedral (Ih or polyicosahedral (pIh)), intermediate-size Dh and large fcc.
The preference for icosahedral structures is driven by surface energy minimisation,
whilst larger clusters gain significant stability by reducing bulk energy with the fcc
structure [68]. The structural transition sizes are system-dependent and a good degree
of agreement between theoretical and experimental results has been reported [662–664].
Transition metal clusters with N < 100 are predicted to appear primarily as pIh-
based motifs, over the Dh or fcc [54]. For Lennard-Jones clusters, magic character is
observed at sizes 13, 19, 31, 38, 55 and 75 atoms [665, 666], which are derived from a
13-atom icosahedron built of twenty strained tetrahedra [610]. Two growth modes of
the icosahedral overlayers (as shown in Figure 3.1) are possible, resulting in two types
Small Pd-Au and Pd-Pt Clusters 65
3.1 Introduction
of motif - “Mackay” (pIh-M) [667] and “anti-Mackay” (pIh-aM or simply pIh) [668].
Fcc-like growth yields Mackay as in Figure 3.1(b), with non-polytetrahedral structures
and geometric close-shells at N = 55, 147 and 309 [669]. Furthermore, mass spectra of
rare-gases clusters (Ar, Kr, Xe) have shown stability at N = 39, 43, 46 and 49 [670].
More familiar overlayers are hcp-like (Figure 3.1(a)) growth of anti-Mackay clusters,
which retain polytetrahedral character. These motifs are best described by N = 19
Meanwhile, medium-size Dh clusters are based on a fivefold-symmetric eight-atom
pentagonal bipyramid (with one atom in the centre) or a 13-atom elongated pentag-
onal bipyramid. Subsequent layers are grown on (100) facets by capping atoms and
concluded by re-entrant (111) faces [54, 680]. Truncation of vertices produces a stable,
quasi-spherical shape of the Marks-Dh [681, 682], with a distinct stability of 75-, 101-
Figure 3.1: Mackay and anti-Mackay growth in polyicosahedra [610].
Small Pd-Au and Pd-Pt Clusters 66
3.1 Introduction
and 146-atom clusters [54, 61, 611].
Gold nanoparticles prepared by chemical means are reported to have a high propor-
tion of Marks-Dh structures [61, 683, 684] but have recently been observed to co-exist
with Ino’s and other truncated Dh [681]. The Dh have also been reported as a stable
gas phase motif for gold clusters on amorphous carbon substrates, predicted to be of
size approximately 309-atoms [685].
Moving to larger sizes, clusters start to approach the behaviour of the bulk with
preference for close-packed geometries. For Morse clusters, the stability order is: hcp
(N = 26), TO (38), tetrahedral (59) and twinned TO (50 and 79) [54]. Of these
shapes, the TO shows remarkable stabilisation due to surface-energy minimisation by
the spherical-like structure [68].
DFT calculations with the inclusion of relativistic effects predict the dominance of
larger TO (over ∼1.5 nm or > 100 atoms) for gold clusters [686], agreeing with exper-
imental observations [492, 687, 688]. Also, many other calculations and experiments
have shown the prevalence of this arrangement, ranging from metallic to Lennard-
Jones clusters [68, 689, 690]. For Pt-clusters, fcc-like nanoparticles have been resolved
via electron microscopy techniques [120, 684]. Different systems are likely to adopt
close-packed-based motifs beginning at different sizes; Au (> 600 atoms) < Pt and Pd
(6000–7000) < Cu (30 000) [68]. Interestingly, the preference of Cu forces Fe (body-
centered cubic (bcc)-phase in bulk) to adopt an fcc arrangement in the gas phase
(FecoreCushell nanoparticles with a sufficiently thick (∼20 monolayers) Cu shell) [691].
There is, however, a very thin line separating cluster motif regimes. Depending
on the preparation method, system, experimental conditions and other parameters,
contrasting results are probable and several published results [66, 181, 692, 693] have
highlighted the co-existence of several structures. Furthermore, addition of a second
element (i.e., bimetallic alloys) gives more determinant for their structures, arising from
variation in relative atomic radius, cohesive energy, surface energy and electronegativity
Small Pd-Au and Pd-Pt Clusters 67
3.3 Computational Details
[116].
3.2 Computational Details
The BCGA program was used to find the GM for Pd-Au and Pd-Pt clusters. Calcula-
tions were performed for sizes ≤ 100 atoms, taking into account only 1:1 compositions
but for 98-atom Pd-Pt clusters, the explorations were performed for all compositions.
100 GA runs were performed for each composition, although for large clusters (≥ 50
atoms) extended (500) GA runs were performed as it is more difficult to find the GM
due to the high number of homotops.
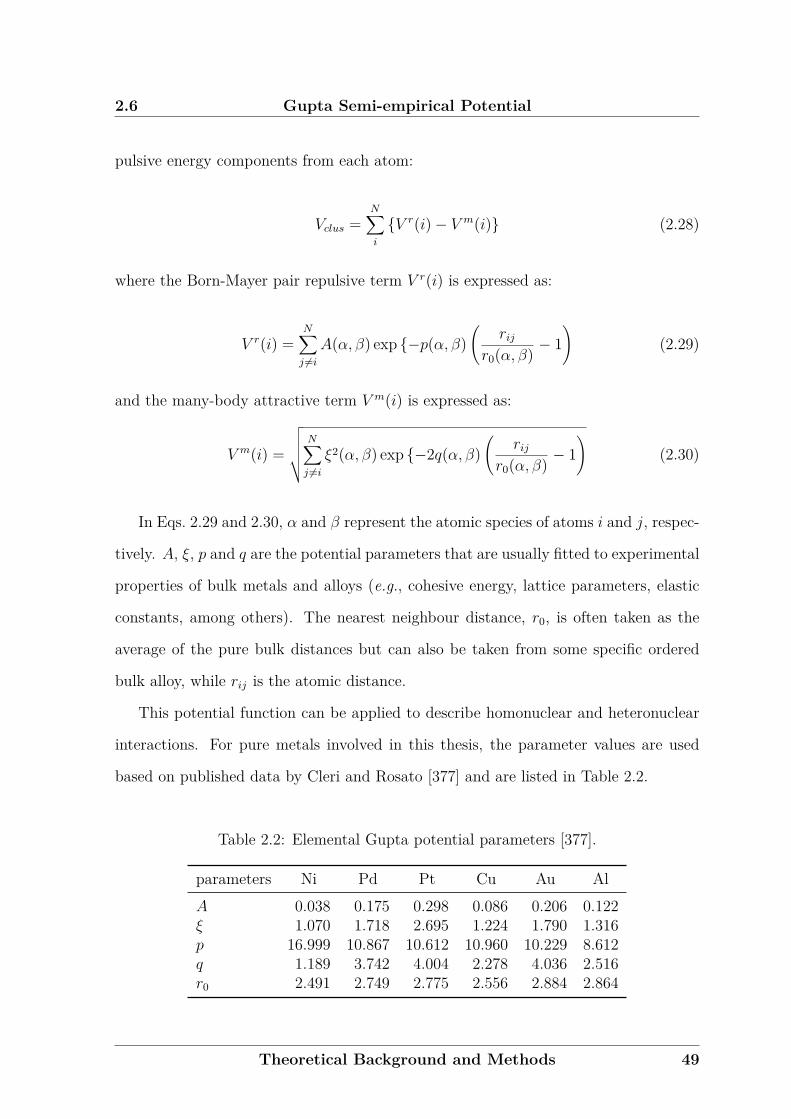
Inter-atomic interactions in a cluster were described by potentials derived from
the Gupta parameters [377, 616]. For Pd-Au, three-types of potentials were studied:
the average, DFT-fit and exp-fit [345], while for Pd-Pt, the average potential was
compared with the new DFT-fit potential.
For each GM, examination of the motif/structure, symmetry and ordering were
undertaken. Furthermore, numerical analysis for energetic profiles was achieved from
the average binding energy (EGuptab ), excess energy as a function of size, ∆Gupta
N and
second difference in energy, ∆2EGuptab . Post-calculation of the ANND gave bonding
characters for the cluster, while the mixing degree was calculated with σ values (see
Chapter 2).
3.3 Results and Discussion
3.3.1 (Pd-Au)N , N ≤ 100
The GM structures found in this work are shown in Table 3.1. Generally, small clusters
up to N = 24 have similar shapes to pure clusters [32, 34]: tetrahedral (Th) (N =
4), octahedral (Oh) (6 − 8) and structures based on 13-atom icosahedral, Ih13 (N ≥
10). For N ≥ 24, the average and DFT-fit potentials exhibit a competition of
fcc/Dh/TO/Mackay-polyicosahedral (pIh-M) structures (N = 26-50), followed by a
Small Pd-Au and Pd-Pt Clusters 68
3.3 Results and Discussion
dominant region of pIh-M (N = 52-62) and Dh (N ≥ 64). On the other hand, the
exp-fit potential adopts significantly different GM with a wider icosahedral region (up
to N = 32) and pIh-M (N = 34-68), before Dh prevalence for N ≥ 70.
Energetic analyses of Pd-Au clusters is shown in Figure 3.2. In Figure 3.2(a), the
GM binding energies of the DFT-fit and exp-fit potentials are larger than for the
average potential, indicates greater overall bonding of clusters. While the cohesive
energy and size [199] differences between Pd and Au are small, the stability of these
clusters is enhanced by the heteronuclear Pd-Au bonds. Further stabilisation is shown
by the exp-fit potential and it is driven by the shorter bonds in the cluster, with more
distortion for a compact but low-symmetry shape.
Figure 3.2(b) shows a plot of the second difference in binding energy, ∆2EGuptab ,
with intense peaks indicate strong stability of a particular size (compared with the
next size clusters, i.e., two atoms smaller and two atoms larger). For all potentials,
there are strong peaks (labelled in figure) at N = 16, 22, 28, 38 (except for the exp-
fit), 48, 54 and 90 (for Pd8Au8, Pd11Au11, ...). These fluctuations are correlated to
structures and/or symmetries of the GM found – shown in Table 3.2, 3.3 and 3.4 (for
2.8
3.0
3.2
3.4
3.6
3.8
10 20 30 40 50 60 70 80 90 100
∆E
bG
upta
(eV
)
NAu
Average
DFT-fit
exp-fit
(a)
-0.030
-0.025
-0.020
-0.015
-0.010
-0.005
0.000
0.005
0.010
0.015
0.020
20 30 40 50 60 70 80 90
∆2E
bG
upta
(eV
)
NAu
16
22
28
38
48
54
90 94
76
Average
DFT-fit
exp-fit
(b)
Figure 3.2: Plots of (a) binding energy (EGuptab ) and (b) second difference in energy
(∆2EGuptab ) of (Pd-Au)N/2, N ≤ 100 global minima found for the average, DFT-fit
and exp-fit potentials.
Small Pd-Au and Pd-Pt Clusters 69
3.3 Results and Discussion
Table 3.1: Global minima of (Pd-Au)N/2, N ≤ 100 clusters obtained by calculationswith the average, the DFT-fit and the exp-fit potentials. (Pd and Au atoms aredenoted by grey and yellow colours, respectively, here and in subsequent figures.)
N ave DFT-fit exp-fit
4
6
8
10
12
14
16
18
20
22
24
26
N ave DFT-fit exp-fit
28
30
32
34
36
38
40
42
44
46
48
continued on next page ...
Small Pd-Au and Pd-Pt Clusters 70
3.3 Results and Discussion
... continued from previous page
N ave DFT-fit exp-fit
50
52
54
56
58
60
62
64
66
68
70
72
74
N ave DFT-fit exp-fit
76
78
80
82
84
86
88
90
92
94
96
98
100
Small Pd-Au and Pd-Pt Clusters 71
3.3
Resu
ltsan
dD
iscussio
nTable 3.2: Cluster energies, structural motifs and point group symmetries of (Pd-Au)N/2, N ≤ 100 global minimafound for the average potential.
nTable 3.4: Cluster energies, structural motifs and point group symmetries of (Pd-Au)N/2, N ≤ 100 global minimafound for the exp-fit potential. (dist. = distorted motif )
Figure 3.4: Global minima of (Pd-Pt)N/2, N ≤ 100 clusters obtained by calculationwith the average (first rows) and DFT-fit (second rows) potentials. (Pd and Pt atomsare denoted by grey and blue colours, respectively, here and in subsequent figures.)
Small Pd-Au and Pd-Pt Clusters 79
3.3 Results and Discussion
to have more Pt character.
Meanwhile, Figure 3.5(b) shows more fluctuations in the plot of second difference
in binding energy of the average potential compared with the DFT-fit. The peaks
indicate stable sizes compared with their neighbours; hence, sudden changes in struc-
ture give peaks at N = 18-20 (pIh to pIh-M transition), 38 (Dh to TO), 46 (fcc to
LT), 50 (LT to fcc-hcp), 58 − 60 (cp(T) to LT to cp(T)), 64 (cp(T) to Dh), 66 (Dh to
fcc-hcp), 70 (fcc-hcp to Dh) and 98 (LT to Dh) for the average potential. (The dip
before each peak shows that the neighbour is a less stable structure and vice versa.)
Meanwhile, peaks for the DFT-fit potential are of lower intensity but no peaks at N
3.6
3.8
4.0
4.2
4.4
4.6
4.8
10 20 30 40 50 60 70 80 90 100
∆E
bG
upta
(eV
)
NPd
Average
DFT-fit
(a)
-0.02
-0.01
0.00
0.01
0.02
0.03
0.04
20 30 40 50 60 70 80 90
∆2E
bG
upta
(eV
)
NPd
18-20
38
46
50
58
60
64
66
7098
80
84
90
Average
DFT-fit
(b)
-0.4
-0.3
-0.2
-0.1
0.0
0.1
0.2
0.3
10 20 30 40 50 60 70 80 90 100
σ
NPd
72
78
88
94
Average
DFT-fit
(c)
2.4
2.5
2.6
2.7
2.8
2.9
3.0
3.1
3.2
10 20 30 40 50 60 70 80 90 100
AN
ND
NPd
Average
DFT-fit
(d)
Figure 3.5: Plots of (a) binding energy (EGuptab ), (b) second difference in energy
(∆2EGuptab ),(c) mixing degree (σ) and (d) ANND of (Pd-Pt)N/2, N ≤ 100 global min-
ima found for the average and DFT-fit potentials.
Small Pd-Au and Pd-Pt Clusters 80
3.3 Results and Discussion
= 64, 66 are observed. Moreover, additional peaks are visible at 80 (Dh/fcc-hcp), 84
(fcc-hcp/LT) and 90 (LT/pIh-M/cp(T). The N = 38 peak being the most intense for
both potentials, due to magic clusters of TO [611, 679], while magic LT [519] is also
apparent for the DFT-fit potential at N = 98.
Mixing degree (σ) analyses of the GM are shown in Figure 3.5(c). Overall, the
average potential shows more mixing (on the surface) than the DFT-fit potential,
as can be seen by lower σ values especially in the size regions N ≤ 30 and N ≥ 54.
With limited number of layers, clusters of this size regime have core-shell ordering
but for N ≥ 54, onion-like ordering: Pd(centre atom)-Pt(inner layer)-Pd(outer layer)
is adopted (average potential). The GM of the DFT-fit potential mostly favour a
core-shell ordering, except for the minor dips at N = 72, 78-82, 88 and 94 (labelled on
figure), which correspond to onion-like ordering.
Only little can be extracted from the ANND profiles in Figure 3.5(d) but they
provide information on bond character in clusters. Large clusters exhibit bulk-like
properties; hence, the ANND shows a plateau from the mid-size region. For small
clusters (N ≤ 50), there are fluctuations of high-low peaks linked to a significant
variation of the bond character. This is one of the interesting features for small clusters
which depend on many factors – size, structure, symmetry, among others.
3.3.3 98-atom Pd-Pt Clusters
Studies by Paz-Borbón et al. [694] on fixed 98-atom Pd-Pt nanoalloys have shown, using
the average potential, that LT is relatively stable LT compared with other motifs. The
present work expands the searches with inclusion of the new DFT-fit potential. Five
main structural motifs are identified, as shown in Figure 3.6. Only single variants of
cp(T), fcc and fcc-hcp are found, while two LT variants are classified as GM, with a
minor orientation difference on the outer layer. The Dh describes more the packing
group (rather than cluster motif) and eventually as many as 23 variants are observed.
The LT are adopted as GM in the medium composition, NPd = 45-67 and NPd =
Small Pd-Au and Pd-Pt Clusters 81
3.3 Results and Discussion
Figure 3.6: Structural motifs of global minima found for 98-atom Pd-Pt clusters.
39-64, for the average and DFT-fit potentials, respectively as shown in Figure 3.7.
Energetically, this motif is the most stable compared with the other motifs for both
potentials. The Dh meanwhile, is favoured over a wider composition range, spanning
both Pd- and Pt-rich regions. Statistically, 70/75 Dh and 23/23 LT (for the aver-
age/DFT-fit potential, respectively) GM (different compositions) are found in the
calculations. The Dh dominance can be attributed to the preferences of this motif for
pure Pd98 (and also Pt98 for the DFT-fit potential). For the average potential, fcc
is favoured for Pt98 and consistently four fcc and one fcc-hcp GM are found (while
no fcc/fcc-hcp structures are found for the DFT-fit potential). Apart from that, one
cp(T) motif is found for both potentials at a significantly different composition (NPd
= 70 and 33, for the average and DFT-fit potentials, respectively).
Bonding profiles of the 98-atom Pd-Pt clusters, as shown in Figures 3.8(a) and
3.8(b), are consistent with the earlier findings in clusters of 1:1 composition. More
mixing is favoured by the average potential based on the lower values of σ. However,
the ANND profiles (Figure 3.8(b)) show smooth transitions in the Pd- and Pt-rich
regions for both potentials, since the ANND of these regions are mainly made up of
homonuclear bonds. In the medium region, both potentials show elevated ANND,
indicating different bond lengths of the cluster. Comparing the ANND profiles and
Small Pd-Au and Pd-Pt Clusters 82
3.4 Chapter Conclusions
-18
-15
-12
-9
-6
-3
0
0 10 20 30 40 50 60 70 80 90
∆E
98G
upta
(eV
)
NPd
Average
DFT-fit
Figure 3.7: Excess energies of 98-atom Pd-Pt global minima for the average andDFT-fit potentials. Each symbol denotes different motifs: LT (filled circle), Dh (filledtriangle), cp(T) (open inverse-triangle), fcc (open square) and fcc-hcp (open diamond).
the motif stability in Figure 3.7, this elevated region in ANND belongs to the LT GM,
which generally have longer bonds compared with the Dh (Pd- and Pt-rich regions). It
appears that the values of ANNDs for the average potential are higher for the entire
compositions. As has been mentioned for the 1:1 composition clusters, this seems to
imply that the average potential adopts more Pt character than Pd.
3.4 Chapter Conclusions
Calculations for clusters with N ≤ 100 atoms provide evidence of the prevalence of
very small polyicosahedral motif. The pIh–Dh transition is observed in the mid-size
of cluster with 1:1 compositions, both for Pd-Au and Pd-Pt. For Pd-Pt, this occurs
at a smaller size (N = 28) compared with Pd-Au (N = 64). Further increase in
the number of atoms eventually transforms the cluster to the bulk-like close-packed
structure, which for Pd-Pt is observed at N ≥ 82. It is interesting that in the range
of N ≤ 50, there is strong competition between several structural motifs (fcc, Dh, TO,
Small Pd-Au and Pd-Pt Clusters 83
3.4 Chapter Conclusions
-0.2
0.0
0.2
0.4
0.6
0.8
1.0
0 10 20 30 40 50 60 70 80 90
σ
NPd
Average
DFT-fit
(a)
2.68
2.69
2.70
2.71
2.72
2.73
0 10 20 30 40 50 60 70 80 90
AN
ND
NPd
Average
DFT-fit
(b)
Figure 3.8: Plots of (a) mixing degree, σ and (b) ANND of 98-atom Pd-Pt globalminima found for the average and DFT-fit potentials.
pIh-M), which is the reason for undertaking a more detailed study of 34 and 38-atom
clusters in this thesis.
Analysis of the binding energy of Pd-Au shows that Eb,exp-fit ≥ Eb,DFT-fit >>
Eb,average. The higher binding energies for the DFT-fit and exp-fit potentials are
due to more heteronuclear Pd-Au interactions (i.e., more mixing in the surface of a
core-shell clusters). The slightly better stabilisation for the exp-fit (compared with
DFT-fit) potential arises from distortion of the structures. On the other hand, the
GM from calculations with the average potential show a preference for the surface-
segregated core-shell clusters.
In contrast to the Pd-Au system, calculations of Pd-Pt clusters with the the DFT-
fit potential produce GM which are energetically very close to the average potential,
with the average showing greater mixing due to a preference for more Pd-Pt bonds,
which is confirmed by the mixing degree, σ values.
Analysis of second difference in energy, ∆2EGuptab raises two of many issues in de-
termining cluster stability. First, the structural motif where a large jump is observed
for the transition between motifs, with the most obvious findings for the magic TO38,
LT98 and motif derived from pIh-M55. Secondly, geometric shell closing gives rise to
Small Pd-Au and Pd-Pt Clusters 84
3.4 Chapter Conclusions
significant fluctuations in ∆2EGuptab , corresponding to point group symmetry transi-
tions (high symmetry vs. low symmetry). Notably for Pd-Au clusters, the DFT-fit
and exp-fit potentials adopt a better mixing on the surface and this allows structures
with a high symmetry.
Results for 98-atom Pd-Pt clusters confirm the behaviour of the average and DFT-
fit potentials – greater mixing is preferred for the average potential, including onion-
like ordering. At this size, pure clusters already adopt bulk-like close-packed motifs but
variation in the composition resulting in Dh as the most widely found GM. The second
most frequent is the magic LT, which is a close-packed motif, along with three other
found structures: cp(T), fcc and fcc-hcp, testifying to the prevalence of bulk character.
Small Pd-Au and Pd-Pt Clusters 85
Chapter 4
Structure, Energetic and ChemicalOrdering of 34- and 38-atomPalladium-Gold,Palladium-Platinum andNickel-Aluminium NanoalloyClusters
This chapter will discuss theoretical searches at the EP level for three systems: Pd-
Au, Pd-Pt and Ni-Al. In the computational details section (4.2), the newly proposed
compositional mixing degree, σN , (4.2.1) is presented. For results and discussion, the
focus is on general motifs (Section 4.3), GM motifs (4.4), chemical ordering (4.5) and
energetic profiles (4.6).
4.1 Introduction
Nanoparticles of pure metals or alloys based on Pd, Au or Pt exhibit interesting optical,
electronic, chemical and magnetic properties [3] and are of importance for the applica-
tions in microelectronics, chemical sensing, information storage, photochemistry, nano-
electronics and optics [28, 695–699]. The resistance to oxidation makes them beneficial
in catalytic reactions. Moreover, combination of these metals can be utilised to obtain
better activity and selectivity of catalysts due to unique heteronuclear interactions and
Structure Database of Pd-Au, Pd-Pt and Ni-Al Clusters 86
4.1 Introduction
the interplay with other physical properties [3].
Compared with the other alloys, nickel-based alloys are typically of more impor-
tance in advanced material technologies, such as structural components in gas turbines
for power generation and in aircraft [700], diesel engine turbocharger rotors, high-
temperature die and moulds, hydro-turbines and cutting tools [701]. In the Ni-Al alloy
family, Ni3Al is commonly used for its high resistance to oxidation, corrosion and ther-
mal fatigue [702, 703]. In the nano-size range, reactive Ni-Al is an important material
for nano-heaters [704].
All elemental bulk solids of palladium, gold, platinum, nickel and aluminium ex-
hibit fcc packing [59, 62, 228] and the phase diagrams of their bimetallic mixtures can
be classified as slightly mixed (Pd-Au), disordered (Pd-Pt) and ordered mixed (Ni-
Al). The Pd-Au phase diagram shows that ordered phases can only be achieved with
Pd concentrations of 25%, 50% and 75% [705]. Pd-Pt, meanwhile, displays random
mixing solid solutions for all compositions [706] and, for Ni-Al, ordered inter-metallic
compounds are formed at various compositions: NiAl, NiAl3, Ni3Al, Ni5Al3, Ni3Al4 and
Ni2Al3 [704, 707]. X-Ray Diffraction (XRD) analysis and electron probe microanaly-
sis (EPMA) results reveal the cubic AuCu3-type (Ni3Al), cubic CsCl-B2 type (NiAl),
hexagonal Ni2Al3-type and orthorhombic NiAl3-type structures [708, 709]. However,
the bulk phase diagram is not the sole determinant when discussing nanoscale parti-
cles, as phase stabilities will differ significantly especially for small nanoparticles with
relatively large surface areas [459].
The reason for concentrating here on 34- and 38-atom clusters is that previous
works on several nanoalloy systems [254–256, 345] have shown that 34-atom clusters
typically exhibit a wide range of structural motifs as a function of composition. On the
other hand, TO structures typically dominate 38-atom clusters and have been found
as the GM for many (e.g., Ni, Cu, Ag, Au, Cu-Au and Ni-Al) clusters for the Gupta
many-body potential [378, 599, 710], as well as the other many-body and pair potentials
Structure Database of Pd-Au, Pd-Pt and Ni-Al Clusters 87
4.2 Computational Details
[54, 85, 86, 595, 610]. This preference is of interest for testing how different chemical
orderings are stabilised by different heteroatomic interaction strengths.
In this chapter, three different systems will be discussed in which the mixing of the
bulk alloy is varied. Upon comparison of these systems, the findings will: (i) improve
the large structural database that has been built from several bimetallic systems, fo-
cussing on the size 34 and 38 atoms, (ii) give a better picture of the system-specific,
size and compositional effects on structural motifs, chemical ordering and energetic
profiles of the clusters.
4.2 Computational Details
Global optimisation at the empirical level for the Pd-Au, Pd-Pt and Ni-Al clusters
were carried out with the BCGA program. 100 GA runs were performed in finding the
GM of 34- and 38-atom clusters, for all compositions. Based on the Gupta potential
in Table 2.2, the following differences between the studied systems can be identified:
(i) Pd-Au - slightly differ in atomic sizes but all Gupta potential parameters are very
close. (ii) Pd-Pt - atomic sizes are very close but A and ξ parameters are very different.
(iii) Ni-Al - have a significant differences in atomic size and parameters of p and q .
For each binary system, three modifications of the potential, as in Subsection 2.6.2
were studied: parameter set I in which all parameters (A, ξ, p, q and r0) in the
Gupta potential [377, 616] were weighted in a symmetrical fashion; parameter set II
(symmetric weighting of only the pair and many-body energy scaling parameters A and
ξ); parameter set III (anti-symmetric weighting of A and ξ). For consistency for all
the three systems, rules in Table 4.1 were applied and different notations – w, ws and
wa are used, indicating the weighting in parameter sets I, II and III, respectively. The
GM were classified by their motif and ordering, while energetically they were analysed
by the excess energy as a function of size, ∆GuptaN (see Chapter 2).
Structure Database of Pd-Au, Pd-Pt and Ni-Al Clusters 88
4.3 Computational Details
Table 4.1: Effects of the parameter sets I, II and III on the Pd-Au, Pd-Pt and Ni-Alsystem.
= 0.4-0.6) > mixed (random/onion-like) (w, ws = 0.6-1.0). A similar progression is
also visible for the parameter set III but with the expansion of the spherical cap (low
weightings) and random mixed (high weightings) phases.
Examination of the mixed clusters of the Pd-rich region for w, ws = 0.6-1.0 provides
evidence of a strong tendency for Pt atoms to form a ring-core (due to limited number
Structure Database of Pd-Au, Pd-Pt and Ni-Al Clusters 117
4.5 Chemical Ordering
of Pt) for both sizes: 34 (NPd = 25-29) and 38 (NPd = 29-33). This character is
accounted for a very low σN , as Pd-Pt bonds are maximised.
For the high weighting parameters (w, ws, ws ≥ 0.6), there is a significant regime of
the onion-like Pd-Pt-Pd ordering, potentially due to the competition between Pd/Pt
site preference and the size effects, which tends to overcome the PtcorePdshell tendency
[257]. On the other hand, the extreme high weighting (w, ws, ws → 1.0) parameters
are found to shift a mixed-ordering from disordered to ordered, as indicated by very
low σN and clusters are distorted towards bcc structures.
Even though 34- and 38-atom Pd-Pt clusters show essentially the same chemical
ordering maps, it can be noted that a wider region of the onion-like ordering is found
for 34- (w, ws = 0.6-1.0) compared with 38-atom clusters (w, ws = 0.8-1.0) for the
parameter sets I and II. This is influenced by the adopted motifs, as the pIh (N = 34)
favours the onion-like segregation pattern more than that of the fcc-TO (N = 38),
which is consistent with results for the larger (e.g., 147- and 309-atom [723]) clusters.
Also for size 34, the lower σN values (∼ −0.3) are seen for high weightings (w, ws, wa
→ 1.0), consistent with the previously discussed structural map, in which more bcc are
observed. This motif has a perfect atomic configuration to support the ordered mixing
with alternating binary atoms. On the other hand, less variation of the structure for
size 38 (in which TO is the magic cluster) is reflected in the less negative σN values
(minimum ∼ −0.2) and provides evidence for less mixing in clusters of this size.
4.5.3 Ni-Al
The ordering profiles for 34- and 38-atom Ni-Al clusters (Figure 4.10) are fairly simple
for the parameter sets I and II, in which only a core-shell (incomplete types i-CS(A)
and i-CS(B) and complete) ordering is observed, similar to Pd-Au. The progression of
i-CS(C) – i-CS(A) – complete core-shell only gives a small range variation in the σN ,
resulting in crossover between weightings. For both parameter sets, a better mixing is
identified for 34- compared with 38-atom clusters, based on results of the low weighting
Structure Database of Pd-Au, Pd-Pt and Ni-Al Clusters 118
4.5 Chemical Ordering
(a)
Structure Database of Pd-Au, Pd-Pt and Ni-Al Clusters 119
4.5 Chemical Ordering
(b)
Figure 4.8: Chemical ordering analyses based on ordering maps (qualitative) and com-positional mixing degrees, σN , curves (quantitative) of (a) 34- and (b) 38-atom Pd-Auglobal minima for the parameter sets I, II and III.
Structure Database of Pd-Au, Pd-Pt and Ni-Al Clusters 120
4.5 Chemical Ordering
(a)
Structure Database of Pd-Au, Pd-Pt and Ni-Al Clusters 121
4.5 Chemical Ordering
(b)
Figure 4.9: Chemical ordering analyses based on ordering maps (qualitative) and com-positional mixing degrees, σN , curves (quantitative) of (a) 34- and (b) 38-atom Pd-Ptglobal minima for the parameter sets I, II and III.
Structure Database of Pd-Au, Pd-Pt and Ni-Al Clusters 122
4.6 Chemical Ordering
parameters for the Ni-rich compositions.
For the parameter set III, the σN values are consistent with the progression of
a wider range of the σN values for size 34 is found compared with size 38. This
is in contrast to the earlier discussed structural map, in which size 34 displays less
variation of the structural motifs. It seems therefore, that there is less correlation
between the σN values (i.e., chemical ordering / mixing degree) and the structural
motifs. However, some orderings are clearly preferred by a specific motif (e.g., onion-
like chemical ordering in the pIh and ordered mixing in the bcc structures).
4.5.4 General Observation of Ordering Profiles Based on theσN
The ordering profiles for 34- and 38-atom bimetallic nanoalloys of Pd-Au, Pd-Pt and
Ni-Al give a confirmation for the accuracy and consistency of the newly defined compo-
sitional mixing degree, σN , analysis. The compositional effects (i.e., A-rich, B-rich and
medium-composition for A-B clusters) which is the limitation of the old mixing degree,
σ, analysis is resolved. This is crucial for future use of this analysis in predicting a
chemical ordering of the cluster.
Figure 4.11 shows a summary of combined σN values of the eight-types of ordering
mentioned above. The differences are not very large and, generally, the σN values are
as follows: spherical cap (-0.02 to -0.08) > ball-and-cup (-0.04 to -0.17) > i-CS(B)
(-0.05 to -0.20) >> i-CS(C) (-0.07 to -0.23) ≥ i-CS(A) (-0.09 to -0.23) >> core-shell
(-0.14 to -0.29) ≥ onion-like (-0.13 to -0.28) ≃ random mixing (-0.13 to -0.28).
Structure Database of Pd-Au, Pd-Pt and Ni-Al Clusters 123
4.6 Chemical Ordering
(a)
Structure Database of Pd-Au, Pd-Pt and Ni-Al Clusters 124
4.6 Chemical Ordering
(b)
Figure 4.10: Chemical ordering analyses based on ordering maps (qualitative) andcompositional mixing degrees, σN , curves (quantitative) of (a) 34- and (b) 38-atomNi-Al global minima for the parameter sets I, II and III.
Structure Database of Pd-Au, Pd-Pt and Ni-Al Clusters 125
4.6 Energetic Profiles
Figure 4.11: Combined compositional mixing degrees, σN , of PdAu-34, PdAu-38, PdPt-34, PdPt-38, NiAl-34 and NiAl-38 clusters.
4.6 Energetic Profiles
4.6.1 Pd-Au
The patterns of excess energies for Pd-Au are shown in Figure 4.12, where for the
parameter sets I and II, small gaps between weightings are evident, especially when
they are plotted on the same scale as the parameter set III (inset figures). The energy
crossover of the parameter set I for both sizes can be attributed to these small gaps
but arises from a slight variation in chemical ordering rather than structural motifs (as
GM are mostly Dh and TO, for 34- and 38-atom clusters, respectively).
Energy values for the most stable compositions are given in Table 4.3. The energy
gap between weightings (i.e., highest minus lowest) in the parameter set I (0.439 and
0.847 eV, for 34- and 38-atom, respectively) are lower than those of the parameter set II
(1.629 and 1.951 eV). On the other hand, the parameter set III exhibits a considerably
larger range – 8.709 and 9.907 eV. Furthermore, Table 4.3 also shows that there is a
variation for the most stable composition, in which for the parameter set I, it is shifted
down to NAu = 13 (PdAu-34) and NAu = 16 (PdAu-38). Both sizes provide evidence
for the slightly Au-rich preference for Pd-Au clusters – NAu ∼ 21 (PdAu-34) and NAu
Structure Database of Pd-Au, Pd-Pt and Ni-Al Clusters 126
4.6 Energetic Profiles
(a)
(b)
Figure 4.12: Excess energy variation of (a) 34- and (b) 38-atom Pd-Au clusters calcu-lated with the parameter sets I, II and III. The inset figures show energetic profiles atthe same scale as the parameter set III.
Structure Database of Pd-Au, Pd-Pt and Ni-Al Clusters 127
4.6 Energetic Profiles
Table 4.3: Excess energy series of (a) 34-atom and (b) 38-atom Pd-Au global minimafor the parameter sets I, II and III.
Weighting, Excess energy, eV (composition, NAu)w, ws, wa I II III
Structure Database of Pd-Au, Pd-Pt and Ni-Al Clusters 132
4.7 Chapter Conclusions
(a)
(b)
Figure 4.14: Excess energy variation of (a) 34- and (b) 38-atom Ni-Al clusters calculatedwith the parameter sets I, II and III. The inset figures show energetic profiles at thesame scale as the parameter set III.
Structure Database of Pd-Au, Pd-Pt and Ni-Al Clusters 133
4.7 Chapter Conclusions
Table 4.5: Excess energy series of (a) 34-atom and (b) 38-atom Ni-Al global minimafor the parameter sets I, II and III.
Weighting, Excess energy, eV (composition, NAl)w, ws, wa I II III
incomplete Mackay-icosahedron with a double tetrahedral component (“pIh-M(DT)1”,
“pIh-M(DT)2”), polyicosahedra with a double Ih13 core (“pIh-db”) and two distorted
pIh (“dist1”, “dist2”). (A more detailed description of the names is given in Chap-
ter 4.). The two variants of Dh, fcc-hcp and pIh-M(DT) are the two most abundant
variants, while distorted pIh is varied from one another and the two selected are based
on their energetic stabilities.
“Decahedra” generally refers to the packing type, not the geometry, so many varia-
tions are possible. In the selected region (NAu = 15−30) of 34-atom clusters, however,
Dh1 and Dh2 make up ≥ 50% from a total of 500 structures of the EP search for each
composition. They differ in the arrangement of the 19-atom cluster core and also the
subsequent layers for which Dh2 (diameter 9.4 Å) is more compact than Dh1 (10.4 Å).
Meanwhile, Dh-Ih is a mixed motif (with a minor icosahedral character) and is the
GM for both pure Pd34 and Au34. Between the two variants, fcc-hcp1 has more hcp
character than fcc-hcp2, while pIh-M(DT)2 is more expanded than pIh-M(DT)1. For a
monometallic cluster, pIh-M(DT)1 has a significantly higher symmetry (Cs compared
with C1) variant.
34- and 38-atom Pd-Au clusters by a Combined EP-DF Method 140
5.3 Results and Discussion
Figure 5.1: Structural motifs of global minima found for PdAu-34 clusters. (Pd andAu atoms are denoted by yellow and grey colours, respectively, here and in subsequentfigures.)
5.3.2 Structural Motifs of 38-atom Clusters
38-atom Pd-Au clusters do not exhibit a rich diversity of structures (compared with
34-atom clusters), as the EP searches very often found a TO motif [255, 345], which is
a fragment of fcc packing – as in the bulk phases of pure palladium and gold [59, 62].
In addition to the TO, mixed Oh-Ih [255], pIh-M-pc5, Dh, Dh-Ih and D6h symmetry
pIh6 [43] structures were found, as shown in Figure 5.2.
5.3.3 Bonding Analyses of the Global Minima
Based on the bulk fcc lattice, the nearest-neighbour distances are 2.749 Åand 2.884 Å,
while the second-nearest neighbour distances are 3.848 Åand 4.037 Å, for Pd and Au,
respectively. These values are a guide and, by examining each of the PDF plots, it
was decided to select the values of 3.3 Å(Pd-Pd), 3.5 Å(Au-Au) and 3.4 Å(Pd-Au), as
34- and 38-atom Pd-Au clusters by a Combined EP-DF Method 141
5.3 Results and Discussion
Figure 5.2: Structural motifs of global minima found for PdAu-38 clusters.
the cut-off for defining each respective type of bond. This is consistent with the bulk
data (rPd-Pd < rPd-Au < rAu-Au) and the bulk distances mentioned above. The PDFs
of 34-atom clusters are more complex than those of the 38-atoms, due to the greater
variation of structural families.
The calculated ANNDs from the GM of the pure Pd clusters are 2.68 Å(34-atoms)
and 2.69 Å(38-atoms), while pure Au clusters display larger values – 2.79 Å(34- and
38-atoms). For Pd-Au bimetallic clusters, there is a steady increase in ANND with
increasing Au content, as shown in Figure 5.3, due to the larger atomic radius of Au,
in accordance with Vegard’s law.
Due to a relatively small difference in the Gupta potential parameters between
Pd and Au [377], it is expected that the ANND for bimetallic clusters combining the
two would result in a straightforward pattern. This is observed for 38-atom clusters,
especially with the average potential but there is a slight deviation of the curve for
the DFT-fit and exp-fit potentials, due to a variation in the structural motif [345].
PdAu-34 however, shows more fluctuations, for which the heterogeneous pIh structures
are observed, compared with the continual TO structures for PdAu-38. The ANNDs for
the DFT-fit and exp-fit potentials exhibit a high degree of Pd-Au mixing, compared
34- and 38-atom Pd-Au clusters by a Combined EP-DF Method 142
5.3 Results and Discussion
Figure 5.3: ANND variation of 34- and 38- atom PdAu global minima for the parameterset III (wa = 0.5, 0.7-0.9), DFT-fit and exp-fit potentials.
with the average potential.
5.3.4 Statistics of the BCGA Searches
34-atom (or 38-atom) clusters are a computationally reasonable size for the BCGA
searches, for which high percentages (more than a-third) of the total runs comprise
the GM structure (compared with, for example, only ≈ 1% in the study of 98-atom
clusters). For 34-atom Pd-Au, the frequency of finding a motif in 500 GA runs (with
the average potential) is illustrated in Table 5.1, showing only the dominant motifs.
A larger number only shows that the motif (and the homotops) is easily found but
does not necessarily mean it is the most stable (lowest in energy) structure.
Table 5.1: Frequencies of motifs found in the GA searches.
34- and 38-atom Pd-Au clusters by a Combined EP-DF Method 143
5.3 Results and Discussion
The Dh1 variant is found as the GM for all compositions, with the only exception
for composition (5,29), of which Dh2 prevails (all motifs are shown in Figure 5.1).
The data show a strong correlation between the most stable motif and the frequency,
in which at least 42% of the GA runs find Dh1 for NAu = 15-23. There is a strong
distribution between Dh1 (18-38%) / Dh2 (18-53%) / fcc-hcp1 (17-32%) for the NAu
= 24-27 region, while Dh2 strongly dominates for NAu = 28-29.
For composition (5,29), the complete core-shell configuration is attained for Dh2
and might be the reason for this motif’s prevalence over Dh1 (no Dh1 is found for
this composition). The composition (6,28) also shows the same behaviour, in which
one Pd atom is located at the highest coordinate site of the surface. Dh1 however, is
eventually found as the GM for this composition (but with only 7% frequency). These
statistics may not seem very significant but the DFT results (discussed later in this
chapter) give some evidence for their correlation.
5.3.5 BCGA-BHMC Searches
Exhaustive examination of 500 GA runs give several structural motifs as shown in
Figure 5.4(a), with a clear prevalence of Dh1. A total of 10 motifs (including low-lying
isomers) are found but not for all compositions. For example, pIh-db is found at one
composition only and pIh-M(DT)2 is found for a few compositions. This presents an
incomplete series of the motif as a function of composition. To resolve this, a combined
BCGA-BHMC (500 MC steps) is performed to give curves as shown in Figure 5.4(b),
in which the missing motif is now connected. However the curves are rough and, by
performing more runs (2,500 MC steps), smoother curves are obtained (Figure 5.4(c)).
The deeper exploration of the PES is observed with a lower choice of kbT , as shown in
Figure 5.4(d) (only an example of the Dh1 calculation is shown).
34- and 38-atom Pd-Au clusters by a Combined EP-DF Method 144
5.3 Results and Discussion
-0.8
-0.7
-0.6
-0.5
-0.4
-0.3
∆E
34G
up
ta (
eV)
(a)Dh1Dh2
Dh-Ihfcc-hcp1fcc-hcp2
pIh-M(DT)1pIh-M(DT)2
pIh-dbdist1dist2
(b)
-0.8
-0.7
-0.6
-0.5
-0.4
-0.3
16 20 24 28
∆E
34
Gupta
(eV
)
NAu
(c)
16 20 24 28
NAu
(d)0.050.030.01
Figure 5.4: Progression of BCGA-BHMC approach: (a) motifs from 500 GA runs, (b)BCGA followed by 500 MC steps, (c) BCGA followed by 2,500 MC steps and (d) effectsof different kbT .
5.3.6 Structural Effects at the EP and DFT Levels
34-atom Clusters
The energetic profiles for the 10 defined motifs at the EP level are shown in Figure 5.5(a)
and a subsequent re-optimisation at the DFT level gives the results in Figure 5.5(b).
At the EP level (Figure 5.5(a)), there is a clear gap between Dh (the GM structure)
and the other motifs. Even so, the separations between all 10 studied motifs are only
∼0.2 eV, indicating that these motifs are energetically competitive.
At the DFT level (Figure 5.5(b)), a particularly disordered pattern of preference is
observed. (As a strategy to reduce the computational effort for the calculations at the
DFT level, only one variant was considered for the dist and pIh-M(DT) motif – the
34- and 38-atom Pd-Au clusters by a Combined EP-DF Method 145
5.3 Results and Discussion
-0.8
-0.7
-0.6
-0.5
-0.4
-0.3
16 20 24 28
∆E
34G
upta
(eV
)
NAu
Dh1Dh2
Dh-Ihfcc-hcp1fcc-hcp2
pIh-M(DT)1pIh-M(DT)2
pIh-dbdist1dist2
(a)
-3.0
-2.8
-2.6
-2.4
-2.2
-2.0
-1.8
16 18 20 22 24 26
∆E
34
DF
T (e
V)
NAu
Dh1Dh2
Dh-Ihfcc-hcp1fcc-hcp2
pIh-M(DT)1pIh-db
dist2
(b)
Figure 5.5: Excess energies of 34-atom clusters at the (a) EP and (b) DFT levels.
34- and 38-atom Pd-Au clusters by a Combined EP-DF Method 146
5.3 Results and Discussion
most energetic motifs.) Dh1 is singled-out for NAu = 16-21 but is destabilised for NAu
= 22-26, for which fcc-hcp structures prevail. The difference between Dh1 and Dh2
are reflected in the energetic profiles for both EP and DFT levels. On the contrary,
fcc-hcp1 and fcc-hcp2 are very close in structure (only a minor difference in the hcp
vs. fcc character; hence, the arrangement of atoms is very close) as are the stabilities
for both levels of theory.
In addition to the above mentioned motifs, calculations were also performed for
a bcc cluster for the composition (17,17) that is produced when the heteronuclear
interaction is extremely parameterised (see Chapter 4). It is, however, destabilised by
> 1 eV compared with the Dh1 motif.
Overall, there is reasonably good consistency between the EP and DFT predictions
for NAu = 16-21. However, for the slightly biased Au-rich (NAu = 22-27) clusters,
close-packed fcc-hcp structures are more favourable but are not predicted by the EP
calculations. However, this motif is statistically more favourable than Dh (as shown
in Table 5.1).
38-atom Clusters
The stability of the motifs for 38-atom clusters at the EP level is shown in Figure 5.6(a).
There is a clear preference for TO over the whole composition range and significant
destabilisation of pIh6. Four other motifs compete with TO but, depending on the
compositions, the order of preferences varies.
Complex competition is observed for the Au-rich region, in which there are very
close energy gaps between Dh, Oh-Ih and Dh-Ih, whilst pIh-M-pc5 is slightly desta-
bilised with increasing Au content. In the Pd-rich region, the order is: Dh ≈ pIh-M-pc5
< Oh-Ih ≈ Dh-Ih, while the medium compositions display a greater gap of stability:
pIh-M-pc5 < Dh < Oh-Ih < Dh-Ih.
For composition (6,32), only 0.002 eV separates pIh-M-pc5 from TO, enhanced
by the high symmetry (C5v), complete core-shell comprising six-core Pd atoms of
34- and 38-atom Pd-Au clusters by a Combined EP-DF Method 147
5.3 Results and Discussion
-1.0
-0.5
0.0
0.5
1.0
1.5
5 10 15 20 25 30 35
∆E
38
Gu
pta
(eV
)
NAu
TOOh-Ih
pIh-M-pc5
DhDh-Ih
pIh6
(a)
-5.0
-4.0
-3.0
-2.0
-1.0
0.0
1.0
5 10 15 20 25 30 35
∆E
38
DF
T (
eV)
NAu
TOOh-Ih
pIh-M-pc5
DhDh-Ih
pIh6
(b)
Figure 5.6: Excess energies of 38-atom clusters at the (a) EP and (b) DFT levels. (boxin the bottom figure) In the initial DFT calculations, pIh-M-pc5 and pIh6 were alsoconsidered.
34- and 38-atom Pd-Au clusters by a Combined EP-DF Method 148
5.3 Results and Discussion
pIh-M-pc5. This can be considered to be the magic composition for the motif and
also appears to be the magic composition for Oh (TO) and D6h symmetry (pIh6), both
of which adopt core-shell ordering. Related to this, maximum stabilisation of TO is ob-
served for composition (14,24) (also with Oh symmetry), having Pd atoms at each site
of the hexagonal centroid, giving the maximum number of Pd-Au bonds and minimum
number of Pd-Pd bonds. All of these high symmetry stabilisations (i.e., geometric
shell closings) are shown in Figure 5.7 and can be seen to give rise to a clear dip in the
excess energy in Figure 5.6(a). Stabilisation due to geometric shell closings, however,
is weaker than the effect of atomic arrangements (i.e., structural motif). Here, clusters
are seen to adopt the TO motif (and disfavour pIh6) for all compositions.
The previous EP-DF calculations on 38-atom Pd-Au clusters by Paz-Borbón et al.
[345] only concentrated on composition NAu = 19-25 and observed a preference for TO
with close competition from Oh-Ih. The expanded calculations (in this work) over the
whole composition range and taking into account six different motifs, are shown in
Figure 5.6(b). The initial calculations (box in the figure) for composition NAu = 14-24
give consistent findings (DFT vs. EP) that pIh6 is the least competitive motif. The
pIh-M-pc5 motif is also disfavoured and these two motifs were omitted from the further
DFT study (reducing computational cost) for other compositions.
TO clearly dominates for NAu ≥ 18 but there is a close competition between TO and
Figure 5.7: Magic compositions of 38-atom Pd-Au clusters.
34- and 38-atom Pd-Au clusters by a Combined EP-DF Method 149
5.3 Results and Discussion
Oh-Ih motif for the Pd-rich (NAu ≤ 18) compositions, with Oh-Ih prevailing in the NAu
= 13-17 region. Dh and Dh-Ih are constantly less preferred for the entire composition
range, except for the crossover at NAu = 36-37. Both dips at (14,24) and (6,32) of the
TO curve are still visible (similar to the EP results), which show qualitative agreement
on the shell-closing and magic composition effects.
5.3.7 Chemical Ordering Effects
There are a number of experimental results [123, 171, 761, 762] and theoretical calcula-
tions [123, 171, 255, 345, 763] that indicate a prevalence of the PdcoreAushell ordering and
are consistent with the lower heat of formation, compared with the inverse AucorePdshell
and other configurations [123]. The PdcoreAushell ordering is also favoured by the lower
surface energy of Au (Esurf, Au = 96.8 vs. Esurf, Pd = 131 meV/Å2 [201, 202]) – forming
a shell of Au lowers the overall cluster surface energy, the higher cohesive energy of Pd
(Ecoh, Au = 3.81 vs. Ecoh, Pd = 3.89 eV/atom [203] – maximising the number of stronger
(Pd-Pd) bonds, by locating Pd in the core – and the smaller atomic radius of Pd (rPd
= 1.375 vs. rAu = 1.440 Å[203]) – a Pd-core minimises bulk elastic strain.
The combination of the structural and ordering effects on the cluster make it difficult
to distinguish each effect individually. For 34-atom clusters, Dh (and Dh-Ih) structures
dominate but a large number of variants means that both effects always co-exist. In
contrast, the dominant magic TO for 38-atom clusters is a single variant. The TO
prevails for the average, DFT-fit and exp-fit potentials at NAu = 14-24 and this
composition region is selected for the study on the chemical ordering effects for a fixed
motif (TO) as shown in Figure 5.8.
At the EP level (Figure 5.8(a)), there is a straightforward correlation between the
chemical ordering and the cluster energy. A greater mixing for the DFT-fit and exp-
fit potentials (as been discussed in Chapter 3) translates to a lower energy. However,
the DFT calculations show several crossovers of the energy curves (Figure 5.8(b)),
indicating a complex ordering effect in the clusters. To understand this behaviour,
34- and 38-atom Pd-Au clusters by a Combined EP-DF Method 150
5.3 Results and Discussion
-7.0
-6.0
-5.0
-4.0
-3.0
-2.0
-1.0
0.0
14 16 18 20 22 24
∆E
38
Gu
pta
(eV
)
NAu
Average
DFT-fit
exp-fit
(a)
2.68
2.72
2.76
2.80
2.84 Pd-Pd
2.82
2.84
2.86
2.88
2.90
Bond l
ength
(A
ngst
rom
)
Au-Au AverageDFT-fitexp-fit
2.82
2.84
2.86
14 16 18 20 22 24
NAu
Pd-Au
(c)
-5.0
-4.5
-4.0
-3.5
-3.0
-2.5
14 16 18 20 22 24
∆E
38
DF
T (e
V)
NAu
Average
DFT-fit
exp-fit
(b)
(d)
Figure 5.8: Excess energies at (a) the EP and (b) the DFT levels of TO38 clusters fromthe average, DFT-fit and exp-fit potentials. For the DFT calculations, post-analysesof (c) bond length and (d) compositional mixing, σN were performed.
34- and 38-atom Pd-Au clusters by a Combined EP-DF Method 151
5.4 Results and Discussion
analyses of bonding (Figure 5.8(c)) and mixing (Figure 5.8(d)) profiles follows.
All Pd-Pd, Au-Au and Pd-Au bonding of GM for the average potential progress
smoothly with composition (Figure 5.8(c)), consistent with the smooth progression in
the DFT excess energy. Except for Pd-Pd bonds, the exp-fit potential also shows a
smooth transition in bonding (and also the excess energy). In contrast, there are clear
dip and peak at NAu = 20 and 22 observed for the DFT-fit potential. Interestingly, the
Pd18Au20 cluster is stabilised (low energy) with the opposite effect to that of Pd16Au22.
At NAu = 20, a maximum number of heteronuclear Pd-Au bonds is achieved when
all (111) centroid sites are occupied by Au atoms and the cluster is slightly distorted.
For TO, there are more (111) sites compared with (100) and a high number of heteronu-
clear interactions reflects the lowest σN for this composition, as shown in Figure 5.8(d).
Meanwhile, Pd-Pd bonds are only present in the core, resulting in a dip in the Pd-Pd
curve. On the other hand, TO clusters of NAu = 22 have a core consisting of two Au
atoms, due to the tendency for a mixed ordering for the DFT-fit potential. This or-
dering prevents TO from distorting but core occupation by Au atoms is unfavourable,
as shown by the peak of DFT excess energy (Figure 5.8(b)) for the DFT-fit potential.
The average potential generally leads to the incomplete core-shell configuration,
having Au atoms occupying the low-coordinate surface sites (centroids of the (111)
hexagonal facets). The DFT-fit and exp-fit potentials also lead to the incomplete
core-shell configurations but display a higher degree of surface mixing (consistent with
the other analyses). These differences can be seen in Figure 5.8(d), for which the
more mixed clusters (of the DFT-fit and exp-fit potentials) have the lower σN . For
NAu = 24, there is the similar preference for the average and DFT-fit potentials (Oh
symmetry) results in overlap of the curves.
34- and 38-atom Pd-Au clusters by a Combined EP-DF Method 152
5.4 Chapter Conclusions
5.4 Chapter Conclusions
In the EP searches, Dh, Dh-Ih, fcc-hcp, pIh-M(DT), pIh-db and distorted pIh are found
as the minima (global and local) of 34-atom clusters. Less variation of the structure
is seen in 38-atom clusters in which the magic cluster of TO dominates. Other motifs
identified are the Oh-Ih, pIh-M-pc5, Dh, Dh-Ih and pIh6.
Between different structural motifs, the energy gaps are very close (at the EP level)
and this is manifested in a complex crossover at the DFT level. Some qualitative
agreement between the EP and DFT predictions is seen, in which Dh (NAu = 16-21)
and TO (NAu ≤ 18) prevail as the most stable motifs for 34- and 38-atom clusters,
respectively. Moreover, for 38-atom clusters, the pIh6 motif is disfavoured for both
levels of calculation. There is, however, a disagreement between the EP and DFT
results for the Au-rich region of both sizes. For 34-atoms, the DFT calculations show a
preference of the fcc-hcp motif (pIh at the EP level), while 38-atom pIh-M-pc5, which
is competitive at the EP level, is disfavoured.
In terms of chemical ordering, the surface mixing (predicted by the DFT-fit and
exp-fit potentials) is favoured for clusters with a limited Au (NAu < 16), while in
the Au-rich region, Au atoms are likely to avoid the higher-coordination surface sites
(as adopted for the average potential). In the medium region (NAu = 16-18), there
are only small energy gaps between the ordering adopted by the average and fitted
potentials, showing a strong composition effect on the cluster’s chemical ordering, as
is the case for the structural motif preferences.
Due to the ordering variation predicted by the different potentials at the EP level,
their accuracy against the DFT calculations also varies, depending on which compo-
sition is being considered. In addition to the composition effects, this study shows
that Pd-Au nanoalloy clusters are also influenced by many other factors: size (34, 38),
motifs (atomic arrangements), symmetry (shell closing effects) and chemical ordering
(core-shell/mixed).
34- and 38-atom Pd-Au clusters by a Combined EP-DF Method 153
Chapter 6
34- and 38-atom Pd-Pt Clusters bya Combined Empirical Potential –Density Functional Theory Method
This chapter will discuss combined EP-DF calculations on 34-atom (Subsection 6.3.1)
and 38-atom (6.3.2) Pd-Pt for all cluster compositions. The focus of the discussion is
stabilities and structural of the GM and effects of the chemical ordering (6.3.3).
6.1 Introduction
Most research of Pd-Pt catalysts is centred on two main areas of fuels: diesel and fuel
cells. In diesel fuel, the main problem is the undesirable aromatic hydrocarbons [764]
which reduce the fuel quality [765]. Furthermore, aromatic hydrocarbons are environ-
mentally undesirable due to their carcinogenic nature [766] and emitted particulate
matter [767, 768] in exhaust gases. For all of these reasons, there is an urgency to
reduce the amount of aromatic hydrocarbons by using Pt as a hydrogenation catalyst.
However, due to economic factors, cheaper alternatives such as Pd are proposed [146].
Diesel fuel is also often contaminated by sulphur, which is known to poison Pt
catalysts, even at the low concentrations [767]. Several methods have been suggested,
where alloying Pd and Pt reported to increase sulphur tolerance in the catalytic re-
duction of aromatics in the diesel feed [769]. Moreover, promising results have been
published for test reactions of several different aromatics: orthoxylene [770], diben-
34- and 38-atom Pd-Pt Clusters by a Combined EP-DF Method 154
incomplete truncated octahedron (“TO”), mixed decahedral-close-packed motifs with
a double tetrahedral core (“Dh-cp(DT)”), mixed decahedral-close-packed motifs with
a single tetrahedron core (“Dh-cp(T)”), anti-Mackay-polyicosahedral (“pIh-aM”), in-
complete Mackay-icosahedron with a double tetrahedral component (“pIhM(DT)”), in-
complete polyicosahedra with 6 interpenetrating Ih13 units (“pIh6”) and low-symmetry
polyicosahedra (“pIh(LS)”).
A comparison of the structure and energetics between GM from calculations with
the average and DFT-fit potentials is shown in Figure 6.2. Structurally, GM progres-
sion along the composition is almost identical, with only minor difference at NPd = 21,
for which an anti-Mackay-polyicosahedral (pIh-aM) is found for the DFT-fit potential,
compared with an incomplete TO for the average. The preference for Dh-cp(DT), as
the signature of 34-atom Pd-Pt clusters [254] for the NPd = 19-25 region, are repeated
for both potentials. On the other hand, there is a clear preference for Dh in the Pt-
rich region (NPd ≤ 18), while for the Pd-rich region (NPd ≥ 26), there is a complex
progression involving TO, Dh, pIh-M(DT), pIh6, Dh-Ih and pIh(LS) structures.
Although there is a variation in the structural motif, the excess energy curve at
the EP level (Figure 6.2(a)) is smooth, indicating very close energy gaps. For both
potentials, the most stable cluster is observed for the composition (13,21) but with
different motifs: TO (average) and pIh-aM (DFT-fit).
Excess energies at the DFT level are plotted in Figure 6.2(b). There is a quali-
34- and 38-atom Pd-Pt Clusters by a Combined EP-DF Method 157
6.3 Results and Discussion
Figure 6.1: Structural motifs found in the EP searches of 34-atom Pd-Pt clusters. (Pdand Pt atoms are denoted by grey and blue colours, respectively, here and in subsequentfigures.)
tative agreement between the EP and DFT results for the preferences of Dh (in the
Pt-rich) and Dh-cp(DT) (for NPd = 19-25). The prevalence of the Dh-cp(DT) motif
in the medium to Pd-rich compositions of 34-atom Pd-Pt clusters is consistent with
the previous study [254]. For the Pd-rich composition region, many structural mo-
tifs are competitive at the EP level but the DFT calculations suggest pIh6, pIh-aM
and Dh-cp(T) structures are strongly disfavoured over Dh, TO (NPd = 21,26) and
pIh-M(DT) (NPd = 28).
The energy gap between the average and DFT-fit potentials is very small (at
the EP level) and, upon DFT re-optimisation, it becomes smaller. However, there
is a significant gap in the NPd = 9-18 region. The structures from the average po-
tential are energetically more stable than those of the DFT-fit for NPd = 9-13, 18
but a reverse order is observed for NPd = 14-17. It is very interesting that all GM
34- and 38-atom Pd-Pt Clusters by a Combined EP-DF Method 158
6.3 Results and Discussion
-6.0
-5.0
-4.0
-3.0
-2.0
-1.0
0.0
0 5 10 15 20 25 30
∆E
34
Gu
pta
(eV
)
NPd
(a)average
fitted
-2.0
-1.5
-1.0
-0.5
0.0
0.5
0 5 10 15 20 25 30
∆E
34
DF
T (e
V)
NPd
(b)Average
fitted
Figure 6.2: Excess energies of 34-atom Pd-Pt clusters from the average and DFT-fitpotentials at the (a) EP and (b) DFT levels.
34- and 38-atom Pd-Pt Clusters by a Combined EP-DF Method 159
6.3 Results and Discussion
found for this composition region are of the Dh motif but a detailed examination of
the structures (Figure 6.3) explains the occurrence of the crossover. The DFT data
show the destabilisation of Dh2 compared with Dh1 and Dh3. For the NPd = 9-16
composition range, DFT prefers Dh1 over Dh2, which is predicted partially by the
average (NPd = 9-13) and DFT-fit (NPd = 14-16) potentials, resulting in the energy
crossover between potentials at NPd = 13-14. Meanwhile, another crossover at NPd =
17-18 is caused by the prevalence of the other variant, Dh3, which is predicted by the
DFT-fit (at NPd = 17) and average (at NPd = 18) potentials, respectively.
Another variant, Dh4, is observed for both potentials for NPd = 0-5. This variant
has fewer (100) facets for overgrown layers, as two of the internal atoms are left exposed
(marked with purple colour in Figure 6.3). An overgrown atom on a (100) site is less
coordinated than that on (111) and this seems to be a preferred site for Pd, as all are
occupied one-by-one until all five are filled. The subsequent addition of another Pd
(NPd = 6), eventually destabilises this motif at the DFT level – an indication of the
Pd preference for the lowest coordinated sites on the surface of Pd-Pt clusters.
6.3.2 38-atom Pd-Pt Clusters
Less variation of the GM structural motif is observed for 38-atom clusters, for which
only Dh (NPd = 5-14), pIh-M-pc5 (NPd = 5-30) and the dominant TO (Pt-rich, medium
and Pd-rich compositions) prevail. The comparison of structures and energies of GM
for the average and DFT-fit potentials are shown in Figure 6.4, in which mostly
Figure 6.3: Dh variants of global minima observed for PdPt-34 clusters.
34- and 38-atom Pd-Pt Clusters by a Combined EP-DF Method 160
6.3 Results and Discussion
the same motifs are adopted, with the exception for NPd = 5-8; Dh prevails for the
DFT-fit potential, instead of TO (the average).
The most stable composition (i.e., minimum energy) is (14,24), for both potentials,
for which the TO motif with the Oh symmetry is adopted. The remarkable stabilisation
is shown by steep dips in the excess energy curves for both EP (Figure 6.4(a)) and DFT
(Figure 6.4(b)) levels and this can be classified as a magic composition for the bimetallic
TO. Similar stabilisation is also observed for Pd-Au (see Chapter 5). The other magic
composition for TO, (6,32), which shows a distinct stability for Pd-Au (see Figure 5.7),
could not be identified, as the GM is a non-TO structure. Small dips of the EP curves
at composition (6,32), however, are due to the magic composition of the other motif:
pIh-M-pc5 with the C5v symmetry.
Apart from the sharp peaks at the composition (14,24), the excess energy curves
for the EP in Figure 6.4(a) are very smooth as a function of cluster composition. It is
possible to relate this to the fact that only three motifs are observed as GM but there is
no significant disruption, even when structural transitions occur: TO to Dh (Pt-rich),
Dh to TO (medium), TO to pIh-M-pc5 (Pd-rich) and pIh-M-pc5 to TO (Pd-rich). This
observation is not unexpected, however, as the energy gap between different structural
motifs in the small clusters are normally very close.
In addition to the qualitative agreement for the most stable cluster at the composi-
tion (14,24), the DFT curves in Figure 6.4(b) agree on the strong preference of TO over
a very wide composition region. However, pIh-M-pc5 and Dh are disfavoured in the
Pd-rich (NPd = 11-12) region, while in the Pt-rich region, Dh is relatively competitive
against TO.
There should be no argument about the stability/instability of TO and pIh-M-pc5,
as these motifs are found as the single variant. Dh however, is different, where several
variants of GM are found, as illustrated in Figure 6.5. At the EP level, all of these
variants are almost degenerate but, the DFT calculations reveal that Dh4 is less pre-
34- and 38-atom Pd-Pt Clusters by a Combined EP-DF Method 161
6.3 Results and Discussion
Figure 6.4: Excess energies of 38-atom Pd-Pt clusters from the average and DFT-fitpotentials at the (a) EP and (b) DFT levels. Each symbol denotes different motifs:Dh (triangle), TO (square) and pIh-M-pc5 (circle).
34- and 38-atom Pd-Pt Clusters by a Combined EP-DF Method 162
6.3 Results and Discussion
ferred than Dh1, Dh2 and Dh3 variants. The Dh4 structure that is found as the GM
for NPd = 12-13, lacks the edges atom (on top of the (100) sites) compared with the
other Dh variants. These edge locations are the least coordinated sites and are shown
to be the preferred sites for Pd, as also observed for 34-atom clusters.
6.3.3 Chemical Ordering Effects
38-atoms is the ideal size to investigate the chemical ordering effects in Pd-Pt clusters,
as there is less variation of GM. However, to concentrate fully on this effect, it is best
to have a fixed motif. For this purpose, the Dh motif is omitted, as it comprises sev-
eral variants. Analyses on the single variant TO (Pt-rich and medium compositions)
and pIh-M-pc5 are shown in Figure 6.6, comparing excess energies, compositional mix-
ing degrees, σN and bonding profiles (bond lengths) for the average and DFT-fit
potentials.
For NPd = 15-17, the difference between the two potentials is notable for the excess
energy. It also can be seen that there is a consistent and significant gap in σN . The
lower σN (for the average potential) represents more mixing in the cluster and has a
greater stability at the DFT level. The surface mixing enhancement is also present for
the composition NPd = 4 (TOaverage < TODFT-fit). It is important to note that all TO
adopt core-shell chemical ordering, hence the higher/lower σN values are only due to
the surface mixing/segregation.
For the NPd = 20-28 region, the fluctuations in σN do not reflect the excess energy,
Figure 6.5: Dh variants of global minima observed for PdPt-38 clusters.
34- and 38-atom Pd-Pt Clusters by a Combined EP-DF Method 163
6.3 Results and Discussion
-0.40
0.00
0.40
∆E
38
DF
T (e
V)
TO
-0.15
-0.12
-0.09
σN
2.79
2.79
2.80
Pd-P
d
2.78
2.79
2.79
Pt-
Pt
2.74
2.76
2.78
2 4
Pd
-Pt
-2.40
-1.80
-1.20
TO
-0.16
-0.14
-0.12
2.74
2.76
2.78
2.79
2.82
2.85
2.74
2.76
2.78
16 18 20 22 24 26 28
NAu
averagefitted
-0.60
0.00
0.60
pIh-M-pc5
-0.25
-0.20
-0.15
2.76
2.78
2.80
2.72
2.76
2.80
2.75
2.76
2.77
30 32 34
Figure 6.6: Excess energies, compositional mixing degrees, σN and bond lengths (Pd-Pd, Pt-Pt and Pd-Pt, in Å) of TO and pIh-M-pc5 motifs from the average and DFT-fit potentials.
34- and 38-atom Pd-Pt Clusters by a Combined EP-DF Method 164
6.4 Chapter Conclusions
as the TO configurations from the DFT-fit potential are consistently lower in energy
than those of the average. The gap, however, is small and can be linked to the bonding
in clusters – shorter heteronuclear Pd-Pt bonds. Meanwhile, the pIh-M-pc5 motifs show
the similar ordering for both potentials, as evidenced by the overlapped σN . Small gap
of excess energy, however, could be associated to the shorter (i.e., stronger) Pt-Pt
bonds for the DFT-fit potential.
As the average potential generally prefers more mixed ordering (as also been seen
previously in Chapter 3), the observed variations give a strong indication for a depen-
dency of the chemical ordering on the motif and the composition of a cluster. Compared
with Pd-Au, the stabilisation of Pd-Pt cluster is mostly contributed by maximising Pt-
Pt bonds (Pt-Pt > Pd-Pt > Pd-Pd), which can be seen from the cohesive energies of
the dimer in Table 6.1.
6.4 Chapter Conclusions
There are many factors which determine the stability of clusters, especially for small
sizes. Distinct results are seen between 34- and 38-atom clusters, with more variation
in the structures for 34-atom clusters. Meanwhile, TO is dominant for 38-atom clusters
due to its magic size. For both sizes, the GM motif is strongly influenced by the cluster
composition. However, there are very small energy gaps between several different
structural motifs. While core-shell ordering is generally preferred, composition effects
lead to a variation in the surface ordering, i.e., high surface-mixed (Pt-rich clusters)
vs. surface-segregated (Pd-rich clusters).
Table 6.1: Cohesive energies (in eV) of the Pd-Pd, Pt-Pt and Pd-Pt dimers.
34- and 38-atom Pd-Pt Clusters by a Combined EP-DF Method 165
6.4 Chapter Conclusions
The remarkable stability of the TO for the composition (14,24) is associated with
the shell closing effect, in which the cluster is stabilised by very high point group
symmetry (Oh). For the pIh-M-pc5 motif, similar effects are seen for the composition
(6,32) (C5v symmetry).
At the EP level, only a small difference is seen between calculations with the aver-
age and DFT-fit potentials and they are in a qualitatively good agreement with the
DFT predictions. However, some discrepancies are observed: several Dh variants are
almost energetically degenerate at the EP level but, at the DFT level, the structure
with Pd on the edges (lower coordination sites) is more favourable.
34- and 38-atom Pd-Pt Clusters by a Combined EP-DF Method 166
Chapter 7
Benchmarking the Gupta EmpiricalPotentials for Bimetallic Clustersagainst Density FunctionalCalculations
This chapter provides reliability check of the Gupta EP for Pd-Au (7.3), Pd-Pt (7.4)
and Ni-Al (7.5) based on the study of TO clusters at fixed compositions (32,6) and
(6,32). The discussion will mainly focus on the variation between different EPs (the
average, fitted and weighted – parameter sets I–III) and the performance of these
potentials against the DFT predictions. Brief discussion will also be presented for the
other bimetallic nanoalloys: Pt-Au (7.6.1), Cu-Pd (7.6.2), Cu-Au (7.6.3) and Cu-Pt
(7.6.4).
7.1 Introduction
The main challenge in studies of the nanoalloy cluster is the complexity of the PES,
where there are considerably more minima compared with the pure clusters due to
the existence of homotops. Finding the GM is a formidable task, even for clusters
containing only a few atoms. Accurate prediction can be achieved via the DFT method
but this requires very large computational effort. Commonly, only a few selected
structures are explored at the DFT level, leaving the question of whether the “real”
Benchmarking the Gupta Empirical Potentials 167
7.2 Computational Details
GM is included [116].
A more feasible strategy in finding the GM is global optimisation using EP mod-
els. The method, however, does not take into account specific electronic effects such
as Jahn-Teller distortions, which are important in predicting the behaviour of a small
cluster. Moreover, results sometimes vary between different empirical methods, quanti-
tatively and qualitatively [827]. However, by using the EP, there is a significant saving
of cost and time. Acceptable and meaningful predictions can be achieved, for example,
through verification against experimental results or calculation at a higher level theory
(e.g., CI) [828].
In order to study a complete conformation space of the PES and/or involving large
systems, computational resources become an issue and a combined EP-DF method is
one of the alternatives. The EP calculations are used to build a structural bank of
possible structures, containing several different structural families, which can be the
starting point for the first principles calculations. It is also possible to re-parameterise
the potentials, based on the DFT calculations, to bridge the gap of accuracy between
methods [116].
7.2 Computational Details
The EP and DFT calculations were carried out on 38-atom clusters of the two opposite
compositions, (6,32) (B-rich) and (32,6) (A-rich), to include any possible compositional
effects. Instead of exploring a variation in the structural motif, verification checks were
carried out on TO of the three high symmetry homotops with different chemical order-
ing, as shown in Figure 7.1. These selections have been used by West et al. [352], to
give variation of Oh symmetry core-shell (“core”), C3v symmetry surface segregation
(“hex”) and D3d symmetry surface-mixing (“D3d”). These high symmetry configura-
tions are feasible for the DFT calculations, for which the computing cost is significantly
reduced.
Benchmarking the Gupta Empirical Potentials 168
7.2 Computational Details
Figure 7.1: TO motif with the three different high symmetry arrangements and theirreverse compositions.
Three main systems studied in this thesis: Pd-Au, Pd-Pt, Ni-Al (see Chapter 3–
6), were further explored with this scheme. In addition, calculations were extended
to some other bimetallics formed from transition metals of groups 10 and 11: Pt-Au,
Cu-Pd, Cu-Au and Cu-Pt. Pt-Au was chosen to complete the binary series involving
Pd, Pt and Au metals, whilst several studies have been reported involving Cu-based
(combined with each of Pd, Pt and Au) systems (see reviews in Refs. [116] and [600]).
Some physical properties of the elements involved are listed in Table 1.1, while the
cluster motifs were previously described in Chapter 4.
Combined EP-DF calculations were carried out for all systems. At the EP level,
each homotop was optimised and the excess energy, ∆EGuptaN , was calculated using
the average and the weighted Gupta potentials – parameter sets I–III. For Pd-Au,
Pd-Pt and Ni-Al binary systems, comparisons were also made against fitted potentials
– the DFT-fit and/or exp-fit. At the DFT level, geometry optimisation and energy
(∆EDFTN ) calculation were performed with the NWChem package [621] with the two
XC functionals: PW91 [571] and PBE [572]. For each of the DFT runs, geometry
optimisations were performed using double-ζ (DZ) basis sets followed by triple-ζ-plus-
Benchmarking the Gupta Empirical Potentials 169
7.3 Pd-Au
polarisation (TZVP) single point calculations.
For the Pd-Au (Section 7.3), Pd-Pt (7.4) and Ni-Al (7.5) sections, the discussion
will begin with the mapping (structural and energies) of potential sets I–III against the
average and fitted potentials. These were done by performing 500 extended BCGA
runs for 34- and 38-atom clusters, for all compositions (see Chapter 2).
7.3 Pd-Au
7.3.1 The Average, DFT-fit and Exp-fit vs the Weighted (Pa-rameter Sets I–III) Potentials
34-atom Clusters
Based on the work in Chapter 4, the parameter sets I and II give excess energies and
GM structures that are comparable with those of the average potential. On the other
hand, more variation (structural and energies) is seen for the parameter set III and,
for the high weighting, the DFT-fit and exp-fit potentials are reproduced. Hence,
only the parameter set III is considered for this section. Structures and energetics of
the GM for 34-atom clusters, calculated with the parameter set III (for wa = 0.5 and
0.7-0.9) and the fitted potentials (DFT-fit and exp-fit) are shown in Figure 7.2(a).
GM structures for the DFT-fit potential are similar to those for the parameter set III
with wa = 0.8 and 0.9, in which Dh (including Dh-Ih) dominate in the Pd-rich region,
while competition of several pIh motifs (pIh-db, pIh-M(DT), pIh6, distorted pIh) is
observed in the Au-rich region. GM structures of the exp-fit potential, however, do
not match any of the weightings (wa) of the set III.
Energetically, the DFT-fit curve lies between those of the parameter set III for
wa = 0.7 and 0.8. For the exp-fit potential, the plot overlaps with that for wa =
0.8, especially for the mid-range compositions. The excess energy curves indicate the
preference of more mixing for the DFT-fit and exp-fit potentials, as compared with
the average. This highly exothermic mixing is similar to the energy curves obtained
Benchmarking the Gupta Empirical Potentials 170
7.3 Pd-Au
Figure 7.2: Structural motifs (square maps) and excess energy variation (curves) of(a) 34- and (b) 38-atom Pd-Au global minima found for the DFT-fit and exp-fitpotentials compared with the parameter set III (wa = 0.5, 0.7-0.9) potential.
Benchmarking the Gupta Empirical Potentials 171
7.3 Pd-Au
for 34-atom Pd-Pt clusters, with the parameters weighted toward the strongest (Pt-Pt)
homonuclear interactions [256, 345].
38-atom Clusters
Less variation is observed for 38-atom (as compared with 34-atom) clusters, for which
only TO, pIh-M-pc5, Dh and Oh-Ih are observed as GM, as shown in Figure 7.2(b).
Consistent with the 34-atom results, the structural motifs are similar for the DFT-
fit and set III (wa = 0.7-0.9) parameters: TO for all compositions except NAu =
29-33 (pIh-M-pc5). Meanwhile, the exp-fit potential gives a distinct variation; along
with the dominant TO, other structures from the exp-fit potential calculations are
Dh [(4,34) to (1,37)], pIh-M-pc5 [(13,25) and (12,26)] and Oh-Ih [(30,8)]. As reported
earlier [345], the structures derived from both fitted potentials tend to maximise the
number of Pd-Au bonds; hence, they tend to form incomplete icosahedra or pIh.
Energetically, the DFT-fit potential plot for 38-atom Pd-Au clusters is consistent
with that for 34 atoms; it is located between weights wa = 0.7 and 0.8 for the parameter
set III. On the other hand, the excess energy plot for the exp-fit dips down below
wa = 0.8 and at some points (for very rich Au compositions) the GM of this potential
are more stable than the extreme parameters of set III (wa = 0.9). The composition
(18,20) shows the lowest excess energy for the DFT-fit and exp-fit potentials, for
which the GM is TO but a distorted structure towards Oh-Ih, similar to the parameter
set III (wa = 0.8 and 0.9). It should be noted that the mixed Oh-Ih motif is only
found for composition (30,8) for the exp-fit potential, while the TO distorted towards
Oh-Ih structure is found for the medium compositions.
Several straight line regions (w = 0.7-0.8) are evident from the plotted excess ener-
gies that are not found for the 34-atom clusters. The first straight line region is from the
pure-Pd composition (38,0) to composition (26,12), after which more gradual changes
of excess energy correspond to the formation of new Au-Au bonds on the surface of the
cluster, as shown in Figure 7.3(a). The next straight line region commences at compo-
Benchmarking the Gupta Empirical Potentials 172
7.3 Pd-Au
sition (14,24) (Figure 7.3(b)), after which point Au atoms start to occupy the centroids
of the (111) facets on the cluster surfaces. The transition from 12 to 13 Au atoms and
from 24 to 25 Au atoms specifically shows how Au prefers (100) sites, leaving Pd on
(111) facets, consistent with findings of the DFT calculations [829]. This behaviour,
which is also observed for Au55, Au98, Au79 and Au92, is promoted because of the
stronger Pd-Au bonds compared with either Au-Au or Pd-Pd bonds [830]. Subsequent
transitions with large jumps of energy for compositions (6,32) to (5,33) correspond to
Au atoms starting to occupy the inner cluster core, as shown in Figure 7.3(c). For wa
= 0.7-0.9 and the DFT-fit potential, an almost identical transition occurs as a result
of the structure changing from a pIh with seven interior Pd atoms into a TO with six
interior Pd atoms (Figure 7.3(d)).
Comparing results of the parameter set III and the fitted (DFT-fit and exp-
fit) potentials generates some interesting conclusions that can be associated with the
Gupta potential parameters (Table 2.3 and Appendix A). The pure (Au-Au and Pd-
Pd) parameters only differ slightly for the p, q and r0 parameters but more significantly
for the A and ξ parameters, as shown in Table 7.1 (also discussed in Chapter 4).
Figure 7.3: Configurational changes in PdAu-38: (a) NAu = 12 to 13, (b) NAu = 24 to25, (c) NAu = 32 to 33 and (d) structural change from NAu = 31 to 32.
Benchmarking the Gupta Empirical Potentials 173
7.3 Pd-Au
Table 7.1: The A and ξ parameters of the average and fitted potentials.
Parameter set III with wa > 0.5 gives a stronger Pd-Au bonding, as shown by
the lower excess energies for both cluster sizes. This weighting scheme results in less
Pd-Au repulsion (APdAu → APd) and more Pd-Au attraction (ξPdAu → ξAu) in the
clusters. This is because APd(0.1746) < AAu(0.2061) and ξPd(1.7180) < ξAu(1.7900);
so that as wa → 1.0, the A parameter (repulsion) is reduced and the ξ parameter
(attraction) increases. The DFT-fit potential has more comparable results to those
of the parameter set III and can be linked to ADFT-fit(0.1843) ≈ Awa=0.7(0.1841) and
ξDFT-fit(1.7867) ≈ ξwa=0.9(1.7828).
These correlations are consistent with the overall results for 34- and 38-atom PdAu
clusters, that show the DFT-fit potential giving similar results for the energies and
structures to those for wa = 0.8. The exp-fit potential also gives similar excess energies
to the results for wa = 0.8, though the shape of the curve is a little different – but
the structures and homotops are often quite different to the results of those of the
parameter set III. This is not surprising, since, as noted previously [345], the exp-fit
potential is qualitatively very different. In particular it should be noted that for the
exp-fit potential: APd-Au > APd-Pd and AAu-Au; ξPd-Au > ξPd-Pd and ξAu-Au.
7.3.2 The DFT Calculations of Pd32Au6 and Pd6Au32
Results of the DFT calculations for the compositions (32,6) and (6,32) of Pd-Au clusters
are shown in Table 7.2 in comparison with the EP (the average, DFT-fit and exp-
fit). The stability order between the core, hex and D3d homotops is then compared
with that given by the calculations with parameter sets I–III of the weighted potentials
Benchmarking the Gupta Empirical Potentials 174
7.3 Pd-Au
(Figure 7.4). Generally, the DFT calculations using the PW91 and PBE functionals
are consistent, especially where the energy gap between homotops is concerned. While
composition (6,32) exhibits a similar order of homotop stability (core < D3d << hex)
for all parameters (average, DFT-fit and exp-fit), only the average potential agrees
with the DFT calculations (hex < D3d << core) for composition (32,6).
Results for composition (32,6) indicate that Pd-Au clusters with the surface-seg-
regated core-shell (hex) configuration are favoured. The surface-mixed D3d homotop,
which is preferred by the DFT-fit and exp-fit potentials, is disfavoured by 1.2 eV
(PW91 and PBE). Clusters avoid having a core of Au atoms as this leads to ener-
getically very unstable chemical ordering. In addition, data for composition (6,32)
demonstrates the strongest stability of the core homotop, providing further evidence
for the preference of PdcoreAushell.
At the EP level (Figure 7.4), the parameter sets I and II give the same order of
homotop stability as that predicted by the DFT, except for ws = 1.0 (set II). Fur-
thermore, the excess energy is very close to that of the the average (w, ws, wa = 0.5)
potential. These circumstances could be associated with the small gap between the
Gupta potential parameters for Pd and Au, with ratios of 1.18 (A), 1.04 (ξ), 0.94
(p) and 1.08 (q). Hence, weighting all parameters (set I) or just A and ξ (set II)
in a symmetrical fashion does not have a significant effect on the bimetallic interac-
tions. Moreover, the data in Chapter 4 show that these parameter sets adopt the same
chemical ordering as seen for the average potential.
Meanwhile, the anti-symmetric weighting of A and ξ in the parameter set III ex-
hibits a large deviation of the excess energy and changes in the order of homotop
stability (high wa for composition (32,6) and low wa for composition (6,32)). The
deviation in homotop order means the weighting is unacceptable for reproducing the
DFT predictions. Only wa = 0.4-0.6 give the same homotop rank as the DFT for both
compositions (32,6) and (6,32). In addition, ∆Ehex−D3dof the DFT calculations is
Benchmarking the Gupta Empirical Potentials 175
7.3 Pd-Au
Table 7.2: Excess energies (in eV) of the three TO homotops of (32,6) and (6,32) Pd-Au clusters at the DFT and EP (the average, DFT-fit and exp-fit potentials) levels.(* Denotes potentials for which the homotop ordering is not consistent with the DFTcalculations.)
Figure 7.4: Stability ordering of the three TO homotops of (32,6) and (6,32) Pd-Auclusters for the EP calculations with the weighted potential of the parameter sets I(top), II (middle) and III (bottom). Consistent ordering compared with the DFTcalculations is denoted with the filled point symbols.
Benchmarking the Gupta Empirical Potentials 176
7.4 Pd-Pt
more than double that of ∆ED3d−core, which is replicated with the average potential.
It is worth mentioning that the DFT-fit and exp-fit potentials are revealed earlier
(Subsection 7.3.1) to be similar to those for wa = 0.8, which disagrees with the DFT
predictions for composition (32,6).
7.4 Pd-Pt
7.4.1 The Average and DFT-fit vs the Weighted (ParameterSets I–III) Potentials
Comparison between excess energies and structural motifs of 34- and 38-atom GM for
the average (w = 0.5) and DFT-fit potentials are shown in Figure 7.5. The figure
also shows results of the calculation for the parameter set I (w = 0.4 and 0.6). As the
DFT-fit potential is very close to the average (for structures and energetics), it is
best to compare only with those of the set I weightings, as the set III give excessive
deviations. As the differences of the p and q parameters of the Gupta potential between
Pd and Pt is insignificant (pPt/pPd = 0.98 and qPt/qPd = 1.07), the parameter set II
potentials are not very different from those of the parameter set I (see Chapter 4).
In contrast to Pd-Au, the difference in the Gupta potential parameters between
Pd-Pd and Pt-Pt are large for A and ξ (APt/APd = 1.7 and ξPt/ξPd = 1.6). Hence,
there is a clear variation in GM (energetics and structures), moving from w = 0.4 to
0.6. For both sizes, the DFT-fit potential results are closely matched to that of the
average. Excess energies and structural data, however, exhibit that the DFT-fit set
is slightly biased towards w = 0.4 (i.e., towards Pd-Pd). Chemical ordering analysis
for both sizes revealed the prevalence of core-shell segregation but Pd and Pt atoms are
mixed on the surface. The DFT-fit potential shows a slightly lower degree of surface
mixing (i.e., a lower percentage of Pd-Pt bonds) compared with the average.
The average and DFT-fit potentials predicted Dh as the preferred motif for the Pt-
rich compositions of 34-atom clusters as shown in Figure 7.5(a). Some competition from
Benchmarking the Gupta Empirical Potentials 177
7.4 Pd-Pt
Figure 7.5: Structural motifs (square maps) and excess energy variation (curves) of(a) 34- and (b) 38-atom Pd-Pt global minima found for the average and DFT-fitpotentials and compared with the parameter set I (w = 0.4-0.6) potential.
Benchmarking the Gupta Empirical Potentials 178
7.4 Pd-Pt
the other motifs is seen for the Pd-rich compositions but the Dh-cp(DT) is prevalent
for NPd = 18-25. For 38-atom clusters in Figure 7.5(b), TO dominates for the whole
composition, with some interruption from Dh (NPd = 7-14) and pIh-M-pc5 (NPd =
29-35). The results for 34- and 38-atom clusters further reinforce the small difference
between the potentials, as also seen for the clusters of 1:1 compositions (size 1-100
atoms) and 98-atoms (Chapter 3).
7.4.2 The DFT Calculations of Pd6Pt32 and Pd32Pt6
Results of the DFT calculations on 38-atom Pd-Pt clusters, focussing on the TO ho-
motops of the compositions (6,32) and (32,6) are presented in Table 7.3, along with
the EP predictions (the average and DFT-fit potentials). It can be seen that calcula-
tions with the PW91 and PBE functionals give consistent values. At the EP level, the
average and DFT-fit give the same order of homotop stability to those of the DFT,
for both compositions. These results, show that the average and DFT-fit potentials
are fairly acceptable in reproducing the DFT predictions.
For composition (6,32), the order is hex ≤ D3d < core, with very close separation
between surface segregation (hex) and surface mixing (D3d). It can thus be seen that
calculations with the average potential are slightly closer to that of the DFT, as
compared with the DFT-fit potential. On the other hand, putting all six Pd atoms
in the core sites (of the composition (6,32)) gives positive excess energies, signifying
relatively unstable clusters and indicating Pt preference for core sites of TO. The
further proof of this is the observation for the composition (32,6), in which core is the
most stable homotop (i.e., PtcorePdshell) and the order is core < D3d << hex.
The comparison of the homotop order between the DFT and the parameter sets
I–III calculations are shown in Figure 7.6. As mentioned in Chapter 4, parameter set
I ≃ parameter set II, for energetics and structures. After taking into consideration
both compositions (6,32) and (32,6), the DFT predictions are reproduced for w, ws =
0.4-0.7 of the parameter sets I–III and only for wa = 0.5-0.6 of the parameter set III
Benchmarking the Gupta Empirical Potentials 179
7.4 Pd-Pt
Table 7.3: Excess energies (in eV) of the three TO homotops of (32,6) and (6,32) Pd-Ptclusters at the DFT and EP (the average and DFT-fit potentials) levels.
Figure 7.6: Stability ordering of the three TO homotops of (32,6) and (6,32) Pd-Ptclusters for the EP calculations with the weighted potential of the parameter sets I(top), II (middle) and III (bottom). Consistent ordering compared with the DFTcalculations is denoted with the filled point symbols.
Benchmarking the Gupta Empirical Potentials 180
7.5 Ni-Al
(with w = ws = wa = 0.5 giving the average potential).
For the composition (6,32), DFT predicts that hex ≤ D3d and this resemblance
can only be seen for w, ws = 0.6-0.7 (of the parameter sets I and II). Meanwhile,
the positive excess energy (i.e., unstable) for the core homotop is only seen for w,
ws ≤ 0.6. The instability of this homotop is not found for wa = 0.6 of the parameter
set III. Meanwhile, for the composition (32,6), the energy gap of D3d–hex is three
times greater than that of the core–D3d, which is the case for w, ws ≥ 0.6. Combining
all of this information, w, ws = 0.5-0.6 of the parameter sets I and II is the most
accurate, indicating that the average potential is possibly the best in representing
Pd-Pt homonuclear interaction. Biasing towards w, ws = 0.6 could give better results
but possibly on a quantitatively smaller-scale and the opposite is observed for the
DFT-fit potential (slightly biased towards w, ws = 0.4).
7.5 Ni-Al
7.5.1 The Exp-fit vs the Weighted (Parameter Sets I–III) Po-tentials
Unlike Pd-Au and Pd-Pt, for which the average potential has been used in most of
the EP studies of the Johnston research group (see reviews in Refs. [116] and [600]),
studies of Ni-Al clusters [599, 619] have been carried out using the exp-fit potential
of Cleri and Rosato [377]. Along with Cu-Au, the potential is derived by fitting the
potential to the experimental data (cohesive energy and mixing enthaphy) of the bulk
A3B-type alloys with the L12 configuration (basic fcc cube with Ni residing on each of
the faces, leaving Al at each corner).
Compared with the parameter sets I–III, the exp-fit potential is more comparable
to the high weighting end of the set III, as shown in Figure 7.7. For 34-atom clusters
(Figure 7.7(a)), the excess energies curve is in between wa = 0.8-0.9 but overlaps
with wa = 0.9 for the Al-rich compositions. The GM variation is consistent with this
Benchmarking the Gupta Empirical Potentials 181
7.5 Ni-Al
pattern but is closer to wa = 0.8, for which no Dh and pIh structures are found. This
trend is repeated for 38-atom clusters (Figure 7.7(b)) but the GM variation is closer
to wa = 0.9, for which no pIh-M(DT) is adopted for the Ni-rich compositions.
For wa = 0.5 (i.e., average potential), GM variation of 34-atom Ni-Al clusters is
not very different compared with those of the other weightings and the exp-fit po-
tential, although several significant deviations are observed for 38-atom clusters: wide
pIh-M(DT) (Ni-rich) and pIh7 (medium compositions) prevalence and disfavouring of
pIh6 and pIh-db (Al-rich). Furthermore, this set gives relatively very high excess en-
ergies.
Interestingly, the weighting region (wa = 0.8-0.9) that is close to the exp-fit po-
tential is the area (of the structural map) of progression from core-shell to mixed
ordering (see Chapter 4), although there is slight variation of the results between 34-
(core-shellwa=0.8 → mixedwa=0.9) and 38-atom (core-shellwa=0.7 → mixedwa=0.8). Con-
sistently, a variation is also seen for the exp-fit potential: GM34(exp-fit) ≃ GM34(wa=0.8)
and GM38(exp-fit) ≃ GM38(wa=0.9). 34-atom clusters adopt the core-shell configurations
for all compositions (progressing from i-CS(C) (Ni-rich) to i-CS(A) (medium) to the
complete core-shell (Al-rich)), while the mixing ordering is observed for several 38-atom
clusters, especially for the Ni-rich compositions.
7.5.2 The DFT Calculations of Ni32Al6 and Ni6Al32
Results of the DFT calculations for the three studied homotops are shown in Table 7.4,
in comparison with the EP (the average and exp-fit potentials) predictions. The
stability order at the DFT level is then set as a benchmark for the weighted (the
parameter sets I –III) potentials in Figure 7.8. It should be noted that the average
potential has not used in the previous [599, 619] Gupta-based study of Ni-Al clusters but
is included here for comparison, as the other systems (e.g., Pd-Au, Pd-Pt [116]) show
that the scheme (averaging pure potential) is reasonable in describing heteronuclear
interactions in the cluster.
Benchmarking the Gupta Empirical Potentials 182
7.5 Ni-Al
Figure 7.7: Structural motifs (square maps) and excess energy variation (curves) of(a) 34- and (b) 38-atom Ni-Al global minima found for the exp-fit potential and incompared with the parameter set III (wa = 0.5, 0.8-0.9) potential.
Benchmarking the Gupta Empirical Potentials 183
7.6 Ni-Al
Overall, the excess energies of all homotops are very low compared with those of Pd-
Au and Pd-Pt, due to very strong preference for mixed phases in Ni-Al nanoalloys [704,
707–709]. The DFT calculations with the PW91 and PBE functionals are consistent
for both compositions (32,6) and (6,32). For composition (32,6), the order is D3d <
hex ≤ core, which is not predicted by the average potential. There is a distinct
stability of the D3d homotop, signifying a preference for forming mixed bonds (i.e., Ni-
Al compared with Ni-Ni and Al-Al). Furthermore, having smaller Ni (hex) or larger
Al (core) atoms in the core does not cause much difference in the cluster stability
(i.e., close DFT excess energy between hex and core).
Turning now to the composition (6,32), the order is core < D3d << hex and the
stability of the core homotop is linked to a significant size-mismatch, for which the
strain is released by putting the smaller Ni in the cluster core. However, the D3d
homotop is separated by only ∼1 eV (compared with over 3 eV for the D3d–hex gap),
showing a close competition between the mixed and core-shell chemical ordering. This
is not the case for the composition (32,6), in which mixing is clearly preferred (D3d is
4.7 and 4.8 eV more stable than hex and core, respectively).
A comparison between the homotop order at the DFT level and the parameter
sets I–III in Figure 7.8 suggests that the composition (32,6) is crucial for Ni-Al. The
DFT predictions are reproduced only for w = 1.0 (set I) and wa = 0.7-0.9 (set III)
while none are reproduced for the set II. On the other hand, the DFT prediction for
composition (6,32) is seen for all weighted potentials, except for wa = 0.0-0.3 (set III).
For composition (6,32), the DFT calculations show a very close gap between hex
and core (∼ 0.175 eV). Taking this into context, parameter sets I (w = 1.0) and III
(wa = 0.7) can be eliminated, leaving only wa = 0.8-0.9 of the parameter set III.
Coincidentally, this is the range where the results (structural and energies) matched
those of the exp-fit potential (based on the observation of size 34 and 38-atom clusters,
see Subsection 7.5.1).
Benchmarking the Gupta Empirical Potentials 184
7.6 Ni-Al
Table 7.4: Excess energies (in eV) of the three TO homotops of (32,6) and (6,32) Ni-Alclusters at the DFT and EP (the average and exp-fit potentials) levels. (* Denotespotentials for which the homotop ordering is not consistent with the DFT calculations.)
Figure 7.8: Stability ordering of the three TO homotops of (32,6) and (6,32) Ni-Alclusters for the EP calculations with the weighted potential of the parameter sets I(top), II (middle) and III (bottom). Consistent ordering compared with the DFTcalculations is denoted with the filled point symbols.
Benchmarking the Gupta Empirical Potentials 185
7.6 Pt-Au, Cu-Pd, Cu-Au and Cu-Pt
7.6 Pt-Au, Cu-Pd, Cu-Au and Cu-Pt
The simple EP-DF method focussing on the compositions (32,6) and (6,32) is shown
to give some insight into the heteronuclear interactions in binary nanoalloy clusters
of Pd-Au, Pd-Pt and Ni-Al. Therefore, it was decided to extend the investigation to
the other systems – Pt-Au, Cu-Pd, Cu-Au and Cu-Pt. Table 7.5 illustrates how the
weighting of the parameter sets I–III is accomplished in each system.
Meanwhile, Table 7.6 provides the ratios of the A, ξ, p and q parameters for the
homonuclear interaction of the Gupta potential in these extended systems. (Small
differences between parameters are represented by values → 1.0, where a value of ’1’
indicates that a perfect matching is attained.) For all studied binary systems, the p
ratios are very close (i.e., no effect in parameterisation). Pt-Au is a similar case to Pd-
Pt, as the difference in q (as well as p) is small, so the A and ξ parameters contribute
most to the weighting parameters. Cu-based potentials are more complicated, as the
q component cannot be neglected. However, it remains to be seen how much this will
affect the potential. For Cu-Pd and Cu-Au, there is similar resemblance to Pd-Au
clusters.
A summary of the DFT and EP results for the TO homotops of how of compositions
(32,6) and (6,32) is presented in Table 7.7, while detailed results for each weighting
are shown in Figure 7.9(a-d), highlighting the weighting for which the DFT results
are reproduced. The magnitudes of excess energy vary between calculations with the
PW91 and PBE functionals (Table 7.7), although the homotop orders are consistent.
7.6.1 Pt-Au
For composition (32,6), the stability order is D3d < hex << core with ∆EPW91D3d−hex = 0.4
/ ∆EPBED3d−hex = 0.3 and ∆EPW91
hex−core = 5.3 / ∆EPBEhex−core = 5.4, which is not reproduced
by the average potential but is observed for high weightings of the parameter sets
I–III. Concerning a very strong destabilisation of core homotop (∆Ehex−core > 10
Benchmarking the Gupta Empirical Potentials 186
7.6 Pt-Au, Cu-Pd, Cu-Au and Cu-Pt
Table 7.5: Summary of the weighting representation for Pt-Au and Cu-basedsystems in the parameter sets I, II and III.
Parameter setweighting
w (set I), ws (set II) and wa (set III)
w, ws, wa = 0.0 −→ w, ws, wa = 1.0
I (P=A, ξ, p, q)
PPt-Au = PAu-Au PPt-Au = PPt-Pt
PCu-Pd = PCu-Cu PCu-Pd = PPd-Pd
PCu-Au = PCu-Cu PCu-Pd = PAu-Au
PCu-Pt = PCu-Cu PCu-Pd = PPt-Pt
II (P=A, ξ)
PPt-Au = PAu-Au PPt-Au = PPt-Pt
PCu-Pd = PCu-Cu PCu-Pd = PPd-Pd
PCu-Au = PCu-Cu PCu-Pd = PAu-Au
PCu-Pt = PCu-Cu PCu-Pd = PPt-Pt
III
APt-Au = APt-Pt APt-Au = AAu-Au
ξPt-Au = ξAu-Au ξPt-Au = ξPt-Pt
ACu-Pd = APd-Pd ACu-Pd = ACu-Cu
ξCu-Pd = ξCu-Cu ξCu-Pd = ξPd-Pd
ACu-Au = AAu-Au ACu-Au = ACu-Cu
ξCu-Au = ξCu-Cu ξCu-Au = ξAu-Au
ACu-Pt = APt-Pt ACu-Pt = ACu-Cu
ξCu-Pt = ξCu-Cu ξCu-Pt = ξPt-Pt
Table 7.6: Ratio of the Gupta potential parameters for the extended studies(for each binary system, A is the first element and B is the second element).
∆ED3d−hex), the closest to give this is w, ws = 0.8 of the parameter sets I and II.
Meanwhile, the DFT calculations for the core << D3d < hex (∆EPW91/PBEcore−D3d
= 2.6 and
∆EPW91D3d−hex = 0.6 / ∆EPBE
D3d−hex = 0.7) are reproduced qualitatively by wider parameter
weights for composition (6,32). Hence, the composition (32,6) becomes a determinant,
for which the heteronuclear interaction between Pt-Au should be biased (w, ws = 0.8)
towards Pt-Pt.
7.6.2 Cu-Pd
The average potential does not reproduce the DFT homotop order of Cu-Pd for both
compositions. For composition (32,6), high weightings of the parameter sets I–III gives
a similar homotop rank to that calculated by the DFT: D3d < core < hex. The gaps
between homotops are: ∆EPW91/PBED3d−core = 1.2 and ∆EPW91/PBE
core−hex = 0.8, leaving only w, ws
= 0.9/1.0 (sets I and II) and wa = 0.6 (set III). Meanwhile, composition (6,32) shows
that core and D3d homotops are very competitive and the overall order is core ≤ D3d
< hex (∆EPW91core−D3d
= 0.02 / ∆EPBEcore−D3d
= 0.03 and ∆EPW91/PBED3d−hex = 0.3). Similarly
to the composition (32,6), this stability order is reproduced for high weightings of
the parameter sets I–III (except for w = 0.9-1.0 of set I). It is apparent from the
observation of composition (32,6) that surface mixing between Cu and Pd (D3d) is
preferred. For the other composition, (6,32), core prevails but, D3d is separated by
only a very small gap.
7.6.3 Cu-Au
Of the Cu-based series studied in this work, Cu-Au is the only binary for which the
average potential agrees with the DFT predictions on the stability of the three homo-
tops (i.e., reproduced the DFT predictions) for both compositions of the TO clusters.
In addition, a qualitative agreement is also observed for lower weightings for the pa-
rameter sets I–II (i.e., biased towards Cu, w = 0.2-0.5 of set I and ws = 0.3-0.6 of
set II). On the other hand, the plots for the parameter set III show that the homotop
Benchmarking the Gupta Empirical Potentials 188
7.6 Pt-Au, Cu-Pd, Cu-Au and Cu-Pt
Table 7.7: Excess energies (in eV) of the three TO homotops for Pt-Au, Cu-Pd, Cu-Au and Cu-Pt clusters from the DFT and EP (the average and weighted potential)calculations for compositions (32,6) and (6,32). For the parameter sets I–III of theweighted potentials, only weightings that reproduced the homotop stability rank inthe DFT predictions is shown. (* Denotes potential where the homotop order is notconsistent with the DFT calculations.)
homotopsDF EP
PW91 PBE average parameter sets I–III
Pt32Au6
D3d -0.354 -0.653 0.549∗
0.8-1.0 (I), 0.8-1.0 (II) and0.7 (III)
hex 0.056 -0.346 -1.769∗
core 5.405 5.076 3.483∗
Pt6Au32
core -0.166 -3.730 -3.9460.4-1.0 (I), 0.4-1.0 (II) and
Figure 7.9: Stability ordering of the three TO homotops of (32,6) and (6,32) (a) Pt-Au,(b) Cu-Pd, (c) Cu-Au and (d) Cu-Pt clusters for the EP calculations with the weightedpotential of parameter sets I (top), II (middle) and III (bottom). Consistent orderingcompared with the DFT calculations is denoted with the filled point symbols.
Benchmarking the Gupta Empirical Potentials 191
7.7 Chapter Conclusions
rank is only reproduced for wa = 0.5 (i.e., the average potential).
For composition (32,6), hex is preferred but by only 0.3/0.4 eV (with the PW91
/ PBE, respectively) over D3d. It is, however, very clear that the larger Au (rAu =
1.44 vs. rCu = 1.28 Å) is unlikely to reside in the core sites (∆EPW91/PBED3d−core = 4.4).
Meanwhile, ∆ED3d−core ≈ 10x ∆Ehex−D3d, which is reproduced when the weighting
→ 0.5 (i.e., the average potential). On the other hand, the homotop order for the
composition (6,32) is core < D3d < hex, where equivalent gaps between homotops
(∆EPW91/PBEcore−D3d
= 0.9 and ∆EPW91D3d−hex = 1.0 / ∆EPBE
D3d−hex = 1.1) are observed and this
behaviour is reproduced for weighting → 1.0. Hence, no concrete conclusion can be
made for the parameter weight to give the most accurate predictions.
7.6.4 Cu-Pt
Cu-Pt is another system where the average potential is unfavourable in defining the
bimetallic interactions, similar to Cu-Pd. Combination of observations for the com-
positions (32,6) and (6,32) shows the need for biased parameters towards Pt-Pt (w =
0.9-1.0, ws = 0.8-1.0 and wa = 0.7, for sets I–III, respectively). For both compositions,
the mixed ordering (D3d) prevails, with D3d << core < hex for the composition (32,6)
and D3d < core << hex for the composition (6,32).
7.7 Chapter Conclusions
Parameterisation of the Gupta potential (parameter set III (wa = 0.7-0.9)) is seen
to reproduce the DFT-fit potential for Pd-Au clusters but the exp-fit parameters
show quite different results for structures and homotops. The surface mixing (of the
core-shell clusters) predicted by these potentials is, however, disfavoured at the DFT
level for cluster compositions (32,6) and (6,32). The closest agreement to the DFT
calculations is given by the average potential.
For Pd-Pt clusters, the average is also the potential that gives the most accurate
Benchmarking the Gupta Empirical Potentials 192
7.7 Chapter Conclusions
predictions against the DFT calculations, as compared with the DFT-fit or weighted
(parameter sets I–III) potentials. Clusters are predicted to adopt a slightly more
surface-mixed core-shell ordering, although there is a strong competition from the
surface-segregated ordering. Meanwhile, having the potential towards w, ws = 0.6
(i.e., slightly biased to to the Pt-Pt) gives only a slightly improvement to the calculation
results.
Mixed ordering is preferred for Ni-Al. This ordering is clearly preferred for the
composition (32,6) and is competitive for the composition (6,32), although the latter
composition shows a slight prevalence of the core-shell. These predictions are closely
matched for wa = 0.8-0.9 of the parameter set III, which is the region where the exp-fit
is located.
Biased parameterisation (towards the stronger Pt-Pt, ws = 0.8 of parameter set
III) emulates the DFT prediction for PtcoreAushell clusters, with a close competition
between surface-mixed and surface-segregated. For Cu-Pd and Cu-Pt clusters, mixed
ordering is adopted at the DFT level, which can be reproduced at the EP level by highly
weighted (towards the stronger bonds Pd-Pd and Pt-Pt, respectively) potentials. On
the other hand, a prevalence of the core-shell configuration for Cu-Au clusters is best
represented by the average potential.
This work shows the ability to benchmark the existing (average and fitted) po-
tentials against the parameters sets I–III for several bimetallic systems. The EP-DF
method gives acceptable estimation of the potential accuracy and indicates that sim-
ple parameterisation reproduces the DFT predictions. However, unlike polyicosahedral
motifs, the stabilisation due to atomic size effects in TO is not very obvious. Further-
more, with only two-layers available, it is not possible for the cluster to adopt inter-
mediate core-shell/mixed (i.e., onion-like) configurations, as has been shown in larger
sizes of Pd-Pt clusters.
The observations in this chapter only focussed on the three homotops (core, hex and
Benchmarking the Gupta Empirical Potentials 193
7.7 Chapter Conclusions
D3d) of a fixed TO, excluding many other effects, e.g., size, structure and composition
(as only two compositions are considered). Hence, it seems to be a good procedure
for the EP calculations to involve several parameters, with a simplified combination
of methods, in the hope of achieving accurate predictions and a better coverage of all
possible solutions.
Benchmarking the Gupta Empirical Potentials 194
Chapter 8
Pd-Au Clusters Supported onMgO(100)
This chapter will discuss 30- and 40-atom Pd-Au clusters supported on MgO(100) by a
combined EP-DF approach. In Section 8.2, details of the EP (Subsection 8.2.1), metal-
oxide interactions (8.2.2), potential parameterisations (8.2.3) and the DFT calculations
(8.2.4) will be described, as a slightly different method was applied from that used for
the free clusters (in the previous chapters). In the results and discussion (Section 8.4),
the focus will be on the variations and the crossovers of structures for the three different
studied compositions (Pd-rich, medium and Au-rich). Optimisation at the DFT (8.3.3)
and EP (8.3.4) levels will also be discussed, in addition to the EPs checks (8.3.1 - 8.3.2).
8.1 Introduction
Nanoclusters of the transition metals have been shown to adopt a variety of structures
(e.g., fcc, icosahedra and decahedra), due to their energetic competition [66, 358, 371,
620, 630, 831]. This means that cluster structures and properties can be tailored for
different applications. Recently, supported clusters have attracted many researchers
as the combination of metal-metal and metal-substrate [630, 832] interactions give
more ways of optimising the catalysts. The use of amorphous carbon, for example,
produces a wide range of differently shaped gold and palladium particles but selection
of magnesium oxide (MgO) stabilises fcc-based motifs [480, 833, 834].
Pd-Au Clusters Supported on MgO(100) 195
8.1 Introduction
In addition to being a support, an oxide substrate is widely believed to act as an
active medium in catalytic chemical reactions. Different supports have been reported
to show optimum catalytic performance for Pd-Au, especially in the selective oxidation
of styrene (Al2O3 [835]), toluene (carbon [836]), glycerol [735] and benzyl alcohol [731]
(TiO2). In the direct synthesis of hydrogen peroxide, equivalent results between carbon
and SiO2 supports have been observed [837].
Much modelling of bimetallic clusters [345, 620, 622], however, focuses on free par-
ticles, due to computational limitations. However, the inclusion of the support would
be of great importance in gaining a more accurate representation of the real heteroge-
nous catalytic system. For this reason, nanocluster interactions with the surfaces of
several types of support have been reported: Al2O3, Carbon, MgO, SiO2, Fe2O3, TiO2
and CeO2 [460, 461, 838]. Metal oxides such as MgO particularly are interesting for
their strong electrostatic interactions [839]. Furthermore, MgO surfaces with minimum
structural defects are relatively easy to prepare [840] and act as a perfect background
image for the electron microscopy [833]. Computationally, it is possible for the MgO
to be modelled as a flexible slab [841, 842].
As regards the the MgO surface, single atom calculations have shown a preference
for adhesion of metal on oxygen sites (over surface Mg and hollow sites) for Pd [832,
843, 844] and Au [477, 487, 845]. This preference is supported by findings from grazing
incidence X-Ray diffraction [846] and electron microscopy [847]. This behaviour is
associated with the “metal-on-top” stabilisation [487], van der Waals interactions [848]
and also charge transfers [849]. In contrast, few studies [850, 851] have suggested
otherwise – a preference for the Mg site.
On interaction with the MgO support, compact structures of Pd clusters are favour-
ed, starting at very small sizes [852, 853], as the best configuration to reduce the
surface energy [854, 855]. Au, however, shows a more complex combination of metal-
substrate interactions with additional effects of stickiness, directionality and electronic
Pd-Au Clusters Supported on MgO(100) 196
8.2 Introduction
shell closure [487, 856, 857]. Interestingly, both metals show very good epitaxy of
Au(100) [833, 858] or Pd(100) [846, 859] on MgO(100) that can be linked with small
lattice mismatch (4.08 Å(Au), 3.89 Å(Pd) and 4.20 Å(MgO) [860]). A small lattice
expansion (<3% for Au [833, 841] and Pd [854, 859, 861, 862]) has been observed
and by the size of 400 atoms, relaxation occurs [854, 859] via misfit transfer from the
interfacial area into the clusters [480] and structural transformation [478].
Even at room temperature, good cube-on-cube epitaxy between Pd cluster and
MgO substrate has been reported [859], indicating a strong metal-support interaction.
As a result, different magic numbers arise compared to the free particles [853]. The
DFT approach has reproduced this behaviour [484, 852, 863] and, in combination with
the EP global optimisation [485, 717, 864], small to large clusters can be studied.
Understanding epitaxial phenomena would be beneficial as it is suggested to enhance
catalytic activity through a spillover mechanism [865] in CO oxidation [866–870], NO
dissociation [871] and the CO+NO reaction [872, 873]. Other proposed explanations
for the enhancement by the MgO support are: strain effects [874], better dispersion
[724], introduction of new active sites [875, 876] and electronic effects [834].
An extensive database of energetics, structures and segregation has been developed
[345, 620, 622] for small Pd-Au clusters (<100 atoms) as free particles. Combined
with the previous findings for pure Au and Pd clusters on the MgO(100) surface [484,
485, 630, 831, 864, 877–879], the aim is to extend the study on the behaviour of Pd-
Au nanoalloy clusters when supported on MgO(100), by observing the structural and
chemical ordering of 30- and 40-atom clusters. Compositional variation is also taken
into account by selecting three compositions that represent Pd-rich, medium and Au-
rich clusters.
Pd-Au Clusters Supported on MgO(100) 197
8.2 Computational Details
8.2 Computational Details
Study of the interaction between Pd-Au nanoalloy clusters and the MgO substrate
involved two steps combining computational methods [485, 717, 864]: global optimi-
sation using the EP and DFT calculations. At the EP level, the Gupta potential was
used to model inter-atomic interactions within the cluster [377, 616]. On the other
hand, metal-oxide interactions were used from parameters that have been fitted to the
ab initio calculations [478, 880].
The effect of the Monte Carlo elemental move on small free clusters was investi-
gated for composition (19,19) of 38-atom Pd-Au. This size was selected as it is well
understood, based on many previous studies [43, 203, 205, 255, 269, 270, 306, 345, 352,
374, 376, 620, 627, 881]. The effects of different EPs (average, DFT-fit and exp-fit)
were also investigated using clusters of this composition.
For optimisation of the DFT and parameterisation of the EP, the calculations were
carried out on 38-atom clusters of the compositions (6,32) and (32,6), as described in
Chapter 7 (see Figure 7.1). The stability rank of “core”, “hex” and “D3d” homotops
was used as an indicator for qualitative checks.
8.2.1 Empirical Potential Global Optimisation
At the EP level, calculations were performed with the BHMC [518] algorithm. For
each cluster size (and composition), 10-15 unseeded searches of 200,000 elementary
moves each were performed, where the searches were started from random positions
in a cubic box just on top of the MgO slab. In addition, seeded searches were also
performed, in which the simulation was started with pre-defined coordinates, mostly
from the previous calculations either from the same system, other bimetallics or pure
clusters [613]. Moreover, the Monte Carlo steps were performed at several temperatures
(0-3,500 K).
One of the most crucial aspects in the global optimisation exploration is obtaining
Pd-Au Clusters Supported on MgO(100) 198
8.2 Computational Details
an accurate empirical or semi-empirical potential. If experimental data are available,
then it is possible to fit the potential but new materials (for example bimetallic clus-
ters) preclude these and, as an alternative, the fitting of the potential is carried out
to the data from higher level calculations (e.g., DFT). For this reason, a considerable
amount of modification of the Gupta potential has been undertaken and three alterna-
tive sets of heteronuclear Pd-Au parameters have been considered in previous studies:
the “average”, “DFT-fit” and “exp-fit” potentials [345, 620, 622] (see Table 2.3(a)).
For this chapter, these three potentials were used and compared with another potential,
namely the “new” potential: the potential that has been derived by further fitting of
the existing potential [68, 205, 255, 377]. The differences between potentials is shown
in Table 8.1.
For the new potential, the weaknesses of the previous potentials have been taken
into account, including metal stickiness, fcc-hcp energy gap and surface energy. (1)
Stickiness is the tendency of clusters to maintain the non-crystalline structures upon
Table 8.1: Gupta potential parameters for elemental Pd and Au; and bimetallic Pd-Au.
parameters average DFT-fit exp-fit newPd parameters
where i = each metal atom, Zi = nearest neighbours (within 125% of the bulk distance)
and χ = 2π/a (where a is the oxygen-oxygen distance). A total of 27 cjkl parameters
for each metal is listed on the internet [883], taken from Pd/MgO [478] and Au/MgO
[613] works. For the small clusters (N≤30), the potential gives fairly good results in
comparison with the DFT calculations [484, 485].
8.2.3 Potential Parameterisations
Parameterisation of the Gupta potential (Chapter 2) has been carried out for the new
potential. Weighting parameters have been investigated in the range 0 ≤ w ≤ 1, in
steps ∆w = 0.1. A single parameterisation (A, ξ, p or q) is investigated by employing
Equation 2.31 (parameter set I), while combined parameterisations were applied using
Equation 2.32 (parameter set II: A+ξ or p+q) or Equation 2.33 (parameter set III: A-ξ
or p-q). The latter provides varied parameters in the opposite sense (“anti-symmetric”),
allowing regions of Pd-Au parameter space to be explored which have: (i) low A and
high ξ values (or p and q), corresponding to strong Pd-Au bonding and (ii) high A and
low ξ (or p and q), corresponding to weak Pd-Au bonding.
8.2.4 Density Functional Theory Calculations
After generating a database from the EP searches, the lowest-energy and several higher
energy (i.e., low-lying) local minimum clusters for each size and composition were then
re-optimised by the DFT calculations using the QE [586] PWscf DFT code, with the
PBE XC functional [572] and the ultrasoft pseudopotentials.
Pd-Au Clusters Supported on MgO(100) 201
8.3 Optimisation of the Calculations
The MgO(100) substrate was modelled by a two-layer slab of 36 Mg and 36 O
atoms (6×6 cell) in each layer, fixed in the lattice positions of the MgO rock-salt bulk
structure (with an experimental MgO distance of 2.104 Å). The lattice spacing in the
perpendicular (100) direction is about 13 Å [485]. Different slab sizes have been used
[630] to allow sufficient distance between periodic images but, in this work, the 6×6
cell is necessary for the particular studied sizes. The MgO substrate was fixed at the
experimental distances of Mg and O atoms, as it has been shown [630] that a non-
rigid substrate plays a qualitatively very minor role in the PBE calculations. However,
selected clusters were also studied by allowing the substrate to relax together with the
clusters, with differences in energy of less than 0.1 eV, and no changes of ordering were
observed (although there was an increase in the time taken to reach convergence).
8.3 Optimisation of the Calculations
8.3.1 Structural Variations of Pd19Au19: Effect of the MonteCarlo Elemental Move
The TO motif is the most stable isomer at the DFT level for 38-atom clusters [255, 345,
622] and, during the BHMC searches, the shake or dynamics move is the best Monte
Carlo elementary move for finding this motif. Runs with these moves give a minimum
that deviates only 0.03 and 0.10 eV (for shake and dynamics, respectively at 0 K) rela-
tive to the GM, indicating exploration near to the ground state. These deviations are
increased with increasing temperature (0.09 and 0.16 eV at 2,000 K), for which other
close-competitive motifs (Dh and incomplete Mackay-polyicosahedral (inc-Ih-Mackay))
start to be found. However, only one or two non-TO motifs are found at a certain tem-
perature, suggesting that these elemental moves do not provide a variation of structure.
For the same reason, bonds, ball, shell or high energy atoms elemental moves are also
insignificant. This leaves the exchange move, which is identified to provide a wider
energy variation, i.e., variation in structural motifs. The searches with the exchange
Pd-Au Clusters Supported on MgO(100) 202
8.3 Optimisation of the Calculations
move also give unfavourable fcc-hcp structures (in addition to the other competitive
structures: TO, Dh and inc-Ih-Mackay), which is not found with the other elementary
moves.
8.3.2 Structural Variations of Pd19Au19: Effect of the Choiceof Empirical Potential
Different EPs are likely to give variation in the structural motif and ordering pref-
erences; however, their accuracy can be benchmarked, for example against the DFT
calculations. Figure 8.1 shows how the selected motifs of 38-atom Pd-Au clusters from
the EP (the average, DFT-fit and exp-fit potentials) runs fare at the DFT level.
High accuracy is said to be achieved when the total energy at the EP level matches with
the DFT calculations. The observation, however, reveals that none of these potentials
is clear-cut to be the best, explaining why previous works [345, 620] do not focus on
a single potential. This is a known issue with semi-empirical calculations and closing
the gap between the semi-empirical and first principle methods is always a challenge.
Figure 8.1: Energetic profiles of various structural motifs for 38-atom Pd-Au calculatedwith the average, DFT-fit and exp-fit potentials.
Pd-Au Clusters Supported on MgO(100) 203
8.3 Optimisation of the Calculations
8.3.3 Optimisation of the DFT Calculations (Code, Function-als, Convergence)
Comparison of the discrepancy of outcomes between the QE and NWChem codes is
meaningful for validation. Our earlier works with the NWChem code mostly used
the PW91 exchange and correlation functionals [569–571] but this functional is not
available for the Pd in QE. Hence, the PBE functional (which are available for both
DFT codes) is selected for a comparison between two codes, as shown in Figure 8.2.
Also shown in the figure are calculations with the other functionals (which are available
for both Pd and Au): PBE, PZ81 LDA [628], PBEd and PZ81d [586].
All calculations lead to similar homotop rank (based on energy) for both composi-
tions. For the composition (6,32), there is high agreement of the gap of hex > D3d >
core. The different codes (plane wave QE vs. orbital based NWChem), however, exhibit
a slight variation for the composition (32,6) results (core > D3d > hex); nevertheless,
the energy ordering is consistent.
In addition to the qualitative agreement, there are only small variations (i.e., quan-
Figure 8.2: Effect of different GGA on the DFT calculations of (6,32) and (32,6) Pd-Auclusters (in the bracket, N=NWChem and P=Plane wave QE).
Pd-Au Clusters Supported on MgO(100) 204
8.3 Optimisation of the Calculations
titative agreement) between all possible combinations of functionals for the QE calcula-
tions. It can therefore be assumed that there are acceptable effects of the differences in
the code and functional being used, hence, comparison with the previous calculations
[255, 345] is reasonably valid.
Results for the CPU time optimisation (for QE) on compositions (32,6) and (6,32)
are shown in Figure 8.3. The first y-axis (bar graph) shows CPU time (for a completed
calculation) as a measurement for the degree of convergence and the second y-axis (line
graph) shows total energy, reflecting accuracy of the calculations. This calculation is
based on 16 processors on the BlueBEAR computer at the University of Birmingham,
UK [884]. Generally, the calculation is said to be accurate when the error for the energy
differences <5 meV/atom or < 1% [586].
Careful consideration is needed for the kinetic energy cut-off and cell size selection,
as these parameters not only affect the convergence but also the accuracy of the cal-
culation. The kinetic energy cut-off parameter of 40 Ry (544 eV) is the lowest on the
plateau, reflecting the minimum of acceptable cut-offs before the energy rises dramat-
ically (lower cut-off, non-accurate), while equilibrium lattice constant for the cell size
parameter is seen at 30 Bohr (15.9 Å) for the tetragonal Bravais-lattice. Meanwhile,
the degauss parameter does not severely affect the accuracy as it is normally set at
a very low value and, up to degauss = 0.004 (ordinary Gaussian spreading), the level
of tolerance, is acceptable. On the other hand, convergence threshold and mixing-β
parameters only affect the convergence of calculation. For convergence threshold, a
parameter between 1.00 × 10⁻⁶ and 1.00 × 10⁻⁸ is best for the optimum CPU time.
Meanwhile, mixing-β parameter (upon enforcing the plain (Broyden) mixing mode)
seems insignificant for the free 38-atom clusters of a fixed motif (TO). However, these
optimisation runs only take into account the high symmetry homotops which do not in-
dicate how crucial this factor in a more complicated system (i.e., system dependence),
especially when the support is in action and the cluster has a low symmetry structure
Pd-Au Clusters Supported on MgO(100) 205
8.3 Optimisation of the Calculations
Figure 8.3: Effect of parameter choice on the convergence times and the total energiesof the DFT calculations.
Pd-Au Clusters Supported on MgO(100) 206
8.3 Optimisation of the Calculations
for which very low mixing-β is to be applied.
For the checks on supported clusters, the model of 20-atom Pd10Au10 on MgO is
used. The EP calculations show that the cluster with the fcc motif is the GM. Hence,
this motif with (100)PdAu-(100)MgO interface is then re-optimised with QE, using
the PBE and PZ81 (available for involved all elements: Pd, Au, Mg, O) functionals
to see the effects of different functionals. The results show that calculation with the
PZ81 functional gives lower total energy (-0.146 eV/atom) than that of the PBE.
Nevertheless, structural observations suggest there is consistency in both calculations.
8.3.4 Parameterisation of the “New” Potential
A new potential (see Section 8.2) is then included, in the hope for better EP ex-
ploration. Figure 8.4 shows a comparison between three previous potentials used for
Pd-Au cluster calculations [345, 620] and the new potential which is derived in two
ways: arithmetic (a) and geometric (b) means for the Pd-Au heteronuclear interactions
(bimetallic potential). In terms of homotop order, all potentials show agreement with
the DFT predictions for the composition (6,32); hex > D3d > core. However, for the
composition (32,6), only the average and new(a) potentials reproduce the DFT re-
sults (core > D3d > hex). The other potentials predict the D3d motif as the most stable
configuration. Looking at the energy levels, these two potentials give a close result but
the magnitude is rather far from those given by the DFT calculations. However, as far
as the homotop rank is concerned, these potentials are in very good agreement with
the DFT calculations.
Based on the DFT calculations, the new(a) potential proves to be the most consis-
tent in both tested regimes, hence it is parameterised based on the method described
in Chapter 2. The results of these parameter sets are compared with the DFT pre-
dictions, as shown in Figure 8.5. Figure 8.5(a) shows parameterisation of the A and
ξ parameters and Figure 8.5(b) of the p and q parameters. There are four ways of
parameterising: (i) first row represents only A (or p), (ii) second row – only ξ (or q),
Pd-Au Clusters Supported on MgO(100) 207
8.3 Optimisation of the Calculations
Figure 8.4: Comparison of the DFT excess energies of (6,32) and (32,6) Pd-Au clustersof the three studied homotops for several empirical potentials.
(iii) third row – combine A and ξ (p and q), which will be referred as A+ξ or (p+q) and
(iv) fourth row – reverse combine A and ξ (p and q), which will be referred as A-ξ or
(p-q). (i) to (iii) were weighted by using the Eq. 2.32 and (iv) is weighted by Eq. 2.33.
Meanwhile, Figure 8.5(c) is also a result from a parameterisation with Eq. 2.32 but it
involved all the parameters (A, ξ, p and q). In all styles, the non-parameterised value
is kept at the average, in which w = 0.5 is basically the new(a) potential. To simplify
the effects of the parameterisation, Table 8.2 shows the average of the gap between
each parameter set and the DFT results. Only matching homotop ranks (EP vs. DFT:
core > D3d > hex for Au32Pd6 and hex > D3d > core for Au32Pd6) are shown, with
lower numbers indicating a better correlation.
Previous work [620] shows that for Pd-Au clusters, the A and ξ parameters are
the main contributors to affect structure and energy. Hence, parameterisation of these
components significantly affects the total energy but at the expense of crossover be-
tween the three studied motifs. This could be seen for all parameter sets involving A
Pd-Au Clusters Supported on MgO(100) 208
8.3 Optimisation of the Calculations
(a) (b)
(c)
Figure 8.5: Parameterisation of the Gupta potential, with the effect of changing (solidlines are the DFT calculations): (a) parameters A and/or ξ, (b) parameters p and/orq; (c) all the parameters (A, ξ, p and q).
Pd-Au Clusters Supported on MgO(100) 209
8.4 Optimisation of the Calculations
Table 8.2: Average magnitude of difference between the EP (with the weighted poten-tial) and DFT calculations. (Whenever the EP and DFT is unmatched, no value willbe shown.)
The energy gaps between structures are small and there is complex crossover for
clusters in the 30-40 atoms region. The co-existence of several structural motifs is
highly possible, which corroborates many experimental observations. Analysis of the
cluster structure also suggests that there is a structural transformation of the clusters,
due to cluster-surface interactions.
This study shows that, similarly to the free clusters, small Pd-Au/MgO is still
dependent on the composition. However, the effects are significantly reduced on in-
creasing size. The findings also indicate that 40-atom clusters already started to adopt
fcc-based bulk-like motifs.
This work gives good confidence in the new potential, which has been proved as
accurate in predicting the behaviour of pure Pd and Au clusters on MgO substrates. For
the bimetallic Pd-Au, the parameterisation method is seen as adequate in reproducing
the DFT predictions. With this in mind, this potential could be employed in studying
bigger clusters on the MgO substrate, in the hope that the complex mechanism of the
interaction between clusters-support can be better understood.
Pd-Au Clusters Supported on MgO(100) 220
Chapter 9
Concluding Remarks and FutureWork
Study of (Pd-Au)N and (Pd-Pt)N clusters with N ≤ 100 gives results consistent with
experimental observations, in which small clusters adopt polyicosahedral structures and
increasing size leads to the prevalence of Dh in the mid-size region, before bulk-like fcc
structures prevail at larger sizes. In the N ≤ 50 region, there is a strong competition
between several structural motifs (fcc, Dh and pIh), which inspired further investigation
(sizes 34 and 38).
While atomic arrangements were mostly examined by visual methods, the results
are confirmed numerically by the binding energy, EGuptab (for stability) and σ (for
chemical ordering) analyses. Magic character, which is a very interesting feature in
cluster studies, is manifested in relatively distinct stabilities that are consistent with
the second difference in energy, ∆2EGuptab . For both Pd-Au and Pd-Pt clusters of the
N ≤ 100 region, magic sizes are observed at N = 38, 55 and 98, signifying a fcc-like
TO, Mackay icosahedron and LT, respectively.
A more focussed theoretical investigation of 34- and 38-atom clusters was carried
out using the combined EP-DF method. Exploration of the parameter space at the
EP level via parameterisations of the Gupta potential (A, ξ, p or q) in symmetrical
and anti-symmetrical fashion give a very large variation in motifs and ordering. A
structural database of Pd-Au, Pd-Pt and Ni-Al clusters provides evidence that there
is a strong dependence on cluster size, composition and parameter weighting towards
Concluding Remarks and Future Work 221
9.0 Concluding Remarks and Future Work
the structural motifs.
34-atom clusters show a larger variation in the structures of GM compared with the
38-atom clusters, in which the magic size TO is dominant. For 38-atom Ni-Al, how-
ever, core-shell pIh is more favourable due to the significant difference of size between
heteroatomic atoms. Magic character is also valid for specific compositions (i.e., magic
compositions), e.g., compositions (24,10) for mixed decahedral-close-packed motifs with
a double tetrahedral core (Dh-cp(DT)) and (32,6) for five-fold pancake Mackay icosa-
hedra (pIh-M-pc5) and polyicosahedra with six interpenetrating Ih13 units (pIh6).
Variation in the chemical ordering is also seen: segregated (spherical cup, core-shell,
incomplete core-shell), mixed (onion-like, ordered and disordered) and segregated-
mixed intermediate (ball-and-cup). The newly proposed compositional mixing de-
gree, σN , is able to show these variations, regardless of the cluster composition. The
lower surface energy of Au leads to a more favourable PdcoreAushell configuration, while
stronger (cohesive energy) Pd-Pt bonds result in more mixing in the Pd-Pt clusters.
These observations are consistent with the DFT predictions of 34- and 38-atom clusters.
The EP-DF studies show very small energy gaps between several motifs of 34- and
38-atom Pd-Au and Pd-Pt clusters. The DFT calculations generally show overall pref-
erence for Dh34 and TO38, which is mainly reproduced at the EP level. Furthermore,
the EP calculations successfully predict a better preference for the novel Dh-cp(DT)
structure in the medium composition region of 34-atom Pd-Pt clusters. By focussing
on specific compositions, there are some disagreements between EP and DFT predic-
tions, e.g., the EP fails to predict a more stable fcc-hcp structure of Au-rich PdAu-34
clusters. As several motifs are energetically competitive at the EP level, many motifs
prevail as the GM (over a generally stable Dh34 and TO38) as a function of composition
but some of them are totally disfavoured at the DFT level.
The discrepancy in the EP predictions are mostly associated with the type of po-
tential being used. The average potential – i.e., parameters obtained by averaging the
Concluding Remarks and Future Work 222
9.0 Concluding Remarks and Future Work
parameters of elemental semi-empirical Gupta potentials, is reasonably good in giving
results consistent with the DFT calculations. However, there are still some gaps to be
closed and fitting the potential against experimental or DFT calculations (i.e., fitted
potential) is one of the options. The fitted potential is not always better than the
average, as the DFT shows the motifs and ordering of putative GM vary strongly
with size (e.g., magic size) and composition (e.g., shell closing effect).
The effect of composition on the clusters was studied by taking cluster composi-
tions of (32,6) and (6,32) of a fixed TO motif. The DFT results show that the average
potential is slightly more sensitive to variations in chemical ordering, due to the compo-
sition effect, for the Pd-Au, Pd-Pt and Cu-Au clusters. The equal contribution by each
element in heteronuclear interactions (i.e., average potential), however, is unable to
reproduce the DFT predictions for the Ni-Al, Pt-Au, Cu-Pd and Cu-Pt clusters. For
these systems, better results are achieved using parameterised potentials biased to-
wards a relatively more stronger bonding, i.e., Al (Ni-Al), Pt (Pt-Au, Cu-Pt) and Pd
(Cu-Pd), although this observation may not be valid for other sizes and motifs.
On interaction with the MgO substrates, some features of the gas phase clusters of
Pd-Au are retained – core-shell chemical ordering (with Pd enrichment at the cluster-
substrate interface due to stronger Pd-O bonds) and structural crossover on varying
the composition. However, based on the EP-DF calculations, the inclusion of the MgO
support is observed to reverse the stability order of several motifs. Moreover, very good
epitaxy of Pd-MgO leads to structural modification of Pd-rich clusters. By studying
different sizes (30 and 40), some features are observed to reduce for increasing size –
composition effects and epitaxy.
Overall, good agreement is achieved between the EP and DFT calculations for the
studied systems. A similar approach was also applied to Rh-Pd clusters but this is not
included in the thesis. Likewise, the effects of other parameters (i.e., p and q) of the
Gupta potential were also studied, in addition to the A and ξ parameterisation (in this
Concluding Remarks and Future Work 223
9.0 Concluding Remarks and Future Work
thesis). Studies of pure Au and Pd cluster and larger Pd-Au clusters on MgO have
also been initiated.
Concluding Remarks and Future Work 224
Bibliography
[1] A. Zabet-Khosousi and A.-A. Dhirani, Chem. Rev., 2008, 108, 4072.[2] M.-C. Daniel and D. Astruc, Chem. Rev., 2004, 104, 293.[3] S. K. Ghosh and T. Pal, Chem. Rev., 2007, 107, 4797.[4] R. Ghosh Chaudhuri and S. Paria, Chem. Rev., 2012, 112, 2373.[5] A. P. Alivisatos, Science, 1996, 271, 933.[6] M. A. Kastner, Phys. Today, 1993, 46, 24.[7] M. Haruta, CATTECH, 2002, 6, 102.[8] Q. Song and Z. J. Zhang, J. Am. Chem. Soc., 2004, 126, 6164.
[9] G. Salazar-Alvarez, J. Qin, V. Šepelaák, I. Bergmann, M. Vasilakaki, K. N.Trohidou, J. D. Ardisson, W. A. A. Macedo, M. Mikhaylova, M. Muhammed,M. D. Baró and J. Nogués, J. Am. Chem. Soc., 2008, 130, 13234.
[10] E. Schmidt, A. Vargas, T. Mallat and A. Baiker, J. Am. Chem. Soc., 2009, 131,12358.
[11] Z. Wang, T. Ahmad and M. El-Sayed, Surf. Sci., 1997, 380, 302.[12] L. Wu, J. C. Yu, L. Zhang, X. Wang and S. Li, J. Solid State Chem., 2004, 177,
3666.[13] J. Ahmed, S. Sharma, K. V. Ramanujachary, S. E. Lofland and A. K. Ganguli,
J. Colloid Interface Sci., 2009, 336, 814.[14] S. A. El-Safty, J. Colloid Interface Sci., 2008, 319, 477.[15] M. Jitianu and D. V. Goia, J. Colloid Interface Sci., 2007, 309, 78.[16] X. Qu, L. Omar, T. B. H. Le, L. Tetley, K. Bolton, K. W. Chooi, W. Wang and
I. F. Uchegbu, Langmuir, 2008, 24, 9997.[17] Z. Liu, D. Elbert, C.-L. Chien and P. C. Searson, Nano Lett., 2008, 8, 2166.[18] X. Peng, L. Manna, W. Yang, J. Wickham, E. Scher, A. Kadavanich and
A. Alivisatos, Nature, 2000, 404, 59–61.[19] R. Xiao, S. I. Cho, R. Liu and S. B. Lee, J. Am. Chem. Soc., 2007, 129, 4483.[20] G. Cao and D. Liu, Adv. Colloid Interface Sci., 2008, 136, 45.[21] N. Lopez and J. K. Nørskov, J. Am. Chem. Soc., 2002, 124, 11262.[22] R. Narayanan and M. A. El-Sayed, J. Phys. Chem. B, 2004, 108, 5726.[23] C. Burda, X. Chen, R. Narayanan and M. A. El-Sayed, Chem. Rev., 2005, 105,
1025.[24] T. S. Ahmadi, Z. L. Wang, T. C. Green, A. Henglein and M. A. El-Sayed, Science,
1996, 272, 1924.[25] A. Wolf and F. Schüth, Appl. Catal., A, 2002, 226, 1.
Bibliography 225
Bibliography
[26] M. Brust and C. J. Kiely, Colloids Surf., A, 2002, 202, 175.[27] C. R. Henry, Appl. Surf. Sci., 2000, 164, 252.[28] A. Roucoux, J. Schulz and H. Patin, Chem. Rev., 2002, 102, 3757.[29] B. M. Muñoz-Flores, B. I. Kharisov, V. M. Jiménez-Pérez, P. Elizondo Martínez
and S. T. López, Ind. Eng. Chem. Res., 2011, 50, 7705.[30] R. W. Murray, Chem. Rev., 2008, 108, 2688.[31] A. Henglein, Chem. Rev., 1989, 89, 1861.[32] R. L. Johnston, Atomic and Molecular Clusters, Taylor and Francis, London,
2002.[33] J. Jellinek, Theory of Atomic and Molecular Clusters: with a Glimpse at Exper-
iments, Springer, Berlin, 1999.[34] F. Baletto and R. Ferrando, Rev. Mod. Phys., 2005, 77, 371.[35] J. Jortner, Z. Phys. D: At., Mol. Clusters, 1992, 24, 247.[36] R. L. Johnston, Philos. Trans. R. Soc. London, Ser. A, 1998, 356, 211.[37] J. A. Alonso, Chem. Rev., 2000, 100, 637.[38] W. P. Halperin, Rev. Mod. Phys., 1986, 58, 533.[39] D. C. Ralph, C. T. Black and M. Tinkham, Phys. Rev. Lett., 1995, 74, 3241.[40] J. R. Heath, Science, 1995, 270, 1315.[41] G. Papavassiliou, Prog. Solid State Chem., 1979, 12, 185.[42] T. P. Martin, Phys. Rep., 1996, 273, 199.[43] G. Rossi, A. Rapallo, C. Mottet, A. Fortunelli, F. Baletto and R. Ferrando, Phys.
Rev. Lett., 2004, 93, 105503.[44] I. Katakuse, T. Ichihara, Y. Fujita, T. Matsuo, T. Sakurai and H. Matsuda, Int.
J. Mass Spectrom. Ion Processes, 1985, 67, 229.[45] I. Katakuse, T. Ichihara, Y. Fujita, T. Matsuo, T. Sakurai and H. Matsuda, Int.
J. Mass Spectrom. Ion Processes, 1986, 74, 33.[46] W. A. de Heer, Rev. Mod. Phys., 1993, 65, 611.[47] G. Gantefor, M. Gausa, K.-H. Meiwes-Broer and H. O. Lutz, J. Chem. Soc.,
Faraday Trans., 1990, 86, 2483.[48] D. G. Leopold, J. Ho and W. C. Lineberger, J. Chem. Phys., 1987, 86, 1715.[49] A. Lattes, I. Rico, A. de Savignac and A.-Z. Samii, Tetrahedron, 1987, 43, 1725.[50] F. Chen, G.-Q. Xu and T. Hor, Mater. Lett., 2003, 57, 3282.[51] A. Taleb, C. Petit and M. P. Pileni, J. Phys. Chem. B, 1998, 102, 2214.[52] Y. Yamada and A. W. Castleman, J. Chem. Phys., 1992, 97, 4543.[53] B. J. Winter, E. K. Parks and S. J. Riley, J. Chem. Phys., 1991, 94, 8618.[54] J. P. K. Doye and D. J. Wales, New J. Chem., 1998, 22, 733.[55] N. D. Lang and W. Kohn, Phys. Rev. B, 1973, 8, 6010.[56] W. D. Knight, K. Clemenger, W. A. de Heer, W. A. Saunders, M. Y. Chou and
M. L. Cohen, Phys. Rev. Lett., 1984, 52, 2141.[57] W. Ekardt and Z. Penzar, Phys. Rev. B, 1988, 38, 4273.[58] Z. Penzar and W. Ekardt, Z. Phys. D: At., Mol. Clusters, 1990, 17, 69.[59] D. M. P. Mingos, J. Chem. Soc., Dalton Trans., 1996, 5, 561.
Bibliography 226
Bibliography
[60] J. Ascencio, C. Gutiérrez-Wing, M. Espinosa, M. Marín, S. Tehuacanero, C. Zor-rilla and M. José-Yacamán, Surf. Sci., 1998, 396, 349.
[61] C. L. Cleveland, U. Landman, T. G. Schaaff, M. N. Shafigullin, P. W. Stephensand R. L. Whetten, Phys. Rev. Lett., 1997, 79, 1873.
[62] D. Schebarchov and S. C. Hendy, Phys. Rev. B, 2006, 73, 121402.[63] W. Zhang, Q. Ge and L. Wang, J. Chem. Phys., 2003, 118, 5793.[64] V. Kumar and Y. Kawazoe, Phys. Rev. B, 2002, 66, 144413.[65] P. Nava, M. Sierka and R. Ahlrichs, Phys. Chem. Chem. Phys., 2003, 5, 3372.[66] M. José-Yacamán, M. Marín-Almazo and J. Ascencio, J. Mol. Catal. A: Chem.,
2001, 173, 61.[67] H. Grönbeck and W. Andreoni, Chem. Phys., 2000, 262, 1.[68] F. Baletto, R. Ferrando, A. Fortunelli, F. Montalenti and C. Mottet, J. Chem.
Phys., 2002, 116, 3856.[69] E. Aprà and A. Fortunelli, J. Phys. Chem. A, 2003, 107, 2934.[70] A. Fortunelli and A. M. Velasco, THEOCHEM, 1999, 487, 251.[71] O. Echt, K. Sattler and E. Recknagel, Phys. Rev. Lett., 1981, 47, 1121.[72] M. Pellarin, B. Baguenard, J. Vialle, J. Lermé, M. Broyer, J. Miller and A. Perez,
Chem. Phys. Lett., 1994, 217, 349.[73] E. K. Parks, L. Zhu, J. Ho and S. J. Riley, J. Chem. Phys., 1995, 102, 7377.[74] E. K. Parks, B. J. Winter, T. D. Klots and S. J. Riley, J. Chem. Phys., 1992, 96,
8267.[75] E. K. Parks, L. Zhu, J. Ho and S. J. Riley, J. Chem. Phys., 1994, 100, 7206.[76] S. Vajda, S. Wolf, T. Leisner, U. Busolt, L. H. Wöste and D. J. Wales, J. Chem.
Phys., 1997, 107, 3492.[77] F. A. Reuse, S. N. Khanna and S. Bernel, Phys. Rev. B, 1995, 52, R11650.[78] S. M. Foiles, M. I. Baskes and M. S. Daw, Phys. Rev. B, 1986, 33, 7983.[79] J. García-Rodeja, C. Rey, L. J. Gallego and J. A. Alonso, Phys. Rev. B, 1994,
49, 8495.[80] C. Rey, L. J. Gallego, J. García-Rodeja, J. A. Alonso and M. P. Iñiguez, Phys.
Rev. B, 1993, 48, 8253.[81] J. M. Montejano-Carrizales, M. P. Iñiguez, J. A. Alonso and M. J. López, Phys.
Rev. B, 1996, 54, 5961.[82] E. K. Parks, G. C. Nieman, K. P. Kerns and S. J. Riley, J. Chem. Phys., 1998,
108, 3731.[83] M. S. Stave and A. E. DePristo, J. Chem. Phys., 1992, 97, 3386.[84] N. N. Lathiotakis, A. N. Andriotis, M. Menon and J. Connolly, Europhys. Lett.,
1995, 29, 135.[85] N. N. Lathiotakis, A. N. Andriotis, M. Menon and J. Connolly, J. Chem. Phys.,
1996, 104, 992.[86] T. L. Wetzel and A. E. DePristo, J. Chem. Phys., 1996, 105, 572.[87] C. L. Cleveland and U. Landman, J. Chem. Phys., 1991, 94, 7376.[88] A. Aguado and J. M. López, J. Chem. Phys., 2009, 130, 064704.[89] K. E. Schriver, J. L. Persson, E. C. Honea and R. L. Whetten, Phys. Rev. Lett.,
Bibliography 227
Bibliography
1990, 64, 2539.[90] A. K. Starace, C. M. Neal, B. Cao, M. F. Jarrold, A. Aguado and J. M. López,
J. Chem. Phys., 2009, 131, 044307.[91] R. O. Jones, J. Chem. Phys., 1993, 99, 1194.[92] R. Ahlrichs and S. D. Elliott, Phys. Chem. Chem. Phys., 1999, 1, 13.[93] H.-P. Cheng, R. S. Berry and R. L. Whetten, Phys. Rev. B, 1991, 43, 10647.[94] U. Röthlisberger, W. Andreoni and P. Giannozzi, J. Chem. Phys., 1992, 96, 1248.[95] V. Kumar, Phys. Rev. B, 1998, 57, 8827.[96] J. Akola, H. Häkkinen and M. Manninen, Phys. Rev. B, 1998, 58, 3601.[97] F. Duque and A. Mañanes, Eur. Phys. J. D, 1999, 9, 223.[98] B. K. Rao, S. N. Khanna and P. Jena, Phys. Rev. B, 2000, 62, 4666.[99] V. Kumar, S. Bhattacharjee and Y. Kawazoe, Phys. Rev. B, 2000, 61, 8541.
[100] J. Akola and M. Manninen, Phys. Rev. B, 2001, 63, 193410.[101] S. N. Khanna, B. K. Rao and P. Jena, Phys. Rev. B, 2002, 65, 125105.[102] A. Mañanes, F. Duque, F. Méndez, M. J. López and J. A. Alonso, J. Chem.
Phys., 2003, 119, 5128.[103] R. Pushpa, S. Narasimhan and U. Waghmare, J. Chem. Phys., 2004, 121, 5211.[104] F.-C. Chuang, C. Z. Wang and K. H. Ho, Phys. Rev. B, 2006, 73, 125431.[105] L. D. Lloyd, R. L. Johnston, C. Roberts and T. V. Mortimer-Jones,
ChemPhysChem, 2002, 3, 408.[106] J. P. K. Doye, J. Chem. Phys., 2003, 119, 1136.[107] B. K. Rao and P. Jena, J. Chem. Phys., 1999, 111, 1890.[108] R. R. Zope and T. Baruah, Phys. Rev. A, 2001, 64, 053202.[109] M. D. Deshpande, D. G. Kanhere, I. Vasiliev and R. M. Martin, Phys. Rev. B,
2003, 68, 035428.[110] Y. Sun, M. Zhang and R. Fournier, Phys. Rev. B, 2008, 77, 075435.[111] X. G. Gong, D. Y. Sun and X.-Q. Wang, Phys. Rev. B, 2000, 62, 15413.[112] N. Drebov and R. Ahlrichs, J. Chem. Phys., 2010, 132, 164703.[113] A. Aguado and J. M. López, J. Phys. Chem. B, 2006, 110, 14020.[114] G. A. Breaux, C. M. Neal, B. Cao and M. F. Jarrold, Phys. Rev. Lett., 2005, 94,
173401.[115] X. Teng, Q. Wang, P. Liu, W. Han, A. I. Frenkel, Wen, N. Marinkovic, J. C.
Hanson and J. A. Rodriguez, J. Am. Chem. Soc., 2008, 130, 1093.[116] R. Ferrando, J. Jellinek and R. L. Johnston, Chem. Rev., 2008, 108, 845.[117] A. Henglein, J. Phys. Chem., 1993, 97, 5457.[118] S. C. Davis and K. J. Klabunde, Chem. Rev., 1982, 82, 153.[119] L. N. Lewis, Chem. Rev., 1993, 93, 2693.[120] G. Schmid, Chem. Rev., 1992, 92, 1709.[121] G. Schön and U. Simon, Colloid. Polym. Sci., 1995, 273, 101.[122] H. Y. Oderji and H. Ding, Chem. Phys., 2011, 388, 23.[123] H. B. Liu, U. Pal, A. Medina, C. Maldonado and J. A. Ascencio, Phys. Rev. B,
2005, 71, 075403.
Bibliography 228
Bibliography
[124] M. Faraday, Philos. Trans. R. Soc. London, 1857, 147, 145.[125] M. Gaudry, E. Cottancin, M. Pellarin, J. Lermé, L. Arnaud, J. R. Huntzinger,
J. L. Vialle, M. Broyer, J. L. Rousset, M. Treilleux and P. Mélinon, Phys. Rev.B, 2003, 67, 155409.
[126] R. W. J. Scott, O. M. Wilson, S.-K. Oh, E. A. Kenik and R. M. Crooks, J. Am.Chem. Soc., 2004, 126, 15583.
[127] J. A. Rodriguez and D. W. Goodman, Science, 1992, 257, 897.[128] M. Chen, D. Kumar, C.-W. Yi and D. W. Goodman, Science, 2005, 310, 291.[129] J. Knudsen, A. U. Nilekar, R. T. Vang, J. Schnadt, E. L. Kunkes, J. A. Dumesic,
M. Mavrikakis and F. Besenbacher, J. Am. Chem. Soc., 2007, 129, 6485.[130] S. Maksimuk, S. Yang, Z. Peng and H. Yang, J. Am. Chem. Soc., 2007, 129,
8684.[131] H. Ye and R. M. Crooks, J. Am. Chem. Soc., 2007, 129, 3627.[132] X. Teng and H. Yang, J. Am. Chem. Soc., 2003, 125, 14559.[133] E. Casado-Rivera, D. J. Volpe, L. Alden, C. Lind, C. Downie, T. Vázquez-
Alvarez, A. C. D. Angelo, F. J. DiSalvo and H. D. Abruña, J. Am. Chem. Soc.,2004, 126, 4043.
[134] C. J. Zhong and M. M. Maye, Adv. Mater., 2001, 13, 1507.[135] A. V. Ruban, H. L. Skriver and J. K. Nørskov, Phys. Rev. B, 1999, 59, 15990.[136] G. Bozzolo, J. Ferrante, R. D. Noebe, B. Good, F. S. Honecy and P. Abel,
Comput. Mater. Sci., 1999, 15, 169.[137] J. Jellinek and E. Krissinel, Chem. Phys. Lett., 1996, 258, 283.[138] E. Krissinel and J. Jellinek, Chem. Phys. Lett., 1997, 272, 301.[139] E. B. Krissinel and J. Jellinek, Int. J. Quantum Chem., 1997, 62, 185.[140] A. Radillo-Díaz, Y. Coronado, L. A. Pérez and I. L. Garzón, Eur. Phys. J. D,
2009, 52, 127.[141] J. P. Wilcoxon and B. L. Abrams, Chem. Soc. Rev., 2006, 35, 1162.[142] N. Toshima, M. Harada, Y. Yamazaki and K. Asakura, J. Phys. Chem., 1992,
96, 9927.[143] A. F. Lee, C. J. Baddeley, C. Hardacre, R. M. Ormerod, R. M. Lambert,
G. Schmid and H. West, J. Phys. Chem., 1995, 99, 6096.[144] N. Toshima, M. Harada, T. Yonezawa, K. Kushihashi and K. Asakura, J. Phys.
Chem., 1991, 95, 7448.[145] R. Esparza, J. Ascencio, G. Rosas, J. Sanchez Ramirez, U. Pal and R. Perez, J.
Nanosci. Nanotechnol., 2005, 5, 641.[146] J. Rousset, F. C. S. Aires, F. Bornette, M. Cattenot, M. Pellarin, L. Stievano
and A. Renouprez, Appl. Surf. Sci., 2000, 164, 163.[147] G. Schmid, A. Lehnert, J.-O. Malm and J.-O. Bovin, Angew. Chem. Int. Ed.
(English), 1991, 30, 874.[148] F. Lequien, J. Creuze, F. Berthier and B. Legrand, J. Chem. Phys., 2006, 125,
094707.[149] G. Tréglia, B. Legrand, F. Ducastelle, A. Saúl, C. Gallis, I. Meunier, C. Mottet
and A. Senhaji, Comput. Mater. Sci., 1999, 15, 196.[150] J. Creuze, F. Berthier, R. Tétot and B. Legrand, Surf. Sci., 2001, 491, 1.
Bibliography 229
Bibliography
[151] J. Sinfelt, J. Catal., 1973, 29, 308.[152] A. Ruban, B. Hammer, P. Stoltze, H. Skriver and J. Nørskov, J. Mol. Catal. A:
Chem., 1997, 115, 421.[153] P. Liu and J. K. Norskov, Phys. Chem. Chem. Phys., 2001, 3, 3814.[154] S. M. Oxford, P. L. Lee, P. J. Chupas, K. W. Chapman, M. C. Kung and H. H.
Kung, J. Phys. Chem. C, 2010, 114, 17085.[155] M. G. Montes de Oca, D. Plana, V. Celorrio, M. J. Lazaro and D. J. Fermín, J.
Phys. Chem. C, 2012, 116, 692.[156] B. Coq and F. Figueras, J. Mol. Catal. A: Chem., 2001, 173, 117.[157] J. C. Fuggle, F. U. Hillebrecht, R. Zeller, Z. Zołnierek, P. A. Bennett and
C. Freiburg, Phys. Rev. B, 1983, 27, 2145.[158] R. Budhani, A. Banerjee, T. Goel and K. Chopra, J. Non-Cryst. Solids, 1983,
55, 93.[159] J. A. Rodriguez and M. Kuhn, J. Phys. Chem., 1996, 100, 381.[160] M. Fernández-García, J. A. Anderson and G. L. Haller, J. Phys. Chem., 1996,
100, 16247.[161] M. Fernández-García, J. Conesa, A. Clotet, J. Ricart, N. López and F. Illas, J.
Phys. Chem. B, 1998, 102, 141–147.[162] F. Skoda, M. P. Astier, G. M. Pajonk and M. Primet, Catal. Lett., 1994, 29, 159.[163] A. Venezia, L. Liotta, G. Deganello, Z. Schay and L. Guczi, J. Catal., 1999, 182,
449.[164] B. Coq, A. Goursot, T. Tazi, F. Figueras and D. R. Salahub, J. Am. Chem. Soc.,
1991, 113, 1485.[165] C. Balseiro and J. Morán-López, Surf. Sci., 1985, 156, Part 1, 404.[166] R. V. Hardeveld and F. Hartog, Surf. Sci., 1969, 15, 189.[167] L. V. Nosova, A. V. Kalinkin, E. A. Paukshtis, E. P. Talsi and Y. A. Ryndin,
React. Kinet. Catal. Lett., 1994, 53, 139.[168] A. Renouprez, K. Lebas, G. Bergeret, J. Rousset and P. Delichère, in 11th Inter-
national Congress On Catalysis - 40th Anniversary Proceedings of the 11th ICC,ed. E. I. Joe W. Hightower, W. Nicholas Delgass and A. T. Bell, Elsevier, 1996,vol. 101, p. 1105.
[169] Y. Debauge, M. Abon, J. Bertolini, J. Massardier and A. Rochefort, Appl. Surf.Sci., 1995, 90, 15.
[170] G. D. Angel, B. Coq and F. Figueras, J. Catal., 1985, 95, 167.[171] J. L. Rousset, J. C. Bertolini and P. Miegge, Phys. Rev. B, 1996, 53, 4947.[172] M. C. Fromen, J. Morillo, M. J. Casanove and P. Lecante, Europhys. Lett., 2006,
73, 885.[173] N. L. Rosi and C. A. Mirkin, Chem. Rev., 2005, 105, 1547.[174] P. Alivisatos, Nat. Biotechnol., 2004, 22, 47–52.[175] M. Vargaftik, V. Zagorodnikov, I. Stolarov, I. Moiseev, D. Kochubey, V. L. kholo
bov, A. Chuvilin and K. Zamaraev, J. Mol. Catal., 1989, 53, 315.[176] J. S. Bradley, J. M. Millar and E. W. Hill, J. Am. Chem. Soc., 1991, 113, 4016.[177] J. Kiwi and M. Graetzel, J. Am. Chem. Soc., 1979, 101, 7214.[178] D. Reinhard, B. D. Hall, P. Berthoud, S. Valkealahti and R. Monot, Phys. Rev.
Bibliography 230
Bibliography
Lett., 1997, 79, 1459.[179] B. D. Hall, M. Flüeli, R. Monot and J.-P. Borel, Phys. Rev. B, 1991, 43, 3906.[180] O. Dmitrieva, M. Acet, G. Dumpich, J. Kästner, C. Antoniak, M. Farle and
K. Fauth, J. Phys. D: Appl. Phys., 2006, 39, 4741.[181] K. Koga and K. Sugawara, Surf. Sci., 2003, 529, 23.[182] A. N. Patil, D. Y. Paithankar, N. Otsuka and R. P. Andres, Z. Phys. D: At.,
Mol. Clusters, 1993, 26, 135.[183] K. Stevens, B. Ingham, M. Toney, S. Brown and A. Lassesson, Curr. Appl Phys.,
2008, 8, 443.[184] E. Cottancin, J. Lermé, M. Gaudry, M. Pellarin, J.-L. Vialle, M. Broyer,
B. Prével, M. Treilleux and P. Mélinon, Phys. Rev. B, 2000, 62, 5179.[185] M. Gaudry, J. Lermé, E. Cottancin, M. Pellarin, J. L. Vialle, M. Broyer,
B. Prével, M. Treilleux and P. Mélinon, Phys. Rev. B, 2001, 64, 085407.[186] Z. Y. Li, J. Yuan, Y. Chen, R. E. Palmer and J. P. Wilcoxon, Appl. Phys. Lett.,
2005, 87, 243103.[187] Z. Li, J. Yuan, Y. Chen, R. Palmer and J. Wilcoxon, Adv. Mater., 2005, 17,
2885.[188] R. L. Johnston, Dalton Trans., 2003, 22, 4193.[189] D. Ferrer, A. Torres-Castro, X. Gao, S. SepÃolveda-Guzmán, U. Ortiz-Méndez
and M. José-Yacamán, Nano Lett., 2007, 7, 1701.[190] G. C. Papavassiliou, J. Phys. F: Met. Phys., 1976, 6, L103.[191] H. Zhang, M. Jin, J. Wang, M. J. Kim, D. Yang and Y. Xia, J. Am. Chem. Soc.,
2011, 133, 10422.[192] A. Henglein, J. Phys. Chem. B, 2000, 104, 2201.[193] D. Cheng, S. Huang and W. Wang, Eur. Phys. J. D, 2006, 39, 41.[194] D. Cheng, S. Huang and W. Wang, Chem. Phys., 2006, 330, 423.[195] F. Baletto, C. Mottet and R. Ferrando, Phys. Rev. Lett., 2003, 90, 135504.[196] R. Bardhan, S. Mukherjee, N. A. Mirin, S. D. Levit, P. Nordlander and N. J.
Halas, J. Phys. Chem. C, 2010, 114, 7378.[197] C. Radloff and N. J. Halas, Nano Lett., 2004, 4, 1323.[198] S. Wang, B. R. Jarrett, S. M. Kauzlarich and A. Y. Louie, J. Am. Chem. Soc.,
2007, 129, 3848.[199] C. Kittel, Introduction to Solid State Physics, Wiley, Chichester, New York, 1986.[200] N. N. Greenwood and A. Earnshaw, Chemistry of the Elements (2nd ed.),
Butterworth-Heinemann, Oxford, 1997.[201] A. R. Miedema, Z. Metallkd., 1978, 69, 287.[202] W. Tyson and W. Miller, Surf. Sci., 1977, 62, 267.[203] A. Rapallo, G. Rossi, R. Ferrando, A. Fortunelli, B. C. Curley, L. D. Lloyd, G. M.
Tarbuck and R. L. Johnston, J. Chem. Phys., 2005, 122, 194308.[204] R. Lide, CRC Handbook of Chemistry and Physics, CRC Press, Boca Raton,
Florida, 2003.[205] G. Rossi, R. Ferrando, A. Rapallo, A. Fortunelli, B. C. Curley, L. D. Lloyd and
R. L. Johnston, J. Chem. Phys., 2005, 122, 194309.[206] G. Barcaro, A. Fortunelli, G. Rossi, F. Nita and R. Ferrando, J. Phys. Chem. B,
Bibliography 231
Bibliography
2006, 110, 23197.[207] Z. Duan and G. Wang, J. Phys.: Condens. Matter, 2011, 23, 475301.[208] R. V. Santen and W. Sachtler, J. Catal., 1974, 33, 202.[209] M. Kelley, J. Catal., 1979, 57, 113.[210] W. M. H. Sachtler, Cat. Rev., 1976, 14, 193.[211] R. Bouwman and W. Sachtler, J. Catal., 1970, 19, 127.[212] W. van Dijk, J. Groenewegen and V. Ponec, J. Catal., 1976, 45, 277.[213] F. Kuijers and V. Ponec, Surf. Sci., 1977, 68, 294.[214] H. de Jongste and V. Ponec, J. Catal., 1980, 64, 228.[215] S. Oldenburg, R. Averitt, S. Westcott and N. Halas, Chem. Phys. Lett., 1998,
288, 243.[216] F. Bernardi, M. C. M. Alves, A. Traverse, D. O. Silva, C. W. Scheeren, J. Dupont
and J. Morais, J. Phys. Chem. C, 2009, 113, 3909.[217] F. Caruso, Adv. Mater., 2001, 13, 11.[218] L. Feng, X. Wu, L. Ren, Y. Xiang, W. He, K. Zhang, W. Zhou and S. Xie, Chem.
Eur. J., 2008, 14, 9764.[219] D. Aherne, M. Gara, J. M. Kelly and Y. K. Gun’ko, Adv. Funct. Mater., 2010,
20, 1329.[220] X. Chen, H. Pan, H. Liu and M. Du, Electrochim. Acta, 2010, 56, 636.[221] Y. Wu, P. Jiang, M. Jiang, T.-W. Wang, C.-F. Guo, S.-S. Xie and Z.-L. Wang,
Nanotechnology, 2009, 20, 305602.[222] M. Min, C. Kim and H. Lee, J. Mol. Catal. A: Chem., 2010, 333, 6.[223] Y. Z. Fu, X. D. Xiang, J. H. Liao and J. M. Wang, J. Dispersion Sci. Technol.,
2008, 29, 1291.[224] C.-C. Huang, Z. Yang and H.-T. Chang, Langmuir, 2004, 20, 6089.[225] S. U. Son, Y. Jang, J. Park, H. B. Na, H. M. Park, H. J. Yun, J. Lee and
T. Hyeon, J. Am. Chem. Soc., 2004, 126, 5026.[226] G. Schmid, A. Lehnert, J.-O. Malm and J.-O. Bovin, Angew. Chem. Int. Ed.
(English), 1991, 30, 874.[227] G. Schmid, H. West, J.-O. Malm, J.-O. Bovin and C. Grenthe, Chem. Eur. J.,
1996, 2, 1099.[228] W. Pearson, The Crystal Chemistry and Physics of Metals and Alloys, Wiley-
Interscience, Chichester, New York, 1972.[229] T. B. Massalki, H. Okamoto and P. R. Subramanian, Binary Alloy Phase Dia-
grams, 2nd ed., ASM International, Metals Park, OH, 1990.[230] L. V. Pourovskii, A. V. Ruban, I. A. Abrikosov, Y. K. Vekilov and B. Johansson,
Phys. Rev. B, 2001, 64, 035421.[231] Y. Gauthier, Y. Joly, R. Baudoing and J. Rundgren, Phys. Rev. B, 1985, 31,
6216.[232] J. Vrijen and S. Radelaar, Phys. Rev. B, 1978, 17, 409.[233] O. Proux, J. Regnard, I. Manzini, C. Revenant, B. Rodmacq and J. Mimault,
EPJ Appl. Phys., 2000, 9, 115–124.[234] R. Hultgren, P. D. Desai, D. T. Hawkins, M. Gleiser and K. K. Kelley, Selected
Values of the Thermodynamic Properties of Binary Alloys, American Society for
Bibliography 232
Bibliography
Metals, Metals Park, Ohio, 1973.[235] S. Sao-Joao, S. Giorgio, J. M. Penisson, C. Chapon, S. Bourgeois and C. Henry,
J. Phys. Chem. B, 2005, 109, 342.[236] T. Manago, Y. Otani, H. Miyajima and E. Akiba, J. Appl. Phys., 1996, 79, 5126.[237] J. Guevara, A. Llois, F. Aguilera-Granja and J. Montejano-Carrizales, Physica
B, 2004, 354, 300.[238] T. Teranishi and M. Miyake, Chem. Mater., 1999, 11, 3414.[239] C. Femoni, M. C. Iapalucci, G. Longoni, P. H. Svensson and J. Wolowska, Angew.
Chem. Int. Ed., 2000, 39, 1635.[240] Z. Zhang, T. M. Nenoff, K. Leung, S. R. Ferreira, J. Y. Huang, D. T. Berry, P. P.
Provencio and R. Stumpf, J. Phys. Chem. C, 2010, 114, 14309.[241] G. Wang, M. A. V. Hove, P. N. Ross and M. I. Baskes, J. Chem. Phys., 2005,
122, 024706.[242] F. Demartin, F. Fabrizi de Biani, C. Femoni, M. C. Iapalucci, G. Longoni, P. Mac-
chi and P. Zanello, J. Cluster Sci., 2001, 12, 61.[243] C. Femoni, M. Carmela Iapalucci, G. Longoni and P. H. Svensson, Chem. Com-
mun., 2001, 1776.[244] A. Ceriott, F. Demartin, G. Longoni, M. Manassero, M. Marchionna, G. Piva
and M. Sansoni, Angew. Chem. Int. Ed., 1985, 24, 697.[245] L. G. Wang and A. Zunger, Phys. Rev. B, 2003, 67, 092103.[246] Y. Benguedouar, N. Keghouche and J. Belloni, Mater. Sci. Eng., B, 2012, 177,
27.[247] N. Toshima, Y. Shiraishi, A. Shiotsuki, D. Ikenaga and Y. Wang, Eur. Phys. J.
D, 2001, 16, 209.[248] Y. Wang and N. Toshima, J. Phys. Chem. B, 1997, 101, 5301.[249] N. Toshima, T. Yonezawa and K. Kushihashi, J. Chem. Soc., Faraday Trans.,
1993, 89, 2537.[250] U. Kolb, S. A. Quaiser, M. Winter and M. T. Reetz, Chem. Mater., 1996, 8,
1889.[251] N. V. Long, M. Ohtaki, T. D. Hien, J. Randy and M. Nogami, Electrochim. Acta,
2011, 56, 9133.[252] L. Fiermans, R. D. Gryse, G. D. Doncker, P. A. Jacobs and J. A. Martens, J.
Catal., 2000, 193, 108.[253] E. Fernández, L. Balbás, L. Pérez, K. Michaelian and I. Garzón, Int. J. Mod.
Phys. B, 2005, 19, 2339–2344.[254] L. O. Paz-Borbón, R. L. Johnston, G. Barcaro and A. Fortunelli, J. Phys. Chem.
C, 2007, 111, 2936.[255] L. O. Paz-Borbón, R. L. Johnston, G. Barcaro and A. Fortunelli, J. Chem. Phys.,
2008, 128, 134517.[256] L. O. Paz-Borbón, A. Gupta and R. L. Johnston, J. Mater. Chem., 2008, 18,
4154.[257] C. Massen, T. V. Mortimer-Jones and R. L. Johnston, J. Chem. Soc., Dalton
Trans., 2002, 23, 4375.[258] L. D. Lloyd, R. L. Johnston, S. Salhi and N. T. Wilson, J. Mater. Chem., 2004,
Bibliography 233
Bibliography
14, 1691.[259] J. L. Rousset, L. Stievano, F. J. C. S. Aires, C. Geantet, A. J. Renouprez and
M. Pellarin, J. Catal., 2001, 202, 163.[260] A. Renouprez, J. L. Rousset, A. M. Cadrot, Y. Soldo and L. Stievano, J. Alloys
Compd., 2001, 328, 50.[261] Y. Y. Tong, T. Yonezawa, N. Toshima and J. J. van der Klink, J. Phys. Chem.,
1996, 100, 730.[262] Y.-J. Deng, N. Tian, Z.-Y. Zhou, R. Huang, Z.-L. Liu, J. Xiao and S.-G. Sun,
Chem. Sci., 2012, 3, 1157.[263] M. Cazayous, C. Langlois, T. Oikawa, C. Ricolleau and A. Sacuto, Phys. Rev.
B, 2006, 73, 113402.[264] C. Langlois, T. Oikawa, P. Bayle-Guillemaud and C. Ricolleau, J. Nanopart.
Res., 2008, 10, 997.[265] M. Grouchko, A. Kamyshny and S. Magdassi, J. Mater. Chem., 2009, 19, 3057.[266] F. Lequien, J. Creuze, F. Berthier, I. Braems and B. Legrand, Phys. Rev. B,
2008, 78, 075414.[267] M. Molayem, V. G. Grigoryan and M. Springborg, J. Phys. Chem. C, 2011, 115,
22148.[268] V. Moreno, J. Creuze, F. Berthier, C. Mottet, G. Tréglia and B. Legrand, Surf.
Sci., 2006, 600, 5011.[269] S. Núñez and R. L. Johnston, J. Phys. Chem. C, 2010, 114, 13255.[270] R. Ferrando, A. Fortunelli and G. Rossi, Phys. Rev. B, 2005, 72, 085449.[271] J. Belloni, M. Mostafavi, H. Remita, J.-L. Marignier and M.-O. Delcourt, New
J. Chem., 1998, 22, 1239.[272] M. Tsuji, S. Hikino, R. Tanabe and D. Yamaguchi, Chem. Lett., 2010, 39, 334–
336.[273] A. Henglein and R. Tausch-Treml, J. Colloid Interface Sci., 1981, 80, 84.[274] S. Xiong, W. Qi, B. Huang and M. Wang, ChemPhysChem, 2011, 12, 1317.[275] J. L. Rodríguez-López, J. M. Montejano-Carrizales, U. Pal, J. F. Sánchez-
Ramírez, H. E. Troiani, D. García, M. Miki-Yoshida and M. José-Yacamán, Phys.Rev. Lett., 2004, 92, 196102.
[276] J. Rodríguez-López, J. Montejano-Carrizales and M. José-Yacamán, Appl. Surf.Sci., 2003, 219, 56.
[277] R. A. Lordeiro, F. F. Guimarães, J. C. Belchior and R. L. Johnston, Int. J.Quantum Chem., 2003, 95, 112.
[278] M. Zhang and R. Fournier, THEOCHEM, 2006, 762, 49.[279] G. Mattei, C. Maurizio, P. Mazzoldi, F. D’Acapito, G. Battaglin, E. Cattaruzza,
C. de Julián Fernández and C. Sada, Phys. Rev. B, 2005, 71, 195418.[280] N. T. Wilson and R. L. Johnston, J. Mater. Chem., 2002, 12, 2913.[281] B. Pauwels, G. Van Tendeloo, E. Zhurkin, M. Hou, G. Verschoren, L. Theil Kuhn,
W. Bouwen and P. Lievens, Phys. Rev. B, 2001, 63, 165406.[282] H. Yasuda and H. Mori, Z. Phys. D: At., Mol. Clusters, 1996, 37, 181.[283] G. J. Ackland and V. Vitek, Phys. Rev. B, 1990, 41, 10324.[284] H. Mori, M. Komatsu, K. Takeda and H. Fujita, Philos. Mag. Lett., 1991, 63,
Bibliography 234
Bibliography
173.[285] H. Yasuda and H. Mori, Z. Phys. D: At., Mol. Clusters, 1994, 31, 131.[286] U. Pal, J. Sanchez Ramirez, H. Liu, A. Medina and J. Ascencio, Appl. Phys. A,
2004, 79, 79.[287] S. Pal and G. De, J. Mater. Chem., 2007, 17, 493.[288] D. Tran, I. Jones, J. Preece, R. Johnston and C. van den Brom, J. Nanopart.
Res., 2011, 13, 4229.[289] J. H. Hodak, A. Henglein, M. Giersig and G. V. Hartland, J. Phys. Chem. B,
2000, 104, 11708.[290] J. Zhu, Y. Wang, L. Huang and Y. Lu, Phys. Lett. A, 2004, 323, 455.[291] L. M. Liz-Marzan and A. P. Philipse, J. Phys. Chem., 1995, 99, 15120.[292] H. Chen, R. Liu, L.-Y. Jang, J.-F. Lee and S. Hu, Chem. Phys. Lett., 2006, 421,
118.[293] Y. Feng, J. He, H. Wang, Y. Y. Tay, H. Sun, L. Zhu and H. Chen, J. Am. Chem.
Soc., 2012, 134, 2004.[294] C. de Cointet, M. Mostafavi, J. Khatouri and J. Belloni, J. Phys. Chem. B, 1997,
101, 3512.[295] J. P. Wilcoxon and P. P. Provencio, J. Am. Chem. Soc., 2004, 126, 6402.[296] R. Sanedrin, D. Georganopoulou, S. Park and C. Mirkin, Adv. Mater., 2005, 17,
1027.[297] I. Srnová-Šloufová, B. Vlcková, Z. Bastl and T. L. Hasslett, Langmuir, 2004, 20,
3407.[298] S. Bruzzone, G. Arrighini and C. Guidotti, Mater. Sci. Eng., C, 2003, 23, 965.[299] F. Y. Chen and R. L. Johnston, Appl. Phys. Lett., 2007, 90, 153123.[300] G. F. Zhao and Z. Zeng, J. Chem. Phys., 2006, 125, 014303.[301] S. W. Han, Y. Kim and K. Kim, J. Colloid Interface Sci., 1998, 208, 272.[302] S. Xing, Y. Feng, Y. Y. Tay, T. Chen, J. Xu, M. Pan, J. He, H. H. Hng, Q. Yan
and H. Chen, J. Am. Chem. Soc., 2010, 132, 9537.[303] M. Treguer, C. de Cointet, H. Remita, J. Khatouri, M. Mostafavi, J. Amblard,
J. Belloni and R. de Keyzer, J. Phys. Chem. B, 1998, 102, 4310.[304] T. Shibata, B. A. Bunker, Z. Zhang, D. Meisel, C. F. Vardeman and J. D.
Gezelter, J. Am. Chem. Soc., 2002, 124, 11989.[305] W. Benten, N. Nilius, N. Ernst and H.-J. Freund, Phys. Rev. B, 2005, 72, 045403.[306] B. C. Curley, G. Rossi, R. Ferrando and R. L. Johnston, Eur. Phys. J. D, 2007,
43, 53.[307] C. J. Kiely, J. Fink, J. G. Zheng, M. Brust, D. Bethell and D. J. Schiffrin, Adv.
Mater., 2000, 12, 640.[308] M. Gaudry, J. Lermé, E. Cottancin, M. Pellarin, B. Prével, M. Treilleux, P. Méli-
non, J.-L. Rousset and M. Broyer, Eur. Phys. J. D, 2001, 16, 201.[309] S. Link, Z. L. Wang and M. A. El-Sayed, J. Phys. Chem. B, 1999, 103, 3529.[310] Q. Zhang, J. Y. Lee, J. Yang, C. Boothroyd and J. Zhang, Nanotechnology, 2007,
18, 245605.[311] N. Lidgi-Guigui, P. Mulheran and R. E. Palmer, Appl. Phys. Lett., 2008, 93,
123107.
Bibliography 235
Bibliography
[312] A. Santra, F. Yang and D. Goodman, Surf. Sci., 2004, 548, 324.[313] V. Bonačić-Koutecký, J. Burda, R. Mitrić, M. Ge, G. Zampella and P. Fantucci,
J. Chem. Phys., 2002, 117, 3120.[314] R. Mitrić, C. Bürgel, J. Burda, V. Bonačić-Koutecký and P. Fantucci, Eur. Phys.
J. D, 2003, 24, 41.[315] J. Ricardo-Chávez and G. Pastor, Comput. Mater. Sci., 2006, 35, 311.[316] J. M. Montejano-Carrizales, M. P. Iñiguez and J. A. Alonso, Phys. Rev. B, 1994,
49, 16649.[317] H. Portales, L. Saviot, E. Duval, M. Gaudry, E. Cottancin, M. Pellarin, J. Lermé
and M. Broyer, Phys. Rev. B, 2002, 65, 165422.[318] J. L. Rousset, F. J. Cadete Santos Aires, B. R. Sekhar, P. Mélinon, B. Prevel
and M. Pellarin, J. Phys. Chem. B, 2000, 104, 5430.[319] D. Boerma, G. Dorenbos, G. Wheatley and T. Buck, Surf. Sci., 1994, 307Ð309,
Part B, 674.[320] H. She, Y. Chen, X. Chen, K. Zhang, Z. Wang and D.-L. Peng, J. Mater. Chem.,
2012, 22, 2757.[321] M. Tsuji, D. Yamaguchi, M. Matsunaga and K. Ikedo, Cryst. Growth Des., 2011,
11, 1995.[322] A. M. Molenbroek, J. K. Nørskov and B. S. Clausen, J. Phys. Chem. B, 2001,
105, 5450.[323] J. S. Bradley, G. H. Via, L. Bonneviot and E. W. Hill, Chem. Mater., 1996, 8,
1895.[324] M. Jin, H. Zhang, J. Wang, X. Zhong, N. Lu, Z. Li, Z. Xie, M. J. Kim and Y. Xia,
ACS Nano, 2012, 6, 2566.[325] A. M. Molenbroek, S. Haukka and B. S. Clausen, J. Phys. Chem. B, 1998, 102,
10680.[326] N. Toshima and Y. Wang, Langmuir, 1994, 10, 4574.[327] F. Gimenez, C. Chapon and C. R. Henry, New J. Chem., 1998, 22, 1289.[328] S. Giorgio, C. Chapon and C. R. Henry, Langmuir, 1997, 13, 2279.[329] C. Mottet, G. Tréglia and B. Legrand, Phys. Rev. B, 2002, 66, 045413.[330] L. Rubinovich, M. I. Haftel, N. Bernstein and M. Polak, Phys. Rev. B, 2006, 74,
035405.[331] L. Zhu, K. Liang, B. Zhang, J. Bradley and A. DePristo, J. Catal., 1997, 167,
412.[332] S. Zhou, B. Varughese, B. Eichhorn, G. Jackson and K. McIlwrath, Angew. Chem.
Int. Ed., 2005, 44, 4539.[333] J. Kugai, T. Moriya, S. Seino, T. Nakagawa, Y. Ohkubo, H. Nitani, H. Daimon
and T. Yamamoto, Int. J. Hydrogen Energy, 2012, 37, 4787.[334] X. Liu and X. Liu, Angew. Chem. Int. Ed., 2012, 51, 3311.[335] J. Zeng, C. Zhu, J. Tao, M. Jin, H. Zhang, Z.-Y. Li, Y. Zhu and Y. Xia, Angew.
Chem. Int. Ed., 2012, 51, 2354.[336] P. Mulvaney, Langmuir, 1996, 12, 788.[337] C.-L. Lu, K. S. Prasad, H.-L. Wu, J. A. Ho and M. H. Huang, J. Am. Chem.
Soc., 2010, 132, 14546.
Bibliography 236
Bibliography
[338] S. Remita, M. Mostafavi and M. Delcourt, Radiat. Phys. Chem., 1996, 47, 275.[339] C. M. Doudna, M. F. Bertino and A. T. Tokuhiro, Langmuir, 2002, 18, 2434.[340] K. Patel, S. Kapoor, D. Dave and T. Mukherjee, J. Chem. Sci., 2005, 117, 311.[341] N. Khan, A. Uhl, S. Shaikhutdinov and H.-J. Freund, Surf. Sci., 2006, 600, 1849.[342] B. Lim, H. Kobayashi, T. Yu, J. Wang, M. J. Kim, Z.-Y. Li, M. Rycenga and
Y. Xia, J. Am. Chem. Soc., 2010, 132, 2506.[343] L. Zhang, W. Niu, Z. Li and G. Xu, Chem. Commun., 2011, 47, 10353.[344] J. H. Shim, J. Kim, C. Lee and Y. Lee, Chem. Mater., 2011, 23, 4694.[345] F. Pittaway, L. O. Paz-Borbón, R. L. Johnston, H. Arslan, R. Ferrando, C. Mot-
tet, G. Barcaro and A. Fortunelli, J. Phys. Chem. C, 2009, 113, 9141.[346] P.-P. Fang, A. Jutand, Z.-Q. Tian and C. Amatore, Angew. Chem. Int. Ed., 2011,
50, 12184.[347] C.-W. Yang, K. Chanda, P.-H. Lin, Y.-N. Wang, C.-W. Liao and M. H. Huang,
J. Am. Chem. Soc., 2011, 133, 19993.[348] Y. Yu, Q. Zhang, B. Liu and J. Y. Lee, J. Am. Chem. Soc., 2010, 132, 18258.[349] A. J. Logsdail, N. J. Cookson, S. L. Horswell, Z. W. Wang, Z. Y. Li and R. L.
Johnston, J. Phys. Chem. C, 2010, 114, 21247.[350] W. Annan, P. Qing and L. Yadong, Chem. Mater., 2011, 23, 3217.[351] H. Chen, Y. Li, F. Zhang, G. Zhang and X. Fan, J. Mater. Chem., 2011, 21,
17658.[352] P. S. West, R. L. Johnston, G. Barcaro and A. Fortunelli, J. Phys. Chem. C,
2010, 114, 19678.[353] Y. Ding, F. Fan, Z. Tian and Z. L. Wang, J. Am. Chem. Soc., 2010, 132, 12480.[354] J. Chai, F. Li, Y. Hu, Q. Zhang, D. Han and L. Niu, J. Mater. Chem., 2011, 21,
17922.[355] C. J. DeSantis, A. C. Sue, M. M. Bower and S. E. Skrabalak, ACS Nano, 2012,
6, 2617.[356] J. H. Hodak, A. Henglein and G. V. Hartland, J. Chem. Phys., 2001, 114, 2760.[357] Q. Ge, C. Song and L. Wang, Comput. Mater. Sci., 2006, 35, 247.[358] D. T. Tran and R. L. Johnston, Proc. R. Soc. A, 2011, 467, 2004.[359] L. Cao, L. Tong, P. Diao, T. Zhu and Z. Liu, Chem. Mater., 2004, 16, 3239.[360] M. J. Hostetler, C.-J. Zhong, B. K. H. Yen, J. Anderegg, S. M. Gross, N. D.
Evans, M. Porter and R. W. Murray, J. Am. Chem. Soc., 1998, 120, 9396.[361] R. P. Doherty, J.-M. Krafft, C. Méthivier, S. Casale, H. Remita, C. Louis and
C. Thomas, J. Catal., 2012, 287, 102.[362] R. Raja, V. B. Golovko, J. M. Thomas, A. Berenguer-Murcia, W. Zhou, S. Xie
and B. F. G. Johnson, Chem. Commun., 2005, 2026.[363] L. Duran Pachon, M. B. Thathagar, F. Hartl and G. Rothenberg, Phys. Chem.
Chem. Phys., 2006, 8, 151.[364] A. Renouprez, J. Faudon, J. Massardier, J. Rousset, P. Delichère and G. Bergeret,
J. Catal., 1997, 170, 181.[365] U. A. Paulus, A. Wokaun, G. G. Scherer, T. J. Schmidt, V. Stamenkovic, V. Rad-
milovic, N. M. Markovic and P. N. Ross, J. Phys. Chem. B, 2002, 106, 4181.[366] J. Montejano-Carrizales and J. Morán-López, Surf. Sci., 1990, 239, 178.
Bibliography 237
Bibliography
[367] J. Montejano-Carrizales and J. Morán-López, Surf. Sci., 1990, 239, 169.[368] Z.-Y. Jiang, K.-H. Lee, S.-T. Li and S.-Y. Chu, Phys. Rev. B, 2006, 73, 235423.[369] E. Janssens, S. Neukermans, X. Wang, N. Veldeman, R. E. Silverans and
P. Lievens, Eur. Phys. J. D, 2005, 34, 23.[370] W. Bouwen, F. Vanhoutte, F. Despa, S. Bouckaert, S. Neukermans, L. T. Kuhn,
H. Weidele, P. Lievens and R. E. Silverans, Chem. Phys. Lett., 1999, 314, 227.[371] J. Ascencio, H. Liu, U. Pal, A. Medina and Z. Wang, Microsc. Res. Tech., 2006,
69, 522.[372] G. De and C. N. R. Rao, J. Phys. Chem. B, 2003, 107, 13597.[373] M. J. López, P. A. Marcos and J. A. Alonso, J. Chem. Phys., 1996, 104, 1056.[374] D. T. Tran, I. P. Jones, R. L. Johnston, J. A. Preece and C. R. van den Brom,
J. Phys: Conf. Ser., 2010, 241, 012086.[375] P. J. Hsu and S. K. Lai, J. Chem. Phys., 2006, 124, 044711.[376] D. T. Tran and R. L. Johnston, Phys. Chem. Chem. Phys., 2009, 11, 10340.[377] F. Cleri and V. Rosato, Phys. Rev. B, 1993, 48, 22.[378] S. Darby, T. V. Mortimer-Jones, R. L. Johnston and C. Roberts, J. Chem. Phys.,
2002, 116, 1536.[379] I. L. Garzón, K. Michaelian, M. R. Beltrán, A. Posada-Amarillas, P. Ordejón,
E. Artacho, D. Sánchez-Portal and J. M. Soler, Phys. Rev. Lett., 1998, 81, 1600.[380] F. Chen, L. Yuan and R. L. Johnston, J. Magn. Magn. Mater., 2012, 324, 2625.[381] Z. Y. Li, J. P. Wilcoxon, F. Yin, Y. Chen, R. E. Palmer and R. L. Johnston,
Faraday Discuss., 2008, 138, 363.[382] Y. Cao, R. Jin and C. A. Mirkin, J. Am. Chem. Soc., 2001, 123, 7961.[383] N. Toreis, X. E. Verykios, S. M. Khalid and G. B. Bunker, Surf. Sci., 1988, 197,
415.[384] D. I. Kondarides and X. E. Verykios, J. Catal., 1996, 158, 363.[385] F. Chen and R. L. Johnston, ACS Nano, 2008, 2, 165.[386] F. Chen, B. C. Curley, G. Rossi and R. L. Johnston, J. Phys. Chem. C, 2007,
111, 9157.[387] F. Chen and R. L. Johnston, Appl. Phys. Lett., 2008, 92, 023112.[388] F. Chen and R. L. Johnston, Acta Mater., 2008, 56, 2374.[389] S. Heiles, A. J. Logsdail, R. Schafer and R. L. Johnston, Nanoscale, 2012, 4,
1109.[390] T. Mallát, S. Szabó and J. Petró, Appl. Surf. Sci., 1990, 40, 309.[391] G. Singh, I. Kapoor and S. Dubey, J. Alloys Compd., 2009, 480, 270.[392] K. I. Choi and M. Vannice, J. Catal., 1991, 131, 36.[393] J. Phillips, A. Auroux, G. Bergeret, J. Massardier and A. Renouprez, J. Phys.
Chem., 1993, 97, 3565.[394] M. M. Maye, Y. Lou and C.-J. Zhong, Langmuir, 2000, 16, 7520.[395] N. Toshima and T. Yonezawa, New J. Chem., 1998, 22, 1179.[396] Y. Lou, M. M. Maye, L. Han, J. Luo and C.-J. Zhong, Chem. Commun., 2001,
473.[397] J. Zhang, H. Ma, D. Zhang, P. Liu, F. Tian and Y. Ding, Phys. Chem. Chem.
Bibliography 238
Bibliography
Phys., 2008, 10, 3250.[398] Z. Peng and H. Yang, Nano Res., 2009, 2, 406.[399] P. Hernández-Fernández, S. Rojas, P. Ocón, J. L. Gómez de la Fuente,
J. San Fabián, J. Sanza, M. A. Peña, F. J. García-García, P. Terreros and J. L. G.Fierro, J. Phys. Chem. C, 2007, 111, 2913.
[400] A. Logsdail, L. O. Paz-Borbón and R. L. Johnston, J. Comput. Theor. Nanosci.,2009, 6, 857.
[401] L. Xiong and A. Manthiram, J. Mater. Chem., 2004, 14, 1454.[402] H. Liu, W. Li and A. Manthiram, Appl. Catal., A, 2009, 90, 184.[403] M. Oezaslan, F. Hasché and P. Strasser, J. Electrochem. Soc., 2012, 159, B394.[404] T. Guo, P. Nikolaev, A. Thess, D. Colbert and R. Smalley, Chem. Phys. Lett.,
1995, 243, 49.[405] W.-Q. Deng, X. Xu and W. A. Goddard, Nano Lett., 2004, 4, 2331.[406] M.-H. Lin, B. Zhao and Y.-W. Chen, Ind. Eng. Chem. Res., 2009, 48, 7037.[407] R. Brayner, T. Coradin, F. Fievet-Vincent, J. Livage and F. Fievet, New J.
Chem., 2005, 29, 681.[408] D. A. Eastham, Y. Qiang, T. H. Maddock, J. Kraft, J.-P. Schille, G. S. Thompson
and H. Haberland, J. Phys.: Condens. Matter, 1997, 9, L497.[409] B. Wang, X. Chen, G. Chen, G. Wang and J. Zhao, Surf. Rev. Lett., 2004, 11,
15–20.[410] P. Paulus, H. Bönnemann, A. van der Kraan, F. Luis, J. Sinzig and L. de Jongh,
Eur. Phys. J. D, 1999, 9, 501.[411] Q. Lu, L. Zhu, L. Ma and G. Wang, Chem. Phys. Lett., 2005, 407, 176.[412] Q. Lu, L. Zhu, L. Ma and G. Wang, Phys. Lett. A, 2006, 350, 258.[413] J.-I. Park and J. Cheon, J. Am. Chem. Soc., 2001, 123, 5743.[414] A. F. Carlsson, M. Bäumer, T. Risse and H.-J. Freund, J. Chem. Phys., 2003,
119, 10885.[415] Z. A. Kaszkur and B. Mierzwa, Philos. Mag. A, 1998, 77, 781.[416] W. Juszczyk, Z. Karpinski, D. Lomot, J. Pielaszek, Z. Paal and A. Stakheev, J.
Catal., 1993, 142, 617.[417] J.-I. Park, M. G. Kim, Y.-w. Jun, J. S. Lee, W.-r. Lee and J. Cheon, J. Am.
Chem. Soc., 2004, 126, 9072.[418] D. Bochicchio and R. Ferrando, Nano Lett., 2010, 10, 4211.[419] E. Janssens, T. V. Hoof, N. Veldeman, S. Neukermans, M. Hou and P. Lievens,
Int. J. Mass spectrom., 2006, 252, 38.[420] T. van Hoof and M. Hou, Phys. Rev. B, 2005, 72, 115434.[421] E. E. Zhurkin, T. Van Hoof and M. Hou, Phys. Rev. B, 2007, 75, 224102.[422] J. Wang, G. Wang and J. Zhao, Phys. Rev. B, 2002, 66, 035418.[423] V. Tzitzios, D. Niarchos, M. Gjoka, N. Boukos and D. Petridis, J. Am. Chem.
Soc., 2005, 127, 13756.[424] H. L. Nguyen, L. E. M. Howard, S. R. Giblin, B. K. Tanner, I. Terry, A. K.
Hughes, I. M. Ross, A. Serres, H. Burckstummer and J. S. O. Evans, J. Mater.Chem., 2005, 15, 5136.
[425] L. E. M. Howard, H. L. Nguyen, S. R. Giblin, B. K. Tanner, I. Terry, A. K.
Bibliography 239
Bibliography
Hughes and J. S. O. Evans, J. Am. Chem. Soc., 2005, 127, 10140.[426] W. Zhou, E. Carpenter, J. Lin, A. Kumbhar, J. Sims and C. O’Connor, Eur.
Phys. J. D, 2001, 16, 289.[427] D. Saha, K. Koga and H. Takeo, Eur. Phys. J. D, 1999, 9, 539.[428] S. Sahoo, G. Rollmann and P. Entel, Phase Transitions, 2006, 79, 693.[429] D. M. P. Mingos and D. J. Wales, Introduction to Cluster Chemistry, Prentice
Hall, Englewood Cliffs, NJ, 1990.[430] G. Longoni, M. Manassero and M. Sansoni, J. Am. Chem. Soc., 1980, 102, 3242.[431] C. Tan, J. Chen, B. Liu and G. Chow, J. Cryst. Growth, 2006, 293, 175.[432] M. Müller and K. Albe, Phys. Rev. B, 2005, 72, 094203.[433] B. Yang, M. Asta, O. Mryasov, T. Klemmer and R. Chantrell, Acta Mater., 2006,
54, 4201.[434] J. M. Thomas, B. F. G. Johnson, R. Raja, G. Sankar and P. A. Midgley, Acc.
Chem. Res., 2003, 36, 20.[435] R. Raja, S. Hermans, D. S. Shephard, B. F. G. Johnson, R. Raja, G. Sankar,
S. Bromley and J. Meurig Thomas, Chem. Commun., 1999, 1571.[436] P. A. Midgley, M. Weyland, J. M. Thomas and B. F. G. Johnson, Chem. Com-
mun., 2001, 907.[437] S. Wasmus and A. Küver, J. Electroanal. Chem., 1999, 461, 14.[438] Z. Liu, X. Y. Ling, X. Su and J. Y. Lee, J. Phys. Chem. B, 2004, 108, 8234.[439] Y. Tong, H. S. Kim, P. K. Babu, P. Waszczuk, A. Wieckowski and E. Oldfield,
J. Am. Chem. Soc., 2002, 124, 468.[440] P. K. Babu, H. S. Kim, E. Oldfield and A. Wieckowski, J. Phys. Chem. B, 2003,
107, 7595.[441] G. Tréglia and B. Legrand, Phys. Rev. B, 1987, 35, 4338.[442] D. Aberdam, R. Durand, R. Faure, F. Gloaguen, J. Hazemann, E. Herrero,
A. Kabbabi and O. Ulrich, J. Electroanal. Chem., 1995, 398, 43.[443] R. J. Wiltshire, C. R. King, A. Rose, P. P. Wells, M. P. Hogarth, D. Thompsett
and A. E. Russell, Electrochim. Acta, 2005, 50, 5208.[444] E. M. Crabb, M. K. Ravikumar, D. Thompsett, M. Hurford, A. Rose and A. E.
Russell, Phys. Chem. Chem. Phys., 2004, 6, 1792.[445] A. E. Russell and A. Rose, Chem. Rev., 2004, 104, 4613.[446] M. S. Nashner, A. I. Frenkel, D. Somerville, C. W. Hills, J. R. Shapley and R. G.
Nuzzo, J. Am. Chem. Soc., 1998, 120, 8093.[447] F. Maillard, F. Gloaguen and J.-M. Leger, J. Appl. Electrochem., 2003, 33, 1.[448] L.-L. Wang, S. V. Khare, V. Chirita, D. D. Johnson, A. A. Rockett, A. I. Frenkel,
N. H. Mack and R. G. Nuzzo, J. Am. Chem. Soc., 2006, 128, 131.[449] S. Bromley, G. Sankar, C. Catlow, T. Maschmeyer, B. Johnson and J. Thomas,
Chem. Phys. Lett., 2001, 340, 524.[450] H. Bönnemann and R. Richards, Eur. J. Inorg. Chem., 2001, 2001, 2455.[451] C. Lyman, R. Lakis and H. Stenger, Ultramicroscopy, 1995, 58, 25.[452] Z. Jiang, J. Zhang, G. Wen, A. Liang, Q. Liu, C. Kang and X. He, Chin. J.
Chem., 2010, 28, 1159.[453] G. Wang, M. A. Van Hove, P. N. Ross and M. I. Baskes, J. Phys. Chem. B, 2005,
Bibliography 240
Bibliography
109, 11683.[454] V. Engels, F. Benaskar, N. Patil, E. V. Rebrov, V. Hessel, L. A. Hulshof, D. A.
Jefferson, J. A. J. M. Vekemans, S. Karwal, J. C. Schouten and A. E. H. Wheatley,Org. Process Res. Dev., 2010, 14, 644.
[455] R. M.A.Tehrani and S. A. Ghani, Sens. Actuators, B, 2010, 145, 20.[456] T. Sondón and J. Guevara, Physica B, 2004, 354, 303.[457] J. Hambrock, M. K. Schröter, A. Birkner, C. Wöll and R. A. Fischer, Chem.
Mater., 2003, 15, 4217.[458] M. Cokoja, H. Parala, M. K. Schroter, A. Birkner, M. W. E. van den Berg, K. V.
Klementiev, W. Grunert and R. A. Fischer, J. Mater. Chem., 2006, 16, 2420.[459] E. E. Zhurkin and M. Hou, J. Phys.: Condens. Matter, 2000, 12, 6735.[460] N. Weiher, E. Bus, L. Delannoy, C. Louis, D. Ramaker, J. Miller and J. van
Bokhoven, J. Catal., 2006, 240, 100.[461] A. Hinz, P.-O. Larsson, B. Skårman and A. Andersson, Appl. Catal., B, 2001,
34, 161.[462] M. Chandra and Q. Xu, J. Power Sources, 2007, 168, 135.[463] L. Piccolo, A. Valcarcel, M. Bausach, C. Thomazeau, D. Uzio and G. Berhault,
Phys. Chem. Chem. Phys., 2008, 10, 5504.[464] M. C. Valero, P. Raybaud and P. Sautet, Phys. Rev. B, 2007, 75, 045427.[465] P. D. Nellist and S. J. Pennycook, Science, 1996, 274, 413.[466] B. Gates, J. Mol. Catal. A: Chem., 2000, 163, 55.[467] J. Batista, A. Pintar, D. Mandrino, M. Jenko and V. Martin, Appl. Catal., A,
2001, 206, 113.[468] A. Pintar, J. Batista, I. Arčon and A. Kodre, in Characterization of Al2O3 sup-
ported Pd-Cu bimetallic catalysts by EXAFS, AES and kinetic measurements,ed. B. Delmon, P. Jacobs, R. Maggi, J. Martens, P. Grange and G. Poncelet,Elsevier, Amsterdam, 1998, p. 127.
[469] A. S. Fung, M. J. Kelley, D. C. Koningsberger and B. C. Gates, J. Am. Chem.Soc., 1997, 119, 5877.
[470] S.-P. Huang, D. S. Mainardi and P. B. Balbuena, Surf. Sci., 2003, 545, 163.[471] S. K. R. S. Sankaranarayanan, V. R. Bhethanabotla and B. Joseph, Phys. Rev.
B, 2005, 72, 195405.[472] L. J. Lewis, P. Jensen, N. Combe and J.-L. Barrat, Phys. Rev. B, 2000, 61, 16084.[473] N. T. Cuong, A. Fujiwara, T. Mitani and D. H. Chi, Comput. Mater. Sci., 2008,
44, 163.[474] A. Siani, O. S. Alexeev, B. Captain, G. Lafaye, P. Marécot, R. D. Adams and
M. D. Amiridis, J. Catal., 2008, 255, 162.[475] R. Wojcieszak, S. Monteverdi, J. Ghanbaja and M. Bettahar, J. Colloid Interface
Sci., 2008, 317, 166.[476] G. Barcaro and A. Fortunelli, Chem. Phys. Lett., 2008, 457, 143.[477] G. Barcaro and A. Fortunelli, New J. Phys., 2007, 9, 22.[478] W. Vervisch, C. Mottet and J. Goniakowski, Phys. Rev. B, 2002, 65, 245411.[479] R. Ferrando, G. Rossi, F. Nita, G. Barcaro and A. Fortunelli, ACS Nano, 2008,
2, 1849.
Bibliography 241
Bibliography
[480] Y. Long and N. Chen, Surf. Sci., 2008, 602, 46.[481] S. Giorgio and C. Henry, Microsc. Microanal. Microstruct., 1997, 8, 379.[482] L. Favre, V. Dupuis, E. Bernstein, P. Mélinon, A. Pérez, S. Stanescu, T. Epicier,
J.-P. Simon, D. Babonneau, J.-M. Tonnerre and J.-L. Hodeau, Phys. Rev. B,2006, 74, 014439.
[483] V. Dupuis, L. Favre, S. Stanescu, J. Tuaillon-Combes, E. Bernstein and A. Perez,J. Phys.: Condens. Matter, 2004, 16, S2231.
[484] G. Barcaro, A. Fortunelli, F. Nita and R. Ferrando, Phys. Rev. Lett., 2005, 95,246103.
[485] G. Barcaro, A. Fortunelli, G. Rossi, F. Nita and R. Ferrando, Phys. Rev. Lett.,2007, 98, 156101.
[486] J. Carrasco, N. Lopez, F. Illas and H.-J. Freund, J. Chem. Phys., 2006, 125,074711.
[487] G. Barcaro and A. Fortunelli, J. Chem. Theory Comput., 2005, 1, 972.[488] G. Barcaro and A. Fortunelli, Faraday Discuss., 2008, 138, 37.[489] G. H. Jóhannesson, T. Bligaard, A. V. Ruban, H. L. Skriver, K. W. Jacobsen
and J. K. Nørskov, Phys. Rev. Lett., 2002, 88, 255506.[490] J. B. Foresman and A. Frisch, Exploring Chemistry with Electronic Structure
Methods, Gaussian, 1996.[491] D. Schooss, M. N. Blom, J. H. Parks, B. v. Issendorff, H. Haberland and M. M.
Kappes, Nano Lett., 2005, 5, 1972.[492] C. L. Cleveland, U. Landman, M. N. Shafigullin, P. W. Stephens and R. L.
Whetten, Z. Phys. D: At., Mol. Clusters, 1997, 40, 503.[493] O. Kostko, B. Huber, M. Moseler and B. von Issendorff, Phys. Rev. Lett., 2007,
98, 043401.[494] A. A. Shvartsburg, R. R. Hudgins, P. Dugourd and M. F. Jarrold, Chem. Soc.
Rev., 2001, 30, 26.[495] D. J. Wales and H. A. Scheraga, Science, 1999, 285, 1368.[496] B. Hartke, J. Comput. Chem., 1999, 20, 1752.[497] F. Baletto, C. Mottet and R. Ferrando, Phys. Rev. B, 2001, 63, 155408.[498] K. Bao, S. Goedecker, K. Koga, F. Lançon and A. Neelov, Phys. Rev. B, 2009,
79, 041405.[499] H. Arslan, Int. J. Mod. Phys. C, 2007, 18, 1351–1359.[500] J. P. K. Doye and D. J. Wales, Phys. Rev. B, 1999, 59, 2292.[501] C. Barrón, S. Gómez and D. Romero, Appl. Math. Lett., 1997, 10, 25.[502] C. Barrón, S. Gómez, D. Romero and A. Saavedra, Appl. Math. Lett., 1999, 12,
85.[503] V. E. Bazterra, O. Oña, M. C. Caputo, M. B. Ferraro, P. Fuentealba and J. C.
Facelli, Phys. Rev. A, 2004, 69, 053202.[504] W. Cai, H. Jiang and X. Shao, J. Chem. Inf. Comput. Sci., 2002, 42, 1099.[505] C. J. H. Jacobsen, S. Dahl, B. S. Clausen, S. Bahn, A. Logadottir and J. K.
Nørskov, J. Am. Chem. Soc., 2001, 123, 8404.[506] S. Hannongbua, S. Saen-oon, P. Pungpo and P. Wolschann, Monatsh. Chem.,
2001, 132, 1157.
Bibliography 242
Bibliography
[507] F. Bernardi, A. Bottoni, M. D. Vivo, M. Garavelli, G. Keserü and G. Náray-Szabó, Chem. Phys. Lett., 2002, 362, 1.
[508] D. R. Hartree, Math. Proc. Cambridge Philos. Soc., 1928, 24, 89.[509] V. Fock, Z. Phys. A: Hadrons Nucl., 1930, 62, 795.[510] V. Fock, Z. Phys. A: Hadrons Nucl., 1933, 81, 195.[511] F. Jensen, Introduction to Computational Chemistry, Wiley, 2nd edn., 2006.[512] J. Cioslowski, Many-Electron Densities and Reduced Density Matrices, Kluwer
Academic/Plenum Publishers, 2000.[513] Y. Akutsu, S.-Y. Tahara, M. Tamura and T. Yoshida, J. Energetic Mat., 1991,
9, 161.[514] D. B. Cook, Handbook of Computational Quantum Chemistry (Dover Books on
Chemistry), Dover Publications, 2005.[515] D. Daven, N. Tit, J. Morris and K. Ho, Chem. Phys. Lett., 1996, 256, 195.[516] Y. Xiang, H. Jiang, W. Cai and X. Shao, J. Phys. Chem. A, 2004, 108, 3586.[517] B. C. Curley, R. L. Johnston, N. P. Young, Z. Y. Li, M. Di Vece, R. E. Palmer
and A. L. Bleloch, J. Phys. Chem. C, 2007, 111, 17846.[518] D. J. Wales and J. P. K. Doye, J. Phys. Chem. A, 1997, 101, 5111.[519] R. H. Leary and J. P. K. Doye, Phys. Rev. E, 1999, 60, R6320.[520] M. Born and R. Oppenheimer, Ann. Phys., 1927, 389, 457.[521] J. J. Sakurai and S. F. Tuan, Modern Quantum Mechanics, Benjamin/Cummings
Pub. and Addison-Wesley Pub, Menlo Park, Calif. and Redwood City, Calif,1985.
[522] P. Hohenberg and W. Kohn, Phys. Rev., 1964, 136, B864.[523] M. Levy, Proc. Natl. Acad. Sci. U.S.A., 1979, 76, 6062.[524] L. H. Thomas, Math. Proc. Cambridge Philos. Soc., 1927, 23, 542.[525] E. Fermi, Z. Phys. A: Hadrons Nucl., 1928, 48, 73.[526] W. Kohn and L. J. Sham, Phys. Rev., 1965, 140, A1133.[527] T. L. Gilbert, Phys. Rev. B, 1975, 12, 2111.[528] J. E. Harriman, Phys. Rev. A, 1981, 24, 680.[529] U. von Barth, in NATO ASI Series, ed. Phariseau and Temmerman, Plenum
Press, 1984.[530] A. D. Becke, J. Chem. Phys., 1993, 98, 1372.[531] M. Ernzerhof, Chem. Phys. Lett., 1996, 263, 499.[532] E. Schrödinger, Ann. Phys., 1926, 384, 361.[533] P. A. M. Dirac, Proc. R. Soc. London, Ser. A, 1928, 117, 610.[534] D. R. Hartree, Math. Proc. Cambridge Philos. Soc., 1928, 24, 111.[535] D. R. Hartree, Math. Proc. Cambridge Philos. Soc., 1928, 24, 426.[536] J. C. Slater, Phys. Rev., 1930, 36, 57.[537] V. Fock, Z. Phys. A: Hadrons Nucl., 1930, 61, 126.[538] E. Wigner and F. Seitz, Phys. Rev., 1933, 43, 804.[539] E. Wigner, Phys. Rev., 1934, 46, 1002.[540] C. F. v. Weizsäcker, Z. Phys. A: Hadrons Nucl., 1935, 96, 431.
Bibliography 243
Bibliography
[541] J. C. Slater, Phys. Rev., 1937, 51, 846.[542] J. C. Slater, Phys. Rev., 1951, 81, 385.[543] J. C. Phillips and L. Kleinman, Phys. Rev., 1959, 116, 287.[544] D. Pines, in Solid State Physics, Vol. I, ed. F. Seitz and D. Turnbull, Academic
Press, Inc., New York, 1955.[545] M. Gell-Mann and K. A. Brueckner, Phys. Rev., 1957, 106, 364.[546] U. von Barth and L. Hedin, J. Phys.: Condens. Matter C, 1972, 5, 1629.[547] O. K. Andersen, Phys. Rev. B, 1975, 12, 3060.[548] M. Levy, Phys. Rev. A, 1982, 26, 1200.[549] E. Runge and E. K. U. Gross, Phys. Rev. Lett., 1984, 52, 997.[550] E. Gross, J. Dobson and M. Petersilka, in Density Functional Theory II, ed.
R. Nalewajski, Springer Berlin / Heidelberg, 1996, vol. 181, p. 81.[551] M. Parrinello and W. Andreoni, computer code CPMD V3.9, http://www.cpmd.
org/.[552] A. D. Becke, Phys. Rev. A, 1988, 38, 3098.[553] C. Lee, W. Yang and R. G. Parr, Phys. Rev. B, 1988, 37, 785.[554] M. Frisch, G. Trucks, M. Head-Gordon, P. Gill, M. Wong, J. Forseman,
B. Johnson, H. Schlegel, M. Robb, E. Replogle, R. Gomperts, J. Andres,K. Raghavachari, J. Binkley, C. Gonzales, R. Martin, D. Fox, D. DeFrees,J. Baker, J. Stewart and J. Pople, Gaussian 92/DFT, 1992.
[555] http://www.nobelprize.org/nobel_prizes/chemistry/laureates/1998/.[556] O. J. Wacker, R. Kümmel and E. K. U. Gross, Phys. Rev. Lett., 1994, 73, 2915.[557] F. Illas and R. L. Martin, J. Chem. Phys., 1998, 108, 2519.[558] B. Gyorffy, J. Staunton and G. Stocks, in Fluctuations in Density Functional
Theory: Random Metallic Alloys and Itinerant Paramagnets, ed. E. Gross andR. Dreizler, Plenum, NY, 1995, p. 461.
[559] S. Kümmel and M. Brack, Phys. Rev. A, 2001, 64, 022506.[560] R. Car and M. Parrinello, Phys. Rev. Lett., 1985, 55, 2471.[561] M. Koskinen, P. Lipas and M. Manninen, Nucl. Phys. A, 1995, 591, 421.[562] R. N. Schmid, E. Engel and R. M. Dreizler, Phys. Rev. C, 1995, 52, 164.[563] W. Kohn, Y. Meir and D. E. Makarov, Phys. Rev. Lett., 1998, 80, 4153.[564] R. O. Jones and O. Gunnarsson, Rev. Mod. Phys., 1989, 61, 689.[565] A. Zupan, P. Blaha, K. Schwarz and J. P. Perdew, Phys. Rev. B, 1998, 58, 11266.[566] J. Theilhaber, Phys. Fluids B, 1992, 4, 2044.[567] R. Stadler and M. J. Gillan, J. Phys.: Condens. Matter, 2000, 12, 6053.[568] N. Argaman and G. Makov, Am. J. Phys.: Condens. Matter, 2000, 68, 69.[569] J. P. Perdew and W. Yue, Phys. Rev. B, 1986, 33, 8800.[570] J. P. Perdew, Phys. Rev. B, 1986, 33, 8822.[571] J. P. Perdew, J. A. Chevary, S. H. Vosko, K. A. Jackson, M. R. Pederson, D. J.
Singh and C. Fiolhais, Phys. Rev. B, 1992, 46, 6671.[572] J. P. Perdew, K. Burke and M. Ernzerhof, Phys. Rev. Lett., 1996, 77, 3865.[573] W. Koch and M. C. Holthausen, A ChemistÕs Guide to Density Functional The-
[574] S. Kurth, J. P. Perdew and P. Blaha, Int. J. Quantum Chem., 1999, 75, 889.[575] L. A. Curtiss, K. Raghavachari, P. C. Redfern and J. A. Pople, J. Chem. Phys.,
1997, 106, 1063.[576] J. Paier, M. Marsman and G. Kresse, J. Chem. Phys., 2007, 127, 024103.[577] J. Wang, G. Wang and J. Zhao, Chem. Phys. Lett., 2003, 380, 716.[578] M. D. Morse, Chem. Rev., 1986, 86, 1049.[579] A. Khein, D. J. Singh and C. J. Umrigar, Phys. Rev. B, 1995, 51, 4105.[580] P. H. T. Philipsen and E. J. Baerends, Phys. Rev. B, 1996, 54, 5326.[581] N. E. Schultz, Y. Zhao and D. G. Truhlar, J. Phys. Chem. A, 2005, 109, 4388.[582] N. E. Schultz, Y. Zhao and D. G. Truhlar, J. Phys. Chem. A, 2005, 109, 11127.[583] X. Gonze, J.-M. Beuken, R. Caracas, F. Detraux, M. Fuchs, G.-M. Rignanese,
L. Sindic, M. Verstraete, G. Zerah, F. Jollet, M. Torrent, A. Roy, M. Mikami,P. Ghosez, J.-Y. Raty and D. Allan, Comput. Mater. Sci., 2002, 25, 478.
[584] M. A. L. Marques, A. Castro, A. Rubio, K. Yabana and G. W. Bertsch, Octopus,2002, http://www.tddft.org/programs/octopus/.
[585] M. Valiev, E. Bylaska, N. Govind, K. Kowalski, T. Straatsma, H. V. Dam,D. Wang, J. Nieplocha, E. Apra, T. Windus and W. de Jong, Comput. Phys.Commun., 2010, 181, 1477.
[586] P. Giannozzi, S. Baroni, N. Bonini, M. Calandra, R. Car, C. Cavazzoni,D. Ceresoli, G. L. Chiarotti, M. Cococcioni, I. Dabo, A. D. Corso, S. de Giron-coli, S. Fabris, G. Fratesi, R. Gebauer, U. Gerstmann, C. Gougoussis, A. Kokalj,M. Lazzeri, L. Martin-Samos, N. Marzari, F. Mauri, R. Mazzarello, S. Paolini,A. Pasquarello, L. Paulatto, C. Sbraccia, S. Scandolo, G. Sclauzero, A. P. Seit-sonen, A. Smogunov, P. Umari and R. M. Wentzcovitch, J. Phys.: Condens.Matter, 2009, 21, 395502.
[587] D. Sundholm, Chem. Phys. Lett., 1999, 302, 480.[588] P. Carloni, Quant. Struct.-Act. Relat., 2002, 21, 166.[589] T. Frauenheim, G. Seifert, M. Elsterner, Z. Hajnal, G. Jungnickel, D. Porezag,
S. Suhai and R. Scholz, Phys. Status Solidi B, 2000, 217, 41.[590] I. Daizadeh, E. S. Medvedev and A. A. Stuchebrukhov, Proc. Natl. Acad. Sci.
U.S.A., 1997, 94, 3703.[591] Z. He, V. Sundsträm and T. Pullerits, FEBS Lett., 2001, 496, 36.[592] Y. Xiao and D. E. Williams, Chem. Phys. Lett., 1993, 215, 17.[593] Y. Zeiri, Phys. Rev. E, 1995, 51, R2769.[594] D. M. Deaven and K. M. Ho, Phys. Rev. Lett., 1995, 75, 288.[595] C. Roberts, R. L. Johnston and N. T. Wilson, Theor. Chem. Acc., 2000, 104,
123.[596] C. Roberts and R. L. Johnston, Phys. Chem. Chem. Phys., 2001, 3, 5024.[597] F. F. Guimarães, J. C. Belchior, R. L. Johnston and C. Roberts, J. Chem. Phys.,
2002, 116, 8327.[598] R. A. Lordeiro, F. F. Guimarães, J. C. Belchior and R. L. Johnston, Int. J.
Quantum Chem., 2003, 95, 112.[599] M. Bailey, N. Wilson, C. Roberts and R. Johnston, Eur. Phys. J. D, 2003, 25,
[600] R. L. Johnston, in Metal Nanoparticles and Nanoalloys, ed. J. W. Roy Johnston,Elsevier, UK, 2012.
[601] R. H. Byrd, P. Lu, J. Nocedal and C. Zhu, SIAM J. Sci. Comput., 1994, 16,1190.
[602] Z. Li and H. A. Scheraga, Proc. Natl. Acad. Sci. U.S.A., 1987, 84, 6611.[603] F. H. Stillinger and T. A. Weber, J. Stat. Phys., 1988, 52, 1429.[604] J. P. K. Doye and D. J. Wales, J. Chem. Phys., 1996, 105, 8428.[605] J. P. K. Doye and D. J. Wales, Phys. Rev. Lett., 1998, 80, 1357.[606] J. A. Niesse and H. R. Mayne, J. Chem. Phys., 1996, 105, 4700.[607] C. Baysal and H. Meirovitch, J. Chem. Phys., 1996, 105, 7868.[608] P. Derreumaux, J. Chem. Phys., 1997, 106, 5260.[609] P. Derreumaux, J. Chem. Phys., 1997, 107, 1941.[610] J. P. K. Doye and D. J. Wales, J. Chem. Soc., Faraday Trans., 1997, 93, 4233.[611] J. P. K. Doye, D. J. Wales and R. S. Berry, J. Chem. Phys., 1995, 103, 4234.[612] G. Rossi and R. Ferrando, Chem. Phys. Lett., 2006, 423, 17.[613] R. Ferrando, G. Rossi, A. C. Levi, Z. Kuntová, F. Nita, A. Jelea, C. Mottet,
G. Barcaro, A. Fortunelli and J. Goniakowski, J. Chem. Phys., 2009, 130, 174702.[614] R. Ferrando, personal communication.[615] L. Zhan, B. Piwowar, W.-K. Liu, P. J. Hsu, S. K. Lai and J. Z. Y. Chen, J.
Chem. Phys., 2004, 120, 5536.[616] R. P. Gupta, Phys. Rev. B, 1981, 23, 6265.[617] D. Bazin, D. Guillaume, C. Pichon, D. Uzio and S. Lopez, Oil Gas Sci. Technol.,
2005, 60, 801.[618] A. Fortunelli and G. Barcaro, personal communication.[619] N. T. Wilson, M. S. Bailey and R. L. Johnston, Inorg. Chim. Acta, 2006, 359,
3649.[620] R. Ismail and R. L. Johnston, Phys. Chem. Chem. Phys., 2010, 12, 8607.[621] E. J. Bylaska, W. A. de Jong, K. Kowalski, T. P. Straatsma, M. V. D. Wang,
E. Aprà, T. L. W. S. Hirata, M. T. Hackler, Y. Zhao, P.-D. Fan, R. J. Harrison,M. Dupuis, D. M. A. Smith, J. Nieplocha, V. Tipparaju, M. Krishnan, A. A.Auer, M. Nooijen, E. Brown, G. Cisnerosand, G. I. Fann, H. Früchtl, J. Garza,K. Hirao, R. Kendall, J. A. Nichols, K. Tsemekhman, K. Wolinski, J. Anchell,D. Bernholdt, P. Borowski, T. Clark, D. Clerc, H. Dachsel, M. Deegan, K. Dyall,D, Elwood, E. Glendening, M. Gutowski, A. Hess, J. Jaffe, B. Johnson, J. Ju,R. Kobayashi, R. Kutteh, Z. Lin, R. Littlefield, X. L. B. Meng, T. Nakajima,S. Ni, L. Pollack, M. Rosing, G. Sandrone, M. Stave, H. T. G. Thomas, J. vanLenthe, A. Wong and Z. Zhang, NWChem, A Computational Chemistry Pack-age for Parallel Computers, Version 5.0, Pacific Northwest National Laboratory,Richland, Washington 99352-0999, USA, 2006.
[622] L. O. Paz-Borbón, Ph.D. thesis, University of Birmingham, United Kingdom,2009.
[623] A. Schäfer, C. Huber and R. Ahlrichs, J. Chem. Phys., 1994, 100, 5829.[624] ftp://ftp.chemie.uni-karlsruhe.de/pub/basen/.[625] D. Andrae, U. Haeussermann, M. Dolg, H. Stoll and H. Preuss, Theor. Chem.
Acc., 1990, 77, 123.[626] F. Weigend, M. Häser, H. Patzelt and R. Ahlrichs, Chem. Phys. Lett., 1998, 294,
143.[627] L. O. Paz-Borbón, R. L. Johnston, G. Barcaro and A. Fortunelli, Eur. Phys. J.
D, 2009, 52, 131.[628] J. P. Perdew and A. Zunger, Phys. Rev. B, 1981, 23, 5048.[629] R. Ismail and R. L. Johnston, unpublished results.[630] R. Ferrando, G. Barcaro and A. Fortunelli, Phys. Rev. B, 2011, 83, 045418.[631] S. de Gironcoli, Phys. Rev. B, 1995, 51, 6773.[632] M. M. Mariscal, N. A. Oldani, S. A. Dassie and E. P. M. Leiva, Faraday Discuss.,
2008, 138, 89.[633] L. B. Hansen, P. Stoltze, J. K. Nørskov, B. S. Clausen and W. Niemann, Phys.
Rev. Lett., 1990, 64, 3155.[634] S. Ö. Kart, A. Erbay, H. K, T. Cagin and M. Tomak, JAMME, 2008, 31, 11–13.[635] M. Itoh, V. Kumar, T. Adschiri and Y. Kawazoe, J. Chem. Phys., 2009, 131,
174510.[636] F. Aguilera-Granja, A. Vega, J. Rogan, X. Andrade and G. García, Phys. Rev.
B, 2006, 74, 224405.[637] D. S. Goodsell and A. J. Olson, Annu. Rev. Biophys. Biomol. Struct., 2000, 29,
105.[638] M. Istvan Hargittai and M. Hargittai, Symmetry: A Unifying Concept, Pgw,
1994.[639] The concise Oxford dictionary, ed. J. Pearsall, Oxford Univ. Press, Oxford, 10th
edn., 1999.[640] H. Weyl, Symmetry, Princeton University Press, New York, 1989.[641] J. P. Elliott and P. G. Dawber, Symmetry in Physics, Macmilan, London, 1979.[642] F. H. C. Crick and J. D. Watson, Nature, 1956, 177, 473.[643] J. C. Kendrew, G. Bodo, H. M. Dintzis, R. G. Parrish and H. Wyckoff, Nature,
1958, 181, 662.[644] T. L. Blundell and N. Srinivasan, Proc. Natl. Acad. Sci. U.S.A., 1996, 93, 14243.[645] H. W. Kroto, J. R. Heath, S. C. O’Brien, R. F. Curl and R. E. Smalley, Nature,
1985, 318, 162.[646] J. Li, X. Li, H.-J. Zhai and L.-S. Wang, Science, 2003, 299, 864.[647] I. A. Solov’yov, A. V. Solov’yov and W. Greiner, Phys. Rev. A, 2002, 65, 053203.[648] S.-K. Lin, J. Chem. Inf. Comput. Sci., 1996, 36, 367.[649] I. Prigogine, Order Out of Chaos: Man’s New Dialogue with Nature, Random
House, 1984.[650] W. F. A. Magie, Source Book in Physics, McGraw-Hill, New York, 1935.[651] E. Schrödinger, Statistical Mechanics, University Press, London, 1952.[652] E. Schrödinger, What is life? The Physical Aspect of the Living Cell, Cambridge
University Press, London, 1944.[653] D. J. Depew, B. H. Weber and J. D. Smith, Entropy, information, and evolution
: new perspectives on physical and biological evolution, MIT Press, Cambridge,Mass., 1988.
Bibliography 247
Bibliography
[654] L. Onsager, Phys. Rev., 1931, 37, 405.[655] D. Halliday, R. Resnick and J. Walker, Fundamentals of Physics - 4th Ed., J.
Wiley & Sons, Ltd., New York, 1993.[656] J. Rosen, Entropy, 2005, 7, 308.[657] A. M. Lesk, J. Phys.: Condens. Matter A, 1980, 13, L111.[658] J. von Neumann, Mathematical Foundations of Quantum Mechanics;, Princeton
University Press, Princeton, 1955.[659] S.-K. Lin, Entropy, 2008, 10, 55.[660] S.-K. Lin, ArXiv Phys. e-prints, 2001, 1.[661] M. Petitjean, Entropy, 2003, 5, 271.[662] X. Yang, W. Cai and X. Shao, J. Phys. Chem. A, 2007, 111, 5048.[663] D. Reinhard, B. D. Hall, D. Ugarte and R. Monot, Phys. Rev. B, 1997, 55, 7868.[664] C. Li, N. Lu, Q. Xu, J. Mei, W. Dong, J. Fu and Z. Cao, J. Cryst. Growth, 2011,
319, 88.[665] J. P. K. Doye, M. A. Miller and D. J. Wales, J. Chem. Phys., 1999, 111, 8417.[666] M. N. Blom, D. Schooss, J. Stairs and M. M. Kappes, J. Chem. Phys., 2006,
124, 244308.[667] A. L. Mackay, Acta Cryst., 1962, 15, 916.[668] M. R. Hoare, in Structure and Dynamics of Simple Microclusters, John Wiley
and Sons, Inc., Hoboken, NJ, USA, 2007.[669] O. Echt, O. Kandler, T. Leisner, W. Miehle and E. Recknagel, J. Chem. Soc.,
Faraday Trans., 1990, 86,.[670] I. A. Harris, R. S. Kidwell and J. A. Northby, Phys. Rev. Lett., 1984, 53, 2390.[671] E. M. Fernández, J. M. Soler and L. C. Balbás, Phys. Rev. B, 2006, 73, 235433.[672] K. Jug, B. Zimmermann, P. Calaminici and A. M. Köster, J. Chem. Phys., 2002,
116, 4497.[673] H. Häkkinen and U. Landman, Phys. Rev. B, 2000, 62, R2287.[674] J. Zhao, J. Yang and J. G. Hou, Phys. Rev. B, 2003, 67, 085404.[675] G. Bravo-Pérez, I. Garzón and O. Novaro, Chem. Phys. Lett., 1999, 313, 655.
[676] V. Bonačić-Koutecký, L. Češpiva, P. Fantucci and J. Koutecký, J. Chem. Phys.,1993, 98, 7981.
[677] R. Fournier, J. Chem. Phys., 2001, 115, 2165.[678] L. Xiao and L. Wang, J. Phys. Chem. A, 2004, 108, 8605.[679] J. Pillardy and L. Piela, J. Phys. Chem., 1995, 99, 11805.[680] J. P. Doye and D. J. Wales, Chem. Phys. Lett., 1995, 247, 339.[681] J. L. Rodríguez-López, J. M. Montejano-Carrizales, J. P. Palomares-Báez,
H. Barrón-Escobar, J. J. Velázquez-Salazar, J. M. Cabrera-Trujillo and M. José-Yacamán, Key Eng. Mater., 2010, 444, 47–68.
[682] L. D. Marks, Rep. Prog. Phys., 1994, 57, 603.[683] M. Alvarez, J. Khoury, T. Schaaff, M. Shafigullin, I. Vezmar and R. Whetten,
Chem. Phys. Lett., 1997, 266, 91.[684] R. Esparza, G. Rosas, E. Valenzuela, S. Gamboa, U. Pal and R. Pérez, Matéria
(Rio J.), 2008, 13, 579.
Bibliography 248
Bibliography
[685] Z. Y. Li, N. P. Young, M. Di Vece, S. Palomba, R. E. Palmer, A. L. Bleloch,B. C. Curley, R. L. Johnston, J. Jiang and J. Yuan, Nature, 2008, 451, 06470.
[686] A. S. Barnard and L. A. Curtiss, ChemPhysChem, 2006, 7, 1544.[687] R. L. Whetten, J. T. Khoury, M. M. Alvarez, S. Murthy, I. Vezmar, Z. L. Wang,
P. W. Stephens, C. L. Cleveland, W. D. Luedtke and U. Landman, Adv. Mater.,1996, 8, 428.
[688] A. Pinto, A. R. Pennisi, G. Faraci, G. D’Agostino, S. Mobilio and F. Boscherini,Phys. Rev. B, 1995, 51, 5315.
[689] J. Uppenbrink and D. J. Wales, J. Chem. Phys., 1992, 96, 8520.[690] B. Wang, M. Liu, Y. Wang and X. Chen, J. Phys. Chem. C, 2011, 115, 11374.[691] S. H. Baker, M. Roy, S. C. Thornton, M. Qureshi and C. Binns, J. Phys.: Con-
dens. Matter, 2010, 22, 385301.[692] J. A. Ascencio, M. Pérez and M. José-Yacamán, Surf. Sci., 2000, 447, 73.[693] S. Tehuacanero, R. Herrera, M. Avalos and M. J. Yacamán, Acta Metall. Mater.,
1992, 40, 1663.[694] L. O. Paz-Borbón, T. V. Mortimer-Jones, R. L. Johnston, A. Posada-Amarillas,
G. Barcaro and A. Fortunelli, Phys. Chem. Chem. Phys., 2007, 9, 5202.[695] E. Groppo, W. Liu, O. Zavorotynska, G. Agostini, G. Spoto, S. Bordiga, C. Lam-
berti and A. Zecchina, Chem. Mater., 2010, 22, 2297.[696] J. He, I. Ichinose, T. Kunitake, A. Nakao, Y. Shiraishi and N. Toshima, J. Am.
Chem. Soc., 2003, 125, 11034.[697] P. V. Kamat, R. Huehn and R. Nicolaescu, J. Phys. Chem. B, 2002, 106, 788.[698] S. Sun, C. B. Murray, D. Weller, L. Folks and A. Moser, Science, 2000, 287,
1989.[699] R. P. Andres, J. D. Bielefeld, J. I. Henderson, D. B. Janes, V. R. Kolagunta,
C. P. Kubiak, W. J. Mahoney and R. G. Osifchin, Science, 1996, 273, 1690.[700] H.-X. Xie, C.-Y. Wang and T. Yu, Modell. Simul. Mater. Sci. Eng., 2009, 17,
055007.[701] J.-B. Zhu, S. Wang, M.-H. Qiao, W.-N. Wang and K.-N. Fan, J. Non-Cryst.
Solids, 2007, 353, 2638.[702] R. W. Cahn and P. Haasen, Physical Metallurgy, Elsevier, Amsterdam, 1996.[703] E. E. Zhurkin, G. Hautier and M. Hou, Phys. Rev. B, 2006, 73, 094108.[704] D. Shi, B. Wen, R. Melnik, S. Yao and T. Li, J. Solid State Chem., 2009, 182,
2664.[705] H. Okamoto and T. Massalski, J. Phase Equilib., 1985, 6, 229.[706] F. R. De Boer, R. Boom, W. C. M. Mattens, A. R. Miedama and A. K. Niessen,
Cohesion in Metals: Transition Metal Alloys, Elsevier, Amsterdam, 1988.[707] S. Pabi and B. Murty, Mater. Sci. Eng., A, 1996, 214, 146.[708] A. J. Bradley and A. Taylor, Philos. Mag. Ser. 7, 1937, 23, 1049.[709] A. J. Bradley and A. Taylor, Proc. R. Soc. A, 1937, 159, 56.[710] K. Michaelian, N. Rendón and I. L. Garzón, Phys. Rev. B, 1999, 60, 2000.[711] L. D. Marks, Philos. Mag. A, 1984, 49, 81.[712] J. P. K. Doye and L. Meyer, Phys. Rev. Lett., 2005, 95, 063401.[713] L. Pauling, The Nature of the Chemical Bond: An Introduction to Modern Struc-
Bibliography 249
Bibliography
tural Chemistry, Cornell University Press, Ithaca, NY, 1960.[714] D. Cheng, W. Wang and S. Huang, J. Phys. Chem. C, 2007, 111, 8037.[715] H. Cox, Surf. Sci., 1998, 397, 374.[716] J. L. Rousset, A. M. Cadrot, F. J. C. S. Aires, A. Renouprez, P. Mélinon,
A. Perez, M. Pellarin, J. L. Vialle and M. Broyer, J. Chem. Phys., 1995, 102,8574.
[717] R. Ferrando, A. Fortunelli and R. L. Johnston, Phys. Chem. Chem. Phys., 2008,10, 640.
[718] J. P. K. Doye, D. J. Wales, W. Branz and F. Calvo, Phys. Rev. B, 2001, 64,235409.
[719] K. Luo, T. Wei, C.-W. Yi, S. Axnanda and D. W. Goodman, J. Phys. Chem. B,2005, 109, 23517.
[720] L. D. Lloyd and R. L. Johnston, J. Chem. Soc., Dalton Trans., 2000, 3, 307.[721] D. Belić, R. L. Chantry, Z. Y. Li and S. A. Brown, Appl. Phys. Lett., 2011, 99,
171914.[722] D. Watson and G. Attard, Surf. Sci., 2002, 515, 87.[723] D. Cheng, W. Wang and S. Huang, J. Phys. Chem. B, 2006, 110, 16193.[724] D. G. Lee and U. A. Spitzer, J. Org. Chem., 1970, 35, 3589.[725] P. Prabhakaran, S. Venkatachalam and K. Ninan, Eur. Polym. J., 1999, 35,
1743.[726] K. Roy and S. Lahiri, Anal. Chem., 2008, 80, 7504.[727] W. S. Jung, J. Han, S. P. Yoon, S. W. Nam, T.-H. Lim and S.-A. Hong, J. Power
Sources, 2011, 196, 4573.[728] X. Yu and P. G. Pickup, J. Power Sources, 2009, 187, 493.[729] X. Yu and P. G. Pickup, Electrochem. Commun., 2009, 11, 2012.[730] Y. Zhou, J. Liu, J. Ye, Z. Zou, J. Ye, J. Gu, T. Yu and A. Yang, Electrochim.
Acta, 2010, 55, 5024.[731] D. I. Enache, J. K. Edwards, P. Landon, B. Solsona-Espriu, A. F. Carley, A. A.
Herzing, M. Watanabe, C. J. Kiely, D. W. Knight and G. J. Hutchings, Science,2006, 311, 362.
[732] R. W. J. Scott, C. Sivadinarayana, O. M. Wilson, Z. Yan, D. W. Goodman andR. M. Crooks, J. Am. Chem. Soc., 2005, 127, 1380.
[733] W. Zhou and J. Y. Lee, Electrochem. Commun., 2007, 9, 1725.[734] Y. Suo and I.-M. Hsing, Electrochim. Acta, 2011, 56, 2174.[735] N. Dimitratos, J. A. Lopez-Sanchez, J. M. Anthonykutty, G. Brett, A. F. Carley,
R. C. Tiruvalam, A. A. Herzing, C. J. Kiely, D. W. Knight and G. J. Hutchings,Phys. Chem. Chem. Phys., 2009, 11, 4952.
[736] D. Wang, A. Villa, F. Porta, L. Prati and D. Su, J. Phys. Chem. C, 2008, 112,8617.
[737] E. Gross, I. Popov and M. Asscher, J. Phys. Chem. C, 2009, 113, 18341.[738] V. I. Pârvulescu, V. Pârvulescu, U. Endruschat, G. Filoti, F. E. Wagner, C. Kübel
and R. Richards, Chem. Eur. J., 2006, 12, 2343.[739] H. Bönnemann, U. Endruschat, B. Tesche, A. Rufínska, C. W. Lehmann, F. E.
Wagner, G. Filoti, V. Pârvulescu and V. I. Pârvulescu, Eur. J. Inorg. Chem.,
Bibliography 250
Bibliography
2000, 2000, 819.[740] M. O. Nutt, J. B. Hughes and M. S. Wong, Environ. Sci. Technol., 2005, 39,
1346.[741] J. K. Edwards, B. E. Solsona, P. Landon, A. F. Carley, A. Herzing, C. J. Kiely
and G. J. Hutchings, J. Catal., 2005, 236, 69.[742] B. E. Solsona, J. K. Edwards, P. Landon, A. F. Carley, A. Herzing, C. J. Kiely
and G. J. Hutchings, Chem. Mater., 2006, 18, 2689.[743] Y.-F. Han, J.-H. Wang, D. Kumar, Z. Yan and D. Goodman, J. Catal., 2005,
232, 467.[744] F. Menegazzo, P. Burti, M. Signoretto, M. Manzoli, S. Vankova, F. Boccuzzi,
F. Pinna and G. Strukul, J. Catal., 2008, 257, 369.[745] T. Balcha, J. R. Strobl, C. Fowler, P. Dash and R. W. J. Scott, ACS Catal.,
2011, 1, 425.[746] S. Marx and A. Baiker, J. Phys. Chem. C, 2009, 113, 6191.[747] F. Liu, D. Wechsler and P. Zhang, Chem. Phys. Lett., 2008, 461, 254.[748] P. Dash, T. Bond, C. Fowler, W. Hou, N. Coombs and R. W. J. Scott, J. Phys.
Chem. C, 2009, 113, 12719.[749] J. Xu, T. Zhao, S. Shen and Y. Li, Int. J. Hydrogen Energy, 2010, 35, 6490.[750] D. Wang, A. Villa, P. Spontoni, D. S. Su and L. Prati, Chem. Eur. J., 2010, 16,
10007.[751] Y.-L. Fang, K. N. Heck, P. J. J. Alvarez and M. S. Wong, ACS Catalysis, 2011,
1, 128.[752] A. Staykov, T. Kamachi, T. Ishihara and K. Yoshizawa, J. Phys. Chem. C, 2008,
112, 19501.[753] H. C. Ham, G. S. Hwang, J. Han, S. W. Nam and T. H. Lim, J. Phys. Chem. C,
2009, 113, 12943.[754] C. J. Baddeley, M. Tikhov, C. Hardacre, J. R. Lomas and R. M. Lambert, J.
Phys. Chem., 1996, 100, 2189.[755] S. Bertarione, D. Scarano, A. Zecchina, V. Johánek, J. Hoffmann, S. Schauer-
mann, J. Libuda, G. Rupprechter and H.-J. Freund, J. Catal., 2004, 223, 64.[756] T. Lear, R. Marshall, J. A. Lopez-Sanchez, S. D. Jackson, T. M. Klapötke,
M. Bäumer, G. Rupprechter, H.-J. Freund and D. Lennon, J. Chem. Phys., 2005,123, 174706.
[757] T. Lear, R. Marshall, E. K. Gibson, T. Schutt, T. M. Klapotke, G. Rupprechter,H.-J. Freund, J. M. Winfield and D. Lennon, Phys. Chem. Chem. Phys., 2005,7, 565.
[758] S. Bertarione, D. Scarano, A. Zecchina, V. Johánek, J. Hoffmann, S. Schauer-mann, M. M. Frank, J. Libuda, G. Rupprechter and H.-J. Freund, J. Phys. Chem.B, 2004, 108, 3603.
[759] H. Borchert, B. Jürgens, V. Zielasek, G. Rupprechter, S. Giorgio, C. Henry andM. Bäumer, J. Catal., 2007, 247, 145.
[760] I. Garzón, K. Michaelian, M. Beltrán, A. Posada-Amarillas, P. Ordejón, E. Ar-tacho, D. Sánchez-Portal and J. Soler, Eur. Phys. J. D, 1999, 9, 211.
[761] M. Mandal, S. Kundu, S. K. Ghosh and T. Pal, J. Photochem. Photobiol., A,2004, 167, 17.
Bibliography 251
Bibliography
[762] A. Henglein, J. Phys. Chem. B, 2000, 104, 6683.[763] H. B. Liu, U. Pal, R. Perez and J. A. Ascencio, J. Phys. Chem. B, 2006, 110,
5191.[764] S. Loiha, K. Föttinger, K. Zorn, W. Klysubun, G. Rupprechter and J. Wit-
tayakun, J. Ind. Eng. Chem., 2009, 15, 819.[765] T. Fujikawa, K. Idei, T. Ebihara, H. Mizuguchi and K. Usui, Appl. Catal., A,
2000, 192, 253.[766] J. Barbier, E. Lamy-Pitara, P. Marecot, J. Boitiaux, J. Cosyns and F. Verna,
Adv. Catal., 1990, 37, 279.[767] B. H. Cooper and B. B. Donnis, Appl. Catal., A, 1996, 137, 203.[768] A. Stanislaus and B. H. Cooper, Catal. Rev., 1994, 36, 75.[769] C.-A. Jan, T.-B. Lin and J.-R. Chang, Ind. Eng. Chem. Res., 1996, 35, 3893.[770] E. Guillon, J. Lynch, D. Uzio and B. Didillon, Catal. Today, 2001, 65, 201.[771] T. Kabe, W. Qian, Y. Hirai, L. Li and A. Ishihara, J. Catal., 2000, 190, 191.[772] M. Jacquin, D. J. Jones, J. Rozière, A. J. López, E. Rodríguez-Castellón, J. M. T.
Menayo, M. Lenarda, L. Storaro, A. Vaccari and S. Albertazzi, J. Catal., 2004,228, 447.
[773] R. Navarro, B. Pawelec, J. Trejo, R. Mariscal and J. Fierro, J. Catal., 2000, 189,184.
[774] T.-B. Lin, C.-A. Jan and J.-R. Chang, Ind. Eng. Chem. Res., 1995, 34, 4284.[775] W. Qian, H. Shirai, M. Ifuku, A. Ishihara and T. Kabe, Energy Fuels, 2000, 14,
1205.[776] K. Thomas, C. Binet, T. Chevreau, D. Cornet and J.-P. Gilson, J. Catal., 2002,
212, 63.[777] J.-K. Lee and H.-K. Rhee, J. Catal., 1998, 177, 208.[778] S. Jongpatiwut, Z. Li, D. E. Resasco, W. E. Alvarez, E. L. Sughrue and G. W.
Dodwell, Appl. Catal., A, 2004, 262, 241.[779] F. Alcaide, G. Álvarez, P. L. Cabot, H.-J. Grande, O. Miguel and A. Querejeta,
Int. J. Hydrogen Energy, 2011, 36, 4432.[780] T. Matsui, M. Harada, K. K. Bando, M. Toba and Y. Yoshimura, Appl. Catal.,
A, 2005, 290, 73.[781] N. Toshima, H. Yan and Y. Shiraishi, in Metal Nanoclusters in Catalysis and Ma-
terials Science, ed. B. Corain, G. Schmid and N. Toshima, Elsevier, Amsterdam,2008, p. 49.
[782] Y. Shao-Horn, W. Sheng, S. Chen, P. Ferreira, E. Holby and D. Morgan, Top.Catal., 2007, 46, 285.
[783] A. Chen and P. Holt-Hindle, Chem. Rev., 2010, 110, 3767.[784] C. Bianchini and P. K. Shen, Chem. Rev., 2009, 109, 4183.
[785] F. Alcaide, G. Álvarez, P. L. Cabot, O. Miguel and A. Querejeta, Int. J. HydrogenEnergy, 2010, 35, 11634.
[786] R. Inada, K. Shimazu and H. Kita, J. Electroanal. Chem. Interfacial Elec-trochem., 1990, 277, 315.
[787] T. Iwasita, Electrochim. Acta, 2002, 47, 3663.[788] A. Niquille-Röthlisberger and R. Prins, Ind. Eng. Chem. Res., 2007, 46, 4124.
Bibliography 252
Bibliography
[789] M. Ruiz-Vizcaya, O. Novaro, J. Ferreira and R. Gómez, J. Catal., 1978, 51, 108.[790] H. Yasuda, T. Kameoka, T. Sato, N. Kijima and Y. Yoshimura, Appl. Catal., A,
1999, 185, L199.[791] B. Pawelec, R. Mariscal, R. Navarro, S. van Bokhorst, S. Rojas and J. Fierro,
Appl. Catal., A, 2002, 225, 223.[792] K. K. Bando, T. Kawai, K. Asakura, T. Matsui, L. L. Bihan, H. Yasuda,
Y. Yoshimura and S. T. Oyama, Catal. Today, 2006, 111, 199.[793] G. Carturan, G. Cocco, G. Facchin and G. Navazio, J. Mol. Catal., 1984, 26,
375.[794] R. W. J. Scott, A. K. Datye and R. M. Crooks, J. Am. Chem. Soc., 2003, 125,
3708.[795] G. Bernardotto, F. Menegazzo, F. Pinna, M. Signoretto, G. Cruciani and
G. Strukul, Appl. Catal., A, 2009, 358, 129.[796] A. Niquille-Röthlisberger and R. Prins, J. Catal., 2006, 242, 207–216.[797] S. Elangovan, C. Bischof and M. Hartmann, Catal. Lett., 2002, 80, 35.[798] M. Bonarowska and Z. Karpiński, Catal. Today, 2008, 137, 498.[799] E. Blomsma, J. Martens and P. Jacobs, J. Catal., 1997, 165, 241.[800] R. Strobel, J.-D. Grunwaldt, A. Camenzind, S. Pratsinis and A. Baiker, Catal.
Lett., 2005, 104, 9.[801] T. Fujikawa, K. Idei, K. Ohki, H. Mizuguchi and K. Usui, Appl. Catal., A, 2001,
205, 71.[802] Y. Yoshimura, M. Toba, T. Matsui, M. Harada, Y. Ichihashi, K. Bando, H. Ya-
suda, H. Ishihara, Y. Morita and T. Kameoka, Appl. Catal., A, 2007, 322, 152.[803] M. Harada, K. Asakura, Y. Ueki and N. Toshima, J. Phys. Chem., 1992, 96,
9730.[804] G. Guisbiers, G. Abudukelimu and D. Hourlier, Nanoscale Res. Lett., 2011, 6,
1–5.[805] Y. Liu, M. Chi, V. Mazumder, K. L. More, S. Soled, J. D. Henao and S. Sun,
Chem. Mater., 2011, 23, 4199.[806] S.-M. Hwang, C. H. Lee, J. J. Kim and T. P. Moffat, Electrochim. Acta, 2010,
55, 8938.[807] N. Castillo, R. Pérez, M. Martínez-Ortiz, L. Díaz-Barriga, L. García and
A. Conde-Gallardo, J. Alloys Compd., 2010, 495, 453.[808] K. Persson, A. Ersson, K. Jansson, J. Fierro and S. Järås, J. Catal., 2006, 243,
14.[809] A. Lebon, A. García-Fuente, A. Vega and F. Aguilera-Granja, J. Phys. Chem.
C, 2012, 116, 126.[810] F. Calvo, Faraday Discuss., 2008, 138, 75.[811] P. L. Hansen, A. M. Molenbroek and A. V. Ruban, J. Phys. Chem. B, 1997, 101,
1861.[812] J. Rousset, A. Cadrot, L. Lianos and A. Renouprez, Eur. Phys. J. D, 1999, 9,
425.[813] F. Bernardi, G. H. Fecher, M. C. M. Alves and J. Morais, J. Phys. Chem. Lett.,
2010, 1, 912.
Bibliography 253
Bibliography
[814] L. D. Lloyd, R. L. Johnston and S. Salhi, J. Comput. Chem., 2005, 26, 1069.[815] F. Bernardi, A. Traverse, L. Olivi, M. C. M. Alves and J. Morais, J. Phys. Chem.
C, 2011, 115, 12243.[816] I. Moysan, V. Paul-Boncour, S. Thiébaut, E. Sciora, J. Fournier, R. Cortes,
S. Bourgeois and A. Percheron-Guégan, J. Alloys Compd., 2001, 322, 14.[817] J. Seweryn and A. Lewera, J. Power Sources, 2012, 205, 264.[818] H. Jiang, H. Yang, R. Hawkins and Z. Ring, Catal. Today, 2007, 125, 282.[819] J. Xu, L. Ouyang, G.-J. Da, Q.-Q. Song, X.-J. Yang and Y.-F. Han, J. Catal.,
2012, 285, 74.[820] M. P. Humbert, L. E. Murillo and J. G. Chen, ChemPhysChem, 2008, 9, 1262.[821] M. Lukaszewski, K. Hubkowska and A. Czerwinski, Phys. Chem. Chem. Phys.,
2010, 12, 14567.[822] M. Kaneeda, H. Iizuka, T. Hiratsuka, N. Shinotsuka and M. Arai, Appl. Catal.,
A, 2009, 90, 564.[823] A. Niquille-Röthlisberger and R. Prins, Catal. Today, 2007, 123, 198.[824] T. Fujikawa, K. Tsuji, H. Mizuguchi, H. Godo, K. Idei and K. Usui, Catal. Lett.,
1999, 63, 27–33.[825] S. Thiebaut, A. Bigot, J. Achard, B. Limacher, D. Leroy and A. Percheron-
Guegan, J. Alloys Compd., 1995, 231, 440.[826] J. D. Clewley, J. F. Lynch and T. B. Flanagan, J. Chem. Soc., Faraday Trans.,
1977, 73, 494.[827] M. Calleja, C. Rey, M. M. G. Alemany, L. J. Gallego, P. Ordejón, D. Sánchez-
Portal, E. Artacho and J. M. Soler, Phys. Rev. B, 1999, 60, 2020.[828] V. Shah and D. G. Kanhere, Phys. Rev. B, 2009, 80, 125419.[829] D. Yuan, X. Gong and R. Wu, Phys. Rev. B, 2007, 75, 085428.[830] D. Yuan, X. Gong and R. Wu, Phys. Rev. B, 2008, 78, 035441.[831] F. R. Negreiros, G. Barcaro, Z. Kuntová, G. Rossi, R. Ferrando and A. Fortunelli,
Surf. Sci., 2011, 605, 483.[832] J. Goniakowski, Phys. Rev. B, 1998, 58, 1189.[833] B. Pauwels, G. Van Tendeloo, W. Bouwen, L. Theil Kuhn, P. Lievens, H. Lei
and M. Hou, Phys. Rev. B, 2000, 62, 10383.[834] C. Duriez, C. Henry and C. Chapon, Surf. Sci., 1991, 253, 190.[835] X. Wang, N. S. Venkataramanan, H. Kawanami and Y. Ikushima, Green Chem.,
2007, 9, 1352.[836] L. Kesavan, R. Tiruvalam, M. H. A. Rahim, M. I. bin Saiman, D. I. Enache,
R. L. Jenkins, N. Dimitratos, J. A. Lopez-Sanchez, S. H. Taylor, D. W. Knight,C. J. Kiely and G. J. Hutchings, Science, 2011, 331, 195.
[837] J. K. Edwards, A. Thomas, A. F. Carley, A. A. Herzing, C. J. Kiely and G. J.Hutchings, Green Chem., 2008, 10, 388.
[838] A. Sandoval, A. Gómez-Cortés, R. Zanella, G. Díaz and J. M. Saniger, J. Mol.Catal. A: Chem., 2007, 278, 200.
[839] V. E. Henrich, The Surface Science of Metal Oxides, Cambridge University Press,Cambridge, 1994.
[840] C. Duriez, C. Chapon, C. Henry and J. Rickard, Surf. Sci., 1990, 230, 123.
Bibliography 254
Bibliography
[841] L. M. Molina and B. Hammer, Phys. Rev. B, 2004, 69, 155424.[842] J. Goniakowski, Phys. Rev. B, 1998, 57, 1935.[843] K. Judai, S. Abbet, A. S. Wörz, U. Heiz, L. Giordano and G. Pacchioni, J. Phys.
Chem. B, 2003, 107, 9377.[844] L. Giordano, A. D. Vitto, G. Pacchioni and A. M. Ferrari, Surf. Sci., 2003, 540,
63.[845] I. Yudanov, G. Pacchioni, K. Neyman and N. Rösch, J. Phys. Chem. B, 1997,
101, 2786.[846] G. Renaud, A. Barbier and O. Robach, Phys. Rev. B, 1999, 60, 5872.[847] S. Giorgio, C. Henry, C. Chapon and J. Penisson, J. Cryst. Growth, 1990, 100,
254.[848] C. Li, R. Wu, A. J. Freeman and C. L. Fu, Phys. Rev. B, 1993, 48, 8317.[849] A. Sanchez, S. Abbet, U. Heiz, W.-D. Schneider, H. Häkkinen, R. N. Barnett
and U. Landman, J. Phys. Chem. A, 1999, 103, 9573.[850] C. Goyhenex and C. Henry, J. Electron. Spectrosc. Relat. Phenom., 1992, 61, 65.[851] K. Yamamoto, Y. Kasukabe, R. Takeishi and T. Osaka, J. Vac. Sci. Technol. A,
1996, 14, 327.[852] L. Xu, G. Henkelman, C. T. Campbell and H. Jónsson, Phys. Rev. Lett., 2005,
95, 146103.[853] J. Goniakowski and C. Mottet, J. Cryst. Growth, 2005, 275, 29.[854] C. R. Henry, Surf. Sci. Rep., 1998, 31, 231.[855] C. T. Campbell, Surf. Sci. Rep., 1997, 27, 1.[856] E. Aprà, R. Ferrando and A. Fortunelli, Phys. Rev. B, 2006, 73, 205414.[857] S. Olivier, R. Conte and A. Fortunelli, Phys. Rev. B, 2008, 77, 054104.[858] T. Kizuka and N. Tanaka, Phys. Rev. B, 1997, 56, R10079.[859] C. Chapon, C. Henry and A. Chemam, Surf. Sci., 1985, 162, 747.[860] N. W. Ashcroft and N. D. Mermin, Solid State Physics, Harcourt College Pub-
lishers, New York, 1976.[861] L. B. Garmon and D. L. Doering, Thin Solid Films, 1983, 102, 141.[862] K. Heinemann, T. Osaka, H. Poppa and M. Avalos-Borja, J. Catal., 1983, 83,
61.[863] G. Haas, A. Menck, H. Brune, J. V. Barth, J. A. Venables and K. Kern, Phys.
Rev. B, 2000, 61, 11105.[864] R. Ferrando, G. Barcaro and A. Fortunelli, Phys. Rev. Lett., 2009, 102, 216102.[865] W. C. Conner and J. L. Falconer, Chem. Rev., 1995, 95, 759.[866] C. Becker and C. Henry, Surf. Sci., 1996, 352-354, 457.[867] H. Fornander, L.-G. Ekedahl and H. Dannetun, Surf. Sci., 1999, 441, 479.[868] C. R. Henry, C. Chapon and C. Duriez, J. Chem. Phys., 1991, 95, 700.[869] L. Piccolo, C. Becker and C. R. Henry, Appl. Surf. Sci., 2000, 164, 156.[870] P. Nolte, A. Stierle, O. Balmes, V. Srot, P. van Aken, L. Jeurgens and H. Dosch,
Catal. Today, 2009, 145, 243.[871] L. Piccolo and C. R. Henry, Surf. Sci., 2000, 452, 198.[872] L. Piccolo and C. R. Henry, Appl. Surf. Sci., 2000, 162Ð163, 670.
Bibliography 255
Bibliography
[873] L. Piccolo and C. R. Henry, J. Mol. Catal. A: Chem., 2001, 167, 181.[874] H. Fornander, J. Birch, P. Sandström and J.-E. Sundgren, Thin Solid Films,
1999, 349, 4.[875] I. Deliy, N. Maksimchuk, R. Psaro, N. Ravasio, V. D. Santo, S. Recchia, E. Pauk-
shtis, A. Golovin and V. Semikolenov, Appl. Catal., A, 2005, 279, 99.[876] C. Henry, C. Chapon, C. Goyhenex and R. Monot, Surf. Sci., 1992, 272, 283.[877] J. Goniakowski, A. Jelea, C. Mottet, G. Barcaro, A. Fortunelli, Z. Kuntová,
F. Nita, A. C. Levi, G. Rossi and R. Ferrando, J. Chem. Phys., 2009, 130,174703.
[878] R. Ferrando and A. Fortunelli, J. Phys.: Condens. Matter, 2009, 21, 264001.[879] G. Rossi, C. Mottet, F. Nita and R. Ferrando, J. Phys. Chem. B, 2006, 110,
7436.[880] L. Giordano, J. Goniakowski and G. Pacchioni, Phys. Rev. B, 2001, 64, 075417.[881] F. R. Negreiros, Z. Kuntová, G. Barcaro, G. Rossi, R. Ferrando and A. Fortunelli,
J. Chem. Phys., 2010, 132, 234703.[882] J. Goniakowski, C. Mottet and C. Noguera, Phys. Status Solidi B, 2006, 243,
2516.[883] http://www.cinam.univ-mrs.fr/mottet/param/metalMgO.pdf.[884] http://www.bear.bham.ac.uk.[885] W. Fa, J. Zhou, X. Li and J. Dong, J. Phys. Chem. C, 2010, 114, 13035.
offspring are produced per generation); crossover type =
1-point weighted cut-and-splice (the cut position is calculated
based on the fitness values of the parents); selection = roulette
wheel; mutation rate = 0.1; mutation type = mutate_move;
maximum number of generations = 400. 100 GA runs were
performed for each composition. The GA was terminated
when the population was found to have converged for 10
consecutive generations.
Table 1 Comparison of the average,DFT-fit and exp-fitGupta potential parameters.11 For the average potential, the homonuclear parameters aretaken from Cleri and Rosato,12 while in the other potentials they are fitted along with the heteronuclear parameters
Parameter
Pd–Pd Au–Au Pd–Au
average DFT-fit exp-fit average DFT-fit exp-fit average DFT-fit exp-fit
Table 2 The potential parameters for parameter set: I [symmetric weighting (w) of all parameters]; II [symmetric weighting (ws) of A and x]; andIII [antisymmetric weighting (wa) of A and x]
(0.1841) and xDFT-fit (1.7867) B xwa= 0.9 (1.7828).
These correlations are consistent with the overall results for
34- and 38-atom PdAu clusters, that show the DFT-fit poten-
tial giving similar results of excess energies and lowest energy
structures and homotops to those for wa = 0.8. The exp-fit
potential also gives similar excess energies to the results for
wa = 0.8, though the shape of the curve is a little different—
but the structures and homotops are often quite different to the
results from parameter set III. This is not surprising, since, as
noted previously,11 the exp-fit parameters are qualitatively very
different. In particular we note that for the exp-fit potential:
APdAu > APdPd and AAuAu; xPdAu > xPdPd and xAuAu.
We have shown, therefore, that a simple asymmetrical
weighting (parameter set III) of the Pd–Au pair (A) and
many-body (x) energy scaling parameters in the Gupta poten-
tial can qualitatively reproduce the energetic, structures and
chemical ordering of the DFT-fit potential. As the next step in
this research, we will select new, low-energy structures and
homotops arising from set III that were not found in previous
Fig. 13 Chemical order parameter (s) for PdAu-34 using parameter sets I (a), II (b), and III (c) and for PdAu-38 using sets I (d), II (e), and III (f).
8618 | Phys. Chem. Chem. Phys., 2010, 12, 8607–8619 This journal is �c the Owner Societies 2010
Dow
nloa
ded
by U
nive
rsity
of
Bir
min
gham
on
23 S
epte
mbe
r 20
11Pu
blis
hed
on 1
2 Ju
ly 2
010
on h
ttp://
pubs
.rsc
.org
| do
i:10.
1039
/C00
4044
D
work11 and we will carry out DFT re-minimisations in order to
evaluate how they compare with those obtained previously.
Finally, since it is known that the Gupta potential typically
underestimates bulk surface energies,3 in future work, we will
also address the effect of modifying the potential, so as to
reproduce Pd, Au and Pd–Au surface energies accurately, on
the structures and chemical ordering of Pd–Au clusters.
Acknowledgements
RI is grateful to Universiti Pendidikan Sultan Idris and the
Ministry of Higher Education (Malaysia) for the award of a
PhD scholarship. Calculations were performed on the Univer-
sity of Birmingham’s BueBEAR high-performance computer.59
The authors acknowledge Profs Riccardo Ferrando and
Alessandro Fortunelli for helpful discussions and RI is grateful
to Dr Oliver Paz-Borbon for his initial help in running the
BCGA program.
References
1 R. L. Johnston, Atomic and Molecular Clusters, Taylor & Francis,London, 2002.
2 T. P. Martin, Phys. Rep., 1996, 273, 199.3 F. Baletto and R. Ferrando, Rev. Mod. Phys., 2005, 77, 371.4 R. Ferrando, J. Jellinek and R. L. Johnston, Chem. Rev., 2008,108, 845.
5 D. Schebarchov and S. Hendy, Phys. Rev. B: Condens. MatterMater. Phys., 2006, 73, 121402.
6 M. Jose-Yacaman, M. Marın-Almazoc and J. A. Ascencio, J. Mol.Catal. A: Chem., 2001, 173, 61.
7 D. M. P. Mingos, J. Chem. Soc., Dalton Trans., 1996, 561.8 J. A. Ascencio, C. Gutierrez-Wing, M. E. Espinosa, M. Marın,S. Tehuacanero, C. Zorrilla and M. Jose-Yacaman, Surf. Sci.,1998, 396, 349.
9 C. L. Cleveland, U. Landman, T. G. Schaaff, M. N. Shafigullin,P. W. Stephens and R. L. Whetten, Phys. Rev. Lett., 1997, 79,1873.
10 H. B. Liu, U. Pal, A. Medina, C. Maldonado and J. A. Ascencio,Phys. Rev. B: Condens. Matter Mater. Phys., 2005, 71, 075403.
11 F. Pittaway, L. O. Paz-Borbon, R. L. Johnston, H. Arslan,R. Ferrando, C. Mottet, G. Barcaro and A. Fortunelli, J. Phys.Chem. C, 2009, 113, 9141.
12 F. Cleri and V. Rosato, Phys. Rev. B: Condens. Matter, 1993, 48,22.
13 A. F. Lee, C. J. Baddeley, C. Hardacre, R. M. Ormerod,R. M. Lambert, G. Schmid and H. West, J. Phys. Chem., 1995,99, 6096.
14 H. Bonnemann, U. Endruschat, B. Tesche, A. Rufınska,C. W. Lehmann, F. E. Wagner, G. Filoti, V. Parvulescu andV. I. Parvulescu, Eur. J. Inorg. Chem., 2000, 819.
15 V. I. Parvulescu, V. Parvulescu, U. Endruschat, G. Filoti,F. E. Wagner, C. Kubel and R. Richards, Chem.–Eur. J., 2006,12, 2343.
16 E. Gross, I. Popov and M. Asscher, J. Phys. Chem. C, 2009, 113,18341.
17 M. O. Nutt, J. B. Hughes and M. S. Wong, Environ. Sci. Technol.,2005, 39, 1346.
18 N. Toshima, T. Yonezawa and K. Kushiashi, J. Chem. Soc.,Faraday Trans., 1993, 89, 2537.
19 J. K. Edwards, B. E. Solsona, P. Landon, A. F. Carley, A. Herzing,C. J. Kiely and G. J. Hutchings, J. Catal., 2005, 236, 69.
20 D. I. Enache, J. K. Edwards, P. Landon, B. Solsona-Espriu,A. F. Carley, A. A. Herzing, M. Watanabe, C. J. Kiely,D. W. Knight and G. Hutchings, Science, 2006, 311, 362.
21 D. H. Turkenburg, A. A. Antipov, M. B. Thathagar,G. Rothenberg, G. B. Sukhorukov and E. Eiser, Phys. Chem.Chem. Phys., 2005, 7, 2237.
22 Y. F. Han, J. H. Wang, D. Kumar, Z. Yan and D. W. Goodman,J. Catal., 2005, 232, 467.
23 M. Chen, D. Kumar, C. W. Yi and D. W. Goodman, Science,2005, 310, 291.
24 L. O. Paz-Borbon, A. Gupta and R. L. Johnston, J. Mater. Chem.,2008, 18, 4154.
25 L. O. Paz-Borbon, R. L. Johnston, G. Barcaro and A. Fortunelli,J. Chem. Phys., 2008, 128, 134517.
26 L. O. Paz-Borbon, R. L. Johnston, G. Barcaro and A. Fortunelli,J. Phys. Chem. C, 2007, 111, 2936.
27 R. P. Gupta, Phys. Rev. B: Condens. Matter, 1981, 23, 6265.28 C. Massen, T. V. Mortimer-Jones and R. L. Johnston, J. Chem.
Soc., Dalton Trans., 2002, 4375.29 A. J. Renouprez, J. L. Rousset, A. M. Cadrot, Y. Soldo and
L. Stievano, J. Alloys Compd., 2001, 328, 50.30 J. L. Rousset, L. Stievano, F. J. Cadete Santos Aires, C. Geantet,
A. J. Renouprez and M. Pellarin, J. Catal., 2001, 202, 163.31 D. Bazin, D. Guillaume, C. Pichon, D. Uzio and S. Lopez, Oil Gas
Sci. Technol., 2005, 60, 801.32 A. Fortunelli and G. Barcaro, personal communication.33 R. Ismail and R. L. Johnston, unpublished work.34 R. Hultgren, P. D. Desai, D. T. Hawkins, M. Gleiser and
K. K. Kelley, Values of the Thermodynamic Properties of BinaryAlloys, American Society for Metals, Metals Park, Ohio, 1973.
35 R. L. Johnston, Dalton Trans., 2003, 4193.36 M. M. Mariscal, N. A. Oldani, S. A. Dassie and E. P. M. Leiva,
Faraday Discuss., 2008, 138, 89.37 L. B. Hansen, P. Stoltze, J. K. Norskov, B. S. Clausen and
W. Niemann, Phys. Rev. Lett., 1990, 64, 3155.38 M. Itoh, V. Kumar, T. Adschiri and Y. Kawazoe, 2009, ar
Xiv:0902.0080.39 J. Jellinek and E. B. Krissinel, Theory of Atomic and Molecular
Clusters, Springer-Verlag, Berlin, 1999.40 F. Aguilera-Granja, A. Vega, J. Rogan, X. Andrade and
41 G. Rossi, A. Rapallo, C. Mottet, A. Fortunelli, F. Baletto andR. Ferrando, Phys. Rev. Lett., 2004, 93, 105503.
42 J. L. Rousset, J. C. Bertolini and P. Miegge, Phys. Rev. B: Condens.Matter, 1996, 53, 4947.
43 M. Mandal, S. Kundu, S. K. Ghosh and T. J. Pal, J. Photochem.Photobiol., A, 2004, 167, 17.
44 A. Henglein, J. Phys. Chem. B, 2000, 104, 6683.45 H. B. Liu, U. Pal, A. Medina, C. Malonado and J. A. Ascencio,
Phys. Rev. B: Condens. Matter Mater. Phys., 2005, 71, 075403.46 H. B. Liu, U. Pal, R. Perez and J. A. Ascencio, J. Phys. Chem. B,
2006, 110, 5191.47 W. R. Tyson and W. A. Miller, Surf. Sci., 1977, 62, 267.48 A.R. Miedema, Z. Metallkd., 1978, 69, 287.49 A. Rapallo, G. Rossi, R. Ferrando, A. Fortunelli, B. C. Curley,
L. D. Lloyd, G. M. Tarbuck and R. L. Johnston, J. Chem. Phys.,2005, 122, 194308.
50 D. T. Tran and R. L. Johnston, Phys. Chem. Chem. Phys., 2009,11, 10340.
51 D. Yuan, X. Gong and R. Wu, Phys. Rev. B: Condens. MatterMater. Phys., 2007, 75, 085428.
52 D. Yuan, X. Gong and R. Wu, Phys. Rev. B: Condens. MatterMater. Phys., 2008, 78, 035441.
53 J. E. Huheey, Inorganic Chemistry: Principles of Structure andReactivity, Harper & Row, New York, 1983.
54 G. Rossi, R. Ferrando, A. Rapallo, A. Fortunelli, B. C. Curley,L. D. Lloyd and R. L. Johnston, J. Chem. Phys., 2005, 122,194309.
55 K. Luo, T. Wei, C. W. Yi, S. Axnanda and D. W. Goodman,J. Phys. Chem. B, 2005, 109, 23517.
56 S. J. Mejia-Rosales, C. Fernandez-Navarro, E. Prez-Tijerina,D. A. Blom, L. F. Allard and M. Jose-Yacaman, J. Phys. Chem.C, 2007, 111, 1256.
57 M. Jose-Yacaman, E. Perez-Tijerina and S. J. Mejıa-Rosales,J. Mater. Chem., 2007, 17, 1035.
58 C. W. Yi, K. Luo, T. Wei and D. W. Goodman, J. Phys. Chem. B,2005, 109, 18535.
59 http://www.bear.bham.ac.uk.
This journal is �c the Owner Societies 2010 Phys. Chem. Chem. Phys., 2010, 12, 8607–8619 | 8619
Dow
nloa
ded
by U
nive
rsity
of
Bir
min
gham
on
23 S
epte
mbe
r 20
11Pu
blis
hed
on 1
2 Ju
ly 2
010
on h
ttp://
pubs
.rsc
.org
| do
i:10.
1039
/C00
4044
D
ISSN 2040-3364
www.rsc.org/nanoscale Volume 5 | Number 2 | 21 January 2013 | Pages 445–824
2040-3364(2013)5:2;1-M
COMMUNICATION
Raston et al.Shear induced formation of carbon and boron nitride nano-scrolls
Dow
nloa
ded
on 2
1 D
ecem
ber
2012
Publ
ishe
d on
21
Dec
embe
r 20
12 o
n ht
tp://
pubs
.rsc
.org
| do
i:10.
1039
/C2N
R90
111K
View Article OnlineView Journal | View Issue
DFT study of the structures and energetics of 98-atom
AuPd clusters†
Alina Bruma,a Ramli Ismail,bc L. Oliver Paz-Borbon,bd Haydar Arslan,e
Giovanni Barcaro,f Alessandro Fortunelli,f Z. Y. Lia and Roy L. Johnston*b
The energetics, structures and segregation of 98-atom AuPd nanoclusters are investigated using a genetic
algorithm global optimization technique with the Gupta empirical potential (comparing three different
potential parameterisations) followed by local minimizations using Density Functional Theory (DFT)
calculations. A shell optimization program algorithm is employed in order to study the energetics of the
highly symmetric Leary Tetrahedron (LT) structure and optimization of the chemical ordering of a
number of structural motifs is carried out using the Basin Hopping Monte Carlo approach. Although
one of the empirical potentials is found to favour the LT structure, it is shown that Marks Decahedral
and mixed FCC-HCP motifs are lowest in energy at the DFT level.
Introduction
Bimetallic nanoparticles (“nanoalloys”)1 have received consid-
erable attention for their unique properties, which are different
from those of pure clusters2,3 especially in the domain of
nanocatalysis.4–9 Gold–palladium (AuPd) nanoparticles are one
of the most attractive systems because of their promising
activity in catalysis.10 This superior performance has been
widely attributed to electronic and/or geometric effects.11,12
Previous experimental studies have emphasized that it is
possible to design various congurations of the same catalyst
mutate_move; number of generations ¼ 400; the number of GA
runs for each composition is 100. This high number of GA runs
is necessary due to the relatively large size of clusters and the
presence of homotops.
For selected compositions, homotop optimization has been
performed using the Basin Hopping Monte Carlo algorithm30,31
allowing only Pd–Au atom exchange moves,31–33 for a xed
structural conguration and composition. Typically, for each
size and composition, a search of 50 000 steps at kBT ¼ 0.05 eV
has been performed, followed by a nal renement of 20 000
steps at kBT ¼ 0.01 eV.
The 98-atom Leary Tetrahedron (LT) cluster is of interest as it
has been discovered by Leary and Doye as the GM for the 98-
atom Lennard-Jones cluster (LJ98).35 Furthermore, this structure
has also been proposed as the lowest in energy for 98-atom
silver clusters, described by the Sutton-Chen (SC) potential and
for an aggregate of C60 molecules.36 Paz-Borbon et al. have
established that the LT is the preferred structure over a wide
compositional range for 98-atom Pd–Pt clusters at the Gupta
potential level.22 A shell optimization program has been used to
generate all possible high symmetry Leary Tetrahedron (LT)
isomers, in order to assess how stable this structure is for 98-
atom AuPd clusters. A substantial reduction in the search space
is obtained if all sets of symmetry-equivalent atoms (i.e. ‘atomic
shells’ or orbits of the Td point group) in the LT structure are
constrained to be of the same chemical species.34 This reduces
the number of inequivalent compositional and permutational
isomers (homotops) to 2S where S is the total number of atomic
shells. The 98-atom LT has S ¼ 9 shells (in order of increasing
distance from the centre of the clusters these shells contain
4 : 12 : 12 : 12 : 4 : 6 : 12 : 12 : 24 atoms) resulting in a total of
29 ¼ 512 LT isomers.22
DFT calculations were carried out using the Plane Wave Self
Consistent Field (PWscf) code in Quantum Espresso (QE).27
Calculations were made using the Perdew–Burke–Ernzerhof
(PBE)28 exchange-correlation functional and ultraso pseudo-
potentials. Following convergence and accuracy tests, the
following parameters have been selected: values of 40 and 160
Ry (1Ry ¼ 13.606 eV) were used as the energy cut-off for the
Fig. 1 Structural evolution with size of AuPd nanoparticles deposited via physical vapor deposition on amorphous carbon substrate and annealed at 473 K for 2 hours.
Various morphologies of AuPd nanoparticles can be observed as size increases, from alloy to Janus structures.
This journal is ª The Royal Society of Chemistry 2013 Nanoscale, 2013, 5, 646–652 | 647
Paper Nanoscale
selection of the plane-wave basis set for the description of the
wave function and the electron density respectively. Eigenvalues
and eigenstates of the Kohn–Sham Hamiltonian have been
calculated at the Gamma point only of a cubic cell of side of
approximately 20 A, applying a Gaussian smearing technique
with a broadening of the one-particle levels of 0.03 eV. The DFT
local relaxations were performed by fully relaxing the coordi-
nates of the metal atoms until the forces were smaller than
0.1 eV A%1.
Energetic analysis
The potential energy of a cluster calculated at the Gupta level,
Vclus, can be written as:
Vclus ¼ %NEGuptab (4)
where N is the total number of atoms in the cluster and EGuptab is
the binding energy per atom of the cluster. For a xed size
of bimetallic clusters, the excess energy (mixing energy),
DGuptaN calculated at the empirical level is a useful quantity,
described as in eqn (5).25
DGuptaN ¼ E
GuptaN ðPdmAunÞ %m
EGuptaN ðPdmÞ
N% n
EGuptaN ðAunÞ
N(5)
here, EGuptaN (PdmAun) represents the total energy of a given
cluster calculated at the Gupta level and EGuptaN (Pdm) and
EGuptaN (Aun) represent the total energies of the GM of the pure
metal clusters.
The excess energy quanties the energy of mixing (the energy
associated with alloying) between two different metals. The
most negative values of the excess energy indicate the presence
of compositions for which mixing between the two metals is
most favourable18,29 and thus more stable clusters. At the DFT
level, the calculated total potential energy of a cluster is Eclusand the total energy of a single atom is Eatom (corresponding to
the atom type present in the cluster, Pd or Au). The average
binding energy of a pure N-atom cluster is:
Eb ¼ Eatom %Eclus
N(6)
The average binding energy of a bimetallic cluster is then
given by:
EDFTb ¼ %
1
N
%
Eclus %mEPdatom % nEAu
atom
&
(7)
wherem, n, EPdatom and EAuatom are the numbers of Pd and Au atoms
in the cluster and the energies of a single atom of Pd and Au
respectively. N¼m + n represents the total number of atoms in a
given cluster.
Results and discussions
The energetics of the 98-atom AuPd clusters have been investi-
gated using a combination of BCGA and Basin Hopping Monte
Carlo (BHMC) approaches for all the three Gupta potentials.
First, the potential energy surface (PES) has been investigated
using a GA search for all compositions, PdmAu98%m; then the
BHMC approach has been employed in order to optimize the
chemical ordering corresponding to the structures located
around the minima of the excess energy curves.
Gupta potential with DFT-t parameters
In Fig. 2, the DFT-t potential excess energy curve is shown in
blue. The lowest values of the excess energy have been found in
the compositional range Pd39Au59–Pd59Au39, indicating that
these are relatively stable structures. The vast majority of
compositions in the range Pd34Au54–Pd74Au42 are Marks Deca-
hedron (M-Dh) structures (see Fig. 3 at Pd98). Several other
structural families such as Ino Decahedron (Ino-Dh) (e.g.
Fig. 2 Excess energy for 98-atom PdmAu98%m clusters determined for the: DFT fit
(blue curve), Exp-fit (red curve) and Average (green curve) Gupta potentials.
648 | Nanoscale, 2013, 5, 646–652 This journal is ª The Royal Society of Chemistry 2013
Nanoscale Paper
transition from In-Ico to Ino-Dh or M-Dh appears on the le
side of the minimum excess energy (i.e. biased towards pure
Au), from Pd47Au51 to Pd24Au64 with exceptions including
Pd32Au66 and Pd45Au53 (In-Ico) and Pd37Au61 with an FCC-HCP
structure (see ESI S2†). The Au98 cluster has an FCC-HCP
structure, whereas Pd98 is FCC-like. These structures are shown
in Fig. 3 along with other interesting motifs.
Gupta potential with Average parameters
The excess energy for the Average potential is plotted in Fig. 2
(green curve). Compared with the other two potentials, the
values of the excess energies are noticeably less negative and the
shape of the curve is quite different. The minimum excess
energy is found for Pd32Au66. This is an interesting structure, as
the 32 Pd atoms sit in the centre of an In-Ico conguration,
surrounded by a shell of Au atoms (Fig. 3). Also (see ESI S3†), we
notice that Dh structures are predominantly encountered for
Pd-rich compositions and there is a general trend of a transition
to In-Ico and Dh clusters for Au-rich compositions. From a
structural point of view, the pure Au98 cluster has a low
symmetry Dh structure, whereas Pd98 has a M-Dh structure. As
we increase the concentration of Au, the Au atoms tend to
occupy surface sites forming patches distributed over the
cluster surface. Another interesting cluster is Pd62Au36 which
has a structure based on a fragment of the Leary Tetrahedron
(Fig. 3).
It is interesting to note that both DFT-t and Exp-t Gupta
potentials offered a larger degree of mixing between Pd and Au,
than for the Average Gupta potential. This is conrmed by the
quantication of the homonuclear and heteronuclear bonds, as
shown in ESI S4.† As shown in Table 1, the Exp-t potential has
a pair (repulsive) energy scaling parameter (A) that is larger for
Pd–Au than for either Pd–Pd or Au–Au. This has been shown to
favour layer segregation in PdPt structures, in the paper of
Massen et al.37 However, this potential also has a larger value of
the many-body energy scaling parameter, x, which is greatest for
Pd–Au, favouring heteronuclear mixing.19 The value of the x
parameter will eventually dominate overall, so the tted
potentials should favour more Pd–Au mixing.
Leary Tetrahedron (LT) clusters
Based on previous studies, the LT structure is difficult to nd
using the GA program – in the case of PdPt clusters, it is typi-
cally found about 1% of the time.25 This is probably due to the
existence of a narrower but deeper potential energy basin for the
LT structures. The shell program constraints the structure to be
LT (and in particular the high symmetry isomers and homo-
tops) such that if the shell program nds (for a given compo-
sition) a LT isomer lower in energy than the structure found by
Fig. 3 Structural motifs found for selected PdmAu98%m clusters using the three
Gupta potentials.
Fig. 4 Plot of the LT excess energy as a function of Pd content for high-symmetry
98-atom clusters modeled by the DFT-fit (blue dots), Exp-fit (red dots), Average
(green dots) Gupta potentials.
This journal is ª The Royal Society of Chemistry 2013 Nanoscale, 2013, 5, 646–652 | 649
Paper Nanoscale
the GA it shows that the GA obviously has not found the true
GM. Possibly there could be a lower structure still – or even a
lower symmetry LT – by exchanging positions of unlike atoms.
This possibility has been tested using the BHMC technique,
with exchange-only moves, as carried out for 98-atom Pd–Pt
clusters.25
The excess energy of LT clusters with respect to LT Au98 and
Pd98 clusters are plotted in Fig. 4 as a function of Pd content for
all three Gupta potentials. Aer optimization of the chemical
ordering, the energies of the LT clusters are in close competi-
tion with those of other structural motifs; for example, when
using the Average potential, the LT is found to be the lowest
energy motif over a broad range, around the 50%/50% compo-
sition. Analysis of the LT structures with the lowest excess
energies reveal that they possess segregated PdcoreAushellchemical ordering. Segregation of Au atoms to the surface can
be rationalized in terms of the lower surface energy and cohe-
sive energy of Au. The smaller atomic radius of Pd also favours
Pd occupation of core sites.25,38
DFT relaxation calculations and study of competition between
different structural families
GM structures found at the EP level for compositions Pd46Au52–
Pd52Au46 (i.e. in the region of the minima in the excess energy
curves) were relaxed at the DFT level before the optimization of
the chemical ordering with the BHMC code. The variation of
excess energies as a function of number of Pd atoms, calculated
at the DFT level (DDFT98 ), is shown in Fig. 5.
In contrast to the plots of DGupta98 shown in Fig. 2, which are
quite smooth, the DDFT98 plots are rather jagged, especially for the
isomers produced by the DFT-t and Exp-t potentials. Fig. 5,
shows that the Average potential leads to more negative excess
energies at the DFT level for nearly all compositions compared
to the DFT-t and Exp-t isomers (the exceptions are Pd46Au52,
for which the DFT-t isomer is lower, and Pd51Au47, for which
the Exp-t isomer is lower). As mentioned above, the Average
potential stabilises PdcoreAushell homotops in contrast to the
DFT-t and Exp-t, which prefer more mixed congurations.
This is supported by the quantication of the homonuclear and
heteronuclear bonds, as shown in ESI S4,† as well as the isomers
shown in ESI S5.† It seem therefore that the Exp-t and DFT-t
Fig. 5 DFT excess energies of the ‘putative’ GM for the DFT-fit (blue curve), Exp-
fit (red curve) and Average (green curve) Gupta potentials, in the range Pd46Au52–
Pd52Au46.
Fig. 6 Excess energy plots comparing LT (black), FCC-HCP (blue), M-Dh (green) and In-Ico (red) structural motifs in the range Pd46Au52–Pd52Au46. (a–c) Results of BHMC
optimization of chemical ordering for: (a) DFT-fit; (b) Exp-fit; and (c) Average Gupta potentials. (d) Results of relaxation of Average potential isomers at the DFT level.
650 | Nanoscale, 2013, 5, 646–652 This journal is ª The Royal Society of Chemistry 2013
Nanoscale Paper
potentials overestimate the stability of mixed isomers relative to
DFT calculations.
Fig. 6a–c shows the excess energies aer optimization of
chemical ordering for each of the three Gupta potentials,
starting from the lowest-energy homotops of each structural
motif found in the GA runs (FCC-HCP, M-Dh, In-Ico and LT).
For compositions for which these structural motifs have not
been found by GA and BH, these have been constructed, and
subsequently subjected to BH atom-exchange in order to opti-
mize the chemical ordering.
We have then performed DFT local relaxations on the opti-
mized homotops obtained with the Average potential, with the
DFT excess energies shown in Fig. 6d. This is justiedbecause the
Average potential was earlier shown to yield homotops with the