Army Research Laboratory Aberdeen Proving Ground, MD 2 1005-5066 ARL-TR-2453 April 2001 Theoretical Studies of the Hydrostatic Compression of RDX, HMX, HNIW, and PETN Crystals Dan C. Sorescu Oklahoma State University Betsy M. Rice Weapons andMaterials Research Directorate,ARL. Donald L. Thompson Oklahoma State University Approved for public release; distribution is unlimited.
Transcript
Army Research Laboratory Aberdeen Proving Ground, MD 2 1005-5066
ARL-TR-2453 April 2001
Theoretical Studies of the Hydrostatic Compression of RDX, HMX, HNIW, and PETN Crystals
Dan C. Sorescu Oklahoma State University
Betsy M. Rice Weapons and Materials Research Directorate, ARL.
Donald L. Thompson Oklahoma State University
Approved for public release; distribution is unlimited.
Abstract
A previously developed intermolecular potential for nitramines and several other classes of nitrocompound crystals has been used to investigate the behavior of the energetic materials hexahydro- 1,3,5-trinitro- 1,3,5+trazine (RDX), 1,3,5,7-tetranitro- 1,3,5,7-tetraazacyclo-octane (HMX), 2,4,6,8,10,12-hexanitrohexaazaisowurtzitane (HNIW), and pentaerythritol tetranitrate (PETN) under hydrostatic compression. Isothermal-isobaric molecular simulations (assuming the rigid-molecule approximation) molecular-packing calculations were used to perform the analyses. In the case of the RDX, HMX, and HNIW crystals, the results indicate that the proposed potential model is able to accurately reproduce the changes in the structural crystallographic parameters as functions of pressure for the entire range of pressures that has been investigated experimentally. In addition, the calculated bulk moduli of RDX and HMX were found to be in good agreement with the corresponding experimental results. In the case of the PETN crystal, the crystallographic parameters have been reproduced with an acceptable accuracy at pressures up to about 5 GPa. The larger deviations from the experimental results at greater pressures indicate the limitations of the rigid-molecule model when applied to floppy molecules. The similarity of the results determined in molecular-packing calculations relative to those from molecular dynamics simulations suggest that the former method can be used as an efficient tool for rapid tests of the crystal structure modification under pressure.
Acknowledgments
.
This work was supported by the Strategic Environmental Research and Development
Program (SERDP). Donald L. Thompson gratefully acknowledges support by the U.S. Army
Research Office under grant number DAAG55-98-1-0089. We would like to thank Dr. Alan
Pinkerton (University of Toledo) for providing his experimental results for E-HNIW prior to
Comparison of the Crystallographic Parameters Obtained in MP and NPT-MD Simulations for the a-RDX Crystal With the Experimental Results . . . . . . . . . . . . . . . . . . . . . . . . . . . . . . . . . . . . . . . . . . . . . . . . . .
Comparison of the Crystallographic Parameters Obtained in MP and NPT-MD Simulations for the p-HMX Crystal With the Experimental Results . . . . . . . . . . . . . . . . . . . . . . . . . . . . . .
Comparison of the Crystallographic Lattice Dimensions Obtained in MP and NPT-MD Simulations for the E-HNIW Crystal With the Experimental Results . . . . . . . . . . . . . . . . . . . . . . . . . . . . . . . . . . . . . . . . . . . . . . . . . . . . . . . . .
Comparison of the Crystallographic Parameters Obtained in MP and NPT-MD Simulations for Tetragonal Phase of PETN Crystal With the Experimental Results . . . . . . . . . . . . . . . . . . . . . . . . . . . . . . . . . . . . . . . . . . . . . . . . . .
The Pressure-Volume Dependence for PETN in the Case of Uniaxial Compression Along the a-Axis and c-Axis, Respectively.. . . . . . . . . . . . . . . . . . . . . . . . . . . . . . .
Radial Distribution Functions for COM-COM Pairs as Function of Pressure for (a) a-RDX, (b) p-HMX, (c) E-HNIW, and (d) PETN (Tetragonal Phase) _. . . . . . . . . . . . . . . . . . . . . . . . . . . . . .
4
11
14
16
18
20
22
vii
* . . Vlll
List of Tables
Table
1.
2.
3.
4.
5.
Lattice Parameters Obtained in Crystal Packing and Molecular Dynamics Calculations for the a-RDX Crystal as a Function of Pressure at T = 298 K..
Coefficients of the Quadratic Fits of the Form a0 + alP + azP2 for RDX, HMX, and HNIW and of the Cubic Fit of the Form a,$1 + aiP + a2P2 + asP3) for PETN of the Lattice Constants and Unit Cell Volume as Function of Pressure (GPa) Using Results From the NPT-MD Calculations.. . . . . . . . . . . . . . . . . . . . . . . . . .
Lattice Parameters Obtained in Crystal Packing and Molecular Dynamics Calculations for the p-HMX Crystal as a Function of Pressure at T = 298 K . . . .
Lattice Parameters Obtained in Crystal Packing and Molecular Dynamics Calculations for the E-HNIW Crystal as a Function of Pressure at T = 298 K . . . . . . .
Lattice Parameters Obtained in Crystal Packing and Molecular Dynamics Calculations for the PETN Crystal as a Function of Pressure at T = 298 K . . . . . . . . . . . .
Paae
9
10
13
17
19
ix
X
1. Introduction
New strategies for the development of new energetic materials or deployment of existing
materials in advanced weapons platforms have incorporated technologies that result in cost and
time efficiency. These strategies include modeling and simulation at the various stages in the
developmental process. Modeling and simulation are recognized to be a cost-effective and
efficient means of achieving such goals in any developmental process. Atomistic simulation for
characterization and prediction of physical and chemical behavior of energetic materials
promises to be one of the more powerful and effective modeling methodologies that is
incorporated into the new developmental strategies. Accurate atomistic predictions provide
information of the fundamental mechanisms of processes that determine performance of the
materials. However, the effectiveness of the simulations is limited by the accuracy of the
description of the interaction potential of the models. An attempt has been made to develop
classical models of energetic materials that will accurately reproduce known properties of these
materials. The approach has been to first develop simple potential functions to describe the
interactions between molecules in the crystals, while the overall goal is to enhance these models
such that the accurate description of different complex physical and chemical processes,
including chemical reactions in the condensed phase, can be achieved. Since most of the
processes of interest here are in the condensed phase and involve systems containing large
polyatomic molecules, it is imperative that the interactions are described by simple functions;
otherwise atomistic simulation could become computationally intractable. Such simple functions
have been developed and have been evaluated in a series of studies that predict crystallographic
parameters at ambient conditions [ l-51.
An initial study [l] has shown how an atom-atom (6exp) Buckingham potential with
electrostatic interaction terms in the form of partial charges associated with the atoms of the
molecules can be parameterized to reproduce the experimental crystal structure of the a-form of
the solid explosive, hexahydro-1,3,5,-trinitro-1,3,5+triazine (RDX). This intermolecular
potential was used to simulate the RDX crystal structure in isothermal-isobaric molecular
dynamics (NPT-MD) calculations at ambient pressure and for temperatures ranging from 4.2 to
1
325 K. The results of the simulations indicated very good agreement with experiment, with the
lattice dimensions being within 2% of experiment and almost no rotational or translational
disorder of the molecules in the unit ceil. The space-group symmetry was maintained throughout
the simulations for the average structures. Additionally, the predicted thermal expansion
coefficients were in reasonable agreement with experiment.
The utility of the proposed potential was expanded when it was shown that the same
Buckingham 6-exp potential terms can be used without modification to characterize (through
molecular packing [MP] and NPT-MD simulations) the structures and their thermal dependence
for other nitramine crystals (i.e., 2,4,6,8,10,12-hexanitrohexaazaisowurtzitane [HNIW] [2] and
1,3,5,7-tetranitro- 1,3,5,7-tetraazacyclo-octane [HMX] [3]). Investigations indicate that this
potential predicts accurately not only the crystallographic structures of different phases of these
crystals but also the correct lattice energies and the relative order of stability. Particularly, the
potential indicate the stability order E > fi > y and g > cc > F for the corresponding phases of
HNIW and HMX, in agreement with the experimental measurements [6,7].
More recently, investigations of the transferability of this interaction potential in molecular
simulations of 30 nitramine crystals [4] have been extended. The molecules associated with the
n&amine crystals were chosen as representative examples of acyclic and cyclic nitramines. In
the latter case, different types of mono- and polycyclic nitramines have been included,
particularly crystals of importance in energetic materials. For most of the crystals, the predicted
structural lattice parameters differ by less than 2% from the experimental structures, with small
rotations and practically no translations of the molecules in the asymmetric unit cell.
Finally, studies have expanded to assess whether the interaction potential could be used to
model crystals beyond the class of nitramines. MP calculations have been performed on
51 crystals comprising a wide variety of compounds such as nitroalkanes, nitroaromatics,
canes, hydroxy-nitroderivatives, nitrobenzonitriles, nitrobenzotriazoles, and nitrate esters, such
that a comprehensive test to this potential was achieved [5]. It was shown that, for the majority
2
of these crystals, the potential model accurately reproduces the crystallographic structural and
energetic data determined experimentally. Moreover, in the same study, the temperature
dependence of the crystallographic parameters has been analyzed for two important energetic
crystals, 2,4,6-trinitrotoluene (TNT) in the monoclinic phase and the pentaerythritol tetranitrate
(PETN) crystal in the tetragonal phase. In each case, the results show that, throughout the MD
simulations, the average structures of the crystals maintain the same space group symmetry as
the one determined experimentally and there is a good agreement between the calculated
crystallographic parameters and the experimental values.
The present paper considers another category of tests through which one can assess the
quality of the potentials. In particular, focus is on the analysis of the hydrostatic compression of
some energetic materials and if the structural changes observed experimentally can be described
accurately with the present set of potentials. For this purpose, consideration is given to the case
of the nitramine crystals RDX (cc-phase), HMX (B-phase), and HNIW (&-phase) and the
non-nitramine crystal PETN for which experimental information is available. The configurations
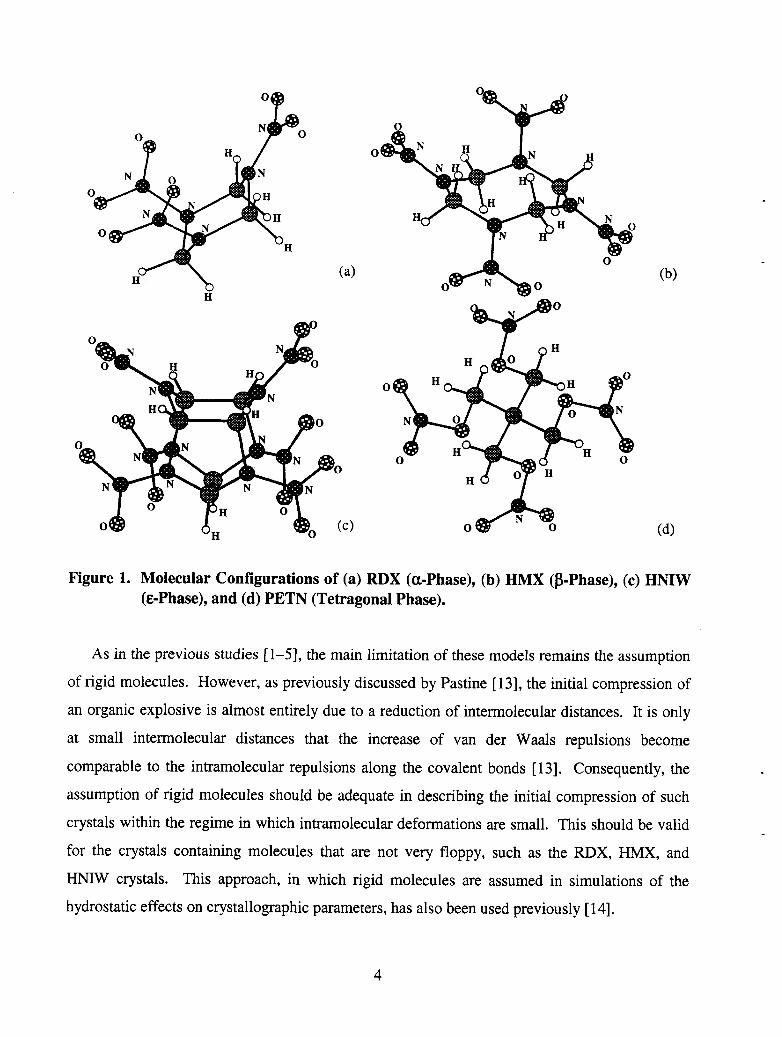
of the molecules corresponding to these are illustrated in Figure 1. As can be seen, RDX and
HMX have monocyclic molecular configurations, HNIW is polycyclic, and PETN is acyclic.
As in the preceding studies [l-5], the previously presented [l] RDX Buckingham potential
was used, plus Coulombic interactions terms obtained through fitting of partial charges centered
on each atom of the molecule (in the experimental arrangement) to a quantum mechanically
derived electrostatic potential [ 81. It has been shown for both the nitramine [4] and
non-nitramine [5] crystals that the best agreement between the calculated and experimental
energies is obtained when the set of charges is determined using methods that employ electron
correlation effects. For example, in the case of a set of 30 nitramine crystals previously analyzed
[4], an average deviation of the Hartree-Fock lattice energies of 12.8% was found from the
corresponding Mdller-Plesset (MP2) [9-121 energies. The use of density functional theory
(B3LYP) to evaluate the electrostatic charges decreases these deviations of the lattice energies to
about 2.6%. Thus, in the present case, the sets of charges were derived using the second-order
Miiller-Plesset (MP2) perturbation theory.
(a) (b)
(4
Figure 1. Molecular Configurations of (a) RDX (cl-phase), (h) HMX @-Phase), (c) HNIW (C-Phase), and (d) PETN (Tetragonal Phase).
As in the previous studies [l-5], the main limitation of these models remains the assumption
of rigid molecules. However, as previously discussed by Pastine [ 131, the initial compression of
an organic explosive is almost entirely due to a reduction of intermolecular distances. It is only
at small intermolecular distances that the increase of van der Waals repulsions become
comparable to the intramolecular repulsions along the covalent bonds [ 131. Consequently, the
assumption of rigid molecules should be adequate in describing the initial compression of such
crystals within the regime in which intramolecular deformations are small. This should be valid
for the crystals containing molecules that are not very floppy, such as the RDX, HMX, and
HNIW crystals. This approach, in which rigid molecules are assumed in simulations of the
hydrostatic effects on crystallographic parameters, has also been used previously [ 141.
4
The organization of the paper is as follows. In section 2, the intermolecular potential used to
simulate the crystals is presented. In section 3, the details of calculations using molecular
packing methods and isothermal-isobaric MD calculations are described. The results of these
calculations are given in section 4. The main conclusions are summarized in section 5.
2. Intermolecular Potential
The intermolecular potential used in the present study is that previously used for nitramine
[4] and non-nitramine [5] crystals. Therefore, only brief details are provided. The
intermolecular interactions between the molecules of the crystal are approximated by using
superpositions of pairwise Buckingham (6-exp) (repulsion and dispersion) and Coulombic
(C) potentials of the form
Vap 09 = Aapexp(-Bapr)-C,/r,6B
and
wlf3 V,“p (r) = - 47t%r ’
(1)
(2)
where r is the interatomic distance between atoms a and p, q,-,. and qp are the electrostatic charges
on the atoms, and EO is the dielectric permittivity constant of vacuum.
The parameters for the 6-exp potential in equation (1) are those previously determined for the
RDX crystal [l]. The heteroatom parameters are calculated from the homoatom parameters
using the same combination rules as previously reported [ 11.
The assignments of the electrostatic charges were made by using the set of atom-centered
monopole charges for the isolated molecule (with the structure fixed at the experimental
5
crystallographic configuration) that best reproduces the quantum mechanically derived
electrostatic potential. The electrostatic potential is calculated over grid points surrounding the
van der Waals surface of the molecules. This method of fitting the electrostatic potential was
proposed by Breneman and Wiberg [8] and is incorporated in the Gaussian 94 package of
programs [ 151 under the keyword CHELPG (electrostatic-potential-derived atomic charges).
These calculations have been done at MP2 theoretical level using a reasonable quality basis set
(i.e., 6-31G** [split-valence plus d-type and p-type polarization functions]) [16].
3. Computational Approach
3.1 Molecular Packing Calculations. Preliminary tests of the capability of the interaction
potential to adequately predict the crystal structural behavior under hydrostatic compression are
performed using molecular packing calculations [ 17, 181, in which the lattice energy of a crystal
is minimized with respect to its structural degrees of freedom. These calculations have been
done using the algorithm proposed by Gibson and Scheraga [ 191 for efficient minimization of the
energy of a fully variable lattice composed of rigid molecules and implemented in the program
LMIN [20]. The nonbonded interactions were attenuated using a cubic spline function from Pa
to Qo, to ensure the continuity of the function and its first derivative. Here (5 is the value of r in
equation (1) at which V&r) = 0 and dV,p(r)/drcO. The parameters P and Q, which specify the
start and the end of the cubic feather (see Sorescu et al. [l] and Desiraju [ 181 for details) were set
to 20.0 and 20.5, respectively. The Coulombic potential terms of the form given in equation (2)
are summed over the lattice using the Ewald technique as previously described [ 11. Finally, the
effect of pressure on the crystallographic parameters has been simulated by adding a potential
term of the form P(V - VO) [21], where VO is the volume of a suitably chosen unit cell at zero
pressure.
3.2 Constant Pressure and Temperature Molecular Dynamics Calculations. A more
comprehensive test of the ability of the interaction potential to predict the crystal structure of the
molecular crystals under hydrostatic compression has been done using constant pressure and
temperature (NPT) molecular dynamics simulations, in which there are no geometric constraints
6
other than the assumption of rigid-body molecules. This method yields average equilibrium
properties of the lattice as functions of temperature and pressure.
.
~ - I I
The Nose-Hoover barostat algorithm [22] has been used as implemented in the program
DL-POLY-2.0,* to simulate the crystals at various temperatures and pressures. In this case, the
equations of motion for both the translation of rigid molecules and the simulation cell are
integrated using the Verlet leap-frog scheme [23]. The molecular rotational motion is handled
using Fincham’s implicit quatemion algorithm [24].
The MD simulation cells consist of boxes containing 3 x 3 x 3, 4 x 2 x 3, 3 x 2 x 3, and
3 x 3 x 4 crystallographic unit cells for the RDX, HMX, HNIW, and PETN crystals,
respectively. These choices of the simulation boxes ensure the use of a cutoff distance for the
intermolecular potentials of about 10 A. For each of the four different molecular crystals, a
simulation corresponding to the lowest pressure was first performed, with the position and
orientation of the molecules in the unit cell initially set to be identical to those for the
experimental structure. The systems were then equilibrated at 298 K and atmospheric pressure.
In all production runs, the total integration time corresponded to 12,000 time steps (1 time
step = 2 x lo-l5 s), of which 2,000 steps were equilibration. The velocities were scaled after
every five steps during the equilibration period so that the internal temperature of the crystal
mimicked the imposed external temperature. Properties were then calculated and accumulated
for averaging over the next 1,0000 integration steps in the simulation. In subsequent runs,
performed at successively higher pressures and a constant temperature of 298 K, the initial
configurations of the molecular positions and velocities were those corresponding to the final
values from the preceding lower-pressure simulation.
The lattice sums were calculated subject to the use of minimum-image periodic boundary
conditions in all dimensions [23]. The interactions were determined between the sites (atoms) in
the simulation box and the nearest-image sites within the cutoff distance. In these calculations,
the Coulombic long-range interaction were handled using Ewald’s method [23].
* DL-POLY is a package of molecular simulation routines written by W. Smith and T. R. Forester, copyright The Council for the Central Laboratory of the Research Councils, Daresbury Laboratory at Daresbury, Nr., Warrington, 1996.
7
The main quantities obtained from these simulations were the average lattice dimensions and
the corresponding volume of the unit cell. Additional information about the structure of the
crystal has been obtained by calculating the center-of-mass (COM)-COM radial distribution
functions (RDF). Such quantities have been calculated from recordings done at every 10th step
during trajectory integrations.
4. Results and Discussions
4.1 RDX Crystal. Crystalline RDX exists in two phases [25]: the ambient phase (a-solid),
for which the structure has been characterized by neutron diffraction measurements [26], and an
unstable phase (p-solid), the crystal structure of which has not been determined. The structure of
a-RDX at room temperature and 1-atm pressure belongs to the orthorhombic space group Pbca
with 2 = 8 molecules per unit cell. The linear and volume compression of RDX have been
investigated by Olinger et al. [27] for pressures up to 9 GPa using a high-pressure x-ray
diffraction technique. It has shown that the ambient RDX polymorph is stable until a pressure of
3.95 GPa. Above this pressure, a new polymorph phase is formed, which remains stable until
9 GPa. The present study does not consider this change to the new polymorphic state, so the
range of pressures investigated is up to 3.95 GPa.
The results of MP and NPT-MD calculations are summarized in Table 1 and compared with
experimental data in Figure 2. At P = 0 the relative differences between the predicted and the
experimental values are very small. By considering as the reference for comparison the results
determined by Olinger et al. [27], the percentage errors for lattice dimensions a, b, and c are
0.64%, 0.47%, and -1.01% for MP results and 1.52%, 1.73%, and 0.12% for the MD-NPT data.
The increase of pressure from 0 to 3.95 GPa does not significantly change the differences
between the predicted and the experimental sets of values. For example, at the largest pressure
considered here (3.95 GPa), the corresponding percent deviations are 0.66%, 2.23%, and 0.29%
for the MP values and 0.9 1 %, 2.60%, and 0.54% for the MD-NPT data. It appears that there is a
slight increase of the deviation from the experimental data with pressure for the b lattice
dimensions only; the relative differences between experiment and predictions of the other lattice
8
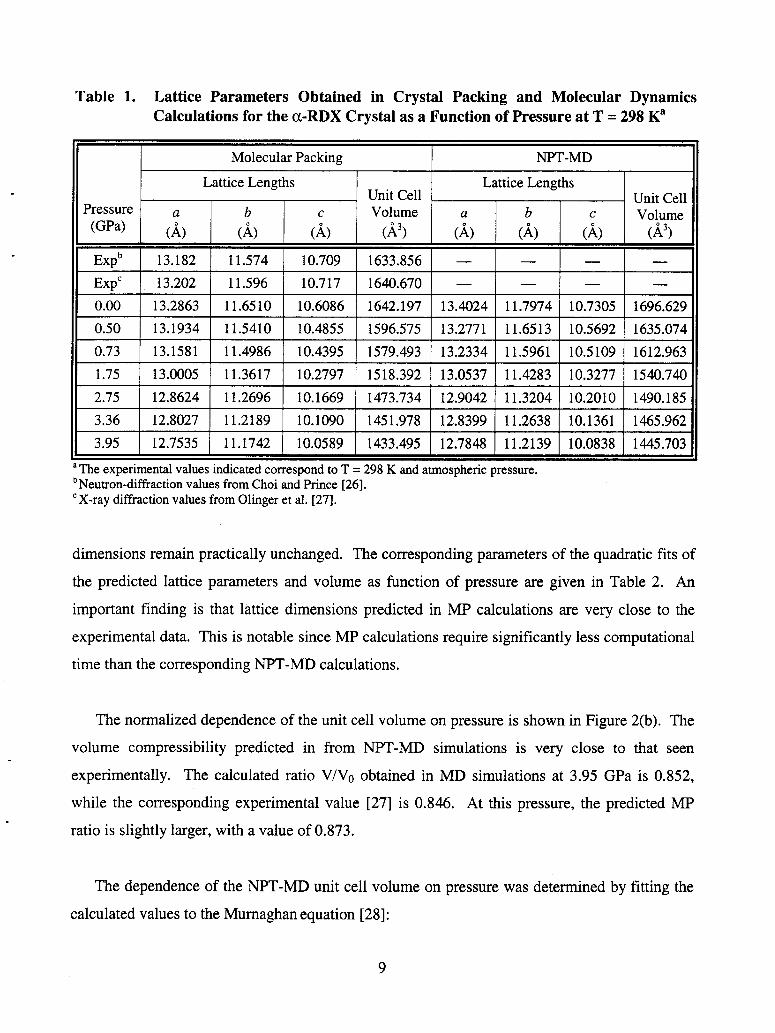
Table 1. Lattice Parameters Obtained in Crystal Packing and Molecular Dynamics Calculations for the a-RDX Crystal as a Function of Pressure at T = 298 Ka
‘X-ray diffraction values from Olinger et al. [27].
dimensions remain practically unchanged. The corresponding parameters of the quadratic fits of
the predicted lattice parameters and volume as function of pressure are given in Table 2. An
important finding is that lattice dimensions predicted in MP calculations are very close to the
experimental data. This is notable since MP calculations require significantly less computational
time than the corresponding NPT-MD calculations.
The normalized dependence of the unit cell volume on pressure is shown in Figure 2(b). The
volume compressibility predicted in from NPT-MD simulations is very close to that seen
experimentally. The calculated ratio V/V0 obtained in MD simulations at 3.95 GPa is 0.852,
while the corresponding experimental value [27] is 0.846. At this pressure, the predicted MP
ratio is slightly larger, with a value of 0.873.
The dependence of the NPT-MD unit cell volume on pressure was determined by fitting the
calculated values to the Murnaghan equation [28]:
9
Table 2. Coefficients of the Quadratic Fits of the Form ao+alP+azP’ for RDX, HMX, and HNIW and of the Cubic Fit of the Form ao(l+alP+&+a@) for PETN of the Lattice Constants and Unit Cell Volume as Function of Pressure (GPa) Using Results From the NPT-MD Calculations? The Calculated Bulk Modulus (Bo), its Pressure Derivative at Zero Pressure (Bo’), and Zero Volume Coefficient Using Equation (3) Are Indicated Together With the Corresponding Experimental Values Where Available
&-HNIW a 8.8956 -0.1215 0.0113 - - - - - b 12.5774 -0.2564 0.0288 - - - - - c 13.5481 -0.2475 0.0257 - - - - - V 1461.6076 -75.4732 8.3433 1463.99 15.58 9.37 - -
- - - 1465.49 14.67 9.93 - -
PETN a0 al a2 a3 vofit Bo Bo’ (A3) (GPa)
bexp B’oexp GW
1 (md) 9.3348 1.552 x lo-’ 1.863 x 1O-3 -0.920 x 1o-4 - - - - - 2 (exp)b 9.3830 -2.052 x lo-’ 2.230 x 1O-3 -1.041 x 1o-4 - - - - - Y (md) 6.6500 -1.921 x 1o-2 2.101 x 1o-3 -1.021 x 1o-4 - - - - - : (exp)b 6.7150 -2.832 x 1O-2 3.295 x 1o-3 -1.458 x 1O-4 - - - - - ir (md) 578.7628 -4.8934 x 1O-2 5.839 x 1O--3 -2.880 x lO-4 582.49 14.09 10.39 9.9” ll.OC
The calculated bulk modulus (Bo), its pressure derivative at zero pressure (Ba’), and zero volume coefficient using equation (3) are indicated together with the corresponding experimental values where available.
b Data from Olinger et al. [27]. ‘Data from Olinger et al. [32].
10
I-
I -
13.5 4 / a)O
< 13.0 .- i
‘8 g 12.5 0 z
12.0 ]
s *g 11.5 - 13 al 11.0 -
2 5 10.5 - -1
10.0 -
4
4
1 fl cl v v v
* 4 4
0 a (EW 0 a (MD) v a Pw v b (EW H b (MD) EI b W’) + c (EW 0 c (MD) A c ww
Pressure (GPa)
1.00 - b) l 0.98 - 0.96 -
0.94 -
0 2t
0.92 -
> 0.90 - v 0.68 -
0.86 -
0.84 -
0.82 -
0.80 _ 0 1 2 3 4 5
Pressure (GPa)
Figure 2. Comparison of the Crystallographic Parameters Obtained in MP and NPT-MD Simulations for the cl-RDX Crystal With the Experimental Results. Dependence of (a) Lattice Dimensions and (b) Volume Compression V/V0 on the External Pressure.
p=p
0
v, B” - ii 1’ -1 . V 1 (3)
In this equation, V is the volume at pressure P, Vo is the fitted volume at P = 0, Bo is the bulk
modulus, and Bb = dB,/dP. The best-fit parameters are given in Table 2. The predicted bulk
modulus and its pressure derivative are very close to the corresponding experimental values with
relative percentage errors of -0.5% and 2.5%, respectively.
11
4.2 HMX Crystal. Crystalline HMX can exist in four polymorphic phases, known as the a,
b, y, and 6 forms [3]. The stable form at room temperature is P-HMX. It has a monoclinic
structure with P2Jn symmetry [29] or alternatively P2i/c, [30, 311 with Z = 2 molecules per unit
cell. Olinger et al. [27] have investigated the structure of the P-phase within P2Jc symmetry
settings for pressures up to 7.47 GPa and have shown that, for this entire pressure range, the
crystal remains stable. In a previous study [3], the thermal expansion properties of the
crystallographic P-phase described within P2Jn symmetry was investigated. In order to
reconcile the two possible settings of the same phase (i.e., with P2i/n or P2i/c symmetries), the
MP and NPT-MD results are presented for both of these symmetries. The corresponding results
are presented in Table 3 and compared to the experimental data in Figure 3. The predicted lattice
dimensions and unit cell volume in NPT-MD simulations at 298 K and zero pressure starting
with the structure with P2i/n symmetry are in extremely good agreement with the corresponding
experimental data. The percent errors for lattice dimensions a, b, c, and unit cell volume are
-19%, -0.72%, 0.64%, and 0.66%, respectively. The corresponding MP results indicate a
similarly good agreement with a maximum deviation of -1.79% for the lattice dimension b and
-1.48% for the unit cell volume. Similar NPT-MD simulations using the structure with the P2ilc
symmetry give results that are slightly less accurate: the maximum deviations are 4.1% for lattice
dimension c and 3.18% for the unit cell volume.
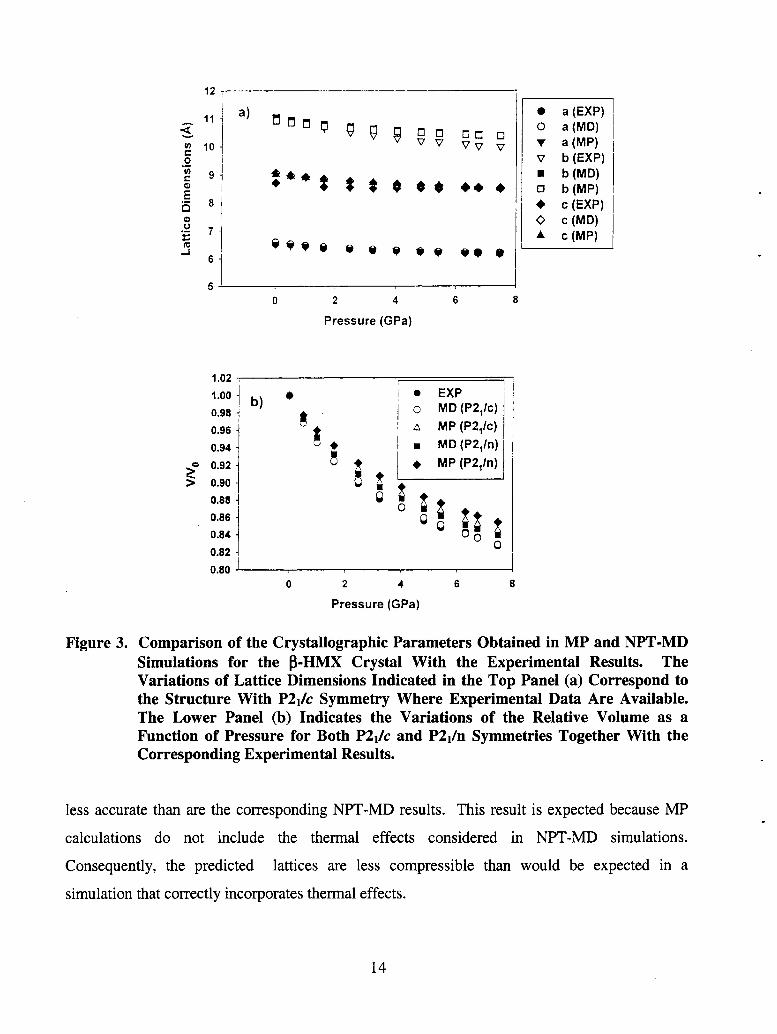
The effect of increasing the pressure on lattice dimensions and volume is also shown in
Figure 3 and Table 3. The results in the upper frame correspond to those obtained from
NPT-MD and MP calculations starting with the structure with the P2Jc symmetry. The
predicted dimensions a and c remain very close to the experimental values, while the b
dimension deviates slightly with the increase of pressure. In Figure 3(b), the variation of the
relative volume V/V0 is compared for both P2ilc and P2i/n symmetries with corresponding
experimental results [27]. The NPT-MD predictions for either space group are in closer
agreement to the experimental result than the MP calculations. For example, the curve V/V0 for
P2i/c is extremely close to the experimental values with a deviation at 7.47 GPa of 0.18%, while,
for the P2i/n setting, the difference of 1.45%. Also, as seen in the RDX calculations, MP
predictions for both lattice dimensions and lattice volume of P-HMX crystal are close but slightly
12
, 1 .
Table 3. Lattice Parameters Obtained in Crystal Packing and Molecular Dynamics Calculations for the p-HMX Crystal as a Function of Pressure at T = 298 K
“Data from Kohno et al. [30] and Choi and Boutin [3 11. ’ Data from Olinger et al. [27].
0 a (EXP) 3
I 1 1
1)
0 a(MD)
2 IO{ v a(MP) 1 0 I v b (EXP) 1
5 ' I
0 2 4 6 8
Pressure (GPa)
0.96 8
- 0.94 t .
0 1 0.92 -
> 0.90 -
0.88 i
0.86
0.84
0.82
0.80 0 2 4 6 8
Pressure (GPa)
Figure 3. Comparison of the Crystallographic Parameters Obtained in MP and NPT-MD Simulations for the B-HMX Crystal With the Experimental Results. The Variations of Lattice Dimensions Indicated in the Top Panel (a) Correspond to the Structure With P2Jc Symmetry Where Experimental Data Are Available. The Lower Panel (b) Indicates the Variations of the Relative Volume as a Function of Pressure for Both P2& and P2& Symmetries Together With the Corresponding Experimental Results.
less accurate than are the corresponding NPT-MD results. This result is expected because MP
calculations do not include the thermal effects considered in NPT-MD simulations.
Consequently, the predicted lattices are less compressible than would be expected in a
simulation that correctly incorporates thermal effects.
14
The bulk modulus and pressure derivative calculated using the results from Table 3 and
equation (3) are given in Table 2. The results are in reasonable agreement with experimental
values, though the variation from experiment is larger for HMX than the RDX results. The P21/c
results are closer to experiment than those determined from the P2l/n results.
4.3 HNIW Crystal. HNIW, a polycyclic nitramine, has been characterized as “the densest
and most energetic explosive known” [33]. It exists in at least five polymorphic states, four of
which are stable at ambient conditions and have been resolved ( a-hydrate, E, p, and r) by x-ray
crystallography [34]. The molecular structure of these polymorphs appears to be that of two
bridged RDX molecules and is similar to that shown in Figure l(c) for the E-phase. The main
differences between the configurations of the different polymorphs are in the orientation of the
nitrogroups relative to the ring. The E polymorph that is considered in this work is the most
stable phase at room temperature [2]. It crystallizes in the P2t/n space group and has 2 = 4
molecules per unit cell [35].
The calculated lattice dimensions at different pressures for this crystal are given in Table 4
and a visual comparison of the experimental data of Pinkerton [35] is given in Figure 4. The
lattice dimensions predicted by MD-NPT and MP simulations are in very good agreement with
the experimental values. For example, at the highest pressure considered experimentally
(2.5 GPa), the deviations from experiment are 1.47%, 1.73%, and 2.17% for the a, b, and c
lattice dimensions, respectively. Also, for this pressure, the calculated volumetric compression
shown in Figure 4(b) is 0.90, while the corresponding experimental value is 0.88. Using the
variation of the unit cell volume given in Table 4 with pressure and equation (3), a bulk modulus
Bo = 15.58 GPa and a pressure derivative Bd = 9.37 have been determined. However, no
experimental values were found against which comparison could be made of these calculated
values.
4.4 PETN Crystal. The final system chosen for assessment of the interaction potential is
the non-nitramine explosive PETN. This system could be considered a more difficult test than
the preceding systems, since the molecular conformation (see Figure l[d]) is much more floppy
15
8 1 I
0 1 2 3 4
Pressure (GPa) 1.02
1.00 - b, a a
I 0 EXP) 0 MDi;
0.98 ' 1 % 1 A MP 1
0.96 g 4 0.94
A
0 a(EXP) 0 a(MD) A a(MP) v b (EXP) + b (MD) 0 b(MP) l c (EXP) 0 c(MD) A c (MP)
2 u A 0.92
” A 0.90
i
: cl A
0 0.88
0
0.86 ' I , I 1 0 1 2 3 4
Pressure (GPa)
Figure 4. .Comparison of the Crystallographic Lattice Dimensions Obtained in MP and NPT-MD Simulations for the E-HNIW Crystal With the Experimental Results. Dependence of (a) Lattice Dimensions and (b) Volume Compression V/V0 on the External Pressure.
than in the previous three systems. This characteristic suggests that the rigid-body
approximation assumed in the simulations might be inadequate. Consequently, it is expected
that predictions of crystallographic parameters for this type of crystal within the constraints of
these simulations will be less accurate than those obtained previously, particularly for the higher
pressure regime.
The experimental investigations have shown that PETN can exist in two different phases: a
tetragonal phase, also called form i [37] and an orthorhombic phase, known as form ii [38]. Both
16
Table 4. Lattice Parameters Obtained in Crystal Packing and Molecular Dynamics Calculations for the E-HNIW Crystal as a Function of Pressure at T = 298 K
Molecular Packing NPT-MD Lattice Lengths Unit Cell Lattice Lengths Unit Cell
b Data obtained from Pinkerton [36] by extrapolation to P = 0.
previous experimental results [39] and theoretical values [5] indicate that the tetragonal phase is
the most stable. Therefore, in this study, the phase that crystallizes in space group P421c and
has Z = 2 molecules per unit cell (form i) is analyzed. The results of our MP and NPT-MD
calculations are given in Table 5 and shown in Figure 5.
The isothermal linear and volume compression of tetragonal PETN has been previously
investigated by Olinger et al. [32] for pressures up to 10 GPa using an x-ray diffraction
technique. The pressure dependence of the experimental lattice dimensions and unit cell volume
as represented in Figure 5 were fitted using a cubic polynomial in pressure powers given in
Table 2 [32]. In the same table, the corresponding best-fit parameters obtained are given based
on predicted NPT-MD data given in Table 5. The two sets of fitted parameters have similar
values, indicating an acceptable agreement between the experimental and predicted lattice
dimensions. A more direct comparison is given in Figure 5(a), where both MD and MP lattice
dimensions are represented together with experimental values. In the region of low pressure
(~4 GPa), the agreement is very good with relative errors of -0.35% and -0.67% for the
17
6.0
0 2 4 6 8 10
Pressure (GPa)
1.05 -
1.00 b)
- 9
0.95 _ % l 8 l F;
g 0.90 - l .gg .* 0.85 _ l a 0.80 _ 0.75 2
0 2 4 6
Pressure (GPa)
Figure 5. Comparison of the Crystallographic Parameters Obtained in MP and NPT-MD Simulations for Tetragonal Phase of PETN Crystal With the Experimental Results. Dependence of (a) Lattice Dimensions and (b) Volume Compression V/V0 on the External Pressure.
a and c lattice dimensions and -1.44% for the unit cell volume. In addition, as indicated in Table
5, the lattice dimensions a and b remain equal (within the errors of simulation), while the cell
angles (not shown) remain approximately 90.0” in agreement with the tetragonal symmetry of the
lattice. By increasing the pressure from 0 to 9 GPa, it can be seen in Figure 5 that the predicted
lattice dimensions are very close to the experimental values up to about 6 GPa. For this pressure,
the relative errors are 1.33% and 1.25% for the a and c dimensions. Above 6 GPa, the deviations
of the predicted values from the experiment increase more rapidly, reaching values of -2.08%
18
Table 5. Lattice Parameters Obtained in Crystal Packing and Molecular Dynamics Calculations for the PETN Crystal as a Function of Pressure at T = 298 K
The tests of this potential indicate that the predictions of the crystallographic parameters for
RDX, HMX, and HNIW are very good with lattice dimension errors below 2.2% for RDX, 4.1%
for HMX, and 2.17% for HNIW. Moreover, this potential is able to predict both the changes of
the crystallographic structures with pressure and the bulk moduli and pressure derivatives. For
RDX, the predicted bulk modulus at zero pressure is Bo = 12.93 GPa, while the experimental
value is Boexp = 13.0 GPa. Similarly, for HMX Bo = 14.64 GPa vs. an experimental value Boexp =
13.5 GPa.
21
0 2 4 6 8 10 12
r (4
P=O.OO GPa
I I I I I
0 2 4 6 8 10
r (4
P=O.O GPa
0 2 4 6
r (4
8 10
d)
P=O.O GPa /
0 2 4 6
r (4
8 10
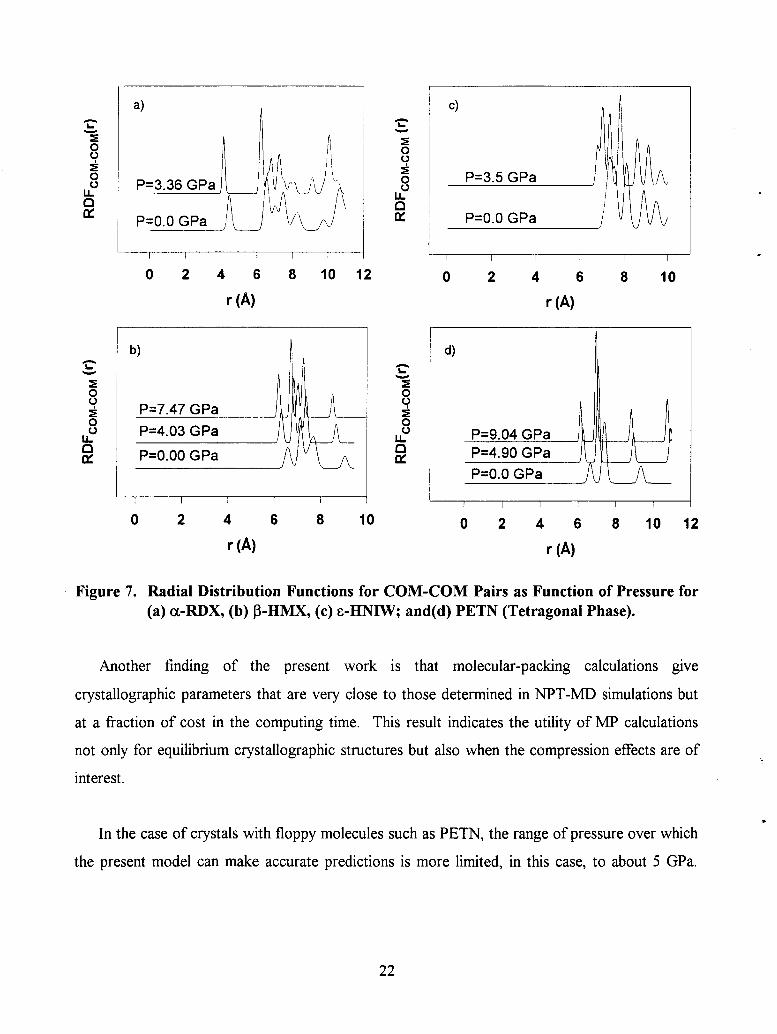
Figure 7. Radial Distribution Functions for COM-COM Pairs as Function of Pressure for (a) CL-RDX, (b) P-HMX, (c) E-HNIW; and(d) PETN (Tetragonai Phase).
Another finding of the present work is that molecular-packing calculations give
crystallographic parameters that are very close to those determined in NPT-MD simulations but
at a fraction of cost in the computing time. This result indicates the utility of MYP calculations
not only for equilibrium crystallographic structures but also when the compression effects are of
interest.
In the case of crystals with floppy molecules such as PETN, the range of pressure over which
the present model can make accurate predictions is more limited, in this case, to about 5 GPa.
22
This result does not represent a limitation of the potential parameters involved but rather
indicates that the rigid molecular model used fails to be valid for such systems.
The success of the present potential energy parameters in describing not only the ambient
equilibrium structures of different crystals with functional groups associated with explosives but
also the effects of external stimuli, such as pressure and temperature, provides significant
incentive to further develop this model by incorporating the intramolecular degree of freedom.
This will be done in future work.
23
l[NTENTIONALLY LEFT BLANK.
24
6. References
1. Sorescu, D. C., B. M. Rice, and D. L. Thompson. Journal of Physical Chemistry B. Vol. 101, p. 798, 1997.
2. Sorescu, D. C., B. M. Rice, and D. L. Thompson. Journal of Physical Chemistry B. Vol. 102, p. 948, 1998.
3. Sorescu, D. C., B. M. Rice, and D. L. Thompson. Journal of Physical Chemistry B. Vol. 102, p. 6692, 1998.
4. Sorescu, D. C., B. M. Rice, and D. L. Thompson. Journal of Physical Chemistry A. Vol. 102, p. 8386, 1998.
5. Sorescu, D. C., B. M. Rice, and D. L. Thompson. Journal of Physical Chemistry A. Vol. 103, p. 989, 1998.
6. Russell, T. P., P. J. Miller, G. J. Piermarini, S. Block, R. Gilardi, and C. George. AD-CO48 931 (92-0134), CPIA Abstract No. 92,0149, ADD604 42. C-D, p.155, Chemical Propulsion Information Agency, Columbia, MD, April 1991.
7. McCrone, W. C. Physics and Chemistry of the Organic Solid State. D. Fox, M. M. Labes, and A. Weissberger (editors), vol. 2, pp. 726-766, New York, NY: Wiley, 1965.
8. Breneman, C. M., and K. B. Wiberg. Journal of Computational Chemistry. Vol. 11, p. 361, 1990.
9. Miiller, C. M. S. Physical Review. Vol. 46, p. 618, 1934.
10. Hehre, W. J., R. Ditchfield, and J. A. Pople. Journal of Chemical Physics. Vol. 56, p. 2257, 1972.
11. Hariharan, P. C., and J. A. Pople. Theoretica Chimica Acta. Vol. 28, p. 213, 1973.
12. Gordon, M. S. Chemical Physics Letters. Vol. 76, p. 163, 1980.
13. Pastine, D., and R. R. Bernecker. Journal ofApplied Physics. Vol. 45, p. 4458, 1974.
14. Sewell, T. D. Journal of Applied Physics. Vol. 83, p. 4142, 1998.
25
15. Frisch, M. J., G. W. Trucks, H. B. Schlegel, P. M. W. Gill, B. G. Johnson, M. A. Robb, J. R. Cheeseman, T. Keith, G. A. Patersson, J. A. Montgomery, K. Raghavachari, M. A. Al-Laham, V. G. Zakrzewski, J. V. Ortiz, J. B. Foresman, J. Cioslowski, B. B. Stefanov, A. Nanyakkara, M. Challacombe, C. Y. Peng, P. Y. Ayala, W. Chen, M. W. Wong, J. L. Andres, E. S. Replogle, R. Gomperts, R. L. Martin, D. J. Fox, J. S. Binkley, D. J. Defrees, J. Baker, J. P. Stewart, M. Head-Gordon, C. Gonzales, and J. A. Pople. Gaussian 94. Revision C.3, Gaussian, Inc., Pittsburgh, PA, 1995.
16. Hariharan, P. C., and J. A. Pople. Theoretica Chimica Actu. Vol. 28, p. 213, 1973.
17. Pertsin, A. J., and A. I. Kitaigorodsky. The Atom-Atom Potential Method, Applications to Organic Molecular Solids. Berlin: Springer-Verlag, 1987.
18. Desiraju, G. R. Crystal Engineering: The Design of Organic Solids. Amsterdam: Elsevier, 1989.
19. Gibson, K. D., and H. A. Scheraga. Journal of Physical Chemistry. Vol. 99, p. 3752, 1995.
20. Gibson, K. D., and H. A. Scheraga. LMIN: A Program for Crystal Packing. QCPE No. 664.
21. Busing, W. R., and M. Matsui. Actu Crystallography. Vol. A40, p. 532, 1984.
22. Melchionna, S., G. Ciccotti, and B. L. Holian. Molecular Physics. Vol. 78, p. 533, 1993.
23. Allen, M. P., and D. J. Tildesley. Computer Simulation ofliquids. New York, NY: Oxford University Press, 1989.
24. Fincham, D. Molecular Simulation. Vol. 8, p. 165, 1992.
25. McCrone, W. C. Analytical Chemistry. Vol. 22, p. 954, 1950.
26. Choi, C. S., and E. Prince. Actu Crystallography. Vol. B28, p. 2857, 1972.
27. Olinger, B., B. Roof, and H. Cady. Symposium International Sur Le Comportement Des Milieux Denses Sous Huutes Pressions Dynamiques. Paris, France, p. 3, 1978.
28. Mumaghan F. D. Finite Deformation of an Elastic Solid, New York, NY: Dover Publications, p.73, 195 1.
29. Cromer, D. T., R. R. Ryan, and D. Schiferl. Journal of Physical Chemistry. Vol. 89, p. 2315, 1985.
30. Kohno, Y., K. Maekawa, N. Azuma, T. Tsuchioka, T. Hashizume, and A. Imamura. Kogyo Kuyuku. Vol. 53, p. 227, 1992 (in Japanese).
26
3 1. Choi, C. S., and H. P. Boutin. Acta Crystallography. Vol. B26, p. 11235, 1970.
32. Olinger, B., P. M. Halleck, and Cady, H. H. Journal of Chemical Physics. Vol. 62, p. 4480, 1975.
33. Miller, R. S. “Decomposition, Combustion and Detonation Chemistry of Energetic Materials.” Materials Research Society Symposium Proceedings, vol. 418, p. 3, T. B. Brill, T. P. Russell, W. C. Tao, and R. B. Wardle (editors), Materials Research Society, Pittsburgh, PA, 1995.
34. Chan, M. L., P. Carpenter, R. Hollins, M. Nadler, A. T. Nielsen, R. Nissan, D. J. Vanderah, R. Yee, and R. D. Gilardi. CPIA Abstract No. X95-071 19, AD D606 761, CPIA-PUB-625, p. 17, April 1995.
35. Gilardi, R. D. Personal communication. 1997.
36. Pinkerton, A. Personal communication. 1999.
37. Trotter, J. Acta Crystallography. Vol. 16, p. 698, 1963.
38. Cady, H. H., and A. C. Larson. Acta Crystallography. Vol. B41, p. 1864, 1975.
39. Blomquist, A. T., and Ryan, J. F., Jr. “Studies Related to the Stability of PETN.” OSRD Report NDRC-B-2566,1944.
40. Kunz, A. B. Materials Research Society Symposium Proceedings. Vol. 418, p. 287, 1996.
27
INTENTIONALLY LEFT BLANK.
28
NO. OF ORGANIZATION COPIES
2 DEFENSE TECHNICAL INFORMATION CENTER DTIC DDA 8725 JOHN J KINGMAN RD STE 0944 FT BELVOIR VA 22060-62 18
I HQDA DAM0 FDT 400 ARMY PENTAGON WASHINGTON DC 203 lo-0460
1 OSD OUSD(A&T)/ODDDR&E(R) RJTREW THE PENTAGON WASHINGTON DC 20301-7100
I DPTY CG FOR RDA US ARMY MATERIEL CMD AMCRDA 500 1 EISENHOWER AVE ALEXANDRIA VA 22333-0001
1 INST FOR ADVNCD TCI-INLGY THE UNIV OF TEXAS AT AUSTIN PO BOX 202797 AUSTIN TX 78720-2797
1 DARPA B KASPAR 370 1 N FAIRFAX DR ARLINGTON VA 22203-1714
1 US MILITARY ACADEMY MATH SC1 CTR OF EXCELLENCE MADN MATH MAJ HUBER THAYER HALL WEST POINT NY 10996-1786
NO. OF COPIES ORGANIZATION
1 DIRECTOR US ARMY RESEARCH LAB Ah4SRL DD 2800 POWDER MILL RD ADELPHI MD 20783-l 197
1 DIRECTOR US ARMY RESEARCH LAB AMSRL CI AI R (RECORDS MGMT) 2800 POWDER MILL RD ADELPHI MD 20783-l 145
3 DIRECTOR US ARMY RESEARCH LAB AMSRL CI LL 2800 POWDER MILL RD ADELPHI MD 20783-l 145
1 DIRECTOR US ARMY RESEARCH LAB AMSRL CI AP 2800 POWDER MILL RD ADELPHI MD 20783-l 197
ABERDEEN PROVING GROUND
4 DIR USARL AMSRL CI LP (BLDG 305)
1 DIRECTOR US ARMY RESEARCH LAB AMSRL D D R SMITH 2800 POWDER MILL RD ADELPHI MD 20783-l 197
29
NO. OF COPIES ORGANIZATION
ABERDEEN PROVING GROUND
22 DIR USARL AMSRL WM
B RINGERS AMSRL WM BD
B E FORCH W R ANDERSON S W BUNTE C F CI-IABALOWSKI A COHEN R DANIEL D DEVYNCK R A FIFER BEHOMAN A J KOTLAR K L MCNESBY M MCQUAID M S MILLER A W MIZIOLEK J B MORRIS R A PESCE-RODRIGUEZ B M RICE R C SAUSA M A SCHROEDER J A VANDERHOFF
AMSRLWMMB B FINK
30
I
1
I
1
1
1
1
1
t
1
1
N
A previously developed intermolecular potential for ninamines and several other classes of nitrocompound crystal! has been used to investigate the behavior of the energetic materials hexahydro-1,3,5-trinitro-1.3,5-s-traxine (RDX) I ,3,5,7-tetranitro-I ,3,5,7-tetraazacyclo-octane (HMX), 2,4,6,8,10,12-hexanitrohexaazaisowurtzitane (HNIW), ant pentaerythritol tettanitrate (PETN) under hydrostatic compression. Isothermal-isobaric molecular simulations (assumiq the rigid-molecule approximation) molecular-packing calculations were used to perform the analyses. In the case of the RDX, HMX, and IIN% crystals, the results indicate that the proposed potential model is able to accurately reproduce the changes in the stnlctural crystallographic parameters as functions of pressure for the entire range of pressures dial has been investigated experimentally. In addition, the calculated buIk moduh of RDX and HMX were found to be ir good agreement with the corresponding experimental results. In the case of the PETN crystal, the crystaIlographic parameters have been reproduced with an acceptable accuracy at pressures up to about 5 GPa. The larger deviatiotn horn the experimental results at greater pressures indicate the limitations of the rigid-molecule model when applied tc floppy molecules. The similarity of the results determined in molecular-packing calculations relative to those fkorr molecular dynamics simulations suggest that the former method can be used as an efficient tool for rapid tests of the :rystal structure modification under pressure.
14. SUBJECT TERMS
nolecular dynamics, molecular packing, RDX. HMX, HNIW. PET’N 15. NUMBER OF PAGES
35 16. PRICE CODE
7. SECURITY CLASSlFlCATlON OF REPORT
UNCLASSIPIED ICkl 7G¶n~,~,Rns5-ln
19. SECURITY CLASSlFlCATlON OF THIS PAGE
UNCLASSIFIED
I 19. SECURITY CLASSIFICATION 20. LIMITATION OF ABSTRACT OF ABSTRACT
UNCLASSIFIED UL Standard Form 298 (Rev. 2891 1h.m. , - - m--e - - - __..___. _. . . . - - - 31
Presmbed by ANSI Std. 239-h 298-102
PETN Crystals
Dan C. Sorescu,*’ Betsy M. Rice, and Donald L. Thompson*
G ORGANUATION NAME(S) AND ADDRESS
U.S. Army Research Laboratory A-l-TN: AMSRL-WM-BD Aberdeen Proving Ground, MD 2 10055066
AGENCY REPORT NUMBER
Strategic Environmental Research and Development Program 901 North Stuart Street Suite 303 Arlington, VA 22203
‘Current mailing address: Deparunent of Chemistry, University of Pittsburgh, Pittsburgh, PA 15260
121. DlSTRlBUTlONlAVAllABlUTY STATEMENT
Approved for public release; distribution is unlimited.
12b. DlSTRlBUTlON CODE
13. ABSTRACT(Maximum 200 WocdsJ
blTENTfONAUY LEFTBLANK.
32
USER EVALUATION SHEET/CHANGE OF ADDRESS
This Laboratory undertakes a continuing effort to improve the quality of the reports it publishes. Your comments/answers to the items/questions below will aid us in our efforts.
1. ARL Report Number/Author ARL-TR-2453 (POC: Rice) Date of Report April 2001
2. Date Report Received
z 3. Does this report satisfy a need? (Comment on purpose, related project, or other area of interest for which the report will be
used.)
4. Specifically, how is the report being used? (Information source, design data, procedure, source of ideas, etc.)
5. Has the information in this report led to any quantitative savings as far as man-hours or dollars saved, operating costs avoided, or efficiencies achieved, etc? If so, please elaborate.
6. General Comments. What do you think should be changed to improve future reports? (Indicate changes to organization,
technical content, format, etc.)
Organization
CURRENT ADDRESS
Name
Street or P.O. Box No.
E-mail Name
City, State, Zip Code
7. If indicating a Change of Address or Address Correction, please provide the Current or Correct address above and the Old or
Incorrect address below.
Organization
OLD ADDRESS
Name
Street or P.O. Box No.
City, State, Zip Code
(Remove this sheet, fold as indicated, tape closed, and mail.) (DO NOT STAPLE)
DEPARTMENT OF THE ARMY
OFFICIAL BUSIHESS
1 BUSINESS REPLY MAIL UNITED STATES
I FIRST CLASS PERMIT NO 0001 ,APG,MD
POSTAGE WILL BE PAID BY ADDRESSEE -
DIRECTOR US ARMY RESEARCH LABORATORY ATTN AMSRL WM BD ABERDEEN PROVING GROUND MD 210054066