hJ Z 0 03 U.I o o uJ Q i 0 III I I i I I I 2 4 6 8 I0 12 14 TIME, MIN FIG. 9. GC of sample collected above a simulated oil spill of Kuwait. Peaks 1 and 2 were collected. o z < z < PEAK 2 e,..gTL, } ff-xvL PEAK I TOL ge I~[ leo, L~OOI 2~00, I 20¢00 . . . . . 1700 14100 . . . . . IlO0 8~)0 ' t 500 ' FREQUENCY, (CM "~) FIG. 10. IR spectra of GC peaks 1 and 2 in Fig. 9. in Fig. 9. We collected various fractions for identification by IR. Spectra of two of the peaks labeled 1 and 2 are shown in Fig. 10. Toluene, o-xylene, and rn-xylene can be identified from the spectra. Both samples also contain a paraffin, possibly branched chain molecules, which we were unable to identify. However, these data satisfied our need to identify the substituted aromatics. III. CONCLUSIONS The activated charcoal cartridges supplied for OSHA analyses are ideally suited for collecting GC eluents. In the present report, we have demonstrated that this method provides adequate samples for analysis by in- frared spectroscopy. However, the same samples could be analyzed by UV-visible, nuclear magnetic resonance, and mass spectroscopy. Furthermore, the method could be easily automated by interfacing the GC detector to a laboratory computer and having the computer operate the merry-go-round device. ACKNOWLEDGMENTS This research was supported by the Environmental Control Division, Depart- ment of Energy [Contract No. E(11-1)-4047]. The authors wish to express their appreciation to the contract monitor, John M. Cece, and the project director, Mason P. Wilson, for their support. We also express our appreciation to Robert J. Obremski for suggesting the use of charcoal tubes and for helpful discussions. 1. D. Welti, "The examination of gas chromatographic fractions by infrared spectroscopy," in Laboratory Methods in Infrared Spectroscopy, R. G. Miller and B. C. Stace, Eds. (Heyden & Son Ltd., Philadelphia, 1972) p. 186. 2. S. K. Freeman, "Gas chromatography and infrared and raman spectrometry," in Ancillary Techniques of Gas Chromatography, L. S. Ettre and W. H. McFadden, Eds. (Interscience, New York, 1969), pp. 227-268. 3. A. A. Casselman and R. A. B. Bannard, J. Chromatogr. 90, 185 (1970). 4. K. H. Norin, Analyst 99, 717 (1974). 5. V. Devek, Anal. Chem. 43, 1909 (1971). 6. I. S. Degen, G. A. Newman, and J. F. Trigg, Lab Pract. 25, 767 (1976). 7. J. W. Amy, E. M. Chain, and W. C. Baitinger, Anal. Chem. 37, 1265 (1965). 8. M. Cartwright and A. Heywood, Analyst 91, 337 (1966). 9. I. A. Fowlis and D. Welti, Analyst 92, 639 (1967). 10. J. Witiak, G. A. Junk, G. V. Calder, J. S. Fritz, and H. J. Svec, J. Org. Chem. 177, 3066 {1973). i1. J. D. Rueda, H. J. Sloane, and R. J. Obremski, Appl. Spectrosc. 31, 298 (1977). 12. D. Goldfarb and C. W. Brown, in preparation. 13. C. W. Brown, P. F. Lynch and M. Ahmadjian, Ind. Res/Develop. 20 (5), 122 (1978). 14. P. F. Lynch and M. M. Brady, Anal. Chem. 50, 1518 (1978). Theory of High Frequency Differential Interferometry: Application to the Measurement of Infrared Circular and Linear Dichroism via Fourier Transform Spectroscopy LAURENCE A. NAFIE and MAX DIEM Department of Chemistry, Syracuse University, Syracuse, New York 13210 A general method for the direct measurement of differential absorption intensities using a Fourier transform infrared spec- Received 30 June 1978; revision received 3 November 1978. trometer is described. The differential intensities must be higher in frequency than the interferogram frequencies and may arise from a periodic variation of the absorption strength of the sample, or by dichroic response of the sample to alternate states 130 Volume 33, Number 2, 1979 APPLIED SPECTROSCOPY
Transcript
hJ
Z 0
03 U.I
o
o uJ
Q
i
0
III
I I i I I I 2 4 6 8 I 0 12 14
T I M E , M I N
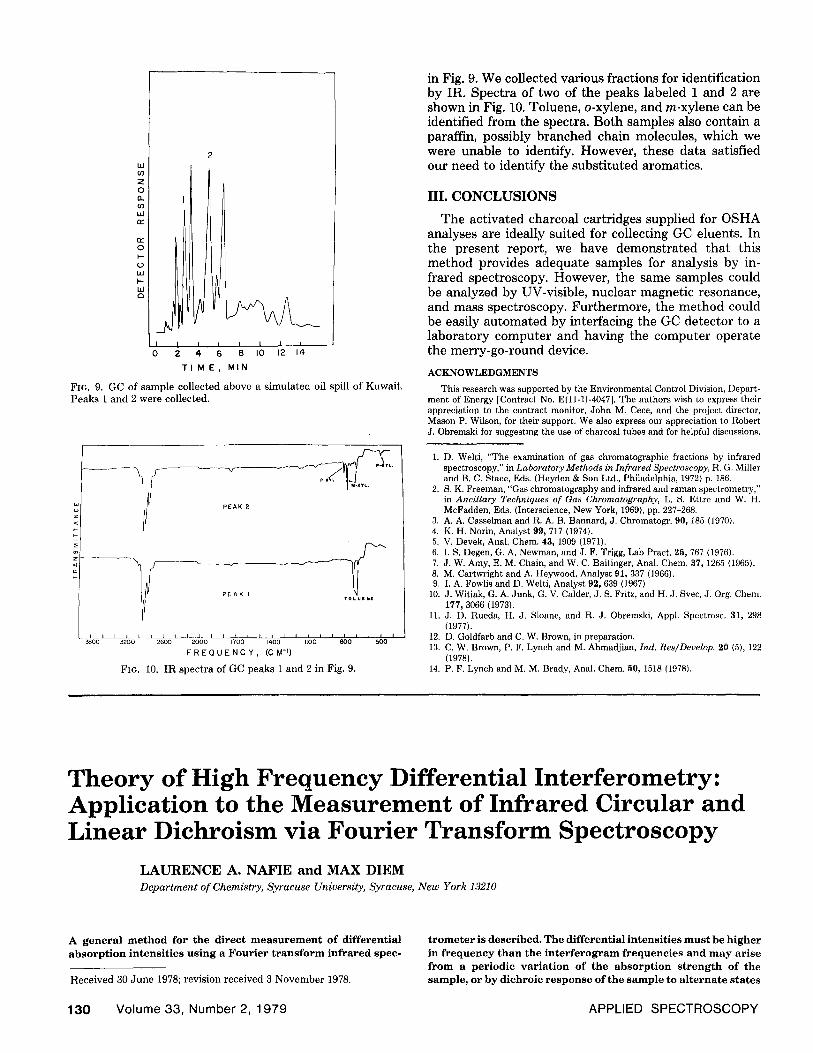
FIG. 9. GC of sample collected above a simulated oil spill of Kuwait. Peaks 1 and 2 were collected.
o z <
z <
PEAK 2
e,..gTL,
} ff-xvL
P E A K I TOL ge I~[
l e o , L ~ O O I 2~00, I 20¢00 . . . . . 1700 14100 . . . . . IlO0 8~)0 ' t 500 '
F R E Q U E N C Y , ( C M "~)
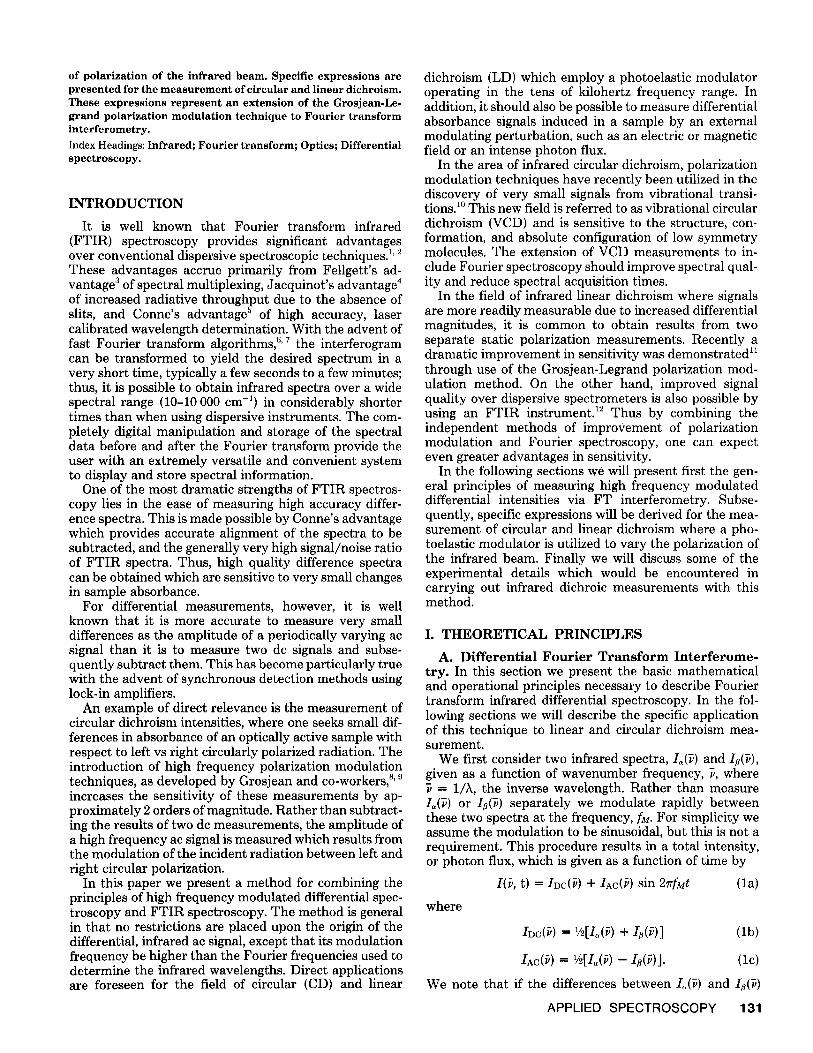
FIG. 10. IR spectra of GC peaks 1 and 2 in Fig. 9.
in Fig. 9. We collected various fractions for identification by IR. Spectra of two of the peaks labeled 1 and 2 are shown in Fig. 10. Toluene, o-xylene, and rn-xylene can be identified from the spectra. Both samples also contain a paraffin, possibly branched chain molecules, which we were unable to identify. However, these data satisfied our need to identify the substituted aromatics.
III. CONCLUSIONS
The activated charcoal cartridges supplied for OSHA analyses are ideally suited for collecting GC eluents. In the present report, we have demonstrated that this method provides adequate samples for analysis by in- frared spectroscopy. However, the same samples could be analyzed by UV-visible, nuclear magnetic resonance, and mass spectroscopy. Furthermore, the method could be easily automated by interfacing the GC detector to a laboratory computer and having the computer operate the merry-go-round device.
ACKNOWLEDGMENTS
This research was supported by the Environmental Control Division, Depart- ment of Energy [Contract No. E(11-1)-4047]. The authors wish to express their appreciation to the contract monitor, John M. Cece, and the project director, Mason P. Wilson, for their support. We also express our appreciation to Robert J. Obremski for suggesting the use of charcoal tubes and for helpful discussions.
1. D. Welti, "The examination of gas chromatographic fractions by infrared spectroscopy," in Laboratory Methods in Infrared Spectroscopy, R. G. Miller and B. C. Stace, Eds. (Heyden & Son Ltd., Philadelphia, 1972) p. 186.
2. S. K. Freeman, "Gas chromatography and infrared and raman spectrometry," in Ancillary Techniques of Gas Chromatography, L. S. Ettre and W. H. McFadden, Eds. (Interscience, New York, 1969), pp. 227-268.
3. A. A. Casselman and R. A. B. Bannard, J. Chromatogr. 90, 185 (1970). 4. K. H. Norin, Analyst 99, 717 (1974). 5. V. Devek, Anal. Chem. 43, 1909 (1971). 6. I. S. Degen, G. A. Newman, and J. F. Trigg, Lab Pract. 25, 767 (1976). 7. J. W. Amy, E. M. Chain, and W. C. Baitinger, Anal. Chem. 37, 1265 (1965). 8. M. Cartwright and A. Heywood, Analyst 91, 337 (1966). 9. I. A. Fowlis and D. Welti, Analyst 92, 639 (1967).
10. J. Witiak, G. A. Junk, G. V. Calder, J. S. Fritz, and H. J. Svec, J. Org. Chem. 177, 3066 {1973).
i1. J. D. Rueda, H. J. Sloane, and R. J. Obremski, Appl. Spectrosc. 31, 298 (1977).
12. D. Goldfarb and C. W. Brown, in preparation. 13. C. W. Brown, P. F. Lynch and M. Ahmadjian, Ind. Res/Develop. 20 (5), 122
(1978). 14. P. F. Lynch and M. M. Brady, Anal. Chem. 50, 1518 (1978).
Theory of High Frequency Differential Interferometry: Application to the Measurement of Infrared Circular and Linear Dichroism via Fourier Transform Spectroscopy
LAURENCE A. NAFIE and MAX DIEM Department of Chemistry, Syracuse University, Syracuse, New York 13210
A g e n e r a l m e t h o d fo r t he d i r ec t m e a s u r e m e n t of d i f fe ren t ia l absorption i n t e n s i t i e s u s i n g a F o u r i e r t r a n s f o r m i n f r a r e d spec-
Received 30 June 1978; revision received 3 November 1978.
t r o m e t e r is desc r ibed . The d i f fe ren t ia l i n t ens i t i e s m u s t be h i g h e r in f r e q u e n c y t h a n the i n t e r f e r o g r a m f r e q u e n c i e s a n d m a y a r i s e f r o m a pe r iod i c v a r i a t i o n o f t he a b s o r p t i o n s t r e n g t h o f t he s amp le , o r by d ich ro ic r e s p o n s e o f t he s a m p l e to a l t e r n a t e s t a t e s
130 Volume 33, Number 2, 1979 APPLIED SPECTROSCOPY
of polarization of the infrared beam. Specific expressions are presented for the measurement of circular and linear dichroism. These expressions represent an extension of the Grosjean-Le- grand polarization modulation technique to Fourier transform interferometry. Index Headings: Infrared; Fourier transform; Optics; Differential spectroscopy.
INTRODUCTION
It is well known that Fourier transform infrared (FTIR) spectroscopy provides significant advantages over conventional dispersive spectroscopic techniques. 1' 2 These advantages accrue primarily from Fellgett's ad- vantage a of spectral multiplexing, Jacquinot's advantage 4 of increased radiative throughput due to the absence of slits, and Conne's advantage ~ of high accuracy, laser calibrated wavelength determination. With the advent of fast Fourier transform algorithms, 6' 7 the interferogram can be transformed to yield the desired spectrum in a very short time, typically a few seconds to a few minutes; thus, it is possible to obtain infrared spectra over a wide spectral range (10-10 000 cm -~) in considerably shorter times than when using dispersive instruments. The com- pletely digital manipulation and storage of the spectral data before and after the Fourier transform provide the user with an extremely versatile and convenient system to display and store spectral information.
One of the most dramatic strengths of FTIR spectros- copy lies in the ease of measuring high accuracy differ- ence spectra. This is made possible by Conne's advantage which provides accurate alignment of the spectra to be subtracted, and the generally very high signal/noise ratio of FTIR spectra. Thus, high quality difference spectra can be obtained which are sensitive to very small changes in sample absorbance.
For differential measurements, however, it is well known that it is more accurate to measure very small differences as the amplitude of a periodically varying ac signal than it is to measure two dc signals and subse- quently subtract them. This has become particularly true with the advent of synchronous detection methods using lock-in amplifiers.
An example of direct relevance is the measurement of circular dichroism intensities, where one seeks small dif- ferences in absorbance of an optically active sample with respect to left vs right circularly polarized radiation. The introduction of high frequency polarization modulation techniques, as developed by Grosjean and co-workers, s' 9 increases the sensitivity of these measurements by ap- proximately 2 orders of magnitude. Rather than subtract- ing the results of two dc measurements, the amplitude of a high frequency ac signal is measured which results from the modulation of the incident radiation between left and right circular polarization.
In this paper we present a method for combining the principles of high frequency modulated differential spec- troscopy and FTIR spectroscopy. The method is general in that no restrictions are placed upon the origin of the differential, infrared ac signal, except that its modulation frequency be higher than the Fourier frequencies used to determine the infrared wavelengths. Direct applications are foreseen for the field of circular (CD) and linear
dichroism (LD) which employ a photoelastic modulator operating in the tens of kilohertz frequency range. In addition, it should also be possible to measure differential absorbance signals induced in a sample by an external modulating perturbation, such as an electric or magnetic field or an intense photon flux.
In the area of infrared circular dichroism, polarization modulation techniques have recently been utilized in the discovery of very small signals from vibrational transi- tions.l° This new field is referred to as vibrational circular dichroism (VCD) and is sensitive to the structure, con- formation, and absolute configuration of low symmetry molecules. The extension of VCD measurements to in- clude Fourier spectroscopy should improve spectral qual- ity and reduce spectral acquisition times.
In the field of infrared linear dichroism where signals are more readily measurable due to increased differential magnitudes, it is common to obtain results from two separate static polarization measurements. Recently a dramatic improvement in sensitivity was demonstrated ~1 through use of the Grosjean-Legrand polarization mod- ulation method. On the other hand, improved signal quality over dispersive spectrometers is also possible by using an FTIR instrument. 12 Thus by combining the independent methods of improvement of polarization modulation and Fourier spectroscopy, one can expect even greater advantages in sensitivity.
In the following sections we will present first the gen- eral principles of measuring high frequency modulated differential intensities via FT interferometry. Subse- quently, specific expressions will be derived for the mea- surement of circular and linear dichroism where a pho- toelastic modulator is utilized to vary the polarization of the infrared beam. Finally we will discuss some of the experimental details which would be encountered in carrying out infrared dichroic measurements with this method.
I. THEORETICAL PRINCIPLES
A. Differential Fourier Trans form Interferome- try. In this section we present the basic mathematical and operational principles necessary to describe Fourier transform infrared differential spectroscopy. In the fol- lowing sections we will describe the specific application of this technique to linear and circular dichroism mea- surement.
We first consider two infrared spectra,/~(~) and I~(~), given as a function of wavenumber frequency, ?, where
= l /h, the inverse wavelength. Rather than measure I,(?) or Iz(?) separately we modulate rapidly between these two spectra at the frequency, fM. For simplicity we assume the modulation to be sinusoidal, but this is not a requirement. This procedure results in a total intensity, or photon flux, which is given as a function of time by
I(~, t) = IDC(~) + IAc(~) sin 2~rfMt (la)
where
IDC(~) = 1~[I,(~) + IZ(~)] (lb)
IAC(~) = 1/2[I,(~) -- IZ(~)]. (lc)
We note that if the differences between/~(?) and Iz(?)
APPLIED SPECTROSCOPY 131
are small compared to their overall magnitude, IDC(~) approximately equals Ia(~) or I/~(~) and may thus be determined by nonmodulation methods. The quantity IAC(~) is the differential spectrum of interest and is meas- ured as the amplitude of the sinusoidal intensity modu- lation at frequency fM. In conventional modulation spec- troscopy the intensity IAC(~) is measured point by point as a function of F, as one scans the spectrum with a dispersive element such as the grating of a monochro- mator. For the sake of subsequent developments it is convenient to establish the relationships of these inten- sity expressions to the nonabsorbing instrumental flux at the sample position which we designate as Io(~). In terms of the decadic absorbance A~(~), the two spectra I,(~) and Iz(~) take the form
/o(v) =/o(v)10 -A#~), p = a, ft. (2)
With these equations the expressions for IDC(~) and IAC(F) become
IDC(~) = ½Io(~)[10 -A~(~ + 10 -n#~)] (3a)
IAC(V) = ½/O(~)[10 -A~("~ -- 10-A#~I]. (3b)
The expressions in square brackets represent the absorp- tive contributions. If desired, the difference spectrum can be expressed directly, in terms of absorbance by writing
AA,~(~) = na(~) - Aa(k). (4)
In most eases the quantity AAoz(~) has a more immediate quantum mechanical significance compared to IAc(~), and we will show subsequently how AA,z(~) can be de- termined from IAC(~) and IDC(~). We next provide the details of how IAC(~) and AA~(~) can be measured using FTIR interferometry.
The action of a movable mirror undergoing uniform translation motion at a velocity, V, in a Michelson inter- ferometer produces a time varying intensity called an interferogram. Due to periodic constructive and destruc- tive phase interference, the infrared radiation at each wavenumber frequency in the interferogram oscillates sinusoidally at its own Fourier frequency given by, 2 V~. An interferogram can be expressed as a function of the retardation, 8, equal to 2 Vt, by the following equation
~0 ~ /o(6) = /O(D cos(2~r~8)d~. (5)
When an absorbing sample is placed in the beam we need to replace/O(~) with I(~), whereupon we may use Eq. (la) to write
At this point we need to place two requirements on the dynamics of the experimental process. First, the modulation frequency, fM, must be at least 1 to 2 orders of magnitude higher than the Fourier frequencies given by 2qr~t~/t. The ..reasons for this requirement involve elec- tronic separation of the modulation frequencies from the Fourier frequencies and will be explained more fully
132 Volume 33, Number 2, 1979
below. Second, the infrared detector must have a re- sponse time on the order of microseconds or faster to follow adequately the high frequency intensity modula- tion at fM.
In order to measure IAC(V), the interferogram signal I(t~) from the detector (which is now a voltage rather than a photon flux) is first fed into a lock-in tuned to fM. The time constant, r, of this lock-in is then set at a minimum value to allow the fluctuations in the amplitude of the fM signal in the Fourier frequency range to pass through. The signal leaving the lock-in is given by
The exponential factor represents the effect of the lock- in amplifier time constant upon the amplitude of the Fourier frequency associated with the wavenumber fre- quency ~. If the argument of the exponential is suffi- ciently small, the effect of the exponential on the spec- trum can be neglected. In addition, if the frequency, fM, is not sufficiently high, then the separation of fM from the Fourier frequencies cannot be accomplished by the demodulation method outlined above. Eq. (7) is a new interferogram containing the spectral information asso- ciated with/AC(V). The large contribution from IDC(V) has been removed by the lock-in amplifier. Fourier transfor- mation of Eq. (7) then yields IDC(~) exp [-(2V~)I"]. Re- moval of the exponential factor can be accomplished by the determination of the effective time constant, z, of the lock-in amplifier, thus isolating the desired spectrum, IAC(V).
In order to determine the differential absorbance spec- trum, hA,a(~), one forms the ratio of IAC(~) to IDC(~). IAC(~) can be determined using a lock-in by the method described above while IDe(V) can be determined by pass- ing the interferogram through a filter to remove the fM frequency term and then taking the Fourier transform. Using previously developed expressions we can write
IAC(V) 10 -ao(~) - 10 -A/~(~)
IDC(V) -- 10 -A~(~) + 10 -A#~)" (8)
Conversion to the natural logarithm base and multipli- cation of the numerator and denominator of Eq. (8) by exp(½ In 10 [Aa(~) + AB(~)]) leads to
IAC(V) IDC(V------) -- tanh {½ In 10[-AAaB(~)]}. (9)
For small values of AA,/~, the hyperbolic tangent may be replaced by its argument (the error is ~1% when hAas = 0.15). Using the notation that AA,~ = -AAz, and also that ½ In 10 ~ 1.15, we have for small values of AA~,
IAC(V) - - ~ 1 .15 A A ~ ( ~ ) . (10) IDC(V)
Thus, we have determined the difference spectrum in terms of absorbance. For large values of AA~, Eq. (9) must be employed, but for those cases it may be no more difficult to determine A~(~) and Aa(F) separately using Eq. (2) and then obtain the difference spectrum by sub- traction.
B. In f r a r ed Circular Dichroism. The construction of a number of infrared circular dichroism spectrometers employing the Grosjean-Legrand modulation technique has recently been reported.~3-~5 The principal application of these spectrometers is the observation of circular dichroism from infrared vibrational transitions, t° al- though infrared electronic transitions have also been investigated) 6 The strength of VCD signals is roughly 4 to 5 orders smaller than the overall absorption strength making the effect difficult to measure. By extending VCD measurements to include FTIR methods, VCD spectral quality is expected to improve over present methods. This improvement may be realized either in increased signal/noise ratio or reduced spectral acquisition time or some combination of the two.
In order to extend the general formalism of the pre- vious section to circular dichroism measurement, one needs to find expressions involving the absorbance spec- tra of an optically active molecule with respect to left and right circularly polarized radiation. These we desig- nate as AL(~) and AR (~). The general intensity expression which arises in the Grosjean-Legrand method is given by
I(v,t) = IDc(v) + Iic(F) sin[cc(F,t)] (11a)
where
IDC(V) = 1/2Io(P)[10 -A'(~) + 10 AL(a)] (l lb)
/Ac(v) = ~A/o(V)[10 ~'(~) - 10 -a'(~)] (llc)
sin[a(F,t)] = sin[ao(P) sin(2~rfit)]. (lld)
Eqs. (11b and 11c) are obvious extensions of Eqs. (lb and lc). The sinusoidal factor in Eq. (11a) represents the action of the modulator as it induces phase retardation in the beam and the magnitude of the intensity variation depends upon the sine of the retardation angle a(F,t). As expressed in Eq. (11d) this angle varies sinusoidally as the modulator oscillates. In addition, the magnitude of retardation for a given stress in the modulator depends linearly on the wavenumber frequency, corresponding to a lower degree of retardation for lower values of F. The angle ao(D corresponds to the maximum retardation amplitude achieved by the modulator at a given > during the course of its oscillation cycle. Eq. (11d) can be further expressed in a series of odd order spherical Bessel func- tions as
sin[ao(F) sin o~Mt] = 2 ~ J~[ao(F)] sin(2~mfit). (12) n,odd
We are concerned with only the first term in this sum- mation which corresponds to the fundamental frequency of the modulator. The higher harmonics are eliminated electronically when the signal I(>,t) is processed by a lock-in amplifier tuned to fM. The resulting total intensity expression which one seeks to measure in circular dichro- ism is given by
The factor of 2Jl[o~o(F)] accounts for the effectiveness of the modulator to produce circularly polarized radiation at various wavenumber frequencies.
A block diagram of the experimental arrangement necessary to measure I(?,t) with a Fourier transform
spectrometer is given in Fig. 1. The only modifications required beyond the capabilities of a conventional FTIR instrument are the placement of a polarizer and a mod- ulator before the sample to produce alternately left and right circularly polarized light and the insertion of a lock- in amplifier tuned to fM between the fast response in- frared detector and the Fourier digital processing elec- tronics.
The mathematical description of the experimental process follows similar lines to those developed in the previous section. Since circular dichroism is defined by
AAcD(v) = AL(F) -- AR(V) . (14)
it is necessary to measure both IAC(F) and IDC(F) and subsequently to take their ratio. This is depicted in Fig. 1 by the two pathways (solid and dashed) through the Fourier electronics. The two spectra can be determined separately, digitally stored in memory, and divided. The overall expression for the interferogram to be processed is analogous to that given previously by Eq. (6) where the appropriate expressions from Eqs. (11) and (13) must be supplied. The two interferograms, corresponding to IDC(~) and IAc(~), which enter the analog-to-digital (A/ D) converter in Fig. 1 are given by
IDc(8) =
and
IAc(~) = f0 =
fo = VJo(F)[10 -A"(~) + 10 -A'(~)] cos(2~r~8)dF
1/2 . . . . . . . . A.(~) iO-A~ (~)] I o ( v ) 2 g i [ a o ( v ) J [ I u - "
FIa. 1. Block diagram for the Fourier transform infrared dichroism spectrometer.
APPLIED SPECTROSCOPY 133
As before the exponential factor arises from the ability of the lock-in, tuned to fM, to respond to intensity varia- tions at the frequency 2V~ when set with an effective time constant, T. Fourier transformation of Eqs. (15) and (16) followed by the division of the former into the latter yields the following expression for the infrared circular dichroism,
ICD(~) = 2Jl[ao(~)] tanh(1/e In 10[AAcD(~)]} (17)
X exp[-(2VDz].
Simplification occurs when it is assumed the hAcD(~) is small (an excellent approximation for VCD signals) and that the product 2V~" is sufficiently small to allow re- placement of the exponential factor by unity, whereupon we can write
ICD(~) = 2Jl[ao(~)J(1.15)AAcD(~). (18)
The value of Jl[ao(~)] as a function of wavenumber can be determined by a straightforward calibration measure- ment which has been described previously. TM In addition, if the exponential factor in Eq. (17) is significant, it will automatically be included in the calibration measure- ment. 1~ The Bessel function varies slowly in the vicinity of its maximum and for spectral measurements involving a relatively small range of frequencies (approximately 500 cm-~), only one setting of the maximum modulation angle, ao, of the modulator will be necessary. Beyond this range, toward lower frequencies, the efficiency of the measurements will be increased by increasing ao and shifting the maximum of Jl(ao) toward lower values of ~. If a VCD measurement is performed over a wide range of wavelengths with a constant setting of the maximal retardation, ao, it may prove advantageous to perform a digital multiplication of the resulting VCD spectrum with the J~ function. In this manner, proper signs of the circular dichroism can be obtained in routine scans over wide wavelength ranges. To maximize the reliability of the VCD, ao should then be reset to a value which Corresponds to a minimum in the previous spectrum.
C. In f r a r ed L inear Dichroism. The difference in absorption of an oriented sample to orthogonal states of linearly polarized light is known as linear dichroism. One alternately measures the polarized absorption parallel and perpeticular to the sample axes and then forms either a difference such as I~ -/JI or A± - All or a dichroic ratio such as A JAil. For most cases experimental differences are on the order of a few percent and can be measured by static, rather than modulation, methods. Applications of this technique extend, for example, to molecular crys- tals, TM stretched polymer fibers, I9 flowing polymer sam- ples, 2° and biological chromophores. 2~
Recently Kusan and Holzwarth 11b obtained the linear dichroism of DNA for various conformations of the phos- phate backbone structure. Their spectra were at least an order of magnitude more sensitive than any previous results due to their use of the Grosjean-Legrand polari- zation modulation method. This was particularly true in the hydrogen stretching region where signals were quite small and would have gone undetected by conventional methods. While this method is sufficient to observe small signals that were previously not detecable, it still lacks some of the advantages of FTIR spectroscopy to enhance
signal/noise ratio and decrease spectral acquisition time. By applying the principles outlined above to linear
dichroism, one can combine all the available advantages into one spectrometer. The expression for the intensity in a linear dichroism experiment is given by
I(~,t) = IDC(P) "-b IAC(~) COS[a(P,t)] (19a)
where
IDC(~) = V2 Io(P)[10 -AH(~) + 10 -al(~)] (19b)
IAC(~) = i~/o(~)[10 -AJ'(~) - 10 -Al(;)] (19c)
cos[a(~,t)] = cos[ao(P) sin(2~rfMt)] (19d)
The experimental arrangement is identical to the circular dichroism experiment where a polarizer and modulator precede the sample and a lock-in amplifier is used to demodulate the high frequency component of the inter- ferogram. The only difference is that the modulator must be set at a higher retardation level, corresponding to a higher value of ao(?), and the lock-in must be tuned to twice the modulation frequency, 2fM. This can be seen by expanding Eq. (19d) as
cos[ao(P) sin fMt] = Jo[ao(P)] (20)
+ ~ 2J~[ao(9)] COS(2~rnfMt). n , e v e n
The term corresponding to n = 0 does not vary in time and is not important here; however, the first term in the summation corresponding to n = 2 provides modulation of the difference spectrum at the frequency, 2fM. The higher terms, n = 4, 6, 8 . . . . are rejected by a lock-in tuned to 2fM SO we are left with
With the same analysis outlined in the previous section it is straightforward to obtain infrared linear dichroism, either as the intensity differential, IAC(~), or an absorb- ance differential, bALD(T), where
bALD ---- A±(~) - All(J) (22)
II. DISCUSSION
Additional details regarding the measurement of FTIR CD and LD signals are as follows. As mentioned above, the experimental arrangement for the measurement of either circular or linear dichroism is depicted in Fig. 1. The only alteration of the optical setup of a commercially available FTIR spectrometer is the insertion of a polar- izer and a modulator before the sample position in order to create the appropriate polarization modulation at the frequency, fM.
For the measurement of IAC(8), as given in Eq. (16), the signal from the preamplifier of the detector is first passed through a bandpass filter centered at fM. This prevents saturation of the lock-in amplifier tuned to fM by the large signal levels at the Fourier frequencies. In order to avoid signal degradation by the RC filter cir- cuitry of the lock-in amplifier [cf. Eq. (16)], the unfiltered mixer output of the phase sensitive detector is fed directly into the filtering circuits of the A/D converter and proc- essed as a normal interferogram signal.
1,34 V o l u m e 33, N u m b e r 2, 1 9 7 9
For the measurement of IDC(8) given in Eq. (15), the signal from the preamplifier is first passed through a lowpass filter to remove any fM modulation frequencies and then sent directly to the A/D converter and its prefiltering stages. This measurement simply provides the ordinary Fourier transform transmission spectrum which is necessary to form the ratio, IAC(8)/IDc(~), which in turn yields the expression Icr~(8) in Eq. (17).
Since differential intensities in the infrared tend to be rather small, as is particularly true for vibrational circular dichroism, a convenient approach is to measure the bi- refringent induced dichroism signals which are used to calibrate the retardation levels of photoelastic modula- tors 22 or the sensitivity of circular and linear dichroism spectrometers,lO, 14.23 For the calibration of CD spectrom- eters, one places a birefringent multiple quarter-wave retardation plate followed by a second polarizer at the sample position. The normalized signal that is obtained is given by l°a' 23
IAC(~) _ 2J1[c~o(~)] sin as(~') sin(2~rfMt) (23)
IDC(~) 1 -- Jo[tXo(~) cos aB(~)
where aB(~) is the retardation of the birefringent plate. Depending on its wavelength, the polarized radiation emerging from the photoelastic modulator experiences an additional retardation from the birefringent plate. The radiation impinging on the second polarizer varies in the extreme cases between radiation polarized parallel and then perpendicular to the axes of the second polarizer during each modulation cycle. Consequently a CD signal of a magnitude similar to the overall transmission is obtained.
The authors have carried out a series of preliminary experiments aimed at the measurement of this large calibration signal using a Digilab Corporation, model FTS-15 Fourier transform spectrometer and the optical and electronic setup depicted in Fig, 1. The results indi- cate that the basic features of the calibration signal have been measured successfully by this method, but the experimental conditions were not optimal and not all aspects of the resulting spectra are currently understood. Improved experiments along this line are being planned and the results of our experimental work will be reported at a later date.
The main thrust of the ideas presented in this paper is
toward the development of a more efficient, if not supe- rior, method of measuring vibrational circular dichroism spectra. With the present dispersive VCD instruments, signal/noise ratios are generally low and spectral acqui- sition times are quite long. 1° Improvement in both of these areas is expected by this new technique.
As mentioned earlier, the general theoretical method outlined in Section I.A should find wide application in other areas of spectroscopy, such as Stark and Zeeman modulation studies, nonlinear acoustics, and photochem- ical spectroscopy induced by fast, repetitive triggering of events.
ACKNOWLEDGMENTS
Acknowledgment is made to the donors of the Petroleum Research Fund administered by the American Chemical Society for partial support of this research. Support from the Research Corporation and the National Science Foundation is also acknowledged. We would also like to thank Syracuse Univer- sity's Office of Graduate Affairs and Research for finanical assistance toward carrying out preliminary measurements.
I. R. J. Bell, Introductory Fourier Transform Spectroscopy (Academic Press, New York, 1972).
2. P. R. Griffiths, Chemical Infrared Fourier Transform Spectroscopy (Wiley, New York, 1975).
3. P. B. Fellgett, J. Phys. Radium 19, 187 (1958). 4. P. Jacquinot, Rep. Prog. Phys. 13, 267 (1960}. 5. J. Connes and P. Connes, J. Opt. Soc. Am. 56, 896 (1966}. 6. J. W. Cooley and J. W. Tukey, Math. Comp. 19, 297 (1965). 7. M. L. Forman, J. Opt. Soc. Am. 56, 978 (1966). 8. M. Grosjean and M. Legrand, C. R. Acad. Sci. {Paris) 251, 2150 (1960). 9. L. Velluz, M. Grosjean, and M. Legrand, Optical Circular Dichroism (Aca-
demic Press, New York, 1965). 10. a. L. A. Nafie, T. A. Keiderling, P. J. Stephens, J. Am. Chem. Soc. 98, 2715
(1976) b. M. Diem, P. J. Gotkin, J. M. Kupfer, A. G. Tindal], and L. A. Nafie, J. Am. Chem. Soc. 99, 8103 (1977), and references therein.
11. a. A. C. Boccara, J. Duran, B. Briat, and P. J. Stephens, Chem. Phys. Lett. 19, 187 (1973) b. T. Kusan and G. Holzwarth, Biochemistry 15, 3352 (1976).
12. K. Krishnan, results in preparation for publication. See also P. C. Painter and J. L. Koenig, J. Polym. Sci. Part A-2 15, 1885 (1977}.
13. M. I. Russel, M. Billardon, and J. P. Badoz, Appl. Opt. 11, 2375 (1972). 14. G. A. Osborne, J. C. Cheng, and P. J. Stephens, Rev. Sci. Instrum. 44, 10
{1973). 15. I. Chabay and G. Holzwarth, Appl. Opt. 14, 454 (1975). 16. I. Chabay, E. C. Hsu, and G. Holzwarth, Chem. Phys. Lett. 15, 211 {1972). 17. In our present measurement we use high and low frequency modulation. If
f,, >> "dc-modulation" frequencies, no problems are encountered. 18. R. Adamowicz and E. Fishman, Spectrochim. Acta A28, 889 (1972). 19. L. Piseri, F. Cabassi, and G. Masseti, Chem. Phys. Lett. 33, 378 (1975). 20. A. Wada, Appl. Spectrosc. Rev. 6, 1 (1972). 21. J. Hofrichter and W. A. Eaton, Annu. Rev. Biophys, Bioeng. 5, 51l (1976). 22. J. C. Cheng, L. A. Nafie, S. D. Allen, and A. I. Braunstein, Appl. Opt. 15, 1960
(1976). 23. J. C. Cheng, L. A. Nafie, and P. J Stephens, J. Opt. Soc. Am. 65, 1031 {1975).