JOURNAL OF RESEARCH of the National Bureau of Standards -A. Physics and Chemistry Vol. 76A, No. 1, January- Februar y 1972 Thermal Analysis of Calcium Sulfate Dihydrate and Supposed a and P Forms of Calcium Sulfate Hemihydrate from 25 to 500 a C James R. Clifton Institute for Applied Technology, National Bureau of Standards, Washington, D.C. 20234 (September 23, 1971) Th ermal studi es were ca rried out on CaSO •. 2H20 and th e s upp ose d a and {3 forms of CaS O •. 1/2 H20 in th e region of 25 to 500 0 C. using differential thermal analysis , th ermogravime tr y, and differ- ential sca nning ca lor imetry me th od s_ Two large e nd othermic e ffec ts an d a sma ll er exoth ermic e ffec t were found in th e differential thermogram of CaS O •. 2H20 while a s in gle e ndoth ermic as we ll as an exothermic e ffe ct were fo und in the th ermo gra ms of the s upposed a a nd {3 form s of CaSO •. 1/2 H2 0. However, th e exotherm of a-CaSO •. 1/2H2 0 had lower pea k a nd first-brea k tempe ratur es than that of the {3 -form. Th e peak and fir sl-break lempera lur es of Ih .. endolhermic e fTec ls IIf CaS O ,· 2 11 , 0 a nd a a nd B-CaSO ,· 1/2 11 ,0 and Ihe cxolhcrmic e ffec t of a-CaSO, . 1/2 1-1, 0 were press ur e depen de nl , s hi fling to lower lemper a- tur es as the gaseous press ure within Ih c DTA cc ll was decr ease d. Th e nOl ed differences in thc th erm o- grills poss ibl y a re due to kinelic fa ctors beca use of the difference s in cr ys ta llinil Y of the s upp osed a- and {3-CaSO• . 1/2H,O. . No differences in th e s upp osed ex and {3 forms of CaS O •. 1/2 H2 0 were detec ted by th e rmogra vI - me tr y a nd differential sca nning ca lorime try studi es . Th e formulation of a two-st ep di ssoc iative process in the complete dehydr a ti on of CaS O •. 2H20 was s upp ort ed by th e res ults of the thermogravime tr y study_ Key words: ex- and {3- CaSO.· 1/2 H2 0; CaSO. · 2H2 0 ; differential sca nning ca lorime tr y; differential thermal ana lysis; th ermogravimetry. 1. Introduction As a part of th e continuing study of gypsum plast er [1] 1 the properties of calcium sulfate dihydrat e (CaS04 - 2H20) and calcium sulfate hemihydrate (CaS04 - l/2H2 0) were studied by differential thermal analysis, thermogravimetry, and differential scanning ca lorimetric techniques_ These investigations were undertaken in order to gain a more complete under- standing of the dehydration processes of CaS04 . 2H2 0 and to attempt to verify the existence of two forms of CaS04 . 1/2H2 0. In addition to the calcium sulfate hydrates, two typ es of anhydrous calcium sulfate exist, hexagonal (y-CaS04) and orthorhombic (8-CaS04) forms [2] . The y form results from the dehydration of the hy- drates and is regarded as the low-te mperature species, although it is apparently metastable and even at room temp eratur e very slowly converts to the "high-tem- perature" species, /3-CaS04 [2]. The main features in the differential thermal analy- sis previously reported for CaS04' 2H2 0 [3-7] are two large endothermic effects occurring below 250°C. and a smaller exotherm found near 400°C. Some other I Fi gures in brac kets indi ca te the lit erature references al the end of this paper. 41 ------- smaller e ffec ts have been reported [61. which were not observed in the prese nt s tudy . There is a lack of cons isten cy in th e valu es reported by different investi- gators for the temp e ratures of the main effects_ This pe rhaps ca n be tra ce d to unc ertainties in the operating parameters of individually constructed instrume nts used in the past, and probably by using modern in- struments of known operational characteristics more consistent results can be obtained. The present differ- ential thermal analysis includes studies at normal atmospheric pressure and has been extended to deter- mine the effects on the thermograms of redu ce d atmospheric pressures within the differential thermal cell, which ha s not been previously unde rtak e n. Only brief studies of the thermo gravigram s of CaS04 . 2H2 0 have been repo rted [8]. Of partic ular inte rest in the thermo gravimetric studies is the possibility of differ- entiating between two dehydration reactions when CaS04 . 2H20 is completely dehydrated. Few , if any, differential scanning calorimetry studies on CaS04' 2H2 0 have been reported previously. The existence of two forms of CaS04 . l/2H2 0, ex and /3, has not been firmly established. Apparent s li ght differences in densities [9 , 10], heats of solutions [9], and gauging water requirements [11] have been cited as evidence for two forms of CaS0 4' 1/2H2 0. The -I
Transcript
JOURNAL OF RESEARCH of the National Bureau of Standards -A. Physics and Chemistry Vol. 76A, No. 1, January-February 1972
Thermal Analysis of Calcium Sulfate Dihydrate and Supposed a and P Forms of Calcium Sulfate Hemihydrate from
25 to 500 a C
James R. Clifton
Institute for Applied Technology, National Bureau of Standards, Washington, D.C. 20234
(September 23, 1971)
Thermal studies were carri ed out on CaSO •. 2H20 and the s upposed a and {3 forms of CaSO •. 1/2 H20 in the region of 25 to 500 0 C. using diffe rential the rmal analysis , thermogravimetry, and diffe rential scanning calorimetry methods_
Two la rge endothermic effects and a sma lle r exothermic effect were found in the differential the rmogram of CaSO •. 2H20 while a s ingle e ndothermic as well as an exothermic effec t were found in the thermograms of the supposed a a nd {3 form s of CaSO •. 1/2 H20. However, the exothe rm of a-CaSO •. 1/2H20 had lower peak and firs t-break te mperatures than that of the {3-form. The peak and fir sl-break le mperalures of Ih .. e ndolhe rmic e fTec ls IIf CaS O ,· 211 , 0 a nd a a nd B-CaSO ,· 1/2 11, 0 and Ihe cxolhc rmi c effec t of a-CaSO, . 1/2 1-1, 0 were pressure de pende nl , s hi fling to lower lemperatures as the gaseous press ure within Ih c DTA cc ll was decreased. The nOl ed differences in thc th ermogrill s poss ibl y a re due to kinelic fac tors beca use of the differences in cr ys ta llinil Y of the s upposed a- and {3-CaSO • . 1/2H, O. .
No diffe rences in the supposed ex and {3 forms of CaSO •. 1/2 H20 were de tected by thermogravIme try and differenti al scanning calorimetry studi es . The formulation of a two-step dissociative process in the complete dehydration of CaSO •. 2H20 was supported by the results of the thermograv im etry study_
As a part of the continuing study of gypsum plaster [1] 1 the properties of calcium sulfate dihydrate (CaS04 - 2H20) and calcium sulfate hemihydrate (CaS04 - l/2H20) were studied by differential thermal analysis, thermogravimetry, and differential scanning calorimetric techniques_ These investigations were undertaken in order to gain a more complete understanding of the dehydration processes of CaS04 . 2H20 and to attempt to verify the existence of two forms of CaS04 . 1/2H20.
In addition to the calcium sulfate hydrates, two types of anhydrous calcium sulfate exist, hexagonal (y-CaS04) and orthorhombic (8-CaS04) forms [2]. The y form results from the dehydration of the hydrates and is regarded as the low-temperature species, although it is apparently metastable and even at room temperature very slowly converts to the "high-temperature" species, /3-CaS04 [2].
The main features in the differential thermal analysis previously reported for CaS04' 2H20 [3-7] are two large endothermic effects occurring below 250°C. and a smaller exotherm found near 400°C. Some other
I Figures in brackets indicate the literature references a l the end of this paper.
41
-------
smaller effects have been reported [61. which were not observed in the present study. There is a lack of consistency in the values reported by different investigators for the temperatures of the main effects_ This perhaps can be traced to uncertainties in the operating parameters of individually constructed instruments used in the past, and probably by using modern instruments of known operational characteristics more consistent results can be obtained. The present differential thermal analysis includes studies at normal atmospheric pressure and has been extended to determine the effects on the thermograms of reduced atmospheric pressures within the differential thermal cell, which has not been previously und ertaken. Only brief studies of the thermogravigrams of CaS04 . 2H20 have been reported [8]. Of particular interest in the thermogravimetric studies is the possibility of differentiating between two dehydration reactions when CaS04 . 2H20 is completely dehydrated. Few, if any, differential scanning calorimetry studies on CaS04' 2H20 have been reported previously.
The existence of two forms of CaS04 . l/2H20, ex and /3, has not been firmly established. Apparent slight differences in densities [9 , 10], heats of solutions [9], and gauging water requirements [11] have been cited as evidence for two forms of CaS04 ' 1/2H20. The
-I
l
results of x-ray structural analysis are not at the present conclusive_ Morris [12] found a slight difference in the x-ray powder diffraction patterns between the 0' and f3 forms when the value of 2(} was in the range of 48 to 50°_ The pattern associated with O'-CaS04 - 1/2H20 in this region has triplet character (two slightly resolved small peaks on each side of a larger peak) whereas that of f3-CaS04 - 1/2H20 consists of a broad single peak- This difference has been attributed to stacking fault crystal imperfections by Morris [12J and to the intergrowth of a substructure of lower symmetry by Gay [13]- Based upon the results of optical and x-ray studies Florke [14] suggested that both orthorhombic and triclinic varities of the hemihydrate can exist Gay, however, recently reported [13] that only a monoclinic structure exists_
Recently, the two forms have been shown [lJ to have the same infrared spectra. It has been reported [15 J that the exothermic effect in the differential thermograms of O'-CaS04 . l/2H2 0 occurs at a much lower temperature than in the f3 form, while other observers have claimed [16J that the thermogram of the 0' form does not exhibit any exothermic effect Therefore, it was felt that a detailed thermal analysis study of the postulated 0'- and f3-CaS04' 1/2H20 was desirable.
The results of differential thermal analysis, thermogravimetry, and differential scanning calorimetry studies of CaS04 . 2H2 0 and the supposed 0' and f3 forms of CaS04 . 1/2H2 0 , carried out in the region of 25 to 500 °C., are presented and interpreted in this paper.
The 0' and f3 terminology used in this paper is a qualified notation referring to the supposed forms of CaS04 . 1/2H20 and does not imply that their existence has been verified.
2. Experimental Procedure
.2.1. Differential Thermal Analysis I(DTA)
The DT A curves were recorded using a DuPont Model 900 DT A instrument 2 equipped with a microsample standard celL The reference material was anhydrous reagent grade Alz03 heated to 400°C. for an hour and stored in a vacuum desiccator over phosphorous (V) oxide until used. The reference material treated in this manner gave a flat DT A curve. Gaseous pressures within the DT A cell were measured with the gage accompanying the instrument and may be subject to ·errors of about ± 8 percent. Temperature measurements were made with chromel alumel thermocouples, using a reference junction temperature of o 0C., and are accurate to within 2 0C. The thermocouples were calibrated using benzoic acid (National Bureau of Standards, Standard Reference Material No. 350). The vacuum sys tem was able to reduce the residual pressure in the DT A cell to about 1 torr. Heating rates between 3 to 20 °C/min were used.
2 Certain instrument s and materials are identified in thi s pape r in order 10 adequately specify the experimental conditions. In no case does such identification imply recommendation or endorsement by the National Bureau of Standards, nor does it imply that the material or instruments are necessarily the best available for the purpose.
42
Evaluation of atmospheric conditions within the specimen compartment was complicated by the furnace and sample housing arrangement of the DT A celL Samples were loaded into small borosilicate glass tubes, which were closed at one end; the thermocouple wires were inserted il).to the tubes above the sample, with the thermocouple junction being embedded in the sample. The thermocouple wires fitted tightly in the tube, thereby hindering the diffusion of water vapor from samples and increasing the partial pressure of water vapor in the specimen tube above that in the bulk atmosphere. 3 Furthermore, allowing nitrogen gas to flow into the DT A cell probably did not produce dynamic conditions within the specimen tubes , as the nitrogen gas was prevented by the tight fit to be an effective purging agent. For the same reasons, in studies carried out under reduced pressures the water vapor pressures within the sample tubes were probably much greater than the bulk residual pressures.
2.2 Thermogravimetry (TG)
The curves of weight-loss as a function of temperature were recorded using a combination of the DuPont 900 Thermal Analyzer (see footnote 2) and the 950 TGA Module.4 The furnace atmosphere was either laboratory air or dry nitrogen gas. The weights of samples were 20 to 24 mg and weight suppressions between 16 to 20 mg were instrumentally set so that the full chart range on the ordinate scale would correspond to a weight loss of not more than 6 mg. Heating rates between 3 to 20°C/min were used.
2.3 Differential Scanning Calorimetry (DSC)
A Perkin-Elmer DSC-1B Differential Scanning Calorimeter (see footnote 2) was used to measure the DSC curves. Both loosely and hermetically sealed sample capsules were used.
In order to determine the 6.H of dissociation for CaS04' 2H20, the instrument was calibrated using the 6.H of fusion of pure indium and tin as standards. Weights of samples were 3 to 5 mg. Heating rates between 5 to 20°C/min were used.
2_4. Materials
a . CaSO. · 2H20
Reagent grade CaS04' 2H20 was used in this study and was found by dehydration at 375°C to contain the stoichiometric percentage of water (theoretical 20.9%, found 21.0%).
b. a-CaSO.· 1/2H20
O'-CaS04' 1/2H20 was prepared by the method outlined by Weiser and Milligan [17]. In this method an aqueous solution of Ca(N03)2 '4H20 was added to a mixture of dilute nitric and dilute sulfuric acid and the
3 Because of the nonequilibrium conditions the gaseous constituents and pressures within the DTA ce ll were probably not homogeneous; therefore . the average atmospheric conditions are denoted by the term "bulk atmosphere."
4 Refer to footnote 2.
resulting precipitate was allowed to age for 14 days at 50°C. The white product contained the stoichiometric amount of H20 (theoretical 6.62%, found 6.68%) and gave the differential thermogram [15J and x·ray powder diffraction pattern [12] ascribed to a-CaS04· 1/2H20.
c. ,B-CaSO.· 1/2H,O
. {3-CaS04· 1/2H20 was prepared from CaS04· 2H20 by two completely different dehydration methods. In one method samples of CaS04 ·2H20 were dehydrated in an air oven at 150 to 175°C. for three to twelve hours, to give y-CaS04. This y-CaS04 was allowed to equilibrate with laboratory air of 50 percent relative humidity at 22°C. This resulted in the uptake of water with the final product having slightly more than the stoichiometric amount of H20, ranging from 0.54 to 0.57 moles of H 20 per mole of CaS04. The extra quantity of H20 possibly has zeolitic character since Saito has reported [18J that NMR studies suggest the existence of two forms of water in CaS04 ·1/2H20 , one of which is zeoli tic.
An alternate method was the removal of 1 1/2 molecules of H20 from CaS04· 2H20 by vacuum line techniques at 100°C. It was necessary to anneal the product at 100 0c. for 60 hours as otherwise an impure material was obtained which consisted largely of {3-CaS04 . 1/2H20 and about 5 percent of CaS04 ·2H20 and y-CaS04.
The x-ray powder diffraction patterns and differential thermograms of products from both preparative methods were identical to those reported for authentic {3-CaS04 . 1/2H2 0 [12, 15J.
3. Results
3.1. Differential Thermal Analysis
Several of the differential thermograms of CaS04 ·2H20, measured under different bulk atmospheric conditions in the DT A cell, are reproduced in figures 1 and 2. Decreases in the peak temperatures ,5
Tpeak , and the first-break temperatures (see footnote 5), T fb, of the two endothermic effects. were observed when the gaseous pressure in the cell was reduced and when the residual pressure approached 1 torr the second endothermic curve had either merged with the first curve or had vanished. The peak temperatures and, when measurable, the first break temperatures are listed in table 1. The Tpeak and T fb of the exothermic effect observed in the differential thermograms of CaS04· 2H 20 were not sensitive to changes in the gaseous pressures.
A phase diagram constructed by plotting peak temperatures of the endothermic and exothermic effects versus the atmospheric pressures within the DT A cell is shown in figure 3 for CaS04·2H 20. DTA curves obtained under a static nitrogen atmosphere were similar to those observed with supposed dynamic nitrogen flow.
:i The peak temperature is the temperature of the apex of an endothermic or exothermic effect. The first break temperature denotes the temperature at which the curve first deviat es from the base line due to either an endothermic or an exothermic effect.
43
TABLE 1. Peak and first-break temperatures of endothermic DTA curves ofeaSO. ·2H20
a Tpcak is the peak temperature. b Trb is the first-break temperature. C Because of overlapping curves not possible to determine T fb
for the second c urve . d Second c urve had detected at I torr.
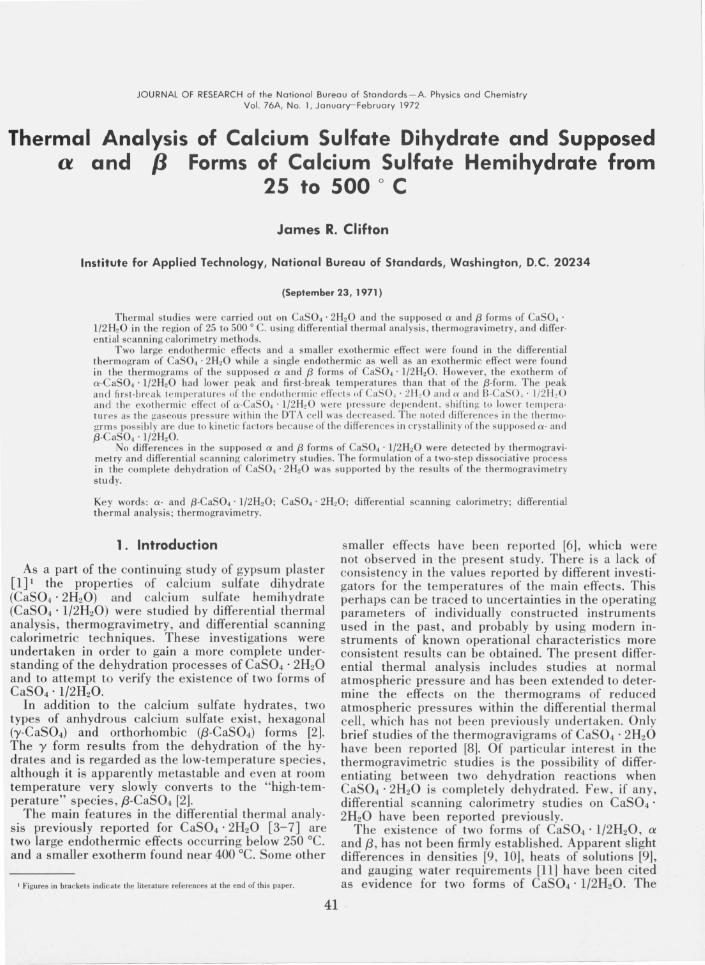
In figures 4 and 5 are shown the DT A curves of {3-CaS04 ·1/2H20 recorded, respectively, with a dynamic N2 atmosphere of ca. 760 torr and with a small residual pressure (ca. 1 torr) in the DTA cell. The heating rate was 12°C/min. The endothermic peak has the same temperature-pressure behavior (table 2) as previously noted for the second endothermic curve of CaS04· 2H20. The position and shape of the small exothermic peak, T peak = 375°C and T fb = 322°C, were not significantly affected by changes in atmospheric pressures in the DT A cell.
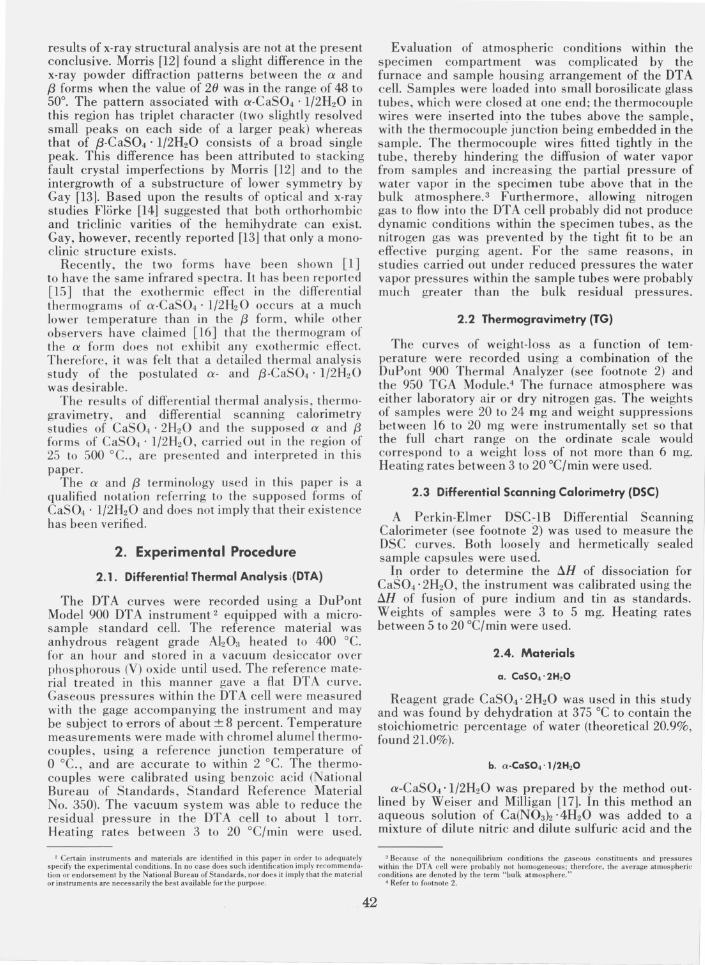
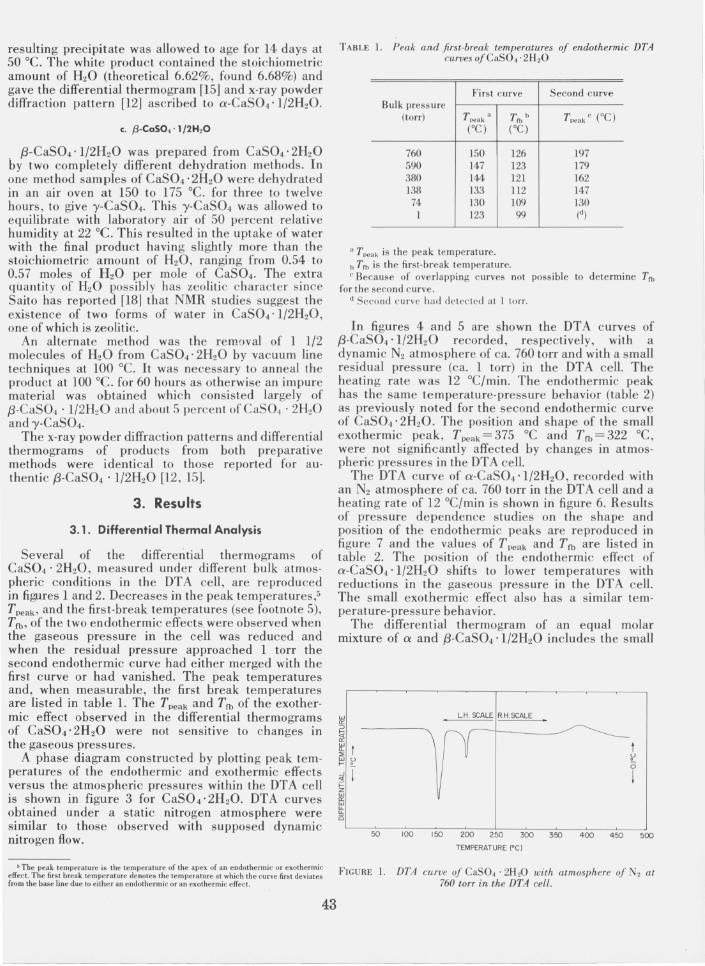
The DTA curve of a-CaS04 ·1/2H20, recorded with an N2 atmosphere of ca. 760 torr in the DT A cell and a heating rate of 12°C/min is shown in figure 6. Results of pressure dependence studies on the shape and position of the endothermic peaks are reproduced in figure 7 and the values of T peak and T fb are listed in table 2. The position of the endothermic effect of a-CaS04 ·l/2H20 shifts to lower temperatures with reductions in the gaseous pressure in the DT A cell. The small exothermic effect also has a similar temperature-pressure behavior.
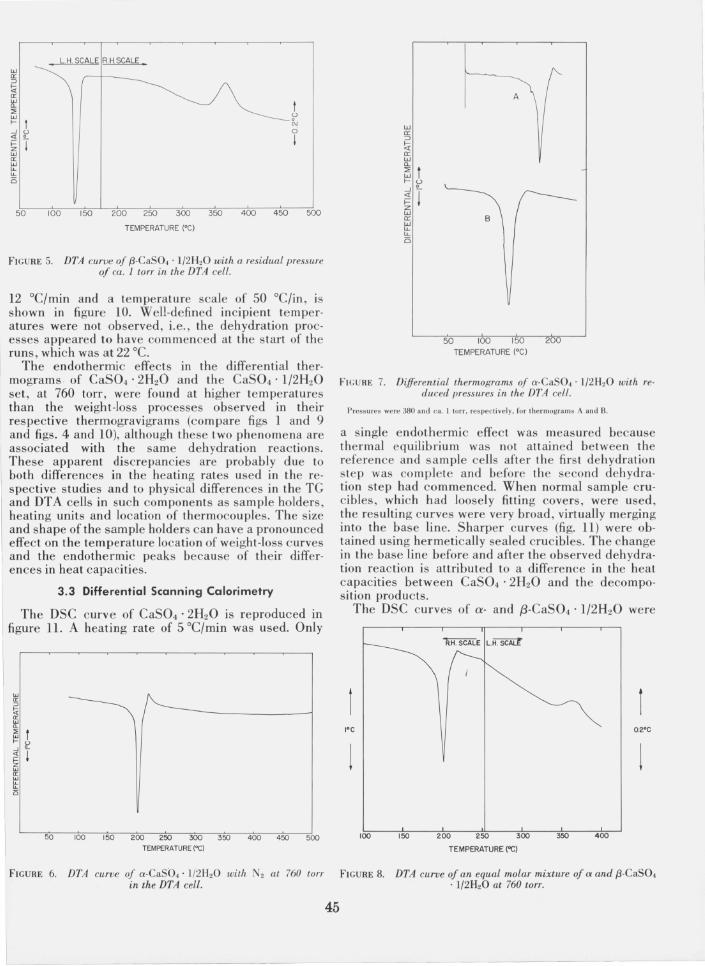
The differential thermogram of an equal molar mixture of a and {3-CaS04 ·1/2H20 includes the small
L.H. SCALE RHSCALE
! rY t ~ ~
0
! (
50 100 150 200 250 300 350 400 450 500
TEMPERATURE ('C)
FIGURE L DrA curve of easo •. 2H zO with atmosphere of Nt at 760 torr in the DT A cell.
exothermic effects of the respective components (fig. 8), which indicates that this method can be used to identify the two forms in the presence of each other.
TABLE 2. Peak and first·break temperatures of DTA curves of a and {:l·CaS04 . 1/2H20
Bulk Endotherm Exotherm
760 380
1
760 1
198 182 132
195 132
a·CaS04 . 1/2H,O
158 217 146 200 97 163
{:l-CaSO. '1/2H20
155 94
375 375
a T"eak is the peak temperature. b Trb is the first·break temperature.
n n n
322 324
C Because the endothermic and exothermic curves overlap not possible to determine T fb for exothermic curve.
3.2. Thermogravimetry
The thermogravigram ot CaS04' 2H2 0 recorded using a heating rate of 3 °C/min and a temperature scale of 10 °C/inch is reproduced in figure 9. Although a two-step dehydration process was suggested by an apparent change in slope of the weight loss curve, indicated by the tangent lines in figure 9, a well defined
A
B
50 100 150 200 TEMPERATURE ("C)
FIGURE 2. Differential thermograms of CaS04 . 2H20 at reduced pressures in the DT A cell.
The pressures with thermograms A, B, and C were 590,380, and ca. I torr, respectively.
800 PEAK I PEAK 2
600
40
200
200 350 375 TEMPERATURE (Gel
FIGURE 3. Phase diagram for CaS04 . 2H20.
Gaseous pressure in the OTA ce ll plotted versus the peak temperatures of the endothermic and exothermic effects.
inflection point attributed to the completion of the first dehydration process and the commencing of the second was not found (there was no indication of any plateau between the two reactions thus making it appear that they took place consecutively). The location of this point in the weight-loss curve was estimated by dropping a tangent line to the most straight portions of the segments associated with the two dehydration reactions and taking as the inflection point the intersection of the two lines, as shown in figure 9. The estimated inflection point corresponds to the removal of 65 percent of the water content of CaS04 . 2HzO compared to th{; theoretical value of 75 percent (assuming that CaS04 . 1/2H20 is formed).
One TG run was terminated at a weight-loss value equalling the removal of 1 1/2 molecules of H 20 from CaS04 . 2H20, thus , I:heoretically producing either pure (\'- or ,B-CaS04 . 1/2HzO. The DT A curves of the product, however, indicated that together with ,B-CaS04 . l/2H20 about 5 percent of unchanged CaS04 . 2H2 0 and y-CaS04 was present. These results were confirmed by x-ray powder diffraction analysis.
The TG curves of (\'- and ,B·CaS04· 1/2H20 were identical when using the same heating rates and the curve of the ,B-form, recorded using a heating rate of I
LH SGALE RHSGALE
~
I t ~ ~ Ci
j j
100 150 200 250 300 350 400 450 500
TEMPERATURE ('G)
FIGURE 4. DTA curve of {:l·CaS04· 1/2H20 with N2 at 760 torr in the DT A cell.
44
L.H. SGALE R.H SGALE
t u ~ o I
50 100 150 200 250 300 350 400 450 500
TEMPERATURE (oGl
FIGURE 5. DTA curve of ,B·CaSO •. 1/2H20 with a residual pressure 0/ ca.. 1 torr in the DT A cell .
12°C/min and a temperature scale of 50 °C/in, is shown in figure 10. Well-defined incipient temperatures were not observed, i.e., the dehydration processes appeared to have commenced at the start of the runs, which was at 22°C.
The endothermic effects in the differential thermograms of CaS04 . 2H20 and the CaS04' 1/2H20 set, at 760 torr, were found at higher temperatures than the weight-loss processes observed in their respective thermogravigrams (compare figs 1 and 9 and figs_ 4 and 10), although these two phenomena are associated with the same dehydration reactions. These apparent discrepancies are probably due to both differences in the heating rates used in the respective studies and to physical differences in the TG and DTA cells in such components as sample holders, heating units and location of thermocouples_ The size and shape of the sample holders can have a pronounced effect on the temperature location of weight-loss curves and the endothermic peaks because of their differences in heat capacities_
3.3 Differentia l Scanning Calorimetry
The DSC curve of CaS04 . 2H20 is reproduced in figure 11. A heating rate of 5°C/min was used. Only
F IGURE 6. DTA curve of a-CaSO.· 1/2H 20 with N2 at 76U torr in the DT A cell.
45
w a:: ::> ~ a:: w "-~ t 1-0 -12-
~ I z w a:: w ""is
A
B
50 100 150 TEMPERATURE (oG)
FI GU RE 7. Differential thermograms of a-CaS04 . 1/2H2 0 with reduced pressures in the DTA cell .
Pressures were 380 and ca, J lorr, respectively. for thermObrrams A and B.
a single endothermic effect was measured because th ermal equilibrium was not attained between the reference and sample cells after the first dehydration s tep was co mplete and before th e second dehydration step had commenced. When normal sample crucibles, which had loosely fitting covers, were used, the resulting curves were very broad, virtually merging into the base line_ Sharper curves (fig. 11) were obtained using hermetically sealed crucibles. The change in the base line before and after the observed dehydration reaction is attributed to a difference in the heat capacities between CaS04· 2H20 and the decomposition products.
The DSC curves of a- and f3-CaS04 . 1/2H20 were
1°C 0.2°C
100 150 200 250 300 350 400
TEMPERATURE (OC)
FIGURE 8. DTA curve of an equal molar mixture of a and ,B-CaS04 . 1/2H2 0 at 760 torr.
1
100 130 140
TEMPERATURE (·C)
160
FIGURE 9. TG curve oj CaSO, . 2H,O.
170 180
line 1 is drawn tangent to the portion of '.he curve corresponding to the dehydration of CaSO .. ·2H 20 10 ,B-CaSO,,· 1/2H20 while tangent line 2 indicates the dehydration of {l·CaSo., ' 1/2H, 0 10 y·CaSO •.
essentially identical as both were very broad even when hermetically sealed crucibles were used.
4. Discussion
4.1. Thermal Dissociation of CaS04 . 2H 20
The thermal dissociation of CaS04' 2H20 in the region of 25 to 500°C was monito.red by both differen· tial thermal analysis and thermal gravimetric analysis techniques and the pertinent features o.f the thermo.· grams will be discussed in this section.
The differential thermogram of CaS04 . 2H20 under a nitro.gen atmo.sphere o.f 760 torr, fig. 1, is similar to thermograms o.bserved by o.ther investigato.rs [3-7]. In the present study, however, the extent of o.verlapping o.f the first and second endothermic curves is smaller than previo.usly reported, possibly because o.f o.ur use
~ T <t :r u
o
.. o
1
100 150 200 250 TEMPERATURE (·C)
FIGURE 10. The TG curve oj {3-CaSO, . 1/2H,O.
300
o
"' OIl a:: o en OIl <t
f
'" "' :r
160 150 140 130
TEMPERATURE (·C)
FIGURE 11. The DSC curve oj CaSO, . 2H20.
of micro samples. Furthermo.re, a small endo.thermic dent reported by so.me investigato.rs, [19] , to be lo.cated just after the second endo.thermic effect was not observed in the present study. This small effect has been attributed to the expulsio.n of s mall amounts I
o.f residual water from the hemihydrate [19]; alternatively, this endo.thermic peak could deno.te the presence o.f a small impurity.
The differential thermo.gram of CaS04 . 2H20, reproduced in figure 1, can be understo.od on the basis o.f three transfo.rmatio.ns have peak temperatures of 150, 197, and 375°C at 760 to.rr:
(1) CaS04 . 2H20(s) ~ ,B-CaS04 . 1/2H20(s) ~
+3/2H20(v)
(2) ,B-CaS04 . 1/2H20(s) ~ 'Y-CaS04(s) ~
(3) 'Y-CaS04(s) ~ ,B-CaS04(s)
T fb o.f reactions (1) and (3) were 126 and 325°C, respectively. Ho.wever, T fb of reaction (2) could no.t be determined because the two. endo.thermic effects o.verlapped. This phenomenon will later be discussed in mo.re detail.
According to. this scheme, reactio.ns (1) and (2) are dehydratio.n processes and, consequently, give rise to endo.thermic curves, while reactio.n (3) is attributed to a lattice modification fro.m a hexagonal to an orthorho.mbic unit cell [2] and gives rise to an exotherm. It is felt that the fo.rmulation of a two-step dehydratio.n process, I
reactions (1) and (2), was suppo.rted by the apparent change in the slope o.f the weight-lo.ss curve o.f I
CaS04 . 2H20 (fig. 9). As previously mentio.ned, the endo.thermic effects in the differential thermo.grams takes place at higher temperatures than the corresponding weight-lo.ss curves because of differences in the DTA and TG modules and the use o.f different
46
heating rates in the respective studies. The solid product formed in reaction (1) is presumed
to be f3·CaSO~· 1/2H20 since the DTA curves associated with reactions (2) and (3) are identical to those observed for authentic f3·CaS04 . l/2H20 (fig. 4).
The proposed scheme for the dehydration of CaS04 . 2H20 assumes reaction (1) is completed as reaction (2) commences. This assumption cannot be substantiated by the DTA study alone because the two endothermic effects overlap and it is not possible to ascertain when the reaction responsible for the first effect terminates and the next reaction commences. The temperature at the end of an endothermic of exothermic effect does not necessarily coincide with
I the completion of the chemical reaction due to such factors as heat transfer and differences in the heat capacities of the reactant and products. In this matter, the TG studies are of assistance. As reported in Section 3.2, a TG run was terminated at a weight·loss value equalling the removal of 1 1/2 molecules of H20 from CaS04 . 2H20. The product was largely f3-CaS04 . l/2H20 but did contain some 5 percent of unchanged CaS04· 2H20 and y·CaS04. The phase types present were determined by DT A and x·ray powder diffraction techniques. A similar impure product was obtained when the stoichiometric amount of H20 was removed, in vacuo, from CaS04 . 2H2 0 to form f3·CaS04 . l/2H20. Therefore, it is likely that with the non uniformity fo heating conditions of DT A, reactions (1) and (2) can proceed to a small extent concurrently within a sample, especially, when the supply of CaS04 . 2H20 is nearly depleted, and that the proposed reaction scheme is somewhat over simplified.
Further evidence for the overlapping of the two endothermic reactions is provided by the thermo· gravigram of CaS04 . 2H20 reproduced in figure 9. N either a well-defined inflection point denoting the completion of one reaction and the start of the other dehydration process nor a plateau in the weightloss curve signifying a separation of the two reactions was observed in the thermogravigram. Furthermore, the change in slope between the two segments of the weight·loss curve associated with the two dehydration reactions was small. In the following, an interpretation to account for the observations is proposed. Possibly very little lattice rearrangement takes place when passing from CaS04 . 2H20 to f3-CaS04 . 1/2H20 as only lattice water is being removed and the layer structure [20] of the Ca2+ and S024 grouping should retain its integrity. If this describes the actual situation, then it is reasonable to expect similar dehydration mechanisms for both CaS04· 2H20 and f3-CaS04 . 1/2H20.
The following will focus upon the interesting perturbations noted in the differential thermograms of CaS04 . 2H20 when they were measured with reduced pressures in the DT A cell.
The influence of bulk atmospheric pressures on the values of Tpeak and Tfb is given in table 1 and figure 2. Tpeak of the first endothermic curve was decreased from 150 to 123°C while Tfb decreased from 126 to 99°C when the pressure was reduced from 760 torr
47
to ca. 1 torr. Tpeak of the second endothermic curve was decreased even more, being 197°C at 760 torr and either merged into the first curve or vanished when the residual pressure was reduced to ca. 1 torr. The position of the small exothermic curve was not pressure dependent. Of particular interest to the present study is the mechanism proposed by several investigators [21, 22], based on other types of dehydration experi· ments on CaS04· 2H20. According to their mechanism, two dehydration reactions do take place if CaS04 . 2H20 is in contact with appreciable amounts of water vapor. Dehydration in vacuo, however, leads directly to the formation of y·CaS04 without f3·CaS04 . 1/2H20 being an intermediate specie. Removal of 1 1/2 molecules of H20 from CaS04 . 2H20 in vacuo, therefore, should result in a product which is a mixture of CaS04 . 2H20 and y-CaS04 and possibly containing a trace of f3-CaS04 . l/2H20. The above views are untenable, however, for in the present study it was found that f3-CaS04 . 1/2H20 was the main product formed by the removal of H20 in vacuo and only about 5 percent of CaS04 . 2H20 and y·CaS04 was found.
A reasonable explanation of the formation of f3-CaS04· l/2H20 by dehydration in vacuo of CaS04 . 2H 20 is embodied in the phase diagram shown in figure 3. The gaseous pressures within the DTA cell were plotted versus the peak temperatures for the dehydration reactions of CaS04 . 2H20 and the subsequent transformation of y·CaS04 to f3·CaS04. According to this scheme the second endothermic curve does vanish rather than merging with the first endothermic curve. The formation of f3-CaS04 ·l/2H20 by the dehydration in vacuo of CaS04· 2H20 is accounted for by the metastable prolongation (indicated by the dot-dash line) of the univariant curve.
The merging tendency of the two endothermic curves can be explained on the basis of. the van't Hoff equation:
dIn Kp dT
llH RT2
The gaseous pressures are low in the present case and ideal gas behavior is assumed.
In the above equation llH is the heat of reaction at temperature T, and therefore is not a constant. The standard heat of reaction, llH 0, at To is introduced by using the Kirchoff equation:
( a (llH») = llC aT p P
h f dlnKp_llHo+llCp(T-To) t ere ore dT - RP
----------- -- ---------
The integrated form of the above equation, when considering the interval between Tl and T2 , becomes
The last term vanishes at To = 0 K, resulting in the following equation:
The pressure decrease necessary to shift Tpeak of the second endothermic curve in the thermogram of CaS04 . 2H20 from 197 to 123°C can now be estimated by setting T= T peak and Kp = pl /2 and using the values of I:J.Ho and t:..Cp reported by Kelly, Southard, and Anderson [9] for the reaction f3-CaS04 . 1/2H20(s) ~ y-CaS04(s) + 1/2H20(v)' The calculated value P 2/P 1 = 0.06 suggests that a 16 fold decrease in the partial pressure of water vapor within the specimen tube can account for the shift in Tpcak observed when the bulk atmospheric pressure is decreased from 760 torr_to ca. 1 torr. By a similar method, with Kp = P3/2, a value of P2iPi = 0.36 was calculated for the case when Tpeak of the first endothermic effect was decreased from 150 to 123°C. These values can be only considered as approximations to the actual situations because of the nonrigorous treatment.
4.2. Thermal Analysis of a- and p-CaS04 . 1/2H20
In the following discussion, the differential thermograms and the thermogravigrams of a- and f3-CaS04 . l/2H20, measured from 25 to 500°C , will be analyzed
The differential thermograms will be discussed in detail since it has been reported [15] that the two forms of CaS04 . 1/2H20 can be identified by their thermograms. The thermograms of the a and f3 forms measured under an atmospheric pressure of 760 torr are shown in figures 6 and 4, respectively. Each thermogram consisted of a single endothermic and a small6f exothermic curve. Budnikov and Kosyreva have reported [16] that a difference of about 20°C was found between the T peak of the endothermic effects in a- and f3-CaS04 . 1/2H 20. A difference of only 3 °C (table 2) between the respective values of T peak as well as T fb,
however, was measured in the present study. This small I:J.T can possibly be attributed to porosity differences in the a and f3 forms. The only essential difference between the thermograms are in the exothermic effects. The exothermic effect of a-CaS04 . 1/2H20 closely follows the endothermic effect and has a T peak of 217°C, while the exothermic effect of f3-CaS04 . 1/2H20 is much broader and has a Tpeak of 375°C and T fb of 322°C. Both exothermic effects have been attributed to phase changes r15].
The values of Tpeak and T fb for tne endothermic
effects of a and f3-CaS04 . l/2H20 have a similar pressure dependence (table 2 and fig. 5 and 7) as the second endothermic effect of CaS04 . 2H20 and can be interpreted in the same manner.
The location of the exothermic effect observed in the thermogram of a-CaS04 . 1/2H20 was pressure sensitive in the same manner as the preceding endothermic effect (table 2 and fig. 7). Possibly this exothermic effect can be attributed to the formation of a new phase, the conversion being triggered by the removal of the lattice water. Because this apparent phase conversion took place immediately after the dehydration reaction, it is reasonable to expect the location of the exothermic effect would shift in the same direction as the endothermic effect. In contrast, the location of the exothermic effect off3-CaS04 ·l/2H20 was not significantly pressure dependent.
The difference observed in the exothermic effects of the thermograms of a ' and f3-CaS04' l/2H20 do not necessarily indicate a structural difference between the two forms, but possibly are associated with the dehydration kinetics. The kinetics can depend upon such factors as the surface area, porosity and crystallinity. The f3 form is produced by dry decomposition which should yield a poorly crystalline and porous material with a larger surface area than the a form, which was a precipitated material and, therefore, should consist of well-formed ~rystals.
The thermogravigrams of a- and f3-CaS04 . 1/2H20 were so similar that it was impossible to differentiate between the two forms on the basis of TG studies. The thermogravigram of f3-CaS04' 1/2H20 is reproduced in figure 10. Note that the dehydration reaction appeared to be initiated at room temperature. Probably, the loosely held zeolitic water of f3-CaS04' 1/2H20 [18] is first removed then followed by dissociation of the lattice water. The removal of lattice water is indicated by the more pronounced sloping segment of the weight-loss curve.
4.3. Calorimetry Studies
On the assumption that the endothermic effect measured in the DSC curve of CaS04 . 2H2 0 (fig 11) could be entirely attributed to the first dehydration step of CaS04 . 2H20, the heat of reaction of
was estimated to be 23.8 kcal (9.96 x 10⁴ J) per gram mol. wt. This value is substantially higher than the calculated value of 19.9 kcal (8.33 x 10⁴ J) per gram mol. wt., obtained using the equation given by Kelly, Southard, and Anderson [9]. A reasonable explanation for this discrepancy has previously been discussed in section 4.1 for the cases of the thermogravigram and the differential thermogram of CaS04' 2H20, i.e., the two dehydration steps involved in the complete dehydration of CaS04 . 2H2 0 are to some extent taking place concurrently during the DSC measurements.
The endothermic curves for a- and f3-CaS04' l/2H20 were too broad to permit the calculation of the heat of reactions.
48
5. Summary and Conclusions
The dehydration of CaS04 . 2H20 to y-CaS04 is a two·step dissociative process, with ,B-CaS04 . l/2H20 being the intermediate product , irrespective of the dehydration methods.
The differential thermogram of CaS04' 2H20, measured under gaseous pressures of a 760 torr, has two large endothermic effects with peak temperatures of 150(Tfb of 126°C) and 197 °C and a smaller exo· therm with peak temperature of 375°C (Tfb of 325°C) The ndoth rmic effects were associated with dehydration processes whereas the exothermic e ffect indicated phase transformation of y-CaS04 to ,B-CaS04. When the dissociative reactions were carri ed out under reduced pressure the endothermic effects shifted to lower temperatures and tended to merge. With residual pressures of about 1 torr, a single e ndothermic effect was ' observed. These phe nomena can be explained from th e applic ation of the van't Hoff equation and on the basis of a phase diagram cons tructed by plotting gaseous pressures in the DT A cell versus peak temperatures. Location of th xoth rmic ff ct was not s ignificant ly pressure dependent.
The small ch ange in slope observed between the two segme nts of the weight-loss curve of CaS04' 2H20 indicates that there is little difference in the di ssoeiative mec hani sms of the two dehydration reactions.
While it was not possible to differentiate between the supposed a and ,B forms of CaS04 . l/2H20 on the basis of TG and DSC studies, the differen ti al thermograms of the two form s were somewhat di ssi milar. An endothermic e ffect with a peak temperature of ca. 197 °C and T fb of ca. 158°C , was found in the differe ntial thermogrums of both form s of CaSO~ . 1/2H20. The a form had a single exothermic effect with a peak temperature of 217°C, while the exotherm of the f3 form had a peak temperature of 375 °C , T fb of 322°C, under bulk pressures of 760 torr. The peak temperature of the exothe mi L: e ffect of a -CaS04 . 1/2H20 was pressure dependent, whereas , the exothermi c effec t of ,B-CaS04' 1/2H20 was not inAuenc d by changes in the atmos pheric pressure within the DT A cell. The differences in the thermograms could possibly be associated with the dehydra-
49
448-4170- 72 - 4
tion kinetics, because the a form should have a more perfect crystalline structure than the ,B form. Therefore, while s light differences have been observed between the properties of a- and ,B-CaS04 . 1/2H20, at the present it cannot be conclusively determined if these djfferences are sufficiently significant to consider the supposed a and ,B forms as separate entities.
The author thanks Max Tryon, I. Flynn , and E. Parks for experimental assistance.
6. References
[1] Clift on. J. R. , Na ture, 232 , 125 (1971). [2] Gay , P. , Min. Mag. 35, 270 (1965). [3] Volzhensk ii , A. V., Keramiba II, 64, (1939). [4] Gru ver, R. M. , J. Am. Ceram. Soc. 34, 353, (1951). [5] West, R. R. , and SUllon, W. J. , J. Am. Ceram . Soc. 37, 221,
(1954). 16J Fleck. W. E. P. , Jones, M. H. , Kuntze, R. A. , and McAd ie, . H. G., Can. J. Chem. 38, 936, (1960).
[7] Holdridge, D. A., and Walker , E. G., Trans. British Ceram ic Soc., 66, 485, (1967).
[8] Richards , K. J ., Ph.D. Thesis , University of Utah , 1962. Micro· film 63- 1387, Univ rsity Mi rofilms, Ann Arbor, Mi higan.
[9] Kelley, K. K., Southard , J. c., and Anderson , C. T. , U.S. Bureau of Mines , Tech. Paper No. 625 , (1941).
[ 0] Eipeil' uer , E., Zement·Kalk Gips II, 264, (1958). Ell] Lambe, C. M., and Offutt, J. S., Am. Ceram. Soc. Bull. 33,
272 , (1954). [12] Morris , R. J. , Nature 198, 1298, (1963). [13] Gay, P. , Min. Mag. 35, 354, (1965). [14] Fliirke , O. W., Neues Jb. Miner. Mh. 84, 198 (1952). [15] Powell , D. A., Nature 182, 792 , (1958). [16] Budnikov, P . O. , and Kosyreva, Z. 5 ., Yoprosy Petrograf. i
Min era Akad . Nauk S.S.S.R. 2, 342, (1953) (C hern . Abstr. 48 , 13314a, (1954)).
[17] Weiser, H. B. , and Milligan , W.O. , .1 . Am. Chern. Soc. 59, 1456, (1937) .
[18] Saito, T. , Bull Chem. Soc. (J apan) , 34, 1454, (1961). [19] Ramachandro n, V. 5 ., Ap plications of Differentia l Thermal
Analys is in Cement Chemistry (Chemical Pub lishing Co m· IJany, New York, New York , 1969).
[20] Woos ter , W. A., Kri st, Z .. 94, 375, (19.'\6). [21] van' t Hoff, J. H., Hi r. ri chsen, W. , and Wegert, F., Sitzber.
Akad. (Be rlin) 570, (1901). [22] Razouk, R. I., Salem, A. Sh., and Mikhai, R. Sh., j. Phys.