MARMARA UNIVERSITY FACULTY OF ENGINEERING METALLURGICAL AND MATERIALS ENGINEERING DEPARTMENT SENIOR PROJECT THERMAL ANALYSIS OF POLYMERIC MATERIALS PREPARED BY Serkan ÇAKIROĞLU ADVISOR Prof. Dr. Ersan KALAFATOĞLU DATE 18 TH JUNE 2005
Transcript
MARMARA UNIVERSITY FACULTY OF ENGINEERING
METALLURGICAL AND MATERIALS ENGINEERING DEPARTMENT
SENIOR PROJECT
THERMAL ANALYSIS OF
POLYMERIC MATERIALS
PREPARED BY Serkan ÇAKIROĞLU
ADVISOR Prof. Dr. Ersan KALAFATOĞLU
DATE 18TH JUNE 2005
I. INTRODUCTION
The purpose of this senior project is to make thermal analysis of chosen polymer
specimens and determine their thermal and other properties. Determination of thermal
properties of polymeric materials needs specific experiments which will be done in this senior
project period according to the prepared management plan. Necessary equipments for the
experiment are available in the university laboratories and are ready to use. In addition to
these, another goal of this senior project is to compare the experimental results with the
results given in literature and discuss the results with respect to their structure. Commercial
importance of thermal analysis of polymeric materials is another important point that will be
mentioned.
II. BACKGROUND
Most polymers are organic in origin. Many organic materials are hydrocarbons; that is,
they are composed of hydrogen and carbon. Small molecules which are made up of
hydrocarbon groups, polymers -
which are very large molecules - are
made up of hundreds of thousands or
even millions of atoms all strung together,
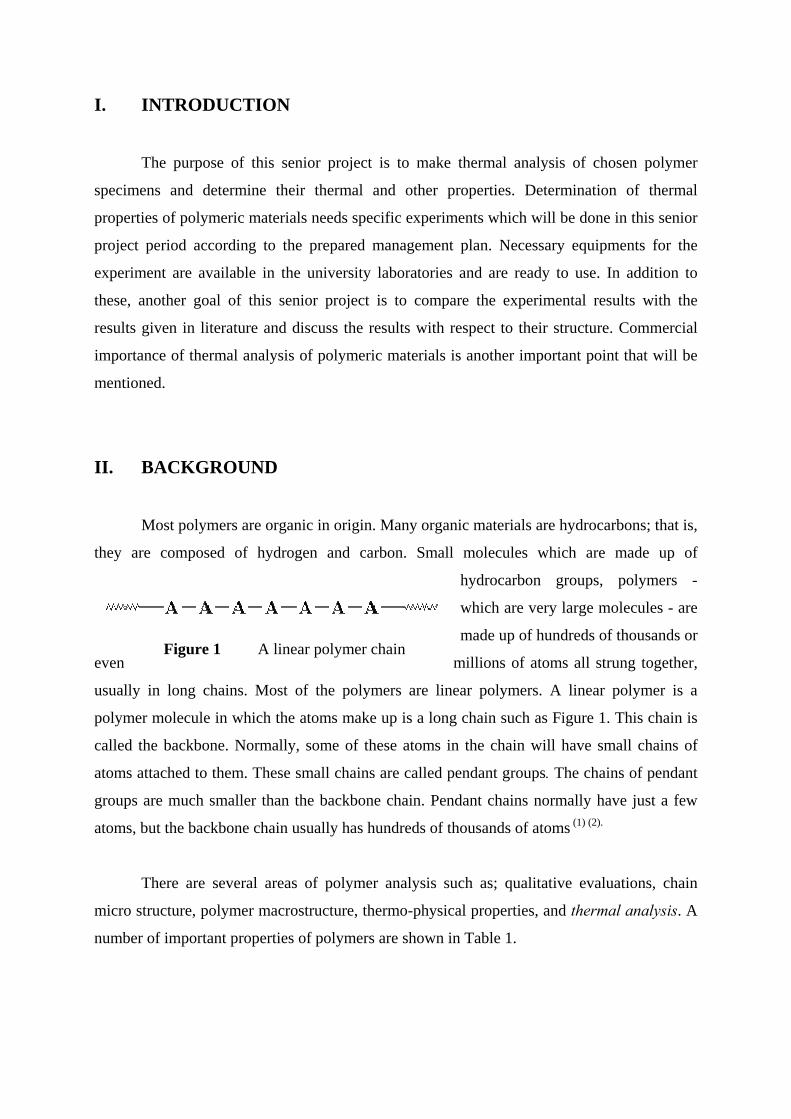
usually in long chains. Most of the polymers are linear polymers. A linear polymer is a
polymer molecule in which the atoms make up is a long chain such as Figure 1. This chain is
called the backbone. Normally, some of these atoms in the chain will have small chains of
atoms attached to them. These small chains are called pendant groups. The chains of pendant
groups are much smaller than the backbone chain. Pendant chains normally have just a few
atoms, but the backbone chain usually has hundreds of thousands of atoms (1) (2).
There are several areas of polymer analysis such as; qualitative evaluations, chain
micro structure, polymer macrostructure, thermo-physical properties, and thermal analysis. A
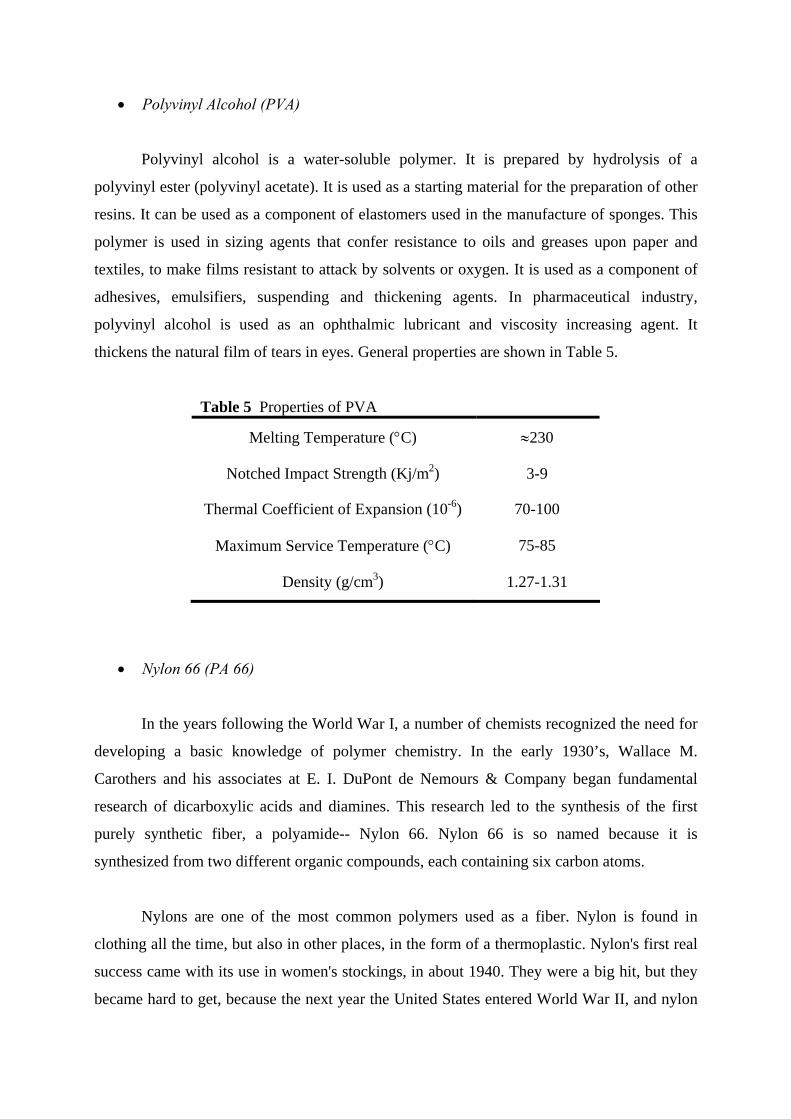
number of important properties of polymers are shown in Table 1.
Figure 1 A linear polymer chain
Table 1 Important Properties of Polymers
Type of Property
Quantities
Thermo-physical
*Volume: density, molar volume, thermal expansion
*Calorimetric: heat capacity, enthalpy, entropy
*Transition: glass transition temperature, melting temperature
*Interfacial: surface energy, interfacial tension
Other physical *Electrical: conductivity, dielectric constant *Magnetic: magnetic resonance *Acoustic: sound absorption
Transport *Rheological: shear, extension, elasticity *Mass transfer: diffusion
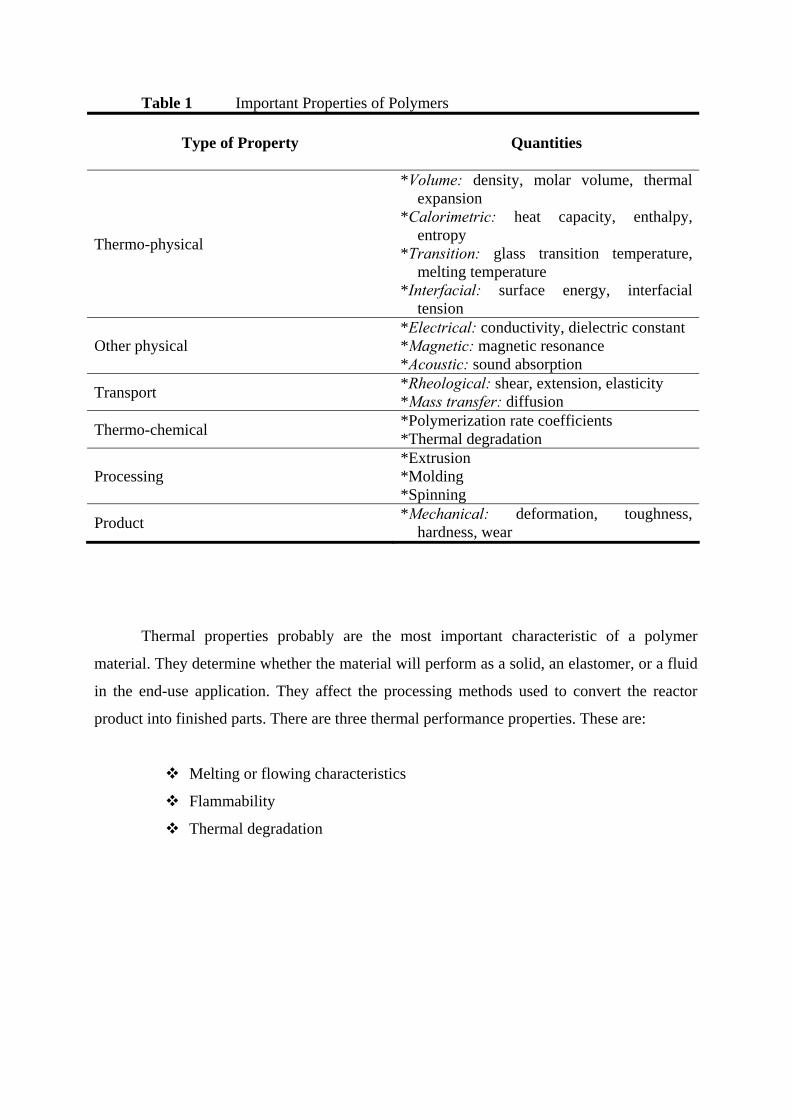
Thermal properties probably are the most important characteristic of a polymer
material. They determine whether the material will perform as a solid, an elastomer, or a fluid
in the end-use application. They affect the processing methods used to convert the reactor
product into finished parts. There are three thermal performance properties. These are:
Melting or flowing characteristics
Flammability
Thermal degradation
THERMAL ANALYSIS
Thermal analysis of polymers is done by measuring physical properties of the polymer
as it is subjected to controlled temperature changes. Thermal analysis is performed on
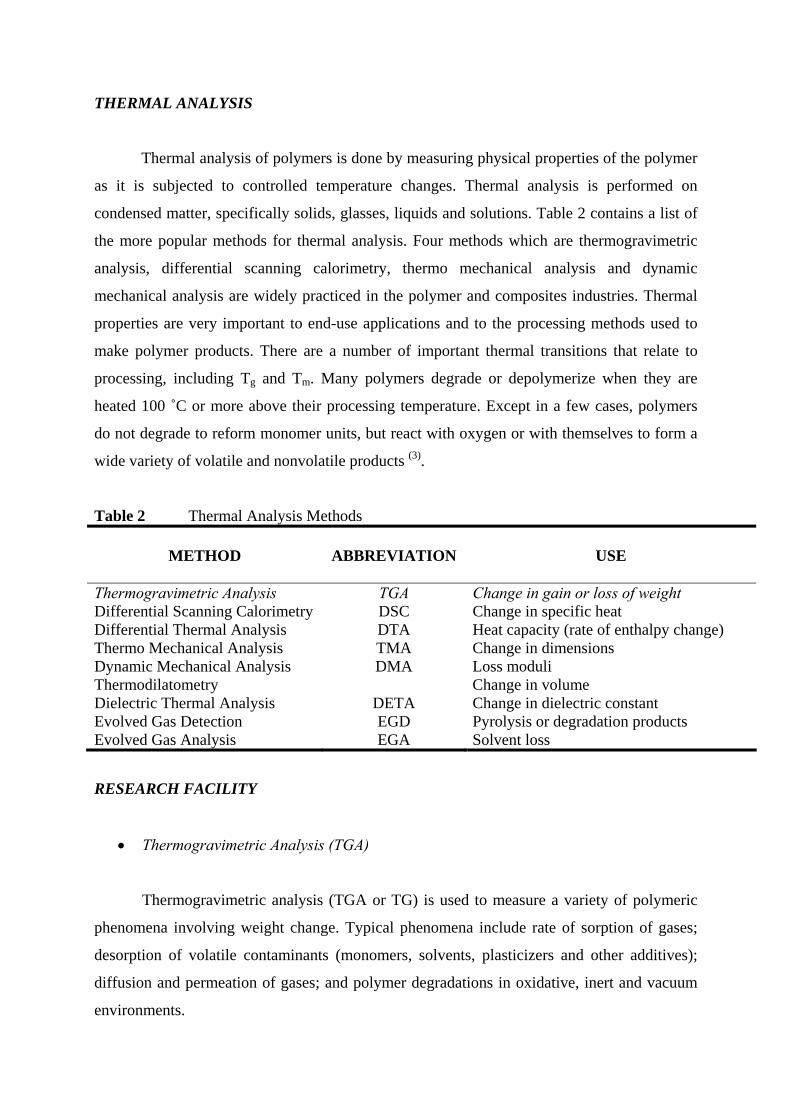
condensed matter, specifically solids, glasses, liquids and solutions. Table 2 contains a list of
the more popular methods for thermal analysis. Four methods which are thermogravimetric
analysis, differential scanning calorimetry, thermo mechanical analysis and dynamic
mechanical analysis are widely practiced in the polymer and composites industries. Thermal
properties are very important to end-use applications and to the processing methods used to
make polymer products. There are a number of important thermal transitions that relate to
processing, including Tg and Tm. Many polymers degrade or depolymerize when they are
heated 100 ˚C or more above their processing temperature. Except in a few cases, polymers
do not degrade to reform monomer units, but react with oxygen or with themselves to form a
wide variety of volatile and nonvolatile products (3).
Table 2 Thermal Analysis Methods
METHOD
ABBREVIATION
USE
Thermogravimetric Analysis TGA Change in gain or loss of weight Differential Scanning Calorimetry DSC Change in specific heat Differential Thermal Analysis DTA Heat capacity (rate of enthalpy change) Thermo Mechanical Analysis TMA Change in dimensions Dynamic Mechanical Analysis DMA Loss moduli Thermodilatometry Change in volume Dielectric Thermal Analysis DETA Change in dielectric constant Evolved Gas Detection EGD Pyrolysis or degradation products Evolved Gas Analysis EGA Solvent loss
RESEARCH FACILITY
• Thermogravimetric Analysis (TGA)
Thermogravimetric analysis (TGA or TG) is used to measure a variety of polymeric
phenomena involving weight change. Typical phenomena include rate of sorption of gases;
desorption of volatile contaminants (monomers, solvents, plasticizers and other additives);
diffusion and permeation of gases; and polymer degradations in oxidative, inert and vacuum
environments.
When gaseous materials evolve from the sample, TGA is often used in tandem with
gas chromatography (GC) or mass spectroscopy (MS) to identify the lost materials. For
example, it can be used to determine the carbon content of rubbers and the composition of
polymer composites. TGA, GC and MS pyrolysis of samples is used for identification and
characterization of homopolymers, copolymers, blends and mixtures. In some cases branching
and tacticity can be detected.
Thermal testing has become easier with appearance of automated equipment for
testing small samples. These systems speed the characterization of new and modified
polymers, allowing efficient research and development as well as accurate production
monitoring. The chemical composition tests are also important, although the chemical
compositions of most materials sold commercially are well-known. These tests are useful in
determining the composition of unknown samples or verifying that the expected composition
was achieved. They also can be very helpful in identifying impurities, side reactions and
additives that can have a big effect on performance properties.
• Differential Thermal Analysis (DTA)
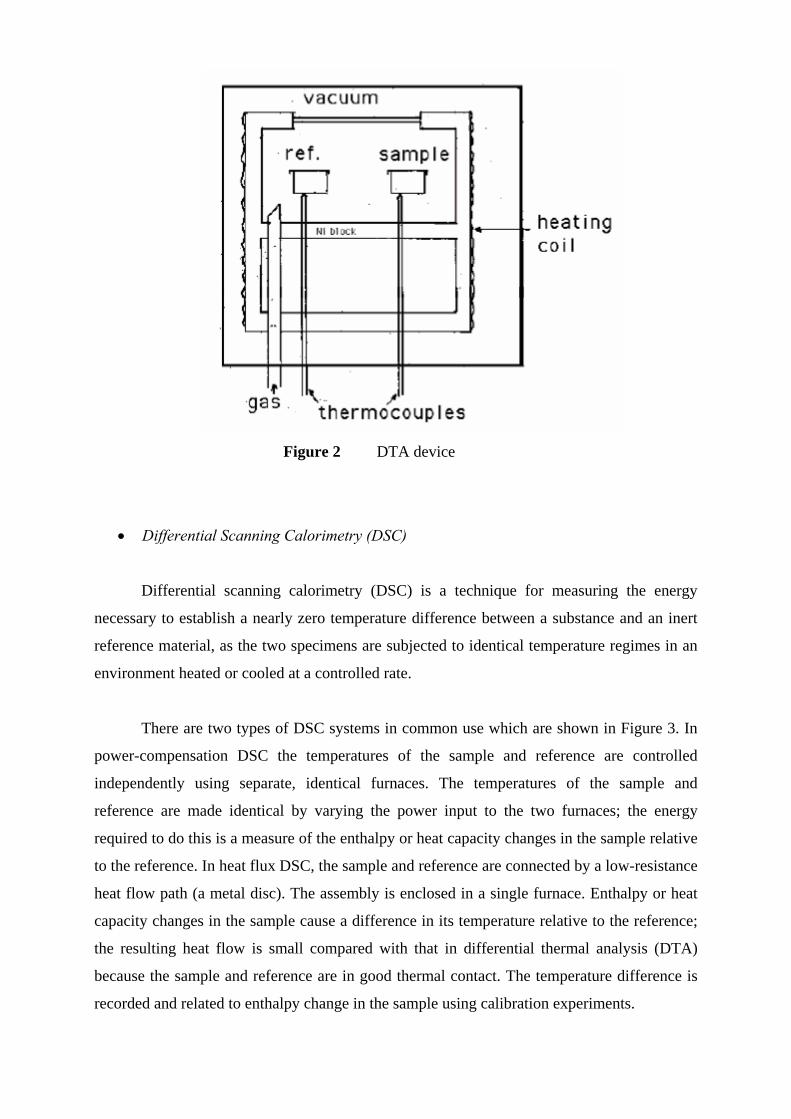
Differential thermal analysis (DTA) is a technique involves heating or cooling a test
sample and an inert reference such as Al2O3, under identical conditions, while recording any
temperature difference between the sample and reference. This differential temperature is then
plotted against time, or against temperature. Changes in the sample which lead to the
absorption or evolution of heat can be detected relative to the inert reference.
Differential temperatures can also arise between two inert samples when their response
to the applied heat treatment is not identical. DTA can therefore be used to study thermal
properties and phase changes which do not lead to a change in enthalpy. The baseline of the
DTA curve should then exhibit discontinuities at the transition temperatures and the slope of
the curve at any point will depend on the micro structural constitution at that temperature.
Schematic illustration of a DTA device is shown in Figure 2.
Figure 2 DTA device
• Differential Scanning Calorimetry (DSC)
Differential scanning calorimetry (DSC) is a technique for measuring the energy
necessary to establish a nearly zero temperature difference between a substance and an inert
reference material, as the two specimens are subjected to identical temperature regimes in an
environment heated or cooled at a controlled rate.
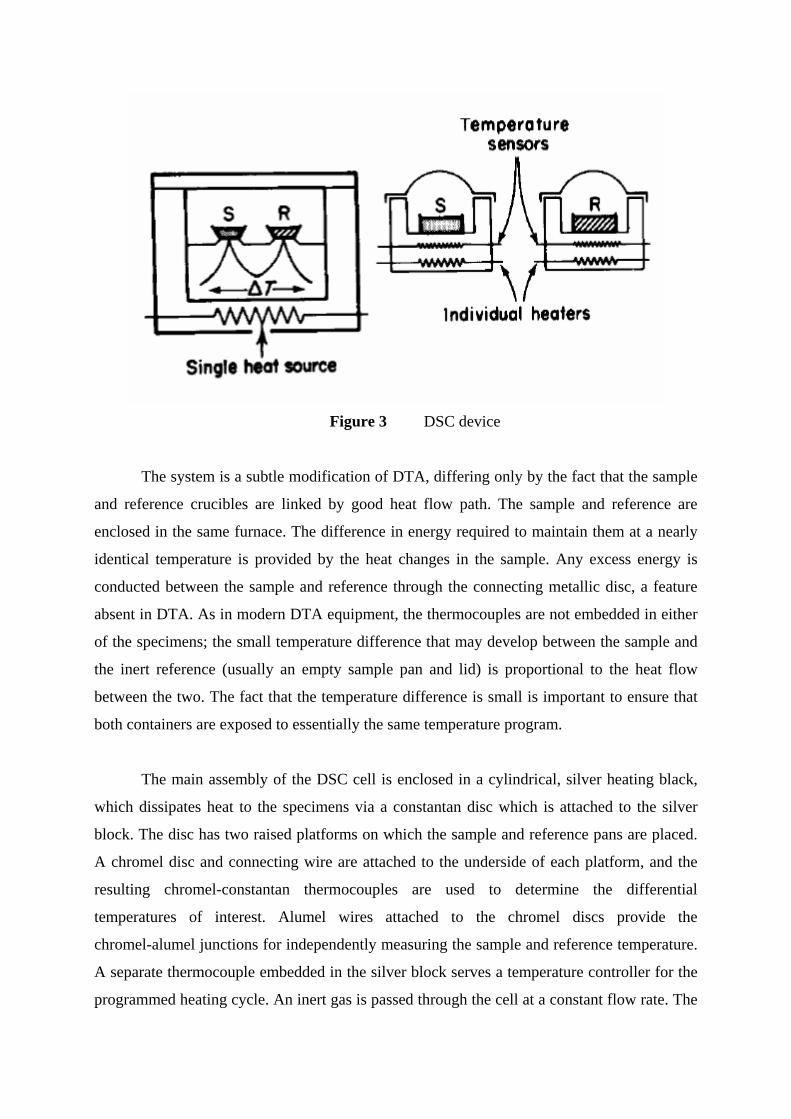
There are two types of DSC systems in common use which are shown in Figure 3. In
power-compensation DSC the temperatures of the sample and reference are controlled
independently using separate, identical furnaces. The temperatures of the sample and
reference are made identical by varying the power input to the two furnaces; the energy
required to do this is a measure of the enthalpy or heat capacity changes in the sample relative
to the reference. In heat flux DSC, the sample and reference are connected by a low-resistance
heat flow path (a metal disc). The assembly is enclosed in a single furnace. Enthalpy or heat
capacity changes in the sample cause a difference in its temperature relative to the reference;
the resulting heat flow is small compared with that in differential thermal analysis (DTA)
because the sample and reference are in good thermal contact. The temperature difference is
recorded and related to enthalpy change in the sample using calibration experiments.
Figure 3 DSC device
The system is a subtle modification of DTA, differing only by the fact that the sample
and reference crucibles are linked by good heat flow path. The sample and reference are
enclosed in the same furnace. The difference in energy required to maintain them at a nearly
identical temperature is provided by the heat changes in the sample. Any excess energy is
conducted between the sample and reference through the connecting metallic disc, a feature
absent in DTA. As in modern DTA equipment, the thermocouples are not embedded in either
of the specimens; the small temperature difference that may develop between the sample and
the inert reference (usually an empty sample pan and lid) is proportional to the heat flow
between the two. The fact that the temperature difference is small is important to ensure that
both containers are exposed to essentially the same temperature program.
The main assembly of the DSC cell is enclosed in a cylindrical, silver heating black,
which dissipates heat to the specimens via a constantan disc which is attached to the silver
block. The disc has two raised platforms on which the sample and reference pans are placed.
A chromel disc and connecting wire are attached to the underside of each platform, and the
resulting chromel-constantan thermocouples are used to determine the differential
temperatures of interest. Alumel wires attached to the chromel discs provide the
chromel-alumel junctions for independently measuring the sample and reference temperature.
A separate thermocouple embedded in the silver block serves a temperature controller for the
programmed heating cycle. An inert gas is passed through the cell at a constant flow rate. The
thermal resistances of the system vary with temperature, but the instruments can be used in
the `calibrated' mode, where the amplification is automatically varied with temperature to
give a nearly constant calorimetric sensitivity.
EXPERIMENTAL MATERIALS
• Acrylonitrile-Butadiene-Styrene (ABS)
ABS is an ideal material wherever superlative surface quality, colorfastness and luster
are required. ABS is a two phase polymer blend. A continuous phase of styrene-acrylonitrile
copolymer (SAN) gives the materials rigidity, hardness and heat resistance. The toughness of
ABS is the result of sub-microscopically fine polybutadiene rubber particles uniformly
distributed in the SAN matrix.
ABS standard grades have been developed specifically to meet the requirements of
major customers. ABS is readily modified both by the addition of additives and by variation
of the ratio of the three monomers Acrylonitrile, Butadiene and Styrene: hence grades
available include high and medium impact, high heat resistance, and electroplatable. Fiber
reinforcement can be incorporated to increase stiffness and dimensional stability. ABS is
readily blended or alloyed with other polymers further increasing the range of properties
available. Fire retardancy may be obtained either by the inclusion of fire retardant additives
or by blending with PVC. The natural material is an opaque ivory color and is readily colored
with pigments or dyes. Transparent grades are also available. Physical properties of ABS are
shown in Table 3.
Table 3 Properties of ABS
Tensile Strength (MPa) 40-50
Notched Impact Strength (Kj/m2) 10-20
Thermal Coefficient of Expansion (10-6) 70-90
Maximum Service Temperature (°C) 80-95
Density (g/cm3) 1.0-1.05
As a result of its good balance of properties, toughness/strength/temperature resistance
coupled with its ease of moulding and high quality surface finish, ABS has a very wide range
of applications. These include domestic appliances, telephone handsets computer and other


![Preparation of multiwall carbon nanotubes (MWCNTs ...€¦ · polymeric reinforcement[1–4].Theypossessoutstandingelec-trical, mechanical and thermal properties compared to conven-tional](https://static.documents.pub/doc/80x56/5f0d06527e708231d4384d8d/preparation-of-multiwall-carbon-nanotubes-mwcnts-polymeric-reinforcement1a4theypossessoutstandingelec-trical.jpg)


![Thermal Stability, Complexing Behavior, and Ionic Transport of Polymeric Gel Membranes Based on Polymer PVdF-HFP and Ionic Liquid, [BMIM][BF4]](https://static.documents.pub/doc/80x56/554a0cddb4c9058c5d8b4674/thermal-stability-complexing-behavior-and-ionic-transport-of-polymeric-gel-membranes-based-on-polymer-pvdf-hfp-and-ionic-liquid-bmimbf4.jpg)


