Thermal Comfort and Satisfaction in the Context of Social Housing: Case Study in Bogotá, Colombia
*Carolina M. Rodriguez1,2, Juan Manuel Medina1 and Andrés Pinzón3
Published online: 30 August 2019
To cite this article: Carolina M. Rodriguez, Juan Manuel Medina and Andrés Pinzón (2019). Thermal comfort and satisfaction in the context of social housing: Case study in Bogotá, Colombia. Journal of Construction in Developing Countries, 24(1): 101–124. https://doi.org/10.21315/jcdc2019.24.1.6.
To link to this article: https://doi.org/10.21315/jcdc2019.24.1.6
Abstract: Thermal comfort and satisfaction have been little studied in the context of social housing. Post-occupancy evaluations and research on occupant's satisfaction are particularly scarce. This article examines and characterises this problem through the detailed analysis of a case study in Bogotá, Colombia, which is representative of a large percentage of the current housing stock in the country and similar regions in Latin America. The construction of high-rise social housing in major cities like Bogotá has soared in recent years, due to population growth and displacement. However, there are serious concerns regarding its built quality. The methodology used in this study combines analysis through the perspectives of the static and the adaptive models and the interpretation of modes of adaptive behaviour. Data was collected during fieldwork via various means, including temperature and relative humidity measurements, observations and structured occupant surveys. Results give new insights regarding thermal comfort deficiencies and low levels of occupant's satisfaction in all apartments studied. Additional findings highlight the adequacy of the models used for the analysis and identify opportunities for improvement. This could be of interest to academics, policymakers, construction stakeholders and housing users.
The concept of "thermal comfort" commonly refers to an individual state of physical and mental wellbeing, which is directly linked to measurable variables including air temperature, mean radiant temperature (MRT), relative humidity (RH), air speed, metabolic rate (Met), and clothing insulation. According to the United Kingdom's (UK) Health and Safety Executive (HSE) the above are the six-main environmental and personal factors that influence thermal comfort (HSE, 2017). However, other studies indicate that levels of comfort in indoor environments are also relative to factors such as the age, sex and the sociocultural background of the occupants (Indraganti and Rao, 2010; Karjalainen, 2012). Therefore, comprehensive approaches that study this subject from different perspectives are suggested.
Thermal comfort deficiencies in buildings are found to have a negative impact on the occupants' wellbeing. For example, it is argued that in cold climates, inadequately insulated homes contribute to fuel poverty and a decline in physical
1Architecture Department, University of Los Andes, Bogotá, COLOMBIA2Architecture Programme, University Piloto de Colombia, Bogotá, COLOMBIA 3College of Architecture, Illinois Institute of Technology, Chicago, UNITED STATES OF AMERICA*Corresponding author: [email protected]; [email protected]
Carolina M. Rodriguez, Juan Manuel Medina and Andrés Pinzón
102/PENERBIT UNIVERSITI SAINS MALAYSIA
and mental health (Heyman et al., 2005). Living in cold and damp environments is associated with health risks such as cardiovascular disease, asthma and respiratory problems. In addition, social isolation and inequality are further promoted when these conditions are present in social housing, because occupants are very often unable to afford the cost of keeping dwellings adequately warm (Jones and Mays, 2016). Thermal comfort is one of the most immediate and direct aspects that influence occupants of the built environment. In early studies, thermal comfort was addressed through instrumental observations or theoretical simulations. However, field research involving samples of actual occupants in real buildings have highlighted the limitations of such models, allowing a clearer understanding of the subject (de Dear et al., 2013). It is argued that conventional theories of thermal comfort were based on laboratory experiments, which are not representative of real situation in buildings, especially when focusing on residential buildings where there is only a limited amount of data available (Peeters et al., 2009). In the case of Colombia, there is very little theoretical research on thermal comfort and detailed fieldwork is practically non-existent.
The general purpose of this study was to investigate levels of comfort and satisfaction in new high-rise social housing projects in the context of Bogotá (Colombian's capital); which is considered to have a cold climate and where the construction of social housing has rapidly increased in recent years. The main driver was the presumption – from past theoretical studies using computer simulations – which thermal comfort and occupants' satisfaction in these projects could be below acceptable levels. The central objective of the present work was to test this hypothesis within a post-occupancy scenario. Therefore, a case study methodology was chosen where real buildings were analysed via two different thermal comfort models, considering environmental measurements and information from the occupants collected on site. This aimed to prove the actual existence of this problem and also characterise it for future reference, as there is no precedent for this type of fieldwork in social housing in Colombia. In this context, the following research questions were established:1. In a post-occupancy scenario, is thermal comfort and occupant's satisfaction
– in social housing in Bogota – within the acceptable range according to set standards?
If not, then:2. How far are the current conditions from the desirable settings?3. What are the main sources of discomfort?4. How could the current conditions be improved?
CONTEXT OF THE STUDY
Bogotá is located within the tropics, at a regular altitude of 2,600 m above sea level, which contributes to creating cold climatic conditions with little seasonal variation throughout the year in terms of average temperature (± 14°C) and relative humidity (± 73%) (Figure 1[a]). Regions with similar climatic and social conditions in Latin America include cities such as Quito (Ecuador's capital) and other settlements within highland areas above humid subtropical areas ("Cfb climate" according to Köppen-Geiger classification). This type of climate within a tropical location was not
Thermal Comfort and Satisfaction in Social Housing
PENERBIT UNIVERSITI SAINS MALAYSIA/103
included in the American Society of Heating, Refrigeration, and Air-Conditioning Engineers (ASHRAE) RP-884 database, which was used as reference to develop the adaptive model (de Dear, Brager and Cooper, 1997). This database comprised four regions classified as Cfb climate: Melbourne, in Australia and Oxford, South Wales and Merseyside in the UK. However, these have very different climatic conditions compared to Bogotá, especially in relation to seasonal variations and altitude.
Regarding demographics, Colombia is the third most populated country in Latin America. Twenty percent of its population (approximately 10 million people) currently residing in Bogotá and its surrounding areas. The housing deficits in this city have risen in the last couple of decades due to the intensification of displacement from rural to urban areas and general population growth. This is likely to continue, since it is expected that by 2050 Bogotá's population will increase to 12 million, becoming the first megacity in Colombia (Cámara de Comercio de Bogotá [CCB], 2015). Therefore, the government have introduced various policies to promote the construction of social housing (Figure 1[b]). In Colombia, state social housing comprises two types of projects: Vivienda de Interés Social (VIS) and Vivienda de Interés Prioritario (VIP). VIS is social housing projects intended for people living in poverty or who are victims of forced displacement or natural disasters. VIP is priority housing projects intended for those in extreme conditions that require immediate assistance due to their vulnerability – including families with young children and the elderly.
VIS projects are the focus of this study since they represent nearly half of the total housing built in the country and it is in those where the public funds are concentrated. There are serious concerns regarding the build quality of these projects, which have been highlighted in past literature. For example, a study that examined social housing built in Bogotá between 2000 and 2007 showed that most projects are characterised by a poor aesthetic image, contribute to social segregation, fail to respond properly to the user's basic needs or benefit the most vulnerable and lack participatory design processes (Pérez, 2011). According to another study, new social housing units built in Bogotá between 2006 and 2015 only meet 47% of 108 quality indicators proposed to measure design, construction and urban aspects (Uniandes, 2017). 764 housing projects were evaluated in that study (357 were VIS, 54 were VIP and 353 were other housing), concluding that government's housing featured the poorest quality. A different study argued that the government's policies had a fundamental weakness, because they established a maximum price limit, but were very ambiguous in terms of the definition of the desired quality (Escallon and Rodriguez, 2010). The current government's price limit is based on the minimum monthly wage (MMW). It is set to 70 times the MMW for VIP and 135 times the MMW for VIS, which equates to approximately USD15,600 and USD30,000, respectively. In terms of building standards, only until 2015 did the Ministry of Housing, City and Territory present the first general guidelines for sustainable construction. These suggested the minimum measures that buildings (including all homes financed with public funds) had to meet from 2016 onwards to save water and energy (Ministerio de Vivienda, 2013). This legislation mainly focuses on reducing water and energy consumption in new buildings and strongly highlights the need to ensure indoor environmental comfort through passive strategies. However, there is still no prescription of the quality standards expected in this area.
Carolina M. Rodriguez, Juan Manuel Medina and Andrés Pinzón
104/PENERBIT UNIVERSITI SAINS MALAYSIA
Note: Coloured version of this figure is available in the online edition of Journal of Construction in Developing Countries.
Figure 1. Colombian Context in Data: (a) Bogotá's Climate, Year Averages (Data Retrieved from http://www.Bogotá.climatemps.com) and (b) Statistics
of Population Growth and Housing Construction (Departamento Administrativo Nacional de Estadistica [DANE], 2015)
The lack of national policy to establish and enforce minimum requirements in regard to environmental performance, comfort and satisfaction has contributed to a major disregard of these issues within the Colombian construction industry. As a result, there is very little research and information on the subject and the available studies mostly analyse thermal comfort through computer simulations, with limited onsite data collection. For example, Hernandez (2012) modelled the applicability of the principles set by the Passivhaus Standard in typical social housing projects in Colombia. A similar study examined the relation between urban density and the thermal behaviour of buildings within a social housing neighbourhood in Bogotá; suggesting that poor orientation and vertical and horizontal obstructions had a direct influence on potential discomfort rates in these buildings (Cifuentes-Cuellar and Kämpf, 2013). In addition, Agudelo (2014) modelled levels of comfort inside a representative typology of social housing, reporting that indoor spaces (especially living rooms) were outside an assumed thermal comfort zone of 20°C–24°C during more than 50% of the time in an average year.
Thermal Comfort and Satisfaction in Social Housing
PENERBIT UNIVERSITI SAINS MALAYSIA/105
METHODOLOGY
A case study methodology was chosen for this research, seeking to give a general view of the context of thermal comfort in Bogotá. The selected case study illustrates the main characteristics present in most of the recently built social housing projects. Qualitative and quantitative data was collected during field work via various methods, including occupant's surveys, rating scales and simultaneous indoor and outdoor environmental measurements. The outdoor measurements used were taken from Meteorological Aerodrome Report-Terminal Aerodrome Forecast (METAR-TAF) at El Dorado airport in Bogotá – provided by the Instituto de Hidrología, Meteorología y Estudios Ambientales (Colombian Institute of Hydrology, Meteorology and Environmental Studies) (IDEAM) (2014). Thermal comfort analysis was carried out using two different models: the static model and the adaptive model, taking the guidelines set by the American National Standards Institute (ANSI)/ASHRAE Standard 55 (2013) as reference. An additional theory on modes of adaptive behaviour proposed by Shin (2016) was used aiming to examine the same phenomenon from diverse perspectives.
CASE STUDY
The case study was a residential project comprising 456 VIS apartments in Mosquera, a town geographically located 25 km away from Bogotá, at 4°70´N latitude, 74°23´W longitude and 2,516 m altitude. Many similar towns developed within the outskirts of Bogotá have recently become a prime area for development in social housing (Martinez, 2015). Figures indicate that approximately 42% of the total VIS projects built since 2012 in this region (approximately 20,000–25,000 units) are of similar design and construction to the selected case study (DANE, 2015). This residential project comprises 19 six-storey towers with four apartments on each floor, built using tunnel-form construction (as shown in Figure 2). The facades are formed by single-leaf brick walls (12 cm thick) with the brick exposed on the outside, a layer of render on the inside and with no insulation. These are supported directly onto 10 cm-thick concrete slabs. Internal partitions are 10 cm-thick concrete walls with a sloping metal roof supported over the top-floor-unit slab, with a 70 cm non-ventilated cavity at its highest point. The windows are single-glazed (4–6 mm thick glass) and aluminium-framed, with no thermal breaks or additional insulation (Table 1). All the selected apartments were naturally ventilated, which is representative of Bogotá's constructions as residential heating, ventilation and air conditioning (HVAC) systems are uncommon.
During initial site visits, ventilation and condensation problems were observed. These can be attributed to various factors. For example, buildings with tunnel form construction are known to be prone to cold bridging if the envelope is not adequately insulated, which is the case in the chosen project. The windows in all apartments featured fixed top vents, which are constantly open. However, these are very often covered with cardboard by the apartment's occupants to avoid the filtration of cold air, but such measures can increase condensation. In addition, VIS units are normally sold in a "grey work condition"; in other words, internal finishes on walls, floors or ceilings are not provided, leaving the occupants to install them. In many cases, these finishes are built with poor detailing and materials that contribute further towards the increase of condensation and insulation problems.
Carolina M. Rodriguez, Juan Manuel Medina and Andrés Pinzón
106/PENERBIT UNIVERSITI SAINS MALAYSIA
Figure 2. Characteristics of the Case Study: (a) Section through the Living/Dining Room, (b) External View, (c) Detail of the Window Vent, (d) Windows to the
Courtyard and (e) Detail of the Window Frame
Table 1. Thermal Characteristics of the Existing Envelope Components: The U Values were Estimated Using DesignBuilder Software
Component
Description (From the Outside to Inside Layers)
Estimated insulating Properties (U-Value)
Component
Description (From the Outside to Inside Layers)
Estimated insulating Properties (U- Value)
Windows Translucent glass4 mm thickTotal solar transmission (SHGC): 0.768Direct solar transmission: 0.741
U = 3.835 W.m–2.K–1
Roofnon-ventilated cavity(700 mm thick at highest point)
Aluminium corrugated sheets
U = 2.55 W.m–2.K–1
Light transmission: 0.821
Reinforced concrete slab(100 mm thick)
Aluminium frame with no thermal breaks or additional insulation
(continued on next page)
Thermal Comfort and Satisfaction in Social Housing
PENERBIT UNIVERSITI SAINS MALAYSIA/107
Component
Description (From the Outside to Inside Layers)
Estimated insulating Properties (U-Value)
Component
Description (From the Outside to Inside Layers)
Estimated insulating Properties (U- Value)
Brickfacade
Single leaf brick wall(120 mm thick)
U = 3.174 W.m–2.K–1
Partition walls
Single leaf reinforced concrete wall(80mm thick)
U = 4.153 W.m–2.K–1
Stucco finish coat(3 mm thick)
Concretefacade
Single leaf concrete wall(100 mm thick)
U = 3.836 W.m–2.K–1
Floor slabs Reinforced concrete slab(100 mm thick)Ceramic flooring(3 mm thick)
U = 3.869 W.m–2.K–1
Stucco finish coat(3 mm thick)
Overall envelope
Window-to-wall ratio (WWR) in the towerWindow-to-wall ratio (WWR) in TZ1
32.9%56.7%
Data Collection
At the time of this study, some of the apartments were still under construction with an occupancy rate of 66%, which equates to approximately 300 apartments being inhabited. Forty-four of these apartments were selected for the sample (14.6%). They featured the same layout, but were distributed in different towers and floors (as shown in Figure 3). They were classified into four groups according to their orientation (northeast-facing, southwest-facing, southeast-facing and northwest-facing) and into three groups according to their position within the building (ground floor, intermediate floors and top floor). Measurements were collected between November 2015 and April 2016. This period shows climatic variations that are typical during the rest of the year, as it can be observed in Figure 1(a). Therefore, the sample was considered adequate for a relative comparison between indoor and outdoor conditions at any given time during a regular day. The sample was uniformed in terms of apartment configuration, facades exposed to the outdoors, type and number of occupants and time in which the survey was taken. The collected data was also reasonably uniformed in terms of temperature and RH ranges, indicating reliability.
Three different measurement tools were employed: data loggers, a post-occupancy evaluation survey and an occupant's rating scale. Each 70 m2 apartment was divided into nine thermal zones (as shown in Figure 3[a]). The environmental measurements used for this study were taken from thermal zone TZ1 comprising the living/dining room. This is a 13.3 m2 and 2.3 m high room, with an average occupancy of four people. It is located in one corner of the apartment, with two facades (exposed to the outdoors) comprising approximately 5.5 m2 of windows and 9.7 m2 of brick wall. According to the previous theoretical research, this is one of the most used spaces in the apartment and the one with most facade
Table 1. (continued)
Carolina M. Rodriguez, Juan Manuel Medina and Andrés Pinzón
108/PENERBIT UNIVERSITI SAINS MALAYSIA
area. HOBO U12 data loggers (accuracy: ± 0.35 % °C temperature, ± 2.5% humidity, according to the manufacturer) were placed approximately at 70 cm above the floor in the centre of the room and away from sun exposure or other heat sources. They were used for 24-hour periods to collect data on temperature and humidity at one hour intervals.
Note: Coloured version of this figure is available in the online edition of Journal of Construction in Developing Countries.
Figure 3. Case Study: (a) Apartment Layout Indicating the Studied Thermal Zone, (B) Apartment Arrangement on Each Tower and (C) Tower Distribution
The post-occupancy evaluation survey comprised 36 questions aimed at quantifying occupants' satisfaction regarding thermal comfort, air quality, acoustics, lighting, spatial layout, aesthetics, adaptability and general perception (as featured in Figure 4[a]). This survey was developed taking as reference a study on adaptive models by de Dear and Brager (2001) and a survey proposed by the Center for the Built Environment (CBE) (2016). Forty-four people were interviewed (one occupant in each apartment), including 23 females and 21 males, in the age range of 20–60 years old (25% of them were between 20–30 years old, 43% were between 31–40 years old, 27% were between 41–60 years old and 5% were above 60 years old). For this article, only information related to thermal comfort and general satisfaction was considered (21 questions). The surveys were taken face-to-face at the beginning of the studied day (usually between 7:00 a.m.–8:00 a.m.).
In addition, an occupant's rating scale (as shown in Figure 4[b]) was used to collect information from the occupants at four times throughout the studied day (7:00 a.m., 12:00 p.m., 5:00 p.m. and 7:40 p.m.), whilst the data loggers were simultaneously monitoring. These times were considered significant within the occupant's routines, as they marked usual changes in activities and different conditions for the outdoor
Thermal Comfort and Satisfaction in Social Housing
PENERBIT UNIVERSITI SAINS MALAYSIA/109
climate. The first rating scale was filled out by the occupants at the beginning of the measurements and after completing the survey. The occupants were contacted by phone at the times mentioned above to assist them in filling out the remaining rating scales.
The design of this occupant's rating scale was based on an example proposed in a previous study (Langevin, Gurian and Wen, 2015), where two main types of ratings were used: interval scale ratings and multiple-choice ratings. The interval scale ratings aimed at evaluating thermal perception and sensation (McIntyre and Gonzalez, 1976). They were divided into ordinal scale (from "Very Satisfied" to "Very Dissatisfied") and ratio scale (hours per day). The multiple-choice ratings were designed to find out about activity (i.e. cooking, sleeping, watching television [TV], eating, housekeeping), clothing (i.e. "Very Warm", "Warm", "Light", "Very Light"), air quality (i.e. "Polluted", "Stuffy", "Clean"), daylight and artificial light (i.e. "Inadequate", "Adequate", "Excessive") and external noise (i.e. "Quiet", "Mild", "Moderate", "Intense"). The results collected from activity levels and clothing descriptions were coded to establish the Met and clo values that were used during the analysis with the static model. Activity levels were coded as cooking = 2.0 Met, sleeping = 0.8 Met, watching TV = 1.0 Met, eating = 1.2 Met and housekeeping = 2.0 Met. Clothing descriptions were coded as "Very Heavy" = 1.5 clo, "Heavy" = 0.7 clo, "Light" = 0.5 clo and "Very Light" = 0.3 clo.
Figure 4. (a) Example of the Questions Included in the Survey and (b) Example of an Occupant's Rating Scale
Analysis Methods
The static model and the adaptive model are the two most widely used methods to study indoor thermal comfort. They were used in parallel for this study, aiming to assert their validity in this particular context. The static model, which is based on a model developed by Fanger (1970), combines the analysis of objective physical measurements and subjective occupant perceptions. It is considered suitable for all building types; however, its accuracy depends on the precision of the input
Carolina M. Rodriguez, Juan Manuel Medina and Andrés Pinzón
110/PENERBIT UNIVERSITI SAINS MALAYSIA
parameters, particularly clothing and activity levels. This method calculates the Predicted Mean Vote (PMV), which describes comfort sensation according to a set index and the Predicted Percentage of Dissatisfied (PPD), which forecasts the percentage of occupants that will be dissatisfied with the thermal condition.
For this study, PMV analysis was conducted using the temperature and RH values collected with the data loggers. MRT values were assumed to be equal to air temperature values, since various studies concluded that the differences between them are in most cases negligible for indoor environments (Kántor and Unger, 2011; Walikewitz et al., 2015). In addition, a dynamic thermal simulation run in EnergyPlus™ (as shown in Figure 5) showed that the difference between the average air temperature and MRT for the studied case was only 0.13°C. Therefore, it was considered reasonable to assume these values to be equal. Using the guidelines set by the International Organization for Standardization (ISO) 7730:2005 (ISO, 2005), air velocity was taken as 0.1 m/s. Average values for clothing insulation and activity levels were taken from the information collected via the occupant's rating scales. Clothing insulation scored heavy on average, therefore, 0.74 clo was the value chosen for the analysis, since it corresponds to a combination of "sweatpants and long-sleeved sweatshirts", according to the Clothing Ensembles Table by ANSI/ASHRAE Standard 55 (2013). This is the framework used by the CBE thermal comfort web-based tool, which was employed during the analysis carried out for the present work (Tyler et al., 2017). Watching TV or eating were the most common activities recorded on the occupant's rating scales. Therefore, 1.1 Met was used for the analysis since it relates to sedentary or light intensity activities such as resting, reading, or typing, according to the Metabolic Rates for Typical Tasks Table by the ANSI/ASHRAE Standard 55 (2013). 2% of all the collected measurements and surveys were discarded due to irregularities, such as the use of heating devices (e.g. plug-in heaters) by the occupants during the time of the study or calibration problems with the data loggers.
Note: Coloured version of this figure is available in the online edition of Journal of Construction in Developing Countries.
Figure 5. Dynamic Thermal Simulation of the Average Air Temperature and MRT for the Case Study
Past field studies have shown discrepancies between the predicted mean vote found with the static method and the observed comfort votes during surveys (Schweiker et al., 2013). The influences of behavioural, physiological and psychological adaptive processes are presumed reasons for this. Therefore, the
Thermal Comfort and Satisfaction in Social Housing
PENERBIT UNIVERSITI SAINS MALAYSIA/111
adaptive model is increasingly used. It considers the role of human agency in achieving comfort through the continuous adjustments of the personal, social and physical factors of the surroundings (de Dear and Brager, 2001). It is applicable for the analysis of naturally conditioned spaces such as the spaces in this case study, where prevailing mean temperatures are greater than 10°C and less than 33.5°C and where occupants engage in sedentary activities equivalent to 1–1.3 Met. The adaptive model is commonly recommended where the outdoor climate significantly affects the indoor conditions, so the comfort zone varies in relation to the PMV/PPD method (Heinzerling et al., 2013; Lai et al., 2009). It is presumed that due to behavioural and psychological adjustments, occupants living in naturally conditioned spaces can tolerate a wider range of temperature (Brager and de Dear, 1998). However, the adaptive model guidelines are not precise in terms of ways to interpret behavioural or psychological adaptation. Therefore, the analysis here was complemented with a theory of environmental satisfaction proposed by Shin (2016), which was adapted from Shin and Jorn (2013) and Morris and Winter (1975). This theory suggests ways to interpret and study the occupant's modes of adaptive behaviour.
RESULTS WITH THE STATIC MODEL
The thermal comfort analysis with the static model concentrated on identifying three main aspects: (1) operative temperature and relative humidity fluctuations, (2) compliance with comfort ranges according to the PMV and (3) potential dissatisfaction according to the PPD. This section presents the results in these areas.
Temperature and Relative Humidity
As it can be seen in Figure 6(a), outdoor temperatures in the case study fluctuate significantly throughout the day, ranging from a minimum of 11.5°C at 6:00 a.m. to a maximum of 19°C at 1:00 p.m. Fluctuations of this type are common in Bogotá as shown in Figure 1(a), which illustrates up to 11°C and 12°C variations between maximum and minimum average temperatures. Inside the building, temperatures also fluctuate according to the position and orientation of the apartments. Indoor air temperatures in southwest-facing apartments are the most variable, ranging from 18.3°C to 22.3°C (a 4°C fluctuation), whilst temperatures in northeast-facing apartments are the most stable, ranging from 18.5°C to 19.5°C (a 1°C fluctuation). Regarding the position of the apartments, the fluctuation is on average 3°C between maximum and minimum temperatures throughout the day in each case (ground floor, intermediate floor and top floor) (as indicated in Figure 6[b]). According to the ANSI/ASHRAE Standard 55, temperature fluctuations of 2.2°C or greater within one hour highly contribute to thermal discomfort within indoor environments. This scenario was not present in the recorded measurements, although there were some cases of fluctuations close to 2°C within one hour.
Regarding humidity, outdoor RH fluctuated between 55%–90%, whilst indoor RH remained fairly steady at an average of 70% in all the studied apartments (as shown in Figures 7[a] and 7[b]). Although in the ANSI/ASHRAE Standard 55 there are no designated humidity parameters for thermal comfort, other factors may place limits on acceptability. For example, high levels of humidity have been linked to susceptibility to viruses, allergies and asthma (du Prel et al., 2009). In addition, a
Carolina M. Rodriguez, Juan Manuel Medina and Andrés Pinzón
112/PENERBIT UNIVERSITI SAINS MALAYSIA
study shows that the majority of these adverse health effects would be minimised by maintaining indoor RH levels between 40% and 60% (Arundel et al., 1986).
Note: Coloured version of this figure is available in the online edition of Journal of Construction in Developing Countries.
Figure 6. (a) Average Temperatures According to Apartment Orientation in Relation to Outdoor Temperature and (b) Average Temperatures According to
Apartment Level in Relation to Outdoor Temperature
Thermal Comfort and Satisfaction in Social Housing
PENERBIT UNIVERSITI SAINS MALAYSIA/113
Note: Coloured version of this figure is available in the online edition of Journal of Construction in Developing Countries.
Figure 7. (a) Average % RH According to Apartment Orientation and (b) Average % RH According to Apartment Level
PMV and PPD
According to the PMV temperature-relative humidity charts, the overall comfort zone for these apartments was calculated to be in the range of 22°C–36°C in relation to the RH (as shown in Figure 8). For the average RH of 70% the comfort zone temperature ranges between 23°C–31°C. These values vary greatly in comparison to a former recommended range of 19°C–28°C by ANSI/ASHRAE Standard 55 in 2004. According to that range, the registered temperatures in the case study would be within the comfort zone. However, with the latest guidelines average temperature measurements are substantially outside the comfort zone for all apartments, when MRT, RH, air speed, Met and clothing level are considered (as shown in Figure 8). Northeast-facing apartments are further away from the comfort zone, since they received slightly less hours of sunlight during the period of the study. The same happens with apartments located on the top floors, since they have the most exposed surfaces.
According to the ANSI/ASHRAE Standard 55, the percentage of satisfied people in regard to thermal comfort should be 80%–90% of the occupants, with an ideal level of dissatisfaction of 10% or less. As shown in Figure 9, the percentages of dissatisfaction due to cold temperatures in all studied cases reached levels of up to 65% of the occupants. Given that PPD is a function of PMV, when PMV moves
Carolina M. Rodriguez, Juan Manuel Medina and Andrés Pinzón
114/PENERBIT UNIVERSITI SAINS MALAYSIA
further away from the comfort zone, then PPD increases. Therefore, dissatisfaction results are higher in northeast-facing apartments, particularly in the period from 5:00 a.m. to 9:00 a.m. (as shown Figure 9[a]). A similar behaviour is observed in top floors (as featured in Figure 9[b]), where dissatisfaction levels are 60% on average.
Note: Coloured version of this figure is available in the online edition of Journal of Construction in Developing Countries.
Figure 8. Temperature‐Relative Humidity Charts Using the CBE Tool for the Static Model (PMV): (a) Average According to Apartment Orientation and (b) Average
According to Apartment Level
Note: Coloured version of this figure is available in the online edition of Journal of Construction in Developing Countries.
Figure 9. Dissatisfaction According to the Static Model (PPD): (a) According to Apartment Orientation and (b) According Apartment Level
Thermal Comfort and Satisfaction in Social Housing
PENERBIT UNIVERSITI SAINS MALAYSIA/115
RESULTS WITH THE ADAPTIVE MODEL
This section shows the results of the thermal comfort analysis with the adaptive model, which concentrated on identifying three main aspects: (1) acceptability levels for each apartment type, (2) perceived occupant satisfaction and (3) modes of adaptive behaviour. The acceptability levels were studied using the CBE thermal comfort web-based tool for this method (Tyler et al., 2017). The perceived occupant satisfaction and modes of behaviour were analysed by codifying data collected with the surveys and occupant's rating scales.
Acceptability Limits and Perceived Occupant Satisfaction
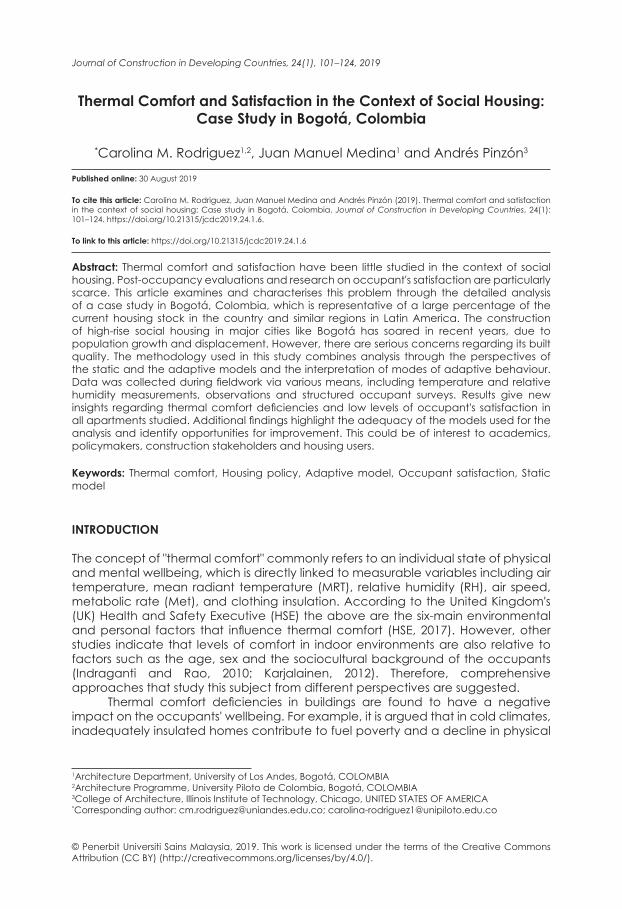
In general, adaptive charts illustrate a comfort zone of 80% and 90% satisfaction (acceptability limits) according to the operative temperature and the prevailing mean outdoor temperature. Personal factors and humidity are not used in the production of the charts in this method since adaptation is considered. The prevailing mean outdoor temperature is calculated with the average of the mean daily outdoor temperatures over no fewer than seven days and no more than 30 sequential days prior to the day in question, according to the ANSI/ASHRAE Standard 55. For the case study, the input variables for the adaptive charts were: air temperature (from the data loggers), MRT (assumed to be equal to air temperature) and prevailing mean outdoor temperature (taken from METAR-TAF at El Dorado airport in Bogotá, at 4°43´N latitude, 74°9´W longitude and 2,547 m altitude). The option of 0.3 m/s for the air speed value was used as advised by the ANSI/ASHRAE Standard 55 when operative temperatures are lower than 25°C. As shown in the charts of Figure 10, all apartments studied are outside the 90% satisfaction comfort zone. Regarding the orientation of the apartment, the southwest-facing and southeast-facing apartments are within the 80% satisfaction zone. Regarding the apartment level, the intermediate and ground floor apartments are also on the border of the 80% satisfaction zone. Northeast-facing and top floor apartments are further away from the comfort zone, a tendency that is consistent with the results drawn with the static model.
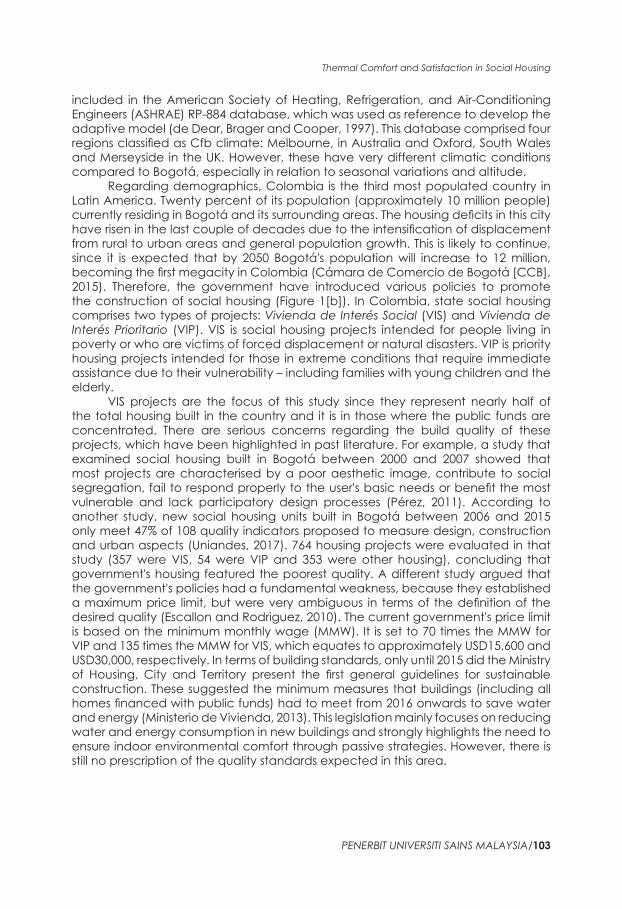
In order to complement the adaptive charts, the perceived occupant's satisfaction was analysed by codifying data on temperature collected with the occupant's rating scales (as provided in Figure 11). Data, which were collected at four times during the day, were averaged to obtain a reference for a 24-hour period. These values were coded using a similar convention to the PPD method as: –3 = "Very Cold", –2 = "Cold", –1 = "Slightly Cold", 0 = "Neutral", 1 = "Slightly Warm", 2 = "Warm" and 3 = "Very Warm". These codes were then used to generate the charts illustrated in Figure 11, where values reach levels of dissatisfaction of up to 80%. The results were consistent with the PPD measurements for the static model in terms of the percentage of dissatisfied. However, the charts show that the period of most dissatisfaction is the evening and night-time from 7:00 p.m. to 3:00 a.m., instead of the morning as registered with the PPD model.
Carolina M. Rodriguez, Juan Manuel Medina and Andrés Pinzón
116/PENERBIT UNIVERSITI SAINS MALAYSIA
Note: Coloured version of this figure is available in the online edition of Journal of Construction in Developing Countries.
Figure 10. Charts Using the CBE Tool for the Adaptive Model: (a) Average According to Apartment Orientation and (b) Average According to Apartment
Level
Note: Coloured version of this figure is available in the online edition of Journal of Construction in Developing Countries.
Figure 11. Dissatisfaction According to Analysis of the Rating Charts: (a) According to Apartment Orientation and (b) According to Apartment Level
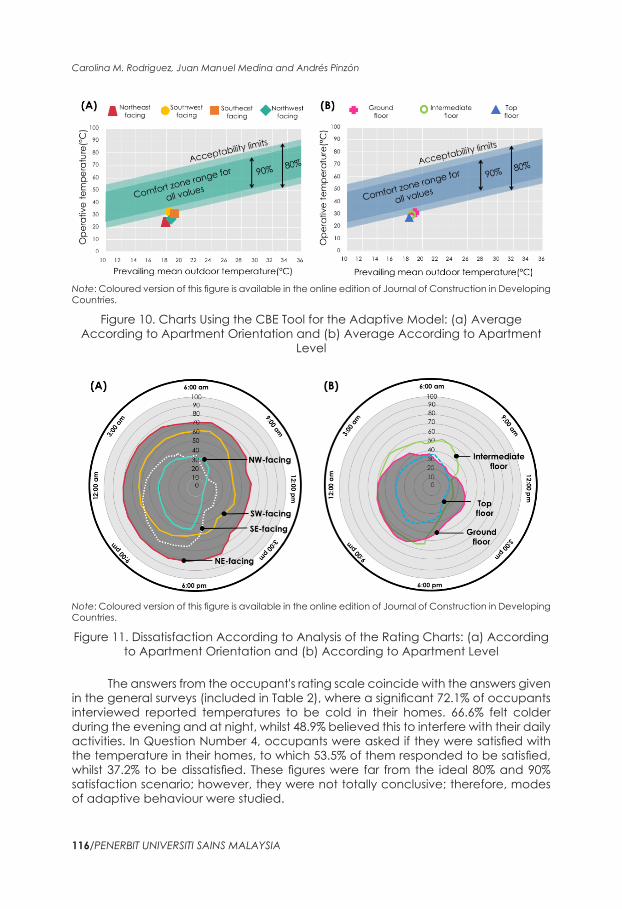
The answers from the occupant's rating scale coincide with the answers given in the general surveys (included in Table 2), where a significant 72.1% of occupants interviewed reported temperatures to be cold in their homes. 66.6% felt colder during the evening and at night, whilst 48.9% believed this to interfere with their daily activities. In Question Number 4, occupants were asked if they were satisfied with the temperature in their homes, to which 53.5% of them responded to be satisfied, whilst 37.2% to be dissatisfied. These figures were far from the ideal 80% and 90% satisfaction scenario; however, they were not totally conclusive; therefore, modes of adaptive behaviour were studied.
Thermal Comfort and Satisfaction in Social Housing
PENERBIT UNIVERSITI SAINS MALAYSIA/117
Table 2. Examples of Survey Questions and Answers Regarding Thermal Comfort
Question Answers
1. How can you describe the temperature in your home?
Cold Warm
27.9% Very Cold
30.2% Cold14.0% Slightly Cold
23.3% Neutral
4.6% Slightly Warm
0% Warm0% Very Warm
2. How satisfied are you with the temperature in your home?
Dissatisfied Satisfied
9.3% Very Dissatisfied
27.9% Dissatisfied
9.3% Indifferent
41.9% Satisfied
11.6% Very Satisfied
3. In general, how does temperature interfere with or enhance your daily activities?
It interferes It enhances
7.0% Very Detrimental
41.9% Detrimental
18.6% Indifferent
25.5% Slightly Helps
7.0%Helps a Lot
4. If you are dissatisfied with the temperature in your home, when is this most often a problem?
15%Morning6 a.m.– 11 a.m.
3.3%Midday11 a.m.–2 p.m.
8.3%Afternoon
2 p.m.– 5 p.m.
26.6% Evening5 p.m.– 11 p.m.
40% Night
11 p.m.–6 a.m.
6.6% None
MODES OF ADAPTIVE BEHAVIOUR
According to Shin's theory of environmental satisfaction (Shin, 2016), as mentioned previously, the optimisation process undertaken by individuals in an effort to mitigate discomfort may involve four stages: (1) environmental modifications to the existing physical elements of the space, (2) behavioural adaptations, (3) adjustments to personal expectations or norms and (4) withdrawal from the space. Evidence of three of these modes of adaptive behaviour were found in the surveys carried out for the case study (as shown in Figure 12). When residents were asked "How would you best describe the source of this discomfort?", the responses were very much related to the built environment. Most of the discomfort originates from elements comprising the envelope of the building, such as windows and surrounding surfaces. For example, the sources of discomfort were identified as draughts from windows (33.3%), excessive air movement (23.8%), cold surrounding surfaces (floor, ceiling, walls or windows) (19%), others (localisation, external vegetation) (7.9%), lack of sunlight (6.3%), humidity too high (damp) (4.8%), too much light (3.2%) and lack of ventilation (1.6%). Therefore, when residents were asked "If you are dissatisfied with the temperature in your home, how could you improve this situation?", most of the answers related to environmental modifications to the existing physical elements of the space. For example, 32.6% of them would like to install heating, 17.4% would
Carolina M. Rodriguez, Juan Manuel Medina and Andrés Pinzón
118/PENERBIT UNIVERSITI SAINS MALAYSIA
like to close the window vents, 13.0% would install thick curtains, 10.9% would like to change surface materials, 6.5% would change windows or doors, 4.3% would buy more furniture, 2.2% would cover the internal courtyard, 2.2% would reduce humidity and 2.2% would improve lighting conditions. There were fewer answers related to behavioural adaptations, as only 2.2% of the residents would consider dressing warmly. In contrast, 6.5% of them would consider withdrawing from the space by moving to an apartment with a different location or layout. None of the interviewees mentioned aspects related to adjustments of personal expectations or norms. However, according to the levels of satisfaction registered during the interview, it can be argued that some occupants might have changed their expectations already, accepting the condition as "normal". For example, the survey shows that occupants would ideally modify their environmental setting. However, many commented that this was very difficult due to a lack of economic resources. This coincides with Shin's research suggesting that when environmental modification is not a viable option (which could be the general case in social housing), people are likely to change their behavioural patterns or their expectations. This was also noted within the rating tables, where occupants were already wearing warm clothing indoors. The survey included further questions seeking to interpret how occupants would behave if economic resources were not a definite constraint. When occupants were asked "Would you be willing to pay to improve the conditions you are not satisfied with in your home?", 84.1% of them responded yes. Fifty percent of them would invest a minimum monthly salary (MMS) toward improvements, 31.6% would invest between two and five MMSs and 18.4% would invest more than six MMSs. When given the scenario of buying a new house, 51.2% of occupants said that they would be willing to pay between 10%–15% more above the asking price for a better-quality unit, 19.5% would pay more than 20% more above the asking price, 17.1% would pay less than 5% from the asking price and 12.2% would pay between 16%–20% more above the asking price.
Figure 12. Survey Questions and Answers Regarding Modes of Adaptation
Thermal Comfort and Satisfaction in Social Housing
PENERBIT UNIVERSITI SAINS MALAYSIA/119
CONCLUSIONS
This study aimed to corroborate, strengthen and advance findings from previous studies on thermal comfort in social housing in Bogotá, which used computer simulations. It succeeded in confirming, through other scientific methods, that for the examined case indoor conditions are below an acceptable comfort zone, which results in low levels of satisfaction. Since the chosen case study is representative of a large percentage of the current social housing built in Bogotá and surrounding areas, the findings can be generalised. It can be argued that the answer to the first research question is very likely to be negative, as it was found in a representative case study that thermal comfort and occupant's satisfaction is outside the recommended limits set by current international benchmarks.
The methodology used for this work allowed specific conclusions to be drawn in terms of the data collected during the fieldwork and the models used for the analysis. These are discussed in this section, aiming to answer the other research questions regarding the state of the current conditions compared to the recommendations, the main sources of discomfort and the opportunities for improvement.
Remarks from the Data Gathered during the Fieldwork
Indoor temperatures and RH fluctuations are minor; however, the combination of low temperatures and high RH contributes to poor conditions of thermal comfort, as demonstrated with the analysis carried out with both the static and adaptive models. 1. Indoor temperature fluctuations of up to 4°C between maximum and minimum
values throughout the day relate directly to outdoor fluctuations of up to 11°C, which suggests poor thermal performance of the building's envelope.
2. Indoor temperature fluctuations were less than 2.2°C within one-hour intervals during the period studied; however, values went down to 17°C and 18°C, which are considerably low. Levels of relative humidity inside the apartments were fairly constant throughout the day, but significantly high at 70%, in relation to the recommended 40%–60%.
3. Thermal comfort conditions are the worst for top floors followed by lower floors, which is due to considerable thermal losses through the roof and the ground. Intermediate floors are on average 1°C warmer with 2% less relative humidity compared to the lower floors and 2°C warmer with 4% less relative humidity compared to the top floors.
4. Northeast-facing apartments were the most affected during the period studied (November–April), followed in order by northwest-facing, southeast-facing and southwest-facing apartments. Northeast-facing apartments were 2°C colder and 10% more humid on average than southwest-facing apartments, with differences of up to 4°C and 15% RH between 1:00 p.m.–4:00 p.m.
5. It is presumed that southwest-facing apartments will have similar conditions to northeast-facing apartments between May and August due to the change of the sun path.
6. The worst thermal conditions were found in top floor and northeast-facing apartments. In contrast, the best conditions were found in intermediate floors and southwest-facing apartments.
Carolina M. Rodriguez, Juan Manuel Medina and Andrés Pinzón
120/PENERBIT UNIVERSITI SAINS MALAYSIA
7. Percentages of occupant dissatisfaction, calculated with the static model, are high at 60%, which coincides with the values given by the rating tables that reach up to 80%.
8. The analysis of the survey, in terms of modes of adaptive behaviour, demonstrates that most of the occupants believe their thermal discomfort originates from elements comprising the apartment's envelope. This situation suggests that changes and adjustments to windows and facades would improve this condition.
9. Given the option, a significant percentage of occupants would like to install heating systems, which is a major concern when, as illustrated by past research (Hernandez, 2012), thermal comfort in Bogotá's social housing can be achieved via passive design strategies only, without additional energy consumption.
10. Draughts from windows were identified as a major source of discomfort, followed by cold surrounding surfaces. This highlights opportunity for improvement in the design and construction of these elements. Furthermore, the survey revealed that most occupants are willing to invest capital in these improvements.
Remarks from the Methodology
1. For the conditions of the case study, there were discrepancies between the results from the analysis with the static model and the adaptive model. In the charts for the static model, the conditions in the studied apartments were further away from the recommended settings, compared to the charts for the adaptive model.
2. It has been argued that the adaptive model could be more suitable for the study of naturally ventilated indoor environments. However, the levels of dissatisfaction registered in the surveys and rating tables in the case study were much higher than the predicted with the charts for this model.
3. The information collected from the occupants was better understood in light of additional theories of adaptive behaviour. This result validates, to a certain extent, past theoretical framework of environmental satisfaction and human comfort, which highlights the role of human agency in the interaction between occupants and building. However, the analysis of adaptive behaviour relies on the collection of a considerable amount of qualitative data from occupants, which limits its use for the design of new builds.
4. The modes of adaptive behaviours suggested by Shin corresponded with the processes undertaken by the occupants to mitigate discomfort in the case study. This supports the relevance of this theory within this context.
Opportunities for Improvement
The findings of this study underline an unsolved problem that affects a great number of people. This is an important aspect to consider, since low temperatures and high RH levels have been linked to a variety of illnesses. Such relation highlights that thermal comfort is not a commodity in the context of Colombia but a health and wellbeing issue. It is also presumed that the same conditions found in social housing are present in other types of housing in Bogotá, which share similar design and are constructed with comparable techniques and materials. However, this assumption needs further investigation to be conclusive, which opens an opportunity for further research.
Thermal Comfort and Satisfaction in Social Housing
PENERBIT UNIVERSITI SAINS MALAYSIA/121
Based on the present experience, future field work on thermal comfort in social housing may require additional on-site testing of variables such as MRT and air velocity. Due to resource limitations, the values used here were taken from general guidelines and standards. However, the discomfort manifested by the occupants – due to draughts and surface materials – indicates that these values in reality could be higher than expected. Therefore, more precise measurements would help to study this area in detail.
For buildings such as the case study, the main problem is the poor thermal performance of the existing building envelope, as the main thermal mass (brick wall) is insulated providing minimal thermal resistance. In addition, the uncontrolled air filtration and leakage through the window frames increases heat losses and contributes towards uncomfortable internal environments. These problems can be improved with material changes and better detailing. Modest modifications such as added layers of internal and/or external insulation and window shutters could greatly enhance indoor thermal conditions and comfort. For example, for new constructions or government led retrofits, facade systems with external insulation are ideal to avoid cold bridging and damp penetration, without reducing internal space. However, in existing constructions where renovations are carried out by individual owners, an internal stud wall construction with bulk insulation and vapour barrier might be the most suitable solution. In both cases, better window options are needed to control airflow and reduce condensation. For example, double-glazed and thermally-broken windows are an alternative solution for new builds and storm-windows or window insulation for renovations. Foam insulation within the roof-ceiling cavity and suspended flooring with underside insulation is advisable for the apartments in the top and ground floors. Other strategies, such as extractor fans in bathrooms and kitchens or dehumidifiers might be needed to reduce humidity levels in extreme cases.
This area underlines important questions and research gaps that need further examination to develop or to adapt more efficient facade systems, which already exist and are used successfully in other countries. However, these efforts require to be supported with stricter national legislation and more precise standards regarding acceptable levels of indoor comfort. In this context, the insights of this study are useful to policy makers, construction stakeholders and people who make decisions in this field, because they help to prove that there is a problem that needs resolving.
ACKNOWLEDGEMENTS
This study was supported by the Department of Architecture at University of Los Andes. The authors acknowledge the special contribution of Andres Mauricio Garcia and the research assistants: Fabio Florez, Maria Paula Cerquera and Alvaro Gomez.
Carolina M. Rodriguez, Juan Manuel Medina and Andrés Pinzón
122/PENERBIT UNIVERSITI SAINS MALAYSIA
REFERENCES
Agudelo, C. (2014). Efecto de los materiales de los muros y ventanas sobre el confort térmico y de iluminación natural en la vivienda de interés social actual de Bogotá (The effect of the walls' materials and windows on the thermal comfort and natural lighting in current social housing in Bogotá). MEng diss. Universidad de Los Andes.
American National Standards Institute/American Society of Heating, Refrigerating and Air-Conditioning Engineers (ANSI/ASHRAE) (2013). ANSI/ASHRAE Standard 55: 2013 Thermal Environmental Conditions for Human Occupancy. Atlanta: ASHRAE.
Arundel, A., Sterling, E., Biggin, J. and Sterling, T. (1986). Indirect health effects of relative humidity in indoor environments. Environmental Health Perspectives, 65(3): 351–361. https://doi.org/10.1289/ehp.8665351.
Brager, G. and de Dear, R. (1998). Thermal adaptation in the built environment: A literature review. Energy and Buildings, 27(1): 83–96. https://doi.org/10.1016/s0378-7788(97)00053-4.
Cámara de Comercio de Bogotá (CCB) (2015). Escenarios de Futuro para la Sostenibilidad Ambiental de la Región Bogotá Cundinamarca al 2025. Bogotá, Colombia: CCB.
Center for the Built Environment (CBE) (2016). Occupant Indoor Environmental Quality (IEQ) SurveyTM. Berkeley, CA: CBE. Available at: https://www.cbe.berkeley.edu/research/survey.htm [Accessed on 19 May 2017].
Cifuentes-Cuellar, A.V. and Kämpf, J. (2013). Urban energy simulation of a social housing neighbourhood in Bogotá, Colombia. Proceedings: CISBAT 2013. Lausanne, Switzerland: Ecole Polytechnique Fédérale de Lausanne (EPFL), 873–878.
de Dear, R. and Brager, G. (2001). The adaptive model of thermal comfort and energy conservation in the built environment. International Journal of Biometeorology, 45(2): 100–108. https://doi.org/10.1007/s004840100093.
de Dear, R., Akimoto, T., Arens, E., Brager, G., Candido, C., Cheong, K., Li, B., Nishihara, N., Sekhar, S., Tanabe, S., Toftum, J., Zhang, H. and Zhu, Y. (2013). Progress in thermal comfort research over the last twenty years. Indoor Air, 23(6): 442–461. https://doi.org/10.1111/ina.12046.
de Dear, R., Brager, G. and Cooper, D. (1997). Developing an Adaptive Model of Thermal Comfort and Preference: Final Report ASHRAE RP-884. Sydney: Macquarie Research Ltd.
Departamento Administrativo Nacional de Estadística (DANE) (2015). Censo de Edificaciones VIP, VIS Y NO VIS II Trimestre (2012)–IV Trimester (2015). Bogotá, Colombia: DANE. Available at: https://www.dane.gov.co/index.php/estadisticas-por-tema/construccion/vivienda-vis-y-no-vis [Accessed on 22 May 2017].
du Prel, J., Puppe, W., Gröndahl, B., Knuf, M., Weigl, J., Schaaff, F. and Schmitt, H. (2009). Are meteorological parameters associated with acute respiratory tract infections? Clinical Infectious Diseases, 49(6): 861–868. https://doi.org/10.1086/605435.
Escallon, C. and Rodriguez, D. (2010). Who asks the questions about housing quality? Who answers them? Dearq, 6: 6–19.
Fanger, P. (1970). Thermal Comfort. Copenhagen: Danish Technical Press.
Thermal Comfort and Satisfaction in Social Housing
PENERBIT UNIVERSITI SAINS MALAYSIA/123
Health and Safety Executive (HSE) (2017). Thermal comfort, the six basic factors. Merseyside, England: HSE. Available at: www.hse.gov.uk/temperature/thermal/factors.htm [Accessed on 21 March 2017).
Heinzerling, D., Schiavon, S., Webster, T. and Arens, E. (2013). Indoor environmental quality assessment models: A literature review and a proposed weighting and classification scheme. Building and Environment, 70: 210–222. https://doi.org/10.1016/j.buildenv.2013.08.027.
Hernandez, A. (2012). Applicability of the Passivhaus Standard for social housing in urban tropical climates (Colombia). MSc diss. University of Bath.
Heyman, B., Harrington, B., Merleau-Ponty, N., Stockton, H., Ritchie, N. and Allan, T. (2005). Keeping warm and staying well. Does home energy efficiency mediate the relationship between socio-economic status and the risk of poorer health? Housing Studies, 20(4): 649–664. https://doi.org/10.1080/02673030500114656.
Tyler, H., Stefano, S., Alberto, P., Toby, C., Dustin, M. and Kyle, S. (2017). CBE Thermal Comfort Tool. Berkeley, CA: CBE. Available at: http://comfort.cbe.berkeley.edu/ [Accessed on 16 April 2017).
Indraganti, M. and Rao, K. (2010). Effect of age, gender, economic group and tenure on thermal comfort: A field study in residential buildings in hot and dry climate with seasonal variations. Energy and Buildings, 42(3): 273–281. https://doi.org/10.1016/j.enbuild.2009.09.003.
Instituto de Hidrología, Meteorología y Estudios Ambientales (IDEAM) (2014). Homepage. Available at: http://www.ideam.gov.co [Accessed on 21 March 2017).
International Organization for Standardization (ISO) (2005). ISO 7730:2005 Ergonomics of the Thermal Environment: Analytical Determination and Interpretation of Thermal Comfort Using Calculation of the PMV and PPD Indices and Local Thermal Comfort Criteria. Geneva: ISO.
Jones, L. and Mays, N. (2016). The experience of potentially vulnerable people during cold weather: implications for policy and practice. Public Health, 137: 20–25. https://doi.org/10.1016/j.puhe.2015.12.008.
Kántor, N. and Unger, J. (2011). The most problematic variable in the course of human-biometeorological comfort assessment: The mean radiant temperature. Open Geosciences, 3(1): 90–100. https://doi.org/10.2478/s13533-011-0010-x.
Karjalainen, S. (2012). Thermal comfort and gender: A literature review. Indoor Air, 22(2): 96–109. https://doi.org/10.1111/j.1600-0668.2011.00747.x.
Lai, A., Mui, K., Wong, L. and Law, L. (2009). An evaluation model for indoor environmental quality (IEQ) acceptance in residential buildings. Energy and Buildings, 41(9): 930–936. https://doi.org/10.1016/j.enbuild.2009.03.016.
Langevin, J., Gurian, P. and Wen, J. (2015). Tracking the human-building interaction: A longitudinal field study of occupant behavior in air-conditioned offices. Journal of Environmental Psychology, 42: 94–115. https://doi.org/10.1016/j.jenvp.2015.01.007.
Martínez, O. (2015). The process of urbanization in the municipalities of the Sabana de Bogotá. Ánfora, 22: 85–111.
McIntyre, D. and Gonzalez, R. (1976). Man's thermal sensitivity during temperature changes at two levels of clothing insulation and activity. ASHRAE Transactions, 82: 219–233.
Carolina M. Rodriguez, Juan Manuel Medina and Andrés Pinzón
124/PENERBIT UNIVERSITI SAINS MALAYSIA
Ministerio de Vivienda (2013). Anexo Técnico 1: Guía de Construcción Sostenible para el Ahorro de Agua y Energía en Edificaciones. Bogotá, Colombia: Ministerio de Vivienda. Available at: http://www.minvivienda.gov.co/Documents/ViceministerioVivienda/ANEXO%201%200549%20-%202015.pdf [Accessed on 10 May 2017).
Morris, E. and Winter, M. (1975). A theory of family housing adjustment. Journal of Marriage and Family, 37(1): 79–88. https://doi.org/10.2307/351032.
Peeters, L., de Dear, R. de, Hensen, J. and D'haeseleer, W. (2009). Thermal comfort in residential buildings: Comfort values and scales for building energy simulation. Applied Energy, 86(5): 772–780. https://doi.org/10.1016/j.apenergy.2008.07.011.
Pérez, A. (2011). La calidad del hábitat para la vivienda de interés social. soluciones desarrolladas entre 2000 y 2007 en Bogotá. Revista INVI, 26(72): 95–126. https://doi.org/10.4067/S0718-83582011000200004.
Schweiker, M., Brasche, S., Bischof, W., Hawighorst, M. and Wagner, A. (2013). Explaining the individual processes leading to adaptive comfort: Exploring physiological, behavioural and psychological reactions to thermal stimuli. Journal of Building Physics, 36(4): 438–463. https://doi.org/10.1177/1744259112473945.
Shin, J. (2016). Toward a theory of environmental satisfaction and human comfort: A process-oriented and contextually sensitive theoretical framework. Journal of Environmental Psychology, 45: 11–21. https://doi.org/10.1016/j.jenvp.2015.11.004.
Shin, J. and Jorn, M. (2013). Reconstructing a sense of home in affordable housing: Residential experiences of Korean elders in the Midwest. Paper presented at the 44th Annual Conference of the Environmental Design Research Association. Providence, Rhode Island.
Uniandes (2017). Observatorio de Calidad de Vivienda Nueva. Bogotá, Colombia: University of Los Andes. Available at: http://observatoriodevivienda.uniandes.edu.co/ [Accessed on 10 March 2017].
Walikewitz, N., Jänicke, B., Langner, M., Meier, F. and Endlicher, W. (2015). The difference between the mean radiant temperature and the air temperature within indoor environments: A case study during summer conditions. Building and Environment, 84: 151–161. https://doi.org/10.1016/j.buildenv.2014.11.004.