I , I Journal of Research of the National Bureau of Standards Vol. 59, No.2, Augu st 1957 Research Paper 2775 Thermal Conductivity of Beryllium Oxide From 40 ° to 750 ° C David A. Ditmars and Defoe C. Gi nn i ng s Th e t herma l con du ct i vity of bery lli um ox id e h as been meas ur ed by a ll absolu te met hod from 40 0 to 750 0 C. The app ar at us e mployed stead y-sta te l ongitudina l h eat flow a long a rod of high-fired b ery llium ox id e, s urrounded by a tube lI·ith mat ching temp eratur e gradie nt to minimize rad ia l heat loss. Th e est imated acc ur ncy of the meas ur ements is a bout 3 percen t. Ho wever, the va lues of ther mal conductivity of the id eal bery llium ox id e cr ysta l a rc prob a bl y considerab ly higher t han t he va lues gi ven beca use of t he lower d ens ity (87 perce nt theoret- ical) of the sa mple used. I. Intr oducti on Not only is beryllium oxide useful as a moderator in the utilizat ion of ato mi c en ergy, bu t it ha s an unusually hi gh th ermal co ndu c tivity , mu ch hi gh er t han other nonmet al and even bjgh er than mo st m etals over a limit ed temperature range. At room te mp era tur e, its thermal condu cti vity is about that of aluminum, wher eas its electrical condu ctivity is ex tremely low. It wa s the purpo se of this inve stiga - ti on to measure the th ermal condu ctivi ty of beryl- liUln oxide in the hi gh -temperature range. 2. Sample The beryllium oxide wa s originally fabricated by the Norton Co. by hot-pr ess in g. A rou gh sampl e was taken from this mat erial and ma chined, at the Oak Ridge National Laboratory , to a cylindri cal rod about 0.5 in . in diameter and 6 in . lon g. From in- formation obtained on thi s mat erial, toget h er with th at obtained from a sp ectrographic analysis, it seems likely that its impurities ( other than carbon ) were less than 0.2 percent. It is possible that carbon wa s pre sent in l arger a mount s in the sa mpl e, a lthough it wa s white , ,,,ith only occasional dark inclusions. The sample was fIr ed in the NBS Mineral Products Division at about 1,700° C and machined to the form of a true cylind er h aving a diameter of 0.4524 in . at room temperature and an average density of 2.62 gJ cm 3 (8 7 percent of single crystal ). The m ethod of original fabrication by hot -pressing may have caused a variation in d ensity in the sample of several percent . 3. Met h od and Appa r at us The method and a pparat us have been described briefly in techni cal reports [1, 2].1 The method used was absolute in that the results were obtained without c omparison wi th another material. A longitudinal h eat flow was us ed to estab lish a temperature gradi- ent in the sampl e. From the measured valu es of heat flow, temp erature gradient, and the cross section of the sample , the thermal conductivity of the sample was calcul ated. Longitudinal rather than radial heat flow wa s used in order to obtain a reasonable tem- 1 Figures in brackets indicate the literat ure references at tbe end of tbis paper. 93 perature gradient in a convenien tly sh aped sampl e. The temp erat ur e gr acLi0l 1 t on the sampl e was deter- min ed by measuring the temperature s along the sa mpl e. The longi tudinal h eat-flow m ethod , as appli ed to relativel y l ong samples, ha s the inhere nt dis advantage that radial h eat losses to the slilToun(l- ings may reduce the accu racy of the res ult s. How- ever, in this case, th e conducti vity of Lhe BeO was so high th at radial h eat lo sses did not seriollsly limit the accuracy of the result s. A scale di agram of the esse nti al parts of the appa- ratu s is shown in figure 1. :rvleasu recl elcc tri cal heat , introdu ced in the "s ftmp le he a ter " at the top of the sample (BeO), flowed clown t he sampl e and its " adapt er " to a heat sink. The sampl e heater con- sisted of six small helices of No . 38 Nichrome wir e lo cated in hol es in the top of the s ample . The adapter was used here to position t he sample , as well as to fiU in the need ed l ength, because the apparatu s wa built to accommodate sample s longer than 6 in. Anhydrous boric oxide was used to give good the rmal contact b et ween the s ample and adapter, and be- tween the adapter and Lhe sink. Thi s compound has a very low vapor pressur e and h as excellent we tting prop ertie s, maintaining good thermal contact at temp eratme s far below its melting poin t . Th e sink wa s cool ed with either wat er or air, depending on the temperature range, and was equipped with a heater and thermo co upl e so th at it co uld be au tomatically kept at a constant temperature . Th e temperatures along the sampl e were measured with thre e thermo coupl es (No. 36 A WG platinum- platinum-rhodium) having reference junctions at 0° C and principal jun ctions on the sample at the three levels s hown in fi g ur e 1. In addition to these three absolute thermocouples, a differential thermo - couple was also used to ascer tain directl y the tem- perature difference betwee n the upp er and lower l evels on the samp l e. All of the thermocouples on the samples were mad e with jun ctions peen ed into small holes (about 0.6 mm in diameter and depth ) in the cylindri cal surface of the sample. In order that the temperatur e gradient meas ured on th e sample would correspond to th e electric heat put into th e top of th e sampl e, precautions were taken to minimiz e radial heat loss along th e sampl e. For this purpose , the sample wa s surround ed by a "g uard tube "
Transcript
~ I ,
I
Journal of Research of the National Bureau of Standards Vol. 59, No.2, August 1957 Research Paper 2775
Thermal Conductivity of Beryllium Oxide From 40° to 750° C
David A . Ditmars and Defoe C . G innings
The t hermal conductivity of bery lli um ox id e has been meas ured by a ll a bsolu te method from 40 0 to 750 0 C. The apparatus e mployed steady-state longitudinal heat flow a long a rod of high-fired beryllium oxide, s urrounded by a tube lI·ith matching temperature gradient to minimize rad ia l heat loss. The estimated acc urncy of t he meas uremen ts is about 3 pe rce nt. However, the values of therma l conductivity of the ideal bery llium ox id e crystal a rc proba bly considerably hi gher t han t he values given because of t he lower density (87 perce nt t heo retical) of the sample used .
I. Introduction
Not only is beryllium oxide useful as a moderator in the utiliza tion of atomic en ergy, bu t it has an unusually high t hermal conductivity, mu ch high er than other nonmetal and even bjgh er than most metals over a limited temperature range. At room temperature, its thermal conductivity is about that of aluminum, whereas its electrical conductivity is extremely low. It was the purpose of this investigation to measure the th ermal conductivity of b erylliUln oxide in the high-temperature range.
2 . Sample
The beryllium oxide was originally fabricated by the Norton Co. by hot-pressing. A rough sample was taken from this material and machin ed , at the Oak Ridge National Laboratory, to a cylindrical rod about 0.5 in . in diameter and 6 in . lon g. From information obtained on this material , together with that obtained from a spectrographic analysis, it seems likely that its impurities (other than carbon) were less than 0.2 percent. It is possible that carbon was present in larger amounts in the sample, although it was white, ,,,ith only occasional dark inclusions. The sample was fIred in the NBS Mineral Products Division at about 1,700° C and machin ed to the form of a true cylinder having a diameter of 0.4524 in . at room temperature and an average density of 2.62 gJcm3 (87 percent of single crystal). The method of original fabrication by hot-pressing may have caused a variation in density in the sample of several percent.
3 . Method and Apparatus
The method and apparatus have been described briefly in technical reports [1, 2].1 The method used was absolu te in that the results were obtained without comparison wi th another material. A longitudinal heat flow was used to establish a temperature gradien t in the sample. From the measured values of h eat flow, temperature gradient, and the cross section of the sample , the thermal conductivity of the sample was calculated. Longitudinal rather than radial heat flow was used in order to obtain a reasonable tem-
1 Figures in brackets indicate the literature references at tbe end of tbis paper.
93
perature gradient in a convenien tly shaped sample. The temperature gracLi0l1 t on the sample was determined by measuring the temperatures along the sample. The longitudinal h eat-flow m ethod, as applied to relatively long samples, has the inh erent disadvantage that radial heat losses to the slilToun(lings may reduce the accuracy of th e results. However , in this case, th e conductivity of Lhe BeO was so high that radial heat lo sses did not se riollsly limi t the accuracy of the results.
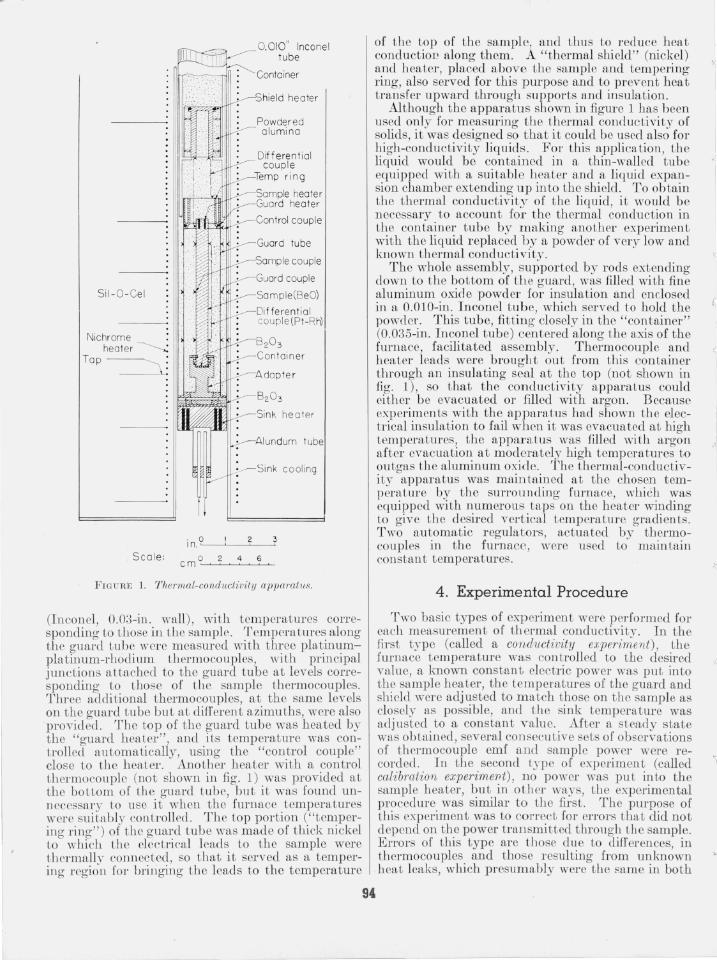
A scale diagram of the essential parts of the apparatu s is shown in figure 1. :rvleasu recl elcc trical h eat, introduced in the "sftmp le hea ter" at the top of the sample (BeO), flowed clown the sample and its "adapter " to a heat sink. The sample h eater consisted of six small h elices of No . 38 N ichrome wire located in holes in the top of the sample. The adapter was used here to position the sample, as well as to fiU in the n eeded length, b ecause the apparatu s wa built to accommodate samples longer than 6 in . Anhydrous boric oxide was used to give good thermal contact between th e sample and adapter, and between th e adapter and Lhe sink. This compound has a very low vapor pressure and h as excellent wetting properties, maintaining good thermal contact at temperatmes far below its melting poin t . The sink was cooled with either water or a ir, depending on the temperature range, and was equ ipped with a h eater and thermocouple so th at it could be au tomatically kept at a constant t emperature.
The temperatures along the sample were measured with three thermocouples (No. 36 A WG platinumplatinum-rhodium) having reference junctions at 0° C and principal junctions on the sample at the three levels shown in figure 1. In addition to these three absolute thermocouples, a differential thermocouple was also used to ascer tain directly the temperature difference between the upper and lower levels on the sample. All of the thermocouples on the samples were made with junctions peened into small holes (about 0.6 mm in diameter and depth) in the cylindrical surface of the sample. In order that the temperature gradient m easured on the sample would correspond to the electric heat put into the top of the sample, precautions were taken to minimize radial heat loss along the sample. For this purpose, the sample was surrounded by a "guard tube"
Sil - O- Gel
Sca le :
0 .010" Incone l tube
Container
Different ial couple
r in g
1rn+~"If.LIJj} . _~<~~n,~llo heater heater
i n°L-----'--_-"-2_ ...:t
c m O~....:;:2'____"___~4 ......---.:6~
FIGURE 1. Thermal-conductivity apparatus.
(Incon el, O.03-in. wall), with temperaLures corresponding to those in the sample . Temperatures along the guard Lube were measured with three platinumpIa tinum-rhodium thermocouples, with principal junctions attached to the guard tube at levels corresponding to those of the sample thermocouples. Three additional thermocouples, at the same levels on the guard Lube but at different azimuths, were also provided. The top of the guard tube was heated by the "guard heater", and its temperature was controlled au Lomatically, using the "control couple" close to Lhe heater. Another heater with a control Lhermocouple (not shown in fig. 1) was provided aL the bottom of the guard tube, but it was found unnccessary Lo use it when the furnace temperatures werc suitably controlled . The top portion ("Lempering ring" ) of the guard tube was made of thick nickel Lo which the electrical leads to the sample were Lhel'mally connected, so that it served as a tempering region for bringing the leads to the temperature
of the top of the sample, and thus to r educe heat conductioI' along them. A "thermal shield" (nickel) fmd heater, placed above the sample and tempering ring, also served for this purpose and to prevent heat transfer upward through supports and insulation.
Although the apparatus shown in figure 1 has been used only for measuring the thermal conductivity of solids , it was designed so that it could be used also for high-conductivity liquids. For this application, the liquid would be contained in a thin-walled tube equipped with a suitable heater and a liquid expansion chamber extending up into the shield. To obtain the thermal conductivity of the liquid, it would be necessary to account for the thermal conduction in the container tube by making another experiment with the liquid replaeed by a powder of very low and known thermal conducti vity.
94
. The whole assembly, supported by rods extending down to the bottom of the guard, was filled with fin e aluminum oxid e powder for insulation and enclosed in a O.OlO-in. Inconel tube, which served to hold the powfler. This tube, fitting closely in the "container" (O.035-in. Inconel tube) centered along the axis of the furnace, facilitated assembly . Thermocouple and heater leads were brought out from this container through an insulating seal at the top (not shown in fig . 1), so that the conductivity apparatus could either be evacuated or filled with argon. Because experiments with the apparatus had shown the electrical insulation to fail when it was evacuated at high temperatures, the appal'atus was filled with argon after evacuation at moderately high temperatures to outgas the aluminum oxide. The thermal-conductivity apparatu s was maintained at the chosen temperature by the surrounding furnace, which was equ ipped with nymerous . Laps on the heater winding to gIve the desu'ed vertlCal temperature gradi ents. T wo au tomatic regulators, actuated by thermocouples in the furnace, were used to maintain constant temperatures.
4 . Experimental Procedure
Two basic types of experiment were performed for each measurement of thermal conductivity. In the first type (called a conductivity experiment) the furnace temperature was controlled to the desired value, a known constant electric power was put into the sample heater, the temperatures of the guard and shield were adjusted to match those on the sample as closely as possible, and the sink temperature was adjusted . to a constant value .. After a steady state was obtamed, several eonsecuLlve sets of observations of thermocouple emf and sample power were recorded. In the second type of experiment (called calibration experime7lt) , no power was put into the sample heater, but in other ways, the experimental procedure. was similar to the first. The purpose of thIS expenment was to correct for elTors that did not depend on th.e power transmitted through the sample. Errors of thIS type are those due to difl'erences in thermocouples and those resulting from unlm~wn heat leaks, which presumably were the same in both
.,
-'\
I
'" I
t.\-pes of experiments. Several other experim e~lts were made to detect other errors and to determme their importance . Some of these experiments are described later.
Several hours were usually required to bring the various parts of the apparatus to the desired temperatmes and to make sure that these temperatures were not changing significantly. The final data were usually obtained ill a period of about 30 min, subsequent to an interval of a bout an hom dming which th e temperatures were observed to be constant. Automatic thermoregulators were used to control the temperatures of the furnace, guard, and sink .
5. Calculation of Results and Uncertainties
The eonduetivi ty values were calculated from the observed q uan tities by means of the equa tion
where
Qt.Xo Ie Ao(1 + ata) t.t'
!c = t]wrmal con ductivity (watts cm- 1 ci eg- 1
C) at temperat ure tao ta= f1.vcrage temperature of sample between . Lhermocoup les.
Q= heaL- fi ow rate (wa LLs). t.Xo= thermoeouple spacing at 0° C (cm ).
Ao = e]"oss-secLional a reil, at 0° C (em2) .
a = eoeffie ient of lin ear thermal expansion (deg- 1 C).
t.t= temperatll re dirrerence (deg C) between thermocollp les.
This equation is valid for steady-state longitudinal hea t flow over a small tcmperature interval. The determination of these factors in the conductivity equaLion, togeLher with a consid eration of their unce rtainties, will now be discussed individually. The uncertainties referred to in this report arc Lhe authors' estimates (based on Lhei r judgment) on the basis that the observed quantity would have about an equal chance of being within that limit; as being outside it, an d that the sign of the uncertainty is just as lil,ely to be positive as negative.
5 .1. Heat-Flow Rate (Q)
a. Electric Power
lIea t was generated by direct current in the sample heaLer, and power was measured in a conventional milnner, using a potentiometer in con junction with a high-resistance volt box to measure the potential drop across the heater, and a standard resistor in a curren t lead to measure the ('urrent. The errors in these elect rical measurements were almost negligible. In measuring the potential drop across the heater, the potential terminals were located to evalu ate properly the heat that went to the sample. Because the sample heater was made with very high resisLance (relative to that of the heater leads), the uncertainLy ill the location of the potential terminals resulted in only a bout O.1-percen t un certainty in the measured thermal condllcLivity.
b. Heat Flow From Sample to the Tempering Ring
In add i t ion to the elect ri c-power input to the top of the sample, iL i necessary to consider the heat transfer beLween the sample and its surroundings. Because of the excess temperature of the sample heater, h eat flowed along Lhe heater leads to the tempering rin g; the unce rtainty in this heat flow (taken to be 50 percent of the correct ion ) averaged abou t 0.24 pcrcent of the to lal heat fl ow in the sample. In addition to this heat now, there was the heat flow between the top part of the sa mple and the tempering ring. The evalu alion of this was diffi cul t because of the con fi guration and the temperature distribution on the top parL of the sample where the sample h eater was located. Using clifl'erential t hermocouples, observations were made of the temperature difference between the isothermal tempering ring an d ii, point on the top pilrt of the sample. The location of thi s point was determ ined by calculation so that the net heat Aow from the top of the sample to the tempering ring wOlllci be p roportional lo the emf of the diA'eren tifl,l thermocouple. The heigh t of the top of the sample relat ive to the guard \\'as made so that the boLLom of the sil mp] e hea ler was at the same level as the boLLom of lhe lempering rin g . In the actual expe rim ents, Lhe temperulg-ring temperature depended on lhe po wer in lhe guard heater and was indi caLed by the dirTeren li fl,1 thermoeollple to be 2 or :3 deg higher than the tempera tlll"e of the sample , makin g necessary a eOJTeet ion for the resulLing heat flow. It was found convenient to evaluate this correel ion experimentall y by making two eon dll ctivity experimen ts in which on ly the tempe rin g- ri ng temperature was changed and the furnace temperature adj usted to maintain the ma lch between th e gUfl,rd and sample thennoeoupl es. Using the resulting chilnge in sfl,mple grad ien t, the dfl,ta were correcLed to correspond to no difl'crence in temperature as indicated by the diA'erential thermocouple. However, there still r emained an uncertainly in heat flow due to some uncertainly in the proper location of the thermocouple junction on the sample head. It was estimated t hat Lhe uneer Lainly in the h eat Jiow between the sample and tempering ring, exclllClin g heat flow along leads mentioned above, reslllLedin an uncer tainty in measured conductivity averaging about 0.5 percent.
95
c. Heat Flow Down the Insulating Powder
Even when the guard temperatures matched sample temperatures, some. of the heat input to tllC sample necessarily wen t to maintain some of the 10ngitudiJlal heat flow in the insulating powder between the sample and guard. The conductivi ty of the aluminum oxide powder with argon gas was determined approximatcl~' b)' a few experiments as it was ll sed in the apparatus. The temperature distribution in the in sulat ion had been previously estimated with a resistance analog computer, setting up bounclar~' con di tions corresponding to the configuration and assumed temperatures of the sample and guard. It was estimated from these results
that when the thermocouple on the top part of the sample indicated the same temperature as the guard ring, the sample heater contributcd only 16 percent of the total longitudinal heat flow in the powder, the remainder of the heat being furnished by the guard. Under this condition, about 0.2 percent of the heat of the sample heater flowed down through the insulating powder. The uncertainty of this correction was estimated to give less than 0.1-percent uncertainty in the measured thermal conductivity.
d. Heat Flow Between Sample and Guard
Because it was found impractical to match the sample and guard temperatures exactly during all conductivity experimen ts, experiments were made that permitted calculation of corrections for imperfect matching. For each guard thermocouple, two thermal-condu etivity experiments were made, varying only the difference between that guard thermo couple and the corresponding thermocouple on the sample. From the resulting change in temperature gradient on the sample in these two experiments, it was possible to estimate a correction for small differences in matching guard and sample thermocouples. It was calcula ted that there was an uncertainty of about 50 percent in correcting for heat flow between the sample and the guard. This uncertainty resulted in an average uncertainty In
measured conductivity of about 0.3 percent.
e. Heat Flow Into Heat Capacity of Sample
If the temperature of the sample were changing with time, some of the heat input would go to produce this change, and the temperature gradient on the sample would not correspond to the heat input at the top of the sample. In all experiments, the rate of temperature change was less than 0.8 deg C/hr, corresponding to an effect of 0.5 percent in the calculated value of conductivity. The average uncertainty in the correction for this was negligible.
5 .2. Thermocouple Spacing (LlXo)
The distan ce between the principal junctions of the upper and middle sample thermocouples was 4.97 cm at 0° C, whereas the corresponding distance for the middle and lower thermocouples was 5.05 cm; this gives 10.02 cm for the distance between the extreme absolute thermocouples. The distance between junctions on the differential thermocouple was 10.01 cm. These distances, taken as the lengths between centers of the thermocouple holes, were measured to better than 0.01 cm with a traveling microscope, but because the thermocouples were peened into holes 0.06 cm. in diameter, the possibility of nonuniform thermal contact makes a tolerance of 0.03 cm appear more realistic. This tolerance corresponds to 0.3-percent uncertainty in the 10-cm spacing between the sets of thermocouples used in the conductivi ty calculations. The effect of thermal expansion on both thermocouple spacing and crosssectional area is lumped into the correction (1 + ata) ,
which is described later.
5 .3 . Cross-Sectional Area (Ao)
The sample was ground Lo have a uniform diameter of 0.4524 ± 0.0003 in. , corresponding to a crosssectional area of 1.038 cm2• The uncertainty in this area was estimated to be less than 0.1 percent.
5.4. Thermal-Expansion Correction (l + ata)
Thermal-expansion changes the thermocouple spacing by the factor (1 + ala), and the cross-sectional area by the factor (1+ ata)2, resulting in the (l + ata)
term given in the conductivity equation . The coefficient of linear thermal expansion (a) has been determined by White and Schremp [3] . At the highest temperatures (747 ° C) of the conductivity experiments, the correction for expansion amounted to about 0.6 percent, with negligible uncertainty in the measured conductivity.
5 .5. Temperature Difference (Llt)
The accurate measurement of the t emperature difference on the sample was difficult, requiring a number of tests to eliminate or evaluate certain errors. As described in section 3, two different thermocouple systems were used to measure the temperature difference over the 10-cm length on the sample. The two independent thermocouple s,vstems served to check on each other, usually agreeing on the measured temperature difference to better than 1 percent.
All temperatures were measured with platinumplatinum-rhodium thermocouples of No. 36 A WG wires. A sample thermocouple was calibrated at several points between 0° and 1,000° 0 in the Pyrometry Laboratory of the National Bureau of Standards. No significant difference was observed between the thermoelectric power of this sample and that given in the standard tables [4] . Even though the thermocouples were all made from wire off the same spools, it was possible that they had slightly different thermoelectric powers. Although thes~ differences might not be serious for measurement of absolute temperatures, they could be significant for measurement of small temperature differences at high temperatures. These differences were automatically accounted for by the calibration experiments mentioned previously, in which no power was put into the sample heater. These calibration experiments gave differences in thermocouple readings, which increased regularl.v up to 470 0 O. and amounted to as much as 7 J.1.v at this temperature. At temperatures approaching 750° 0, the differences became both larger and more irregular, so that after each conductivity experiment, a calibration experiment was made to evaluate the differences.
In addition to the differences described above, the evaluation of Llt was uncertain because of the occasional effect of high humidity on the potentiometer used to measure the thermocouple emf. This effect
. was observed as a reading on the potentiometer, even when the potential across its terminals was
96
zero. When the value of !J.t was observed, using the differential thermocouple, the value was subject to the full potentiometer uncertainty (about 2 JLv ) because only one reading was involved. When the value of !J.t was determined by using the two absolute thermocouples, most of this potentiometer uncertainty was reduced (to about 0.5 JLv ) because the value of 6.t was obtained from a difference of two readings. It is for this reason that the uncertainties in the value of !J.t, using the differential thermocouple, were larger than the uncertain tics when using the absolute thermocouples, averaging about 1.5 percent as compared to 0.4 percent. That the two thermocouple systems usuall.v agreed to better than 1 percent is evidence that the error due to the humid.ity effect on the potentiometer was not excessive.
6 . Results
The results of the individual thermal-conductivitv measurements on beryllium oxide arc given in tabie 1. :_.values of observed conductivit.v (7c ) arc given as determined by using each of the thermocouple s:vstemsHabsolute and differential) at the average temperature (ta) of that portion of the sample measured by the thermocouples. At the lower temperatures, where the thermal conductivity of the beryllium oxide changes rapidly with temperaturc, small corrections to conductivity were made for the curvature of the conductivity-temperature function. In this table, the quantities given arc corrected for all known
--------------~~----------
errors. In the previous discussion, each uncertainty has been estimated by the authors on the basis that the observed quantit:r would have an equal chance of being within that limit as being outside that limit. These u IlcerLainties have been combined (square root of the sum of the squares) and arbitrarily increased by over a factor of 2 to give more realistic values of estimated error listed in table 1.
Table 1 indicates that the results, using the absolute thermocouples, seem to be reliable to about 2 percent. The experiments under 60° Care not as accurate as the other experiments. This is due to the smaller temperature drop in the sample, first because the limitations of the heat sink made it necessary to use lower power, and second, because the thermal conductivity of the ber .dlium oxide was so high in this low-temperature range. The larger error estimated by using the differential thermoco uple in this low-temperature region is due to the humidity trouble mentioned previously. No results are given for measurements with absolute thermocouples above 500 0 C because of failure of their electrical insulation.
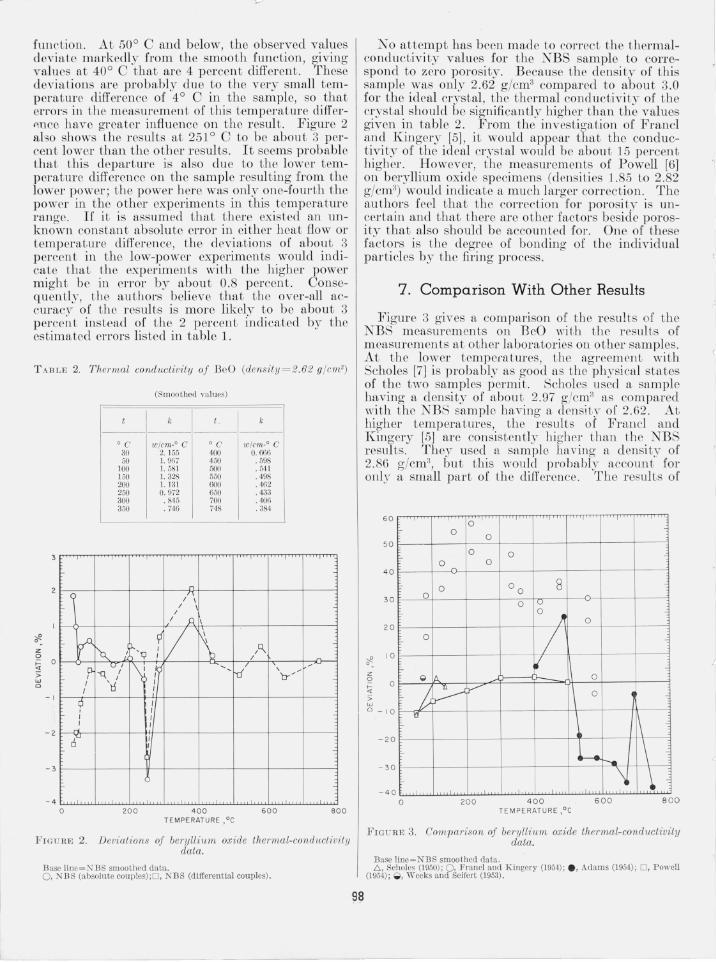
A smooth function of thermal conductivity was obtained graphically hom tIle observed values ill table 1, giving greatest weight to those values having the smallest estimated errors. Table 2 gives smoothed values of the conductivity at even temperatures as obtained from the graph. Figure 2 gives the deviations of the r esults (obtained with tbe two differen t thermocouple systems) from the smooth
T ABLE 1. Experimental l'esults
Absolute thermocouples DiITerential thermocouples
Date (1954) t. Power llt Observed k Esti mated L).t Observed k E stima ted
error II. error flo
°C W ° C w/cm-oC % ° C w/cm-oC % Aug. 25 __________ 38.2 0.8900 3.95 2. 19 5.4 4. Jl 2.10 19. 2 Aug. 26 __________ 46.2 1. 4452 6. 84 2.04 3.2 7. 03 1. 98 10.7 Aug. 25 ____ . __ ___ 52.6 1. 8894 9.41 1. 94 2. 6 9. 61 1. 90 7.9 Aug. 27- _________ 59.7 2.3620 12.15 1. 879 2.1 12.33 1. 849 6.2 Aug. 2L _________ 85.8 3.3179 19.16 1. 674 1.6 19. 28 1. 661 4. 0
• E stimated error is tbe autbors' estimate, considering only the \'arious uncertainties mentioned in tbe text. b Tbe results on August 20 and 23 represent averages of 2 experiments on eacb day.
97
function. At 50° C and below, the observed values deviate markedly from the smooth function, giving valucs at 40° C that are 4 percent different . These deviations are probably due to the very small t emperature difference of 4° C in the sample, so that errors in the measurement of this temperature clifferp,nce have greater influence on the result. Figure 2 also shows the results at 25].0 C to be about 3 percent lower than the other results. It seems probable that this departure is also due to the lower t emperature difference on the sample resulting from the lower power ; the power here was only one-fourth the power in the other experiments in this temperature range. If it is assumed that there existed an unknown constant absolute error in either heat flow or t emperature difference, the deviations of about 3 perccnt in the low-power experiments would inchcate that the experiments with the higher power might be in error by about 0.8 percent. Consequently, the authors believe that the over-all accuracy of the results is more likely to be about 3 percent instead of the 2 percent indicated by the estimated errors listed in table 1.
T A BLB 2. Thermal conductivi ty of ReO (density= 2.62 y/cm3)
C;
,!1 ° z ~ ~ 0 ... ~ > w a
p-I
I -I
~ I I
-2 aU
-3
- 4 o
(Sm oothed values)
t " t. " --~~
o C w/cm·O C o C w/cm· O C 30 2.155 400 0. 666 50 1. 9 ()7 450 .598
FIGUlm 2. Deviations of beryllium oxide thermal-conductivity data.
Base linc=N B S smoothed data . 0, N B S (absolute couples);O, N B S (d ifferential couples) .
98
No attempt has been made to correct the thermalconductivity values for the NBS sample to correspond to zero porosity. Because the density of this sample was only 2.62 g/cm3 compared to about 3.0 for the ideal crystal, the thermal conductivity of the crystal should be significantly higher than the values given in table 2. From the investigation of Franc! and Kingery [5], it would appear that the conductivity of the ideal crystal would be about 15 percent higher. However, the measurements of Powell [6) on beryllium oxide specimens (densities 1.85 to 2.82 g/cm3) would indicate a much larger correction. The authors feel that the correction for porosity is uncertain and that there are other factors beside porosity that also should be accounted for . One of these factors is the degree of bonding of the individual particles by the firing process.
7 . Comparison With Other Results
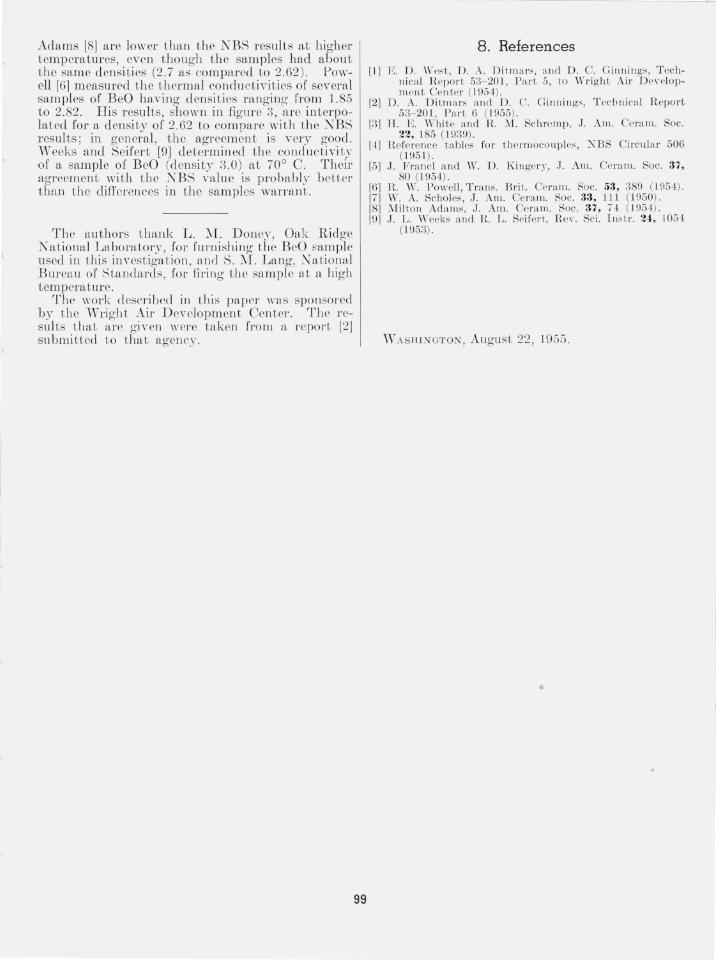
Figure 3 gives a comparison of th e results of the NBS measurements on BeO wit,h the results of measurements at other laboratories on other samples. At the lower temperatures, the agreement wi th Scholes [7) is probably as good as the physical states of the two samples permit. Scholes usea a sample having a density of about 2.97 g/cm3 as compared with the NBS sample having a aensit.? of 2.62. At higher temperatures, the results of Francl and Kingery [5) are consistently higher than the NBS results. They used a sample having a density of 2.86 g/cm 3, but. this wOllld probably account for only a small part of the difference. The results of
60 0
0
50 0
4 0 o ~
E- o 30 0
2 0 0
~ 10
0_
z ~ 0 ~ '> w 0 _ 10
<;I tA.
P ~ V
" - 2 0
-30
- 4 0 o 200
0
0 0
00 8 0 I V
0
~
/ , II .\
400 T EMPERATURE ,oc
0
0
0
\
---t--. \ "J ,\,
600 8 00
FIGURE 3. Comparison of ber·yllium oxide thermal-conductivity data.
Base li ne=NB S smoo thed da ta. 6 , Scholes (1950); 0 , F rancl a ncl K ingery (1954); . , Adams (1954); 0, P owell
(1954) ; I00I , W eeks a nci Seifert (1953) .
--------
Adams [8] are low er Lilan the NBS results at higher temperatures, eV(,11 though the samples had about the same densities (2.7 as compa red to 2.62 ). Powell [6] measured the Lhcl'mal C'ondu cLivitics of several samples of BeO having densiLies ranging from 1.85 to 2.82. His results, shown in figm'e 3, arc interpolated for a del1si ty of 2.62 to compare wi Lh Lhe NBS results; in general , the agrecment is very good. IiV' eeks and Seifert [9] determined the conductivi t~~ of a sample of BeO (density 3.0) at 70° C. Their agreement with the NBS yallle is probably better than t he difl'crences in the samples warrant.
Th e authors thank L . ~r. Done~', Oak Ridge National Laboratol'.\T, for furnishing the BeO mmple used i l1 this invcstigaLion , and S. ~I. Lang, .0r ational Bureau of SLanclanls, for firing t he sample aL a high tempera ture.
The work: desC'l'ihecl in Chis pftpm' was sponsorcd by the vYrighL Ail' D evelopment Center. The rcsuIts thaL ftl'e given were taken from a l'l'pol'L [2] submi tted Lo that agency.
99
8 . References
[1] E. D. \\~ ('sL, D. A. Di t m.a rs, and D. C. Ginnings, T echllical Hep or t 5:3- 20 I , Par t 5, to Wrigh t Air D evelopm ent Ce Ll ter (195.,1 ) .
[2] D. A. Di tmars a!ld D. C. Ginnings, T echnica l R eport 53- 201 , l'<tI' t 6 ( la55) .
[3] H. K WhiLp "nd H.. i\l. Schre mp, J. Am. Cera m. Soc . 22, 185 (19:3 9).
[4] R efe rence tables for the rmocouples , XBS Circular 506 (1951).
[5] J. Francl and W. D . Kingery, J. Am. Ccmm. Soc . 37, 80 (1954).
[6] 11. W. Powell , Trans. Bri t. Ccram. Soc. 53, 389 ( 195,1). [7] W. A. Scholes, J . Am. Ceram. Soc. 33, 11 L (1950). [8] :\1il ton Adams, J. Am. Ccram. Soc. 37, 7,1 (HI5"1) . [9] J. L. Wee k" and 11. L. Scifcrt, n c\'. Sci. Inst J'. 24, 1054


![XPS and AES of Beryllium and Beryllium Oxide - … · Mat., 15, 3567-3581 (2003) [8] A ... 78.0 and 67.2 eV in the AES spectrum of beryllium ... in the archival journal Surface Science](https://static.documents.pub/doc/80x56/5b75fca37f8b9ac94a8e1d6f/xps-and-aes-of-beryllium-and-beryllium-oxide-mat-15-3567-3581-2003-8.jpg)


