Page 1
THERMAL CONDUCTIVITY OF ETHYLENE VINYL ACETATE
COPOLYMER/NANOFILLER BLENDS
S. Ghose1, K.A. Watson1, D.C. Working2, J.W. Connell2, J.G. Smith, Jr.2, Y. Lin3 and Y.P. Sun4
1National Institute of Aerospace, Hampton, VA 23666-6147
2NASA Langley Research Center, Hampton, VA 23681-2199
3NASA Postdoctoral Fellow at NASA LaRC, Hampton, VA 23681-2199
4Dept of Chemistry, Clemson University, Clemson, SC 26934-0973
Abstract
To reduce weight and increase the mobility, comfort, and performance of future spacesuits,
flexible, thermally conductive fabrics and plastic tubes are needed for the Liquid Cooling and
Ventilation Garment. Such improvements would allow astronauts to operate more efficiently
and safely for extended extravehicular activities. As an approach to raise the thermal
conductivity (TC) of an ethylene vinyl acetate copolymer (Elvax™ 260), it was compounded
with three types of carbon based nanofillers: multi-walled carbon nanotubes (MWCNTs), vapor
grown carbon nanofibers (CNFs), and expanded graphite (EG). In addition, other nanofillers
including metallized CNFs, nickel nanostrands, boron nitride, and powdered aluminum were also
compounded with Elvax™ 260 in the melt at various loading levels. In an attempt to improve
compatibility between Elvax™ 260 and the nanofillers, MWCNTs and EG were modified by
surface coating and through noncovalent and covalent attachment of organic molecules
containing alkyl groups. Ribbons of the nanocomposites were extruded to form samples in
https://ntrs.nasa.gov/search.jsp?R=20090007735 2020-04-04T23:45:35+00:00Z
Page 2
which the nanofillers were aligned in the direction of flow. Samples were also fabricated by
compression molding to yield nanocomposites in which the nanofillers were randomly oriented.
Mechanical properties of the aligned samples were determined by tensile testing while the degree
of dispersion and alignment of nanoparticles were investigated using high-resolution scanning
electron microscopy. TC measurements were performed using a laser flash (Nanoflash™)
technique. TC of the samples was measured in the direction of, and perpendicular to, the
alignment direction. Additionally, tubing was also extruded from select nanocomposite
compositions and the TC and mechanical flexibility measured.
Keywords: Elvax™, thermal properties (B), extrusion (E), nanostructures (A), polymer matrix
composites (A)
This paper is work of the U. S. Government and is not subject to copyright protection in the U.S.
Corresponding author: Sayata Ghose, [email protected] , 1-757-864-2094
2
Page 3
1. INTRODUCTION
The development of lightweight, high thermal conductivity (TC), flexible materials for potential
use in the Liquid Cooling and Ventilation Garment (LCVG) is of interest to NASA. The LCVG
is an integral component of the spacesuit that serves to remove body heat from astronauts. By
improving the TC of the LCVG subcomponents (i.e., flexible fabric and cooling tubes), a
reduction in the total weight of the cooling tubes can be realized, resulting in improved mobility
and comfort. These improvements may lead to new, more advanced spacesuit designs that enable
longer extravehicular excursions by future astronauts. One approach to enhancing the TC of the
polymeric components has been to add nanoparticles which possess high TC. Various nanofillers
used in this work are briefly described in the subsequent paragraphs.
Carbon based nanoparticles are one type of material that is commonly used to improve the
physical, electrical, and thermal properties of polymers and include expanded graphite (EG),
carbon nanofibers (CNFs), and carbon nanotubes (CNTs). CNFs are highly graphitic fibers
produced by a catalytic vapor deposition process and have been widely used as reinforcements
for polymers like polyethylene [1], polypropylene [2,3], polycarbonate [4], nylon [5], and
poly(methyl methacrylate) [6] in numerous high-technology applications. CNTs have high
mechanical and electrical properties and ultra high TC [7, 8] and CNT-based composites are
being studied extensively. Theory predicts the TC (κ) of single-walled CNTs (SWCNTs) at room
temperature to be as high as ~6600 W/mK [9] while the experimental value for an individual
MWCNT has been reported as 3000 W/mK at room temperature [10]. This value is significantly
higher than that of known thermally conducting materials like diamond (up to 2300 W/mK) and
graphite (up to 1960 W/mK). EG has excellent thermal and electrical properties, is one of the
3
Page 4
stiffest materials found in nature and presently costs two orders of magnitude less than CNTs
[11]. With appropriate surface treatment, dispersion of EG in a polymer matrix results in
composites with excellent mechanical and electrical properties and high TC [12, 13-, 14 , , ,15 16 17].
Recent research has demonstrated the ability to functionalize nanomaterials such as layered
silicate nanoclays, CNTs and CNFs, EG, and silica nanoparticles with a layer of highly
conductive metal such as copper (Cu), silver (Ag), or nickel (Ni) [18]. Polymer nanocomposites
(PNCs) of Ag-metallized CNFs have very high electrical conductivity and exhibit excellent
shielding effectiveness [19]. Based on the results of previous studies, it was anticipated that
these materials would also enhance the TC of Elvax based nanocomposite.
Neat metallic materials have also been reported to increase the TC of composites and include Ni
nanostrands and aluminum (Al) particles. Ni nanostrands are receiving increasing attention as an
electrically conductive additive in polymers and composites. They are grown as an
interconnected three-dimensional lattice of sub-micron and nanostructured strands of nickel and
are paramagnetic in nature [20, 21]. Al-containing particles have also been used to enhance the
TC of polymers [22]. Thus it was of interest to investigate the use of a combination of Al
particles and some of the above mentioned nanofillers as an approach to achieving greater
improvements in TC.
Inorganic compounds such as boron nitride (BN) have been used to improve the TC of some
ceramics with the resultant composites showing a considerable degree of anisotropy in TC [23].
BN powders are highly pure single crystal hexagonal platelets with particle sizes between 6 and
4
Page 5
13 μm. The TC is also expected to be high for BN nanotubes whose parent material h-BN has
exceptional ab-plane TC [24].
The main problem with the use of these nanofillers is the difficulty in dispersing them in a
polymer matrix. For example, to solve the dispersion problem usually associated with CNTs,
various methods have been attempted which include preparation of the polymer in the presence
of CNTs under sonication [25], the use of alkoxysilane terminated amide acid oligomers [26],
melt mixing [27], high shear mixing [28], the use of surfactants and covalent functionalization
of the CNTs with various groups. Covalent functionalization has been primarily achieved
through carboxylic acid moieties generated on the CNT surface after oxidative treatment [29].
The prominent thermal properties of CNTs have made them one of the most promising materials
for future applications as thermal management materials and hence their preferred choice in this
work. Enhancement of TC has been observed in CNT suspensions [30-31] with the measured
TC values generally greater than theoretical predictions made with conventional heat conduction
models. In the case of SWCNTs, peak TC falls off at higher temperatures due to Umklapp
scattering [32]. For carbon-carbon composites, there is a larger mean free path and less phonon-
phonon Umklapp scattering causing the TC to increase linearly with heat treatment temperature
[33]. Research in our lab has shown improvements in TC upon addition of MWCNTs and CNFs
to a polyimide [34, 35]. However in PNCs, the improvement in TC has always been lower than
rule-of-mixture values. In addition to the dispersability issue, another reason that anticipated TC
enhancements are not realized is that of thermal interface resistance or Kapitza resistance [36].
This resistance represents a heat flow barrier associated with the differences in the phonon
5
Page 6
spectra of the two phases and weak contact at the interface, both of which lead to phonon
backscattering. One approach of reducing this interface problem is by covalent attachment of
CNTs to the matrix. Molecular dynamics simulation on SWCNTs showed that functionalization
with octane on one out of 15 CNT carbon atoms (~7% functionalization) reduced the thermal
interface resistance more than three times. However, it was also reported that these attachments
can act as phonon scattering centers themselves and thus reduce CNT conductivity [37]. The
effect of functionalization of SWCNTs on the TC of nanocomposites has also been studied using
a multi-scale modeling approach. These results predict that grafting linear hydrocarbon chains to
the surface of a SWCNT with covalent chemical bonds should result in a significant increase in
the TC of these nanocomposites [38].
The primary objective of this work was to enhance the TC of Elvax™ 260 by nanofiller addition.
This polymer is currently used in tubing application since it provides outstanding toughness and
resilience while maintaining flexibility over a broad temperature range without the need for
plasticizers. Melt compounding was chosen as the method to disperse nanoparticles in Elvax™
260 because the technique involves shear mixing, which helps disentangle the nanoparticles and
disperse them more uniformly within the matrix. Melt mixing was followed by extrusion in some
of the samples described herein. The process of extruding nanocomposite through a suitable die
and subsequent drawing led to continuous ribbons of nanocomposites with substantial
nanoparticle orientation in the flow direction. Dispersability of the nanoparticles was assessed by
high resolution scanning electron microscope (HRSEM) and fabricated specimens were
characterized for their room temperature tensile properties and TC. The preparation and
6
Page 7
characterization of samples containing various wt% loadings of the aforementioned nanoparticles
are discussed.
2. EXPERIMENTAL
2.1 Materials Elvax™ 260, a melt processable ethylene vinyl acetate copolymer resin was used
as received from E.I. du Pont de Nemours and Co. MWCNTs, VGE-S12 and VGE-S16, were
procured from the University of Kentucky. CNF, Pyrograph - III - PR-24 HHT was obtained
from Applied Sciences, Inc. and EG (Grade 3775) was received from Asbury Carbons. The
graphite already had the galleries expanded by first treating with sulfuric acid and then rapidly
heating the sample to 900 ºC. The expansion of the graphite was expected to facilitate exfoliation
during melt mixing. Metallized CNFs (Ag, Cu, and Ni coated) were obtained from Materials
Research Institute, LLC. Ni nanostrands were obtained from Metal Matrix Composites and BN
powder (PolarTherm BN, grade PT140) from GE Advanced Ceramics. Al powder was obtained
from Alcon-Toyo Industries, Inc. All other chemicals were obtained from commercial sources
and used as received.
2.2 Characterization HRSEM images were obtained using a Hitachi S-5200 field emission
scanning electron microscope (FE-SEM) equipped with a “through-the-lens” secondary electron
detector. Room temperature thin-film tensile properties were determined according to a modified
version of ASTM D882 using either four or five specimens (0.51 cm wide) per test condition
using an Eaton Model 3397-139 11.4 kg load cell on a Sintech 2 test frame. The test specimen
gauge length was 5.1 cm and the crosshead speed was 0.51 cm/minute for the MWCNT, CNF
and EG samples. For other samples, the crosshead speed was increased to 50 cm/min due to high
elongation to break. Thermogravimetric analysis (TGA) was performed on the modified
7
Page 8
MWCNT and EG powder samples using an Auto TGA 2950HR (TA Instruments, DE) in argon
at a flow rate of 50 mL/min. The samples were heated at 20 oC/min to 100 oC, held for 0.5 h to
drive off any moisture, and then heated to 600 oC at a rate of 2.5 oC/min. The TGA data taken at
500 °C was used to determine the amount of aliphatic groups present. At this temperature the
organic (aliphatic) groups would decompose without affecting the nanofillers. Thermal
diffusivity of the molded samples as well as ribbons was measured at 25 oC using a Netzsch LFA
447 NanoFlash according to ASTM E1461. Sample sizes of 1 cm x 1 cm were cut by an Isomet
low speed saw with a diamond wafering blade; 12.7 cm diameter and 0.5 mm thick with 30 HC
diamond (Buehler Ltd). Sample density was calculated by measuring sample dimensions and
mass. Specific heat of each test sample was measured by comparing the temperature rise of the
sample to the temperature rise of a standard reference sample (Pyrex, TC ~ 1.09 W/mK, Cp ~
0.76 J/gk) tested under the same conditions. The steady-state TC was calculated through the
equation
ρλ DC p=
where λ is TC, Cp is specific heat, D is thermal diffusivity, and ρ is the material density. Samples
were sprayed with a thin layer of graphite for uniform thermal adsorption, which was easily
rinsed away by solvent (e.g. methanol).
2.3.1 Coating of 1-dodecylbromide on carbon allotropes (MWCNTs and EG 3775)
To a three-necked round-bottom flask equipped with a nitrogen inlet, mechanical stirrer, and
drying tube was charged EG 3775 (20.0 g). The flask was then flame dried under nitrogen and
cooled to ambient temperature. Tetrahydrofuran (THF, 400 mL) was added and the mixture
sonicated at room temperature for 1 h in an Ultrasonik 57X bath operating at ~50% power and
8
Page 9
degas levels. 1-Dodecylbromide (91.82 g) was subsequently added and rinsed in with 50 mL
THF and the mixture stirred under nitrogen at room temperature for 48 h. The product was
recovered by vacuum filtration, washed twice with diethyl ether, and air dried at 110 °C
overnight to afford 19.7 g of product. The amount of 1-dodecylbromide on the EG was 0.1 wt %
as determined by the weight loss at 500 ºC by TGA. A similar process was carried out using
MWCNTs.
2.3.2 Covalent attachment of 1-dodecylamine on carbon allotropes (EG 3775)
To a single necked round-bottom flask equipped with a magnetic stir bar and condenser was
charged EG 3775 (21.8 g), thionyl chloride (300 g), and N,N-dimethylformamide (2 mL). The
mixture was refluxed for 48 h and excess thionyl chloride removed by distillation. The product
was washed with diethyl ether, recovered by vacuum filtration, and dried at 35 °C for 1 h under
vacuum. The as-isolated material (22.31 g) was added to a three-necked 500 mL round-bottom
flask equipped with a nitrogen inlet, mechanical stirrer, and drying tube. N,N-Dimethylacetamide
(200 mL) and 1-dodecylamine (12.8 g) were then added and the mixture stirred at room
temperature under nitrogen for 48 h. The product was recovered by vacuum filtration, washed
with ethanol, and air dried at 50 °C overnight in flowing air to afford 22.54 g of product. The
amount of 1-dodecylamine was 4.1 wt % as determined by the weight loss at 500 ºC by TGA.
2.4.1 Melt mixing of Elvax™ 260 with nanofillers Elvax™ 260 was compounded with
MWCNTs, CNFs and EGs in a 60 cc internal mixer (Plasticorder PL2000, Brabender) for 3 h at
25 rpm and 125 °C under a N2 purge. MWCNTs (20 and 30 wt %), CNFs (20, 30 and 40 wt %),
and EG (20, 30, and 40 wt %) were added to the polymer. 30 wt % Al powder was melt mixed
9
Page 10
with 20 and 30 wt % loadings of MWCNTs, CNFs and EG. Attempts at mixing the polymer with
higher nanofiller loadings (40 wt %) were not possible as there was not enough polymer to bind
the high loading of nanofillers and Al powder. The loading level used for BN was 20 wt % and
20 and 30 wt % loading levels of Ag, Cu and Ni coated CNFs and Ni nanostrands were used.
During mixing the torque produced was measured and used to calculate the viscosity of the
sample. Upon completion of mixing, the material was ground in a Mini-Granulator (Kayeness,
Inc.) using a 5.5 mm screen.
2.4.2 Extrusion of Elvax™ 260 with nanofillers Samples were extruded through a Laboratory
Mixing Extruder (LME, Dynisco, Inc.) with a 0.38 mm x 19.1 mm die at a mandrel temperature
of 50 °C and a die temperature of 125 °C. Samples were extruded in the form of continuous
ribbons that were 0.1-0.5 mm thick, 10-15 mm wide, and several meters in length. Tubing was
extruded using the same extruder and a 0.476 cm outer die (o.d.) die head and a 0.3175 cm
mandrel tip at a mandrel temperature of 50 °C and a die temperature of 130 °C. For Al-
containing samples, ribbons were extruded using a 1.27 cm single screw extruder (L:D – 15:1) at
10 rpm. The CW Brabender extruder was attached to the PL2000 and the temperature at the three
zones were 50 °C (hopper), 115 °C (barrel mid-section) and 115 °C (die). Tubing was extruded
using a the same extruder with a 0.476 cm o.d. die head and 0.3175 cm mandrel tip at 10 rpm
and the temperature at the three zones were 50 °C (hopper), 100 °C (barrel mid-section) and 105
°C (die).
2.4.3 TC sample fabrication of Elvax™ 260 with nanofillers Samples with parallel alignment
of the nanofillers in the flow direction were obtained from cut ribbons of Section 2.4.2. For
10
Page 11
samples with perpendicular nanofiller alignment the following procedure was performed. The
extruded ribbons were cut into pieces approximately 2 cm x 2 cm, then stacked on one side of a 9
cm x 2 cm x 3 cm (inner diameter i.d.) mold and the remainder of the mold was filled with
Elvax™ 260 pellets. The stacked ribbons were compression molded at 80 °C and 1.72 MPa for 2
h. The molded samples were sliced using the Isomet low speed saw described previously.
Randomly oriented samples were made using a Laboratory Mixing Molder (LMM Dynisco, Inc.)
and a rectangular mold (1.52 mm x 38.1 mm x 1.27 mm). A rough blend of materials was added
to the mixing bowl of the LMM kept at 125 oC and maintained for 0.5 h. The blend was
dynamically pressed at a rotational speed of 100 % of ram-motor capacity and static pressed to
degas, before passing through the nozzle orifice (~1.6 mm) into the rectangular mold kept at 125
oC. The material was then manually compressed at ~ 4.5 kN and set under pressure from the ram
while being air cooled.
For Al-containing samples, specimens were prepared from ribbons using compression molding at
80 °C and a pressure of 1.72 MPa for 2 h. Samples for TC analysis were prepared from the
plaques by cutting them with a diamond wafering blade as above.
3. RESULTS AND DISCUSSION
3.1 Modification of MWCNTs and EG 3775 The surface of the MWCNTs and EG 3775 were
modified with aliphatic groups through surface coating (electrostatic) and covalent attachment.
Electrostatic attachment was accomplished with 1-dodecylbromide and generally resulted in less
than 0.2 wt % loading. An approximate order of magnitude increase in loading was observed
with the covalent attachment of 1-dodecylamine through formation of an amide linkage by the
11
Page 12
reaction of the acid chloride modified carbon allotrope and the aliphatic amine. Representative
TGA curves of the various modifications to EG 3775 are shown in Figure 1. The TGA data was
used to qualitatively determine the wt% loading of aliphatic groups on the EG. As evident from
the figure, there is a higher amount of the aliphatic present via covalent attachment on the EG as
there is a greater wt% loss in the TGA curve.
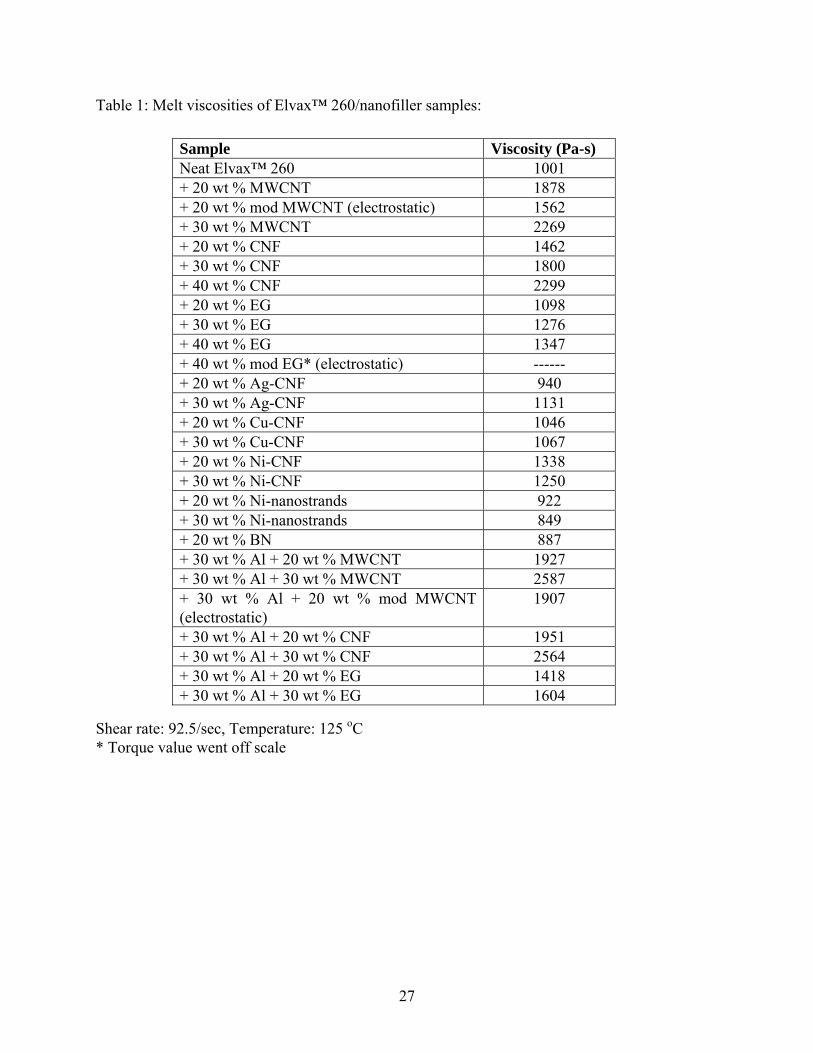
3.2 Processing of Elvax™ 260/nanofillers Torque values were obtained during mixing in the
Plasticorder and used to calculate sample melt viscosities. Table 1 denotes the calculated melt
viscosities of the various samples at 125 °C and a shear rate of 92.5 sec-1. The main purpose for
obtaining the viscosity data was to evaluate if the nanocomposite samples could be extruded into
ribbons using the LME and hence the data is for qualitative evaluation only. It was observed in
previous studies [39] that most materials could not be extruded at high filler loadings when the
viscosity was above a certain value, typically 5000 – 6000 MPa. But for Elvax™ 260
nanocomposites with loading levels as high as 50 wt% the melt viscosity was typically within the
range of extrusion. As expected, the neat resin had the lowest viscosity and these values
increased with increasing nanofiller loading. However, modification of MWCNTs with long
chain aliphatic groups lowered the viscosity compared to unmodified MWCNTs at a similar wt
% loading. The torque data for the modified EG went off the lower end of the scale implying that
the material exhibited a very low viscosity. Thus the material could not be compared to the
unmodified EG. It was also noted that the addition of some nanofillers, such as Ni nanostrands
and BN powder, lowered the melt viscosity and it was assumed that these fillers may have had a
plasticizing effect. Figure 2 shows a typical extruded ribbon. The primary purpose of extrusion
was to align nanofillers in the flow direction. Stacked ribbons were molded and samples obtained
12
Page 13
by cutting the molded block in the direction of the dotted line in Figure 3 using a diamond saw.
In this way samples were obtained with alignment both parallel and perpendicular to the
direction of TC measurement. Figure 4 shows the extruded tubes containing Elvax™
260/nanofillers. Some alignment of nanofillers in these tubes was expected although it might not
be to the same extent as present in corresponding extruded ribbons.
3.3 HRSEM of nanoparticles and extruded ribbons Figure 5(a) shows the 10 wt% MWCNT
melt mixed ribbon while Figure 5(b) shows the 30 wt% MWCNT ribbon. In both cases it was
observed that MWCNTs were aligned in the flow direction (indicated by the arrow). Figures 5(c)
and (d) show the alignment at two CNF loading levels. Here, too, there is significant alignment
of nanofibers in the extrusion direction. HRSEM images obtained for the 30 and 40 wt % EG
extruded ribbon [Figure 5 (e & f)] respectively showed graphite platelets visible at high voltages
that varied in size but were all under 1 µm in one dimension. By qualitative observation, the
particles appeared to be predominantly well dispersed throughout the polymer and this was
evident even at low magnifications. Assessment of EG alignment was not easily discernable in
these images as well as others not shown due to the shape of the nanoparticle. Figure 6(a) shows
the structure of Ni nanostrands while Figure 6(b) shows Ag-CNF samples. As a result of the
metal coating on the nanofibers, their diameters have increased thus diminishing the benefit of a
large aspect ratio offered by the CNFs. Figure 7(a) shows Al particles in the form of flakes.
When compounded with MWCNTs and polymer, most of the flakes were covered by the resin
but some uncoated flakes can be discerned [Figure 7(b)].
13
Page 14
Figure 8(a) shows HRSEM images of the outer surfaces of the Elvax™ 260/MWCNT extruded
tubing. The nanotubes are significantly aligned in the direction of extrusion denoted by the
arrow; the effect of which will be discussed later in the paper. Figure 8(b) shows a cross section
image of the tubing and MWCNTs can be seen projecting from the polymer matrix.
3.4. Tensile properties of extruded ribbons Tensile properties were measured at room
temperature on Elvax™ 260/nanofiller composites with the results shown in Tables 2a and 2b.
The strips used for testing were cut from extruded ribbons, hence the nanofillers are somewhat
aligned in the stress direction. The results should be viewed with care because the measurement
of the ribbon thickness was not precise due to the uneven ribbon surfaces. In Table 2a, the testing
was done at 0.51 cm/min, while in Table 2b the testing was carried out at 50 cm/min in order to
reduce the time due to the high elongations. It was seen that the strength of the neat material
increased as higher polymer strength is almost always observed for higher strain rates (or shorter
testing times) [40, 41]. The modulus for the neat Elvax™ 260 remained the same. Where the
data scatter was low some conclusions were drawn. For a loading level of 20 and 30 wt %, CNF
the strengths were comparable and increased with respect to the neat material. At 40 wt% CNF
and 20 wt% EG loadings, the strength was lower than that of the neat material. Even with a high
data scatter, the metallized CNFs and 30 wt% Ni nanostrands exhibited reduced strength
compared to the neat Elvax™ 260. The incorporation of Al with the carbon based nanofillers
resulted in lower strengths and may be due to the very high filler loading. Other discernable
strength trends could not can be made due to the large scatter in the data.
14
Page 15
In general, the modulus increased with increasing nanofiller loading as expected. The exception
to this was the metallized CNFs and Ni nanostrands which showed either very minor increase
(20 wt% Ag-CNF), no change, or a decrease with respect to the neat material. Modification of
EG with alkyl groups afforded a reduction in the modulus compared to neat EG at a similar wt
loading. However, the same can not be said for the modified MWCNT and MWCNT at a
comparable wt loading due to overlap in the data scatter. For Al containing samples there was a
significant increase in modulus compared to Elvax™ 260 due to the high total filler loading. For
the carbon nanofillers at a 20 wt% loading and 30 wt% Al loading the modulus decreased in the
order of MWCNT > EG > CNF. Additionally modification of the MWCNT resulted in
decreasing the modulus compared to the neat MWCNT at 20wt% loading of the MWCNT type
and 30 wt% Al. The loading (up to 60 wt % net) caused a significant lowering of elongation and
reduced strength of samples.
3.5 Thermal conductivity measurements Since the structure of the nanofillers is anisotropic in
space, the electrical and thermal properties should be different in the axial (parallel to
nanotube/fiber axis) and transverse (perpendicular to nanotube/fiber axis) directions. There have
been a few reports on the use of dispersed CNTs as thermally conducting fillers in polymer
composites and certain enhancements in TC were observed [33, 42]. However, the enhanced
values were typically below those predicted by the rule of mixtures. One reason for this is the
probable existence of interface thermal resistance between the overlaps in the CNT passage
leading to a rapid increase in overall thermal resistance [43]. Huang, et al. [42] proposed a
composite structure where all the CNTs embedded in the matrix were aligned from one surface
to the opposite side with all the CNT surfaces revealed on both surfaces. This structure would
15
Page 16
lead to high TC since the CNTs form ideal thermally conducting pathways. Low thermal
interface resistances can also be expected as the protruding tips would ensure better thermal
contact. Alignment of nanofillers in the polymer matrix has been reported to enhance TC [33,
44]. Based on the literature survey to date, it was decided to process samples with significant
nanofiller alignment and measure TC both in the direction of and perpendicular to alignment
(nanotube/fiber axis).
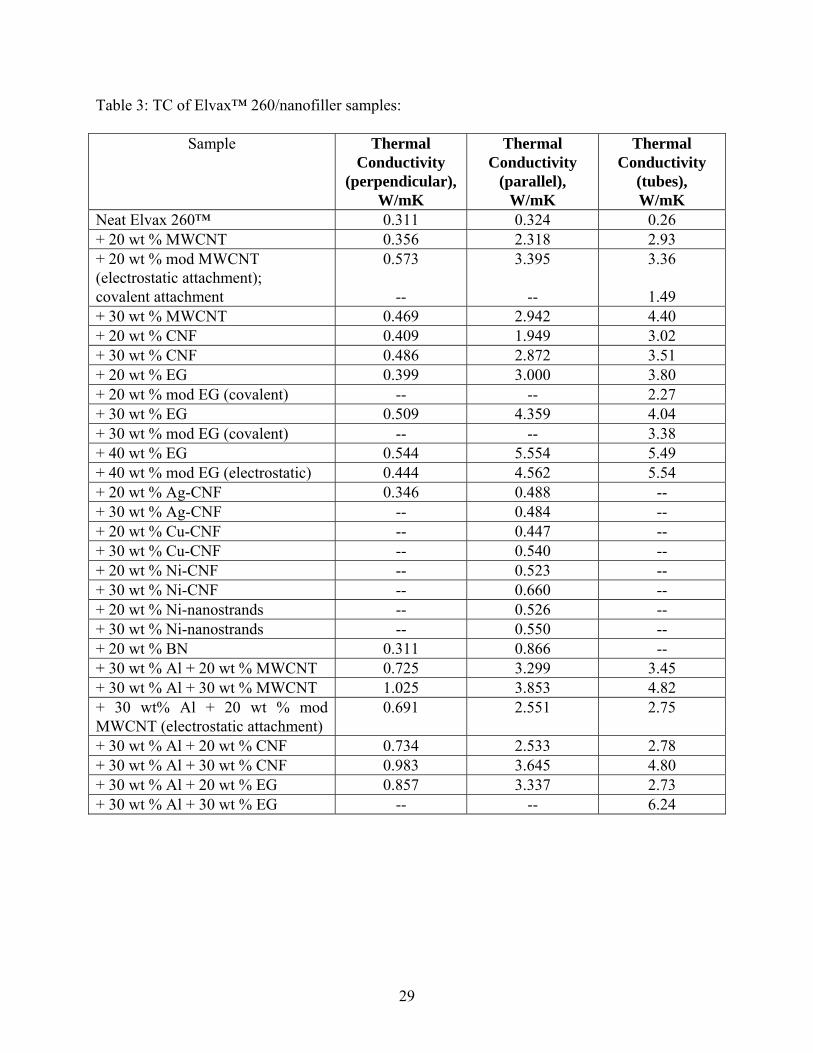
Three types of Elvax™ 260/nanofiller samples were measured for TC. These were the extruded
ribbon, molded samples cut perpendicular to flow direction, and extruded tubes. For the extruded
ribbons and tubing, the TC was measured perpendicular to the direction of nanofiller alignment.
The TC of parallel aligned nanofillers was determined from specimens cut from molded ribbons.
In the case of samples containing only MWCNTs, CNFs, or EG another set which had random
alignment was also examined. Table 3 denotes the values for neat Elvax™ 260 and Elvax™
260/nanofiller samples. The TC increased with increasing loading level of nanofillers in many
cases and was dependent upon alignment. The first set of samples (Table 3, column 1) was for
extruded ribbons where the TC was determined perpendicular to the nanofiller. For BN samples
no improvement in TC was observed. For metallized CNF samples and Ni nanostrands, the
surface was too rough and measurements were unsuccessful despite several attempts. Only the
TC for the 20wt% Ag-CNF sample could be determined and even though the value was higher
than the neat sample, it was lower compared to a similar loading of CNFs. The highest TC was
observed in Al samples with a loading of 30 wt % MWCNT. The TC increased more than 3-fold
and similar increases were observed with CNF and EG containing Al samples. In the case of
samples without Al, the modified (electrostatic attachment) MWCNT sample had a higher TC
16
Page 17
value compared to the unmodified sample having the same loading level. However, the same
trend was not observed in the case of modified (electrostatic attachment) EG samples.
The second set of samples comprised of the molded samples where the TC was measured in the
direction of nanofiller alignment (parallel to nanofiller axis) as shown in Table 3 (column 2). The
TC of these samples was observed to be significantly greater when compared to those
perpendicular to alignment (column 1). It was observed that TC values of metallized CNFs and
Ni nanostrands were higher compared to the neat polymer with 50% improvement for the Ag-
CNF samples, 67 % improvement for the Cu-CNF samples, and a 2-fold increase for the Ni-CNF
samples. For Ni nanostrands the improvement was about 70%. Comparisons between the two
alignment types for these samples could not be assessed due to the reason previously mentioned.
However for the 20 wt% Ag-CNF sample, the parallel alignment exhibited a 41% improvement
in TC compared to the perpendicular TC. For BN and Al-loaded samples, TC was observed to be
significantly greater in the direction of alignment compared to perpendicular to alignment. The
BN sample showed a 2.5-fold improvement in TC. MWCNT samples at 30 wt % loading
exhibited a 9.1-fold increase in TC relative to neat Elvax™ 260 whereas CNF samples loaded at
40 wt % showed a 12.1-fold increase. The largest TC increase, 17.1-fold, was exhibited by 40 wt
% loading of EG samples. The data suggested that aligned nanofillers form a network to
successfully conduct heat by perhaps enabling a more efficient phonon transfer from one filler
particle to another. Comparing neat and modified (electrostatic attachment) MWCNTs, it was
observed that TC showed a 10.5-fold improvement upon modification compared to a 7-fold
improvement in the unmodified sample. However, for the modified (electrostatic attachment) EG
sample, the improvement in TC was 14-fold compared to 17-fold for the unmodified material.
17
Page 18
For Al samples, the MWCNT samples at 30 wt % loading exhibited a 11.8-fold increase in TC
relative to neat Elvax™ 260, whereas the CNF samples loaded at 30 wt % showed an 11.3-fold
increase. The 20 wt % loading of EG samples showed a 10.3-fold improvement and was slightly
better than the TC of the 20 wt% MWCNT sample and significantly greater than the 20 wt%
CNF sample. When compared to samples without Al particles, it was seen that the addition of Al
significantly improved the TC of samples, by as much as 30%, as observed in the case of 30 wt
% MWCNT.
EG is a loose and porous product and its structure is basically parallel sheets, which collapse and
deform resulting in many pores of different sizes ranging from 10 nm to10 μm. Because of the
high expansion ratio (generally200 –300) of expanded graphite in c-axis, galleries of expanded
graphite can be easily intercalated by suitable polymers [45]. Thermal conduction systems
containing expanded graphite are “attached” systems in which expanded graphite particles
interact with each other and affect the position of expanded graphite particles. Hence, the EG
samples exhibit high TC values.
TC was measured for extruded tubes as well. Extrusion of tubes was carried out with the
MWCNT, CNF, and EG loaded and Al/nanofiller samples as these specimens showed promising
TC values in the form of ribbons. HRSEM revealed alignment of the nanofillers along the length
of the tubes and TC measurements were made in the direction of the tube axis. As seen in Table
3 (column 3) for the Al loaded samples, 30 wt % loading of MWCNTs improved the TC 18.5-
fold (compared to 17-fold in samples without Al) while the same loading of CNF improved TC
18.4-fold (compared to 13-fold in samples without Al). For 30 wt % EG samples, the
18
Page 19
improvement was 24-fold (compared to 15.5-fold in samples without Al) and a sharp increase in
TC was observed when loading levels increased from 20 to 30 wt% for Al loaded samples.
However, the modified (electrostatic attachment) MWCNT sample did not show an increase
compared to the unmodified MWCNTs when the samples were loaded with Al. This is in
contrast to the samples without Al where modified (electrostatic attachment) MWCNTs
improved the TC compared to unmodified MWCNTs. Also, MWCNTs modified by covalent
attachment had a lower TC value compared to that with noncovalent attachment, possibly due to
the presence of more phonon scattering centers. In general, the tubes exhibited a slightly higher
TC compared to the same composition of molded samples when measured in the direction of
alignment.
The highest TC value for the randomly oriented samples (Table 4) was exhibited by 50 wt %
modified (covalent) EG sample that showed a 7.6-fold increase. Again, modified (electrostatic)
MWCNT samples showed higher TC values compared to the unmodified ones while the opposite
was observed for modified (electrostatic) EG samples. TC results from the LMM samples proved
conclusively that alignment of nanofillers in the polymer matrix significantly raised the TC of
the samples. However, unaligned samples also showed a significant improvement and may be
useful in applications when it is not possible to achieve nanoparticle alignment in a desired
direction.
3.6 Radius of curvature of tubing Disadvantages with the current LCVG are that it is heavy
and restricts mobility due to the large number of rigid cooling lines. An analytical study
performed by Lockheed Martin Space Operations concluded that significant improvements in
19
Page 20
weight, comfort, and mobility of the LCVG could be achieved by increasing the TC of the fabric
and the plastic cooling lines [46]. Although the incorporation of various nanofillers has
significantly improved the TC, it is also necessary to ensure that the flexibility of the cooling
tubes is not compromised so that they can be effectively woven into the fabric. Flexibility of the
extruded tubes was tested by using a series of stainless steel cylinders of varying diameter. Each
tube was wound around the cylinder of a particular diameter and the smallest diameter that the
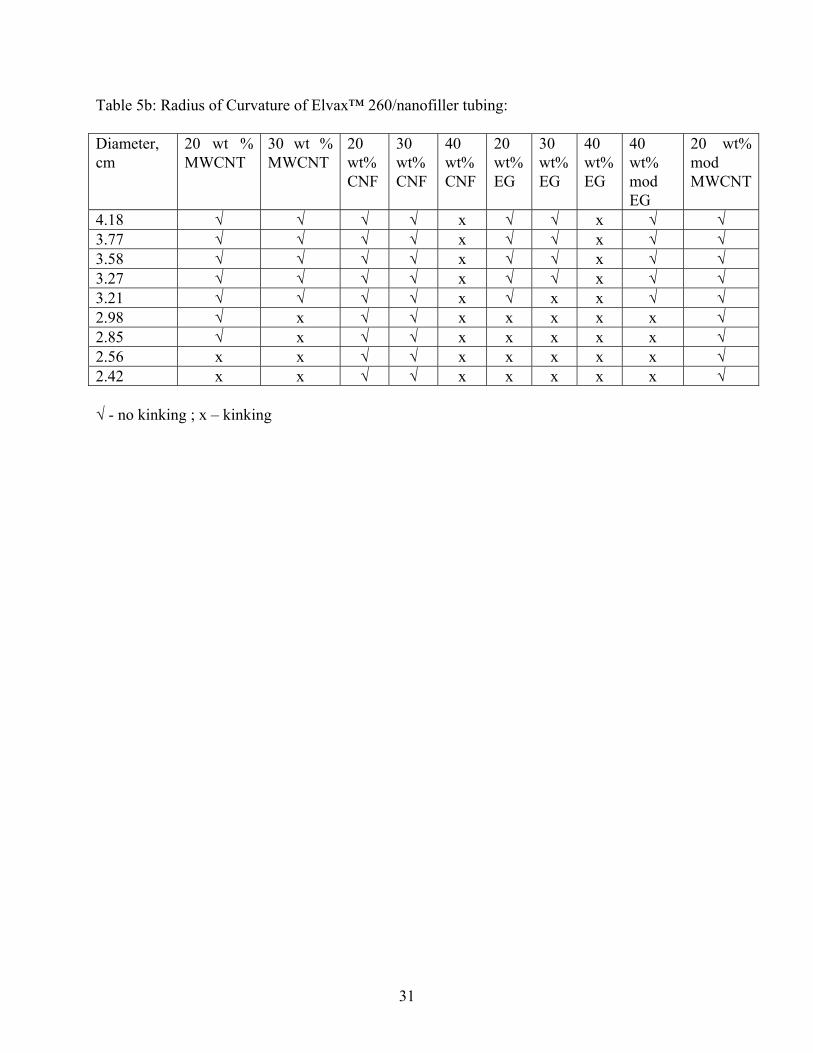
tube could be wound around without kinking was noted. Table 5 shows the data from these
flexibility tests. It was observed that for Al loaded samples (Table 5a) at loading levels of 20 wt
%, CNF, EG, MWCNT and modified MWCNT-filled Elvax™ 260 had high flexibility. At 30 wt
% loading level only the EG samples showed kinking at the smallest diameter. These data exhibit
a significant improvement on samples without Al (Table 5b) where only the CNF and modified
MWCNT samples showed no kinking and the EG samples showed substantial kinking. For
samples without Al, it was observed that at loading levels of 20 and 30 wt %, CNF filled
Elvax™ 260 had the highest flexibility and the EG filled polymer had least. Typically the EG
filled samples had higher TC but as evident from Figure 7, at higher loading levels they had a
greater tendency to kink. However, alkyl-modified nanofillers yielded a significant improvement
in flexibility as seen in the cases of the 20 wt % modified (electrostatic) MWCNT and the 40 wt
% modified (electrostatic) EG. When 20 and 30 wt% modified (covalent) EG samples were
tested, they exhibited greater flexibility compared to their unmodified counterparts. In all cases
modification (covalent or electrostatic) improved the flexibility but the effect on the TC varied. It
was possible that the alkyl groups provided a plasticizing effect.
20
Page 21
4. SUMMARY
Elvax™ 260 was mixed with various nanofillers in an effort to increase the TC of the polymer
without significantly sacrificing flexibility. After initial mixing, the nanocomposites were
extruded or processed via the LMM process. HRSEM revealed significant alignment of the
nanofillers in the flow direction in the extruded samples. TC measurements were made both in
the direction of and perpendicular to nanofiller alignment, for tubes along their lengths as well as
for unaligned samples. For ribbon samples it was found that the largest improvement in TC was
achieved in the case of aligned samples when the measurement was performed in the direction of
alignment. Unaligned samples also showed an improvement in TC and may be useful in
applications when it is not possible to align the nanofiller. For extruded ribbons and molded
samples, modification (electrostatic) of MWCNTs led to significant improvement in the TC
value compared to the composite containing unmodified MWCNTs but this behavior was not
seen for the modified (electrostatic) EG sample. However, for tubes containing modified
(covalent or electrostatic) nanofillers, all samples showed improvement in flexibility but the
effect on TC varied. It was also observed that the addition of Al particles to the polymer loaded
with nanofillers improved the TC significantly without compromising flexibility. When all four
types of samples were compared, the extruded tubes showed the highest TC. Improvements in
TC did not approach those expected based on a rule of mixtures and this was likely due to poor
phonon transfer through the matrix. Finally when the TC, flexibility, and material cost were
taken into consideration, it was concluded that compositions with 20 and 30 wt % loading of
CNF and the modified (electrostatic) MWCNT and EG compositions produced composites of
high TC and good flexibility. The 20 and 30 wt % loading levels of EG and 30 wt % Al powder
exhibited excellent flexibility, high TC, and are cost effective. The use of Al powder and EG to
21
Page 22
improve the TC of the cooling tubes of the LCVG subcomponents appears attractive and
additional testing of cooling tubes comprised of these materials is warranted.
5. ACKNOWLEDGEMENT
The authors would like to thank Asbury Carbons for providing the EG and Tom Hughes and
Applied Sciences, Inc. for providing the CNFs. Many thanks to Dr. Marcus A. Belcher, National
Institute of Aerospace, and Dr. Emilie Siochi, NASA LaRC, for their valuable comments and
discussions.
22
Page 23
6. FIGURES AND TABLES
Figure 1: TGA in argon of EG 3775 (pristine), electrostatic (1-dodecylbromide), and covalent (1-dodecylamine) modification.
Figure 2: Ribbon of Elvax™ 260/MWCNTs Figure 3: Plaque showing cut direction and nanofiller alignment (arrow)
Figure 4: Extruded tubes of Elvax™ 260/MWCNTs
23
Page 24
Figure 5(a): 10 wt % MWCNT Figure 5(b): 30 wt % MWCNT
Figure 5(c): 30 wt % CNFs Figure 5(d): 40 wt % CNF
Figure 5(e): 30 wt % EG Figure 5(f): 40 wt % EG
Figure 5: HRSEM of Elvax™ 260/nanofiller ribbon samples; arrow denotes flow direction
24
Page 25
Figure 6(a): Nickel Nanostrands Figure 6(b): Ag-CNF
Figure 7(a): Al powder Figure 7(b): Elvax 260™ /Al powder/ MWCNT
Figure 7: Elvax 260™ with Al powder
Figure 8(a): 30 wt % MWCNT Figure 8(b): 20 wt % MWCNT
Figure 8: HRSEM of surfaces of Elvax™ 260/MWCNT tubing
25
Page 26
Figure 7(a): No kinks – 30 wt % MWCNT Figure 7(b): Kinking – 30 wt % EG
Figure 7: Radius of curvature of Elvax™ 260/nanofiller tubing
26
Page 27
Table 1: Melt viscosities of Elvax™ 260/nanofiller samples: Sample Viscosity (Pa-s)
Neat Elvax™ 260 1001 + 20 wt % MWCNT 1878 + 20 wt % mod MWCNT (electrostatic) 1562 + 30 wt % MWCNT 2269 + 20 wt % CNF 1462 + 30 wt % CNF 1800 + 40 wt % CNF 2299 + 20 wt % EG 1098 + 30 wt % EG 1276 + 40 wt % EG 1347 + 40 wt % mod EG* (electrostatic) ------ + 20 wt % Ag-CNF 940 + 30 wt % Ag-CNF 1131 + 20 wt % Cu-CNF 1046 + 30 wt % Cu-CNF 1067 + 20 wt % Ni-CNF 1338 + 30 wt % Ni-CNF 1250 + 20 wt % Ni-nanostrands 922 + 30 wt % Ni-nanostrands 849 + 20 wt % BN 887 + 30 wt % Al + 20 wt % MWCNT 1927 + 30 wt % Al + 30 wt % MWCNT 2587 + 30 wt % Al + 20 wt % mod MWCNT (electrostatic)
1907
+ 30 wt % Al + 20 wt % CNF 1951 + 30 wt % Al + 30 wt % CNF 2564 + 30 wt % Al + 20 wt % EG 1418 + 30 wt % Al + 30 wt % EG 1604
Shear rate: 92.5/sec, Temperature: 125 oC * Torque value went off scale
27
Page 28
Table 2a: Mechanical properties of Elvax™ 260/nanofiller samples (0.51 cm/min): Sample Modulus,
GPa Strength,
MPa Elongation.,
% Neat Elvax™ 260 0.01 ±0.001 9.7 ± 0.1 856 ± 102 + 20 wt % MWCNT 0.07 ± 0.01 11.1 ± 2.0 586 ± 45 + 20 wt % mod MWCNT (electrostatic) 0.06 ± 0.01 9.0 ± 1.6 481 ± 209 + 30 wt % MWCNT 0.12 ± 0.01 10.2 ± 4.0 274 ± 93 + 20 wt % CNF 0.05 ± 0.01 11.3 ± 0.3 710 ± 54 + 30 wt % CNF 0.09 ± 0.01 11.9 ± 0.4 537 ± 4 + 40 wt % CNF 0.13 ± 0.01 8.1 ± 0.3 97 ± 20 + 20 wt % EG 0.06 ± 0.01 7.7 ± 1.1 430 ± 65 + 30 wt % EG 0.10 ± 0.01 8.9 ± 0.7 164 ± 44 + 40 wt % EG 0.18 ± 0.02 11.9 ± 2 77 ± 8 + 40 wt % mod EG (electrostatic) 0.12 ± 0.01 8.5 ± 2.4 97 ± 16
Table 2b: Mechanical properties of Elvax™ 260/nanofiller samples (50 cm/min):
Sample Modulus, GPa
Strength, MPa
Elongation, %
Neat Elvax™ 260 0.014 ± 0.001 17.8 ± 0.2 900 ± 15 + 20 wt % Ag-CNF 0.017 ± 0.001 16.0 ± 0.1 814 ± 57 + 30 wt % Ag-CNF 0.014 ± 0.0003 14.1 ± 1.6 842 ± 45 + 20 wt % Cu-CNF 0.009 ± 0.003 13.2 ± 2.4 835 ± 22 + 30 wt % Cu-CNF 0.007 ± 0.003 11.0 ± 3.4 15.5 ± 1 + 20 wt % Ni-CNF 0.007 ± 0.002 10.2 ± 2.6 748 ± 59 + 30 wt % Ni-CNF 0.013 ± 0.001 9.2 ± 0.8 538 ± 41 + 20 wt % Ni-nanostrands 0.012 ± 0.003 16.2 ± 1.0 872 ± 32 + 30 wt % Ni-nanostrands 0.012 ± 0.003 5.8 ± 1.7 531 ± 77 + 20 wt % BN 0.023 ±0.003 16.7 ± 3.0 714 ± 52 + 30 wt % Al + 20 wt % MWCNT 0.140 ± 0.01 11.4 ± 1.3 49 ± 7 + 30 wt % Al + 30 wt % MWCNT * * * + 30 wt % Al + 20 wt % mod MWCNT (electrostatic) 0.087 ± 0.008 8.9 ± 1.0 90 ± 18 + 30 wt % Al + 20 wt % CNF 0.065 ± 0.004 6.6 ± 2.2 149 ± 66 + 30 wt % Al + 30 wt % CNF * * * + 30 wt % Al + 20 wt % EG 0.106 ± 0.011 8.3 ± 0.8 95 ± 30 + 30 wt % Al + 30 wt % EG 0.179 ± 0.035 11.7 ± 0.5 61 ± 10
28
Page 29
Table 3: TC of Elvax™ 260/nanofiller samples:
Sample Thermal Conductivity
(perpendicular), W/mK
Thermal Conductivity
(parallel), W/mK
Thermal Conductivity
(tubes), W/mK
Neat Elvax 260™ 0.311 0.324 0.26 + 20 wt % MWCNT 0.356 2.318 2.93 + 20 wt % mod MWCNT (electrostatic attachment); covalent attachment
0.573
--
3.395
--
3.36
1.49 + 30 wt % MWCNT 0.469 2.942 4.40 + 20 wt % CNF 0.409 1.949 3.02 + 30 wt % CNF 0.486 2.872 3.51 + 20 wt % EG 0.399 3.000 3.80 + 20 wt % mod EG (covalent) -- -- 2.27 + 30 wt % EG 0.509 4.359 4.04 + 30 wt % mod EG (covalent) -- -- 3.38 + 40 wt % EG 0.544 5.554 5.49 + 40 wt % mod EG (electrostatic) 0.444 4.562 5.54 + 20 wt % Ag-CNF 0.346 0.488 -- + 30 wt % Ag-CNF -- 0.484 -- + 20 wt % Cu-CNF -- 0.447 -- + 30 wt % Cu-CNF -- 0.540 -- + 20 wt % Ni-CNF -- 0.523 -- + 30 wt % Ni-CNF -- 0.660 -- + 20 wt % Ni-nanostrands -- 0.526 -- + 30 wt % Ni-nanostrands -- 0.550 -- + 20 wt % BN 0.311 0.866 -- + 30 wt % Al + 20 wt % MWCNT 0.725 3.299 3.45 + 30 wt % Al + 30 wt % MWCNT 1.025 3.853 4.82 + 30 wt% Al + 20 wt % mod MWCNT (electrostatic attachment)
0.691 2.551 2.75
+ 30 wt % Al + 20 wt % CNF 0.734 2.533 2.78 + 30 wt % Al + 30 wt % CNF 0.983 3.645 4.80 + 30 wt % Al + 20 wt % EG 0.857 3.337 2.73 + 30 wt % Al + 30 wt % EG -- -- 6.24
29
Page 30
Table 4: TC of Elvax™ 260/nanofiller LMM samples (unoriented):
Sample Thermal Conductivity, W/mK Neat Elvax™ 260 0.324 + 20 wt % MWCNT 0.555 + 20 wt % mod MWCNT (electrostatic) 0.655 + 30 wt % MWCNT 0.705 + 20 wt % CNF 0.634 + 30 wt % CNF 0.643 + 20 wt % EG 0.666 + 30 wt % EG 0.902 + 40 wt % EG 1.369 + 40 wt % mod EG (electrostatic) 1.030 + 50 wt % mod EG (covalent) 2.460
Table 5a: Radius of Curvature of Elvax™ 260/30 wt % Al/nanofiller tubing: Diameter, cm
20 wt % MWCNT
30 wt % MWCNT
20 wt % CNF
30 wt % CNF
20 wt % EG
30 wt % EG
20 wt % mod MWCNT
4.18 √ √ √ √ √ √ √ 3.77 √ √ √ √ √ √ √ 3.58 √ √ √ √ √ √ √ 3.27 √ √ √ √ √ √ √ 3.21 √ √ √ √ √ √ √ 2.98 √ √ √ √ √ √ √ 2.85 √ √ √ √ √ √ √ 2.56 √ √ √ √ √ √ √ 2.42 √ √ √ √ √ x √ √ - no kinking ; x – kinking
30
Page 31
Table 5b: Radius of Curvature of Elvax™ 260/nanofiller tubing: Diameter, cm
20 wt % MWCNT
30 wt % MWCNT
20 wt% CNF
30 wt% CNF
40 wt% CNF
20 wt% EG
30 wt% EG
40 wt% EG
40 wt% mod EG
20 wt% mod MWCNT
4.18 √ √ √ √ x √ √ x √ √ 3.77 √ √ √ √ x √ √ x √ √ 3.58 √ √ √ √ x √ √ x √ √ 3.27 √ √ √ √ x √ √ x √ √ 3.21 √ √ √ √ x √ x x √ √ 2.98 √ x √ √ x x x x x √ 2.85 √ x √ √ x x x x x √ 2.56 x x √ √ x x x x x √ 2.42 x x √ √ x x x x x √
√ - no kinking ; x – kinking
31
Page 32
7. REFERENCES
1. Lozano K, Yang S and Zeng Q, J. Appl. Poly. Sci. 2004; 93(1): 155-162.
2. Kuriger RJ, Alam MK, Anderson DP and Jacobsen RL, Composites, Part A 2002; 33: 53-62.
3. Lozano K, Bonilla-Rios J and Barrera EV, J. Appl. Poly. Sci. 2001; 79(1): 125-133.
4. Carneiro OS, Covas JA, Bernardo CA, Caldeira G, Van Hattum FWJ, Ting JM, Alig RL and
Lake ML; Composites Sci. Tech. 1998; 58: 401-07.
5. Pogue RT, Ye J, Klosterman DA, Glass AS and Chartoff RP, Composites: Part A 1998, 29:
1273-81.
6. Cooper CA, Ravich D, Lips D, Mayer J and Wagner HD, Composites Sci. Tech. 2002; 62:
1105-12.
7. Gao X, Liu L, Guo Q, Shi J and Zhai G, Materials Letters 2005; 59: 3062-65.
8. Lau KT and Hui D, Composites Part B: Engineering 2002; 33: 263-77.
9. Liu CH, Huang H, Wu Y and Fan SS, Appl. Phys. Lett. 2004; 84(21): 4248-50.
10. Kim P, Shi L, Majumdar A and McEuen PL, Phys. Rev. Lett. 2001; 87(21): 215502-1-4.
11. Drzal LT and Fukushima H, Unites States Patent Application Publication, Pub No.
US20040127621 (2004).
12. Shen JW, Huang WY, Zuo SW and Hou J, J. Appl. Polym. Sci. 2005; 97(1): 51-59.
13. Zheng W, Lu X and Wong SC, J. Appl. Polym. Sci. 2004; 91(5): 2781-88.
14. Zheng G, Wu J, Wang W and Pan C, Carbon 2004; 42: 2839-47.
15. Zheng W, Wong SC and Sue HJ, Polymer 2002; 43: 6767-73.
16. Song LN, Xiao M, Li XH and Meng YZ, Mater. Chem. Phys. 2005, 93, 122-28.
17. Cho D, Lee S, Yang G, Fukushima H and Drzal LT, Macromol. Mater. Eng. 2005; 290(3):
179-87.
32
Page 33
18. http://materialsri.com/
19. Gibson, T., Rice, B., Ragland, W., Silverman, E.M., Peng, H., Strong, K.L. and Moon, D.,
SAMPE Technical Conference Proceedings, Long Beach, CA, May 1–5, 2005.
20. Burghardt J, Hansen N, Hansen L, Hansen G, SAMPE Technical Conference Proceedings,
Long Beach, CA, April 30 - May 4, 2006
21. Hansen G, Proceedings of SAMPE 2006, Long Beach, CA, April 30 - May 4, 2006
22. Dong, H., Fan, L. and Wong, C.P. Proceedings of 2005 Electronic Components and
Technology Conference.
23. Ruh1, R., Donaldson, K.Y. and Hasselman, D.P.H., J. Am. Cer. Soc. 1992; 75(10): 2887-90.
24. Duclaux, L., Nysten, B., Issi, J-P., and Moore, A. W., Physical Review B 1992; 46: 3362-7.
25. Park C, Ounaies Z, Watson KA, Crooks RE, Smith Jr. JG, Lowther SE, Connell JW, Siochi
EJ, Harrison JS and St. Clair TL, Chem. Phys. Lett. 2002; 364: 303-08.
26. Smith Jr. JG, Connell JW, Delozier DM, Lillehei PT, Watson KA, Lin Y, Zhou B and Sun
YP, Polymer 2004, 45: 825-836.
27. Haggenmueller R, Gommans HH, Rinzler AG, Fischer JE and Winey KI, Chem. Phys. Lett.
2000; 330: 219-25.
28. Andrews R, Jacques D, Minot M and Rantell T, Macromol. Mater. Eng. 2002; 287(6): 395-
403.
29. Banerjee S, Hemraj-Benny T and Wong SS, Adv. Mater. 2005; 17(1): 17-29.
30. Hwang YJ, Ahn YC, Shin HS, Lee CG, Kim GT, Park HS and Lee JK, Current Appl. Phys.
2006; 6(6): 1068-71.
33
Page 34
31. Choi SUS, Zhang ZG, Yu W, Lockwood FE and Grulke EA, Appl. Phys. Lett. 2001; 79(14):
2252-54.
32. Osman MA and Srivastava D, Nanotechnology 2001; 12: 21-24.
33. Gong Q, Li Z, Bai X, Li D, Zhao Y and Liang J, Mater. Sci. Eng. A 2004; 384: 209-14.
34. Ghose S, Watson KA, Working DC, Criss JM, Siochi EJ and Connell JW, High Performance
Polymers 2006, 18 (4), 527-544.
35. Ghose S, Watson KA, Sun KJ, Criss JM, Siochi EJ and Connell JW, Composite Science and
Technology 2006, 66, 1995-2002.
36. Shenogin S, Xue L, Ozisik R and Keblinski P, J. Appl. Phys. 2004; 95(12): 8136-44.
37. Shenogin S, Bodapati A, Xue L, Ozisik R and Keblinski P, Appl. Phys. Lett. 2004; 85(12):
2229-31.
38. Clancy TC and Gates TS, Polymer 2006; 47: 5990–5996. 39. Ghose S, Watson KA, Delozier DM, Working DC, Connell JW, Smith Jr JG, Sun YP and Lin
Y, High Performance Polymers 2006; 18 (6): 961-977.
40. Crist, B., Annu. Rev. Mater. Sci. 1995, 25: 295-323.
41. Jadhav A, Woldesenbet E, Pang S, Composites: Part B 2003; 34: 339–346.
42. Huang H, Liu C, Wu Y and Fan S, Adv. Mater. (Communications) 2005; 17: 1652-56.
43. Huxtable ST, Cahill DG, Shenogin S, Xue L, Ozisik R, Barone P, Usrey M, Strano MS,
Siddons G, Shim M and Keblinski P, Nat. Mater. 2003; 2(11): 731-34.
44. Chen YM and Ting JM, Carbon 2002; 40: 359-62.
45. Ye CM, Shentu BQ, Weng ZX, Cover Image, J. Appl. Poly. Sc., 2006; 101(6): 3806-3810
34
Page 35
46. Weaver G, and Bue G; “Analysis Report for the Lightweight Liquid Cooling and Ventilation
Garment Study”, LMSEAT 34171, Contract NAS 9-19100, June 2003.
35