36
Lake Mixing: Density D ensity ofW ater Tem perature ( o C) 0 5 10 15 20 25 30 D ensity (g/cm 3 ) 0.995 0.996 0.997 0.998 0.999 1.000 1.001 Maximum
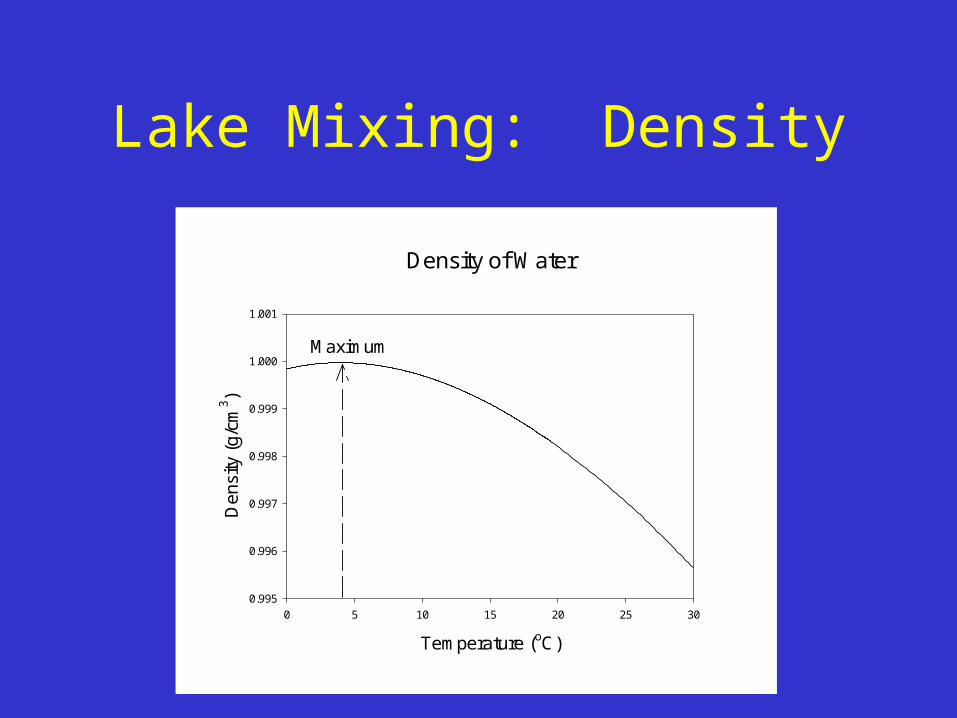
Lake Mixing: Density
Density of Water
Temperature (oC)
0 5 10 15 20 25 30
Den
sity
(g/c
m3 )
0.995
0.996
0.997
0.998
0.999
1.000
1.001
Maximum
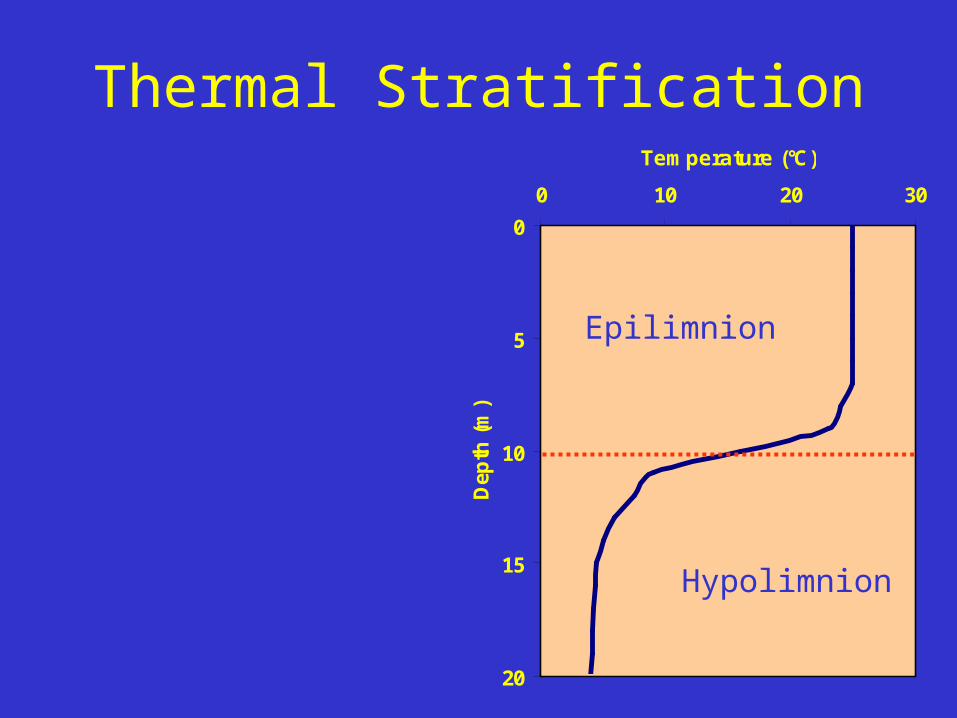
Thermal Stratification
0
5
10
15
20
0 10 20 30
Temperature (°C)
Dept
h (m
)
Epilimnion
Hypolimnion

Seasonal Stratification

Thin ice?
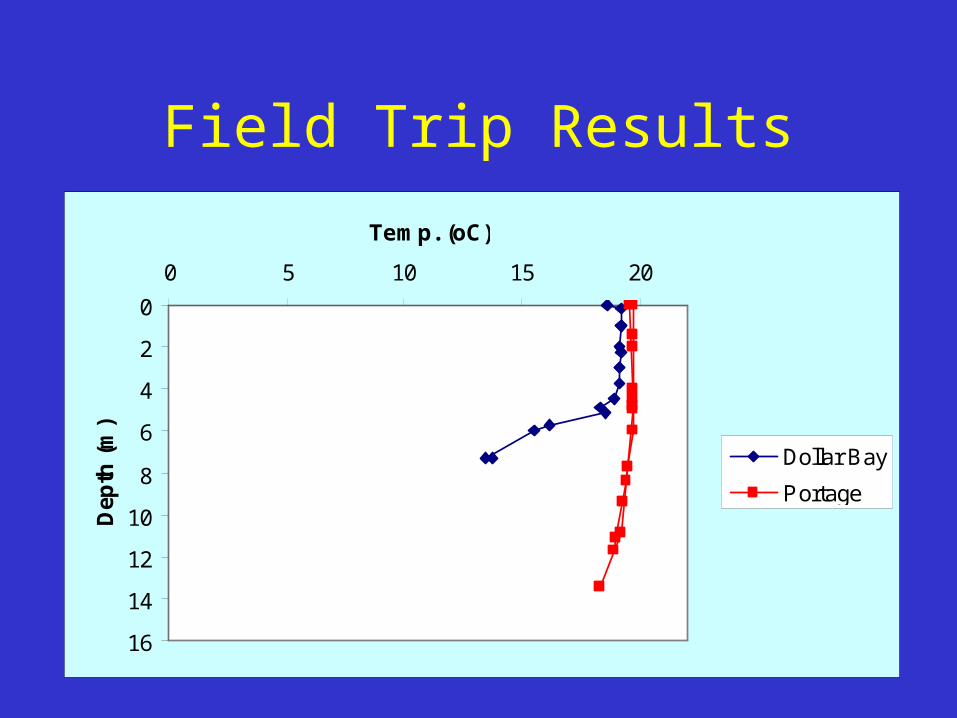
Field Trip Results
0
2
4
6
8
10
12
14
16
0 5 10 15 20
Temp. (oC)
Dept
h (m
)
Dollar Bay
Portage

Chemistry-Physics-Biology Linkage
0
2
4
6
8
10
12
14
16
0 2 4 6 8
Dissolved Oxygen (mg/L)
Dept
h (m
)
Dollar Bay
Portage

Significance of Stratification
Unstratified,Single CSTR (CMFR) Stratified
2 CSTRs withfeedback

Upwelling

Nutrient LimitationNutrient LimitationThe growth of algae and higher aquatic plants in lakes is regulated by conditions of light and temperature and the availability of those inorganic nutrients required to support growth. The element most often in limiting supply is phosphorus, P.
CCC
O OOO
P PP PP P
C CC C
CC
C C CO O O OO O O OO O O O
CCC
O OOO
P P+
OO
O
OC
CC
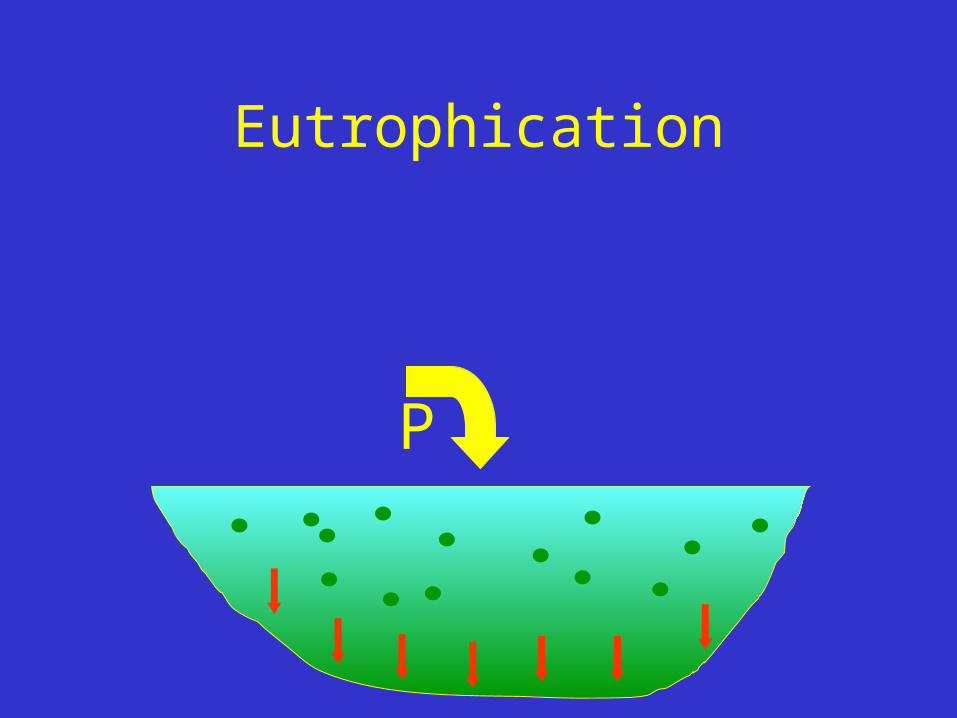
Eutrophication
P

Effects of Eutrophication
Oligotrophic1. Low biomass2. High diversity3. Complex food web4. Oxic waters5. Cold-water fish present6. High aesthetic quality7. No taste or odor problems
Eutrophic1. High biomass2. Low diversity3. Simple food chain4. Anoxic bottom waters5. Cold-water fish absent6. Low aesthetic quality7. Taste and odor problems8. Rough fish abundant9. Toxic algae present
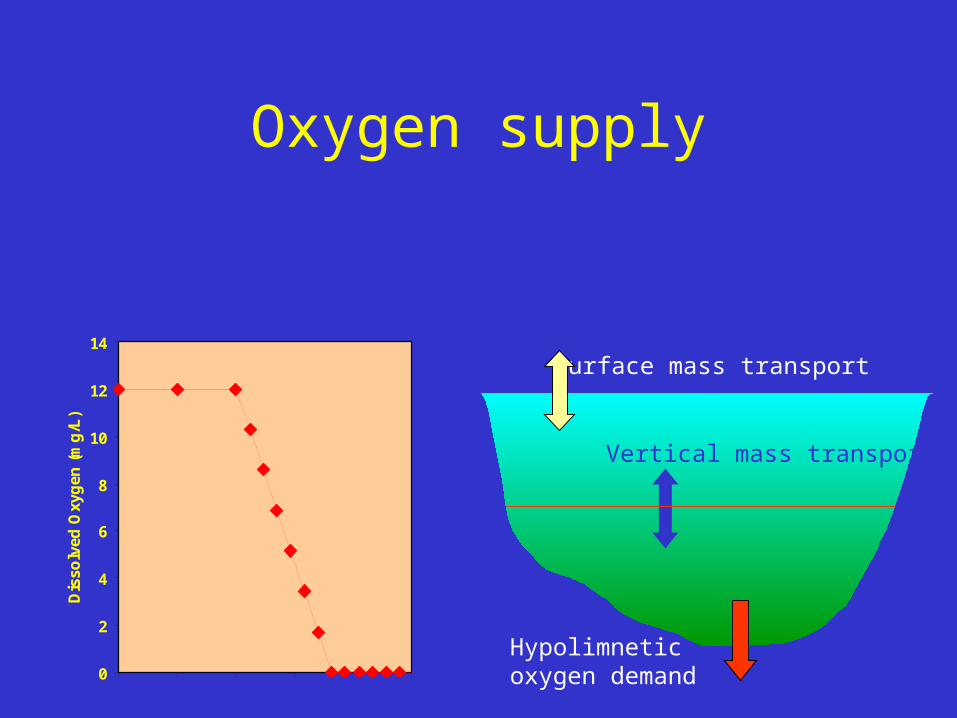
Oxygen supply
Surface mass transport
Vertical mass transport
Hypolimneticoxygen demand0
2
4
6
8
10
12
14
Diss
olve
d O
xyge
n (m
g/L)

Onondaga Lake: “most polluted lake in U.S.A.”

Biogeochemistry: study of the interactions of biology, geology,
chemistry, physics

Water Reservoirs
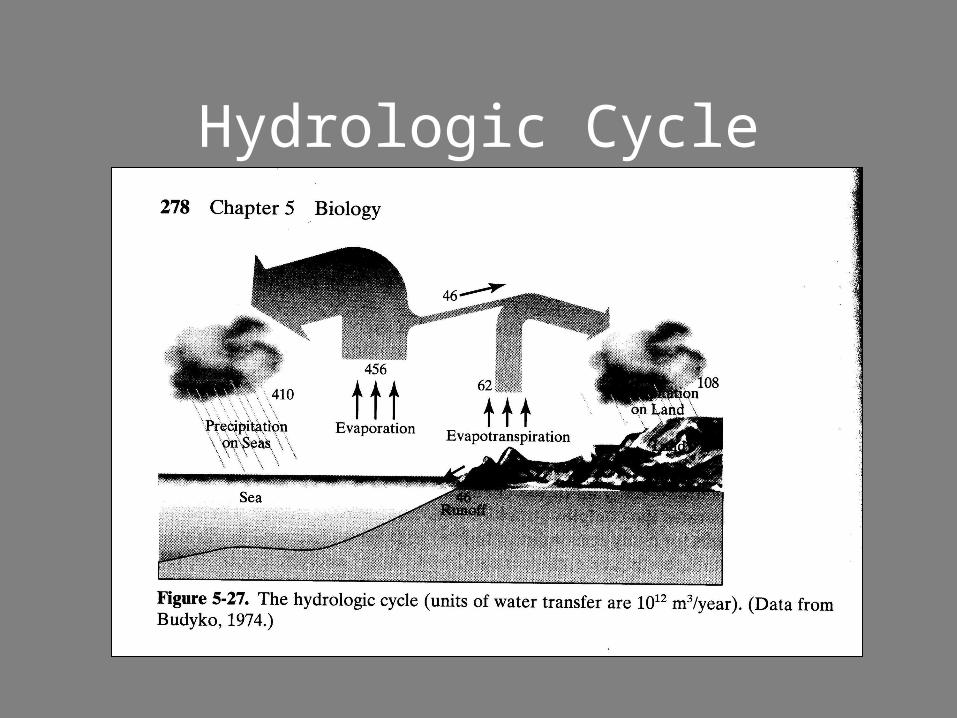
Hydrologic Cycle


Biogeochemical Cycles

Carbon Cycle

Another view of the carbon cycle
CO2 Organic C
CH4
Respiration
Photosynthesis
MethanogenesisMethaneoxidation

Nitrogen Cycle
N 2
NH 3/N H 4+ NO 3-
O rgan ic-N
DENITRIFICATIO NFIXATIO N
NITRIFICATIO N
DISSIM ILATO RYREDUCTIO N
ASSIM ILATIO NASSIM ILATIO N
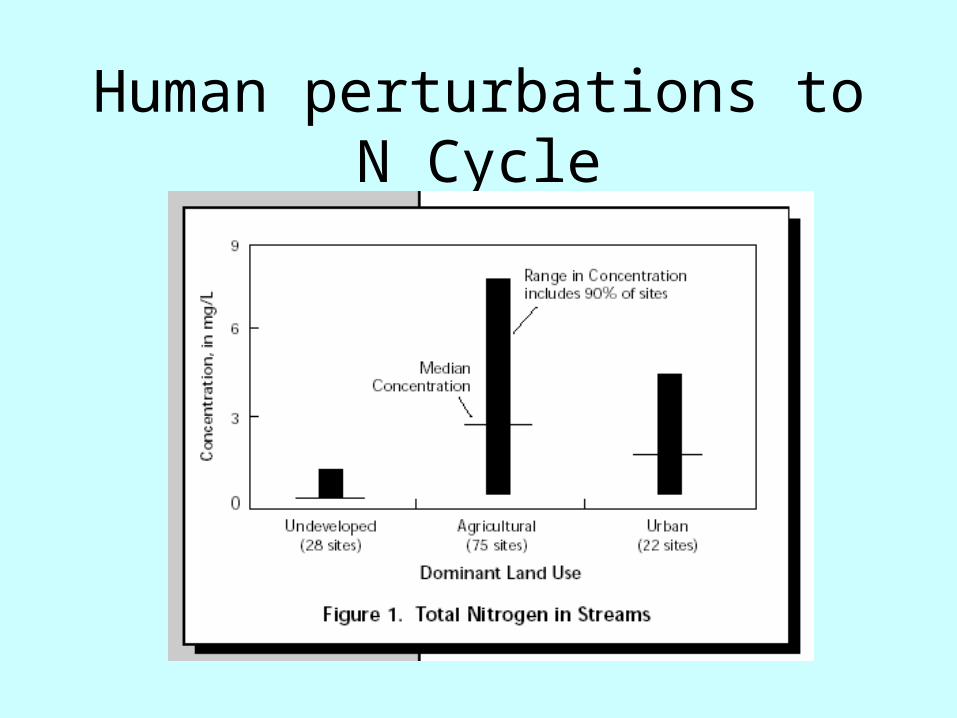
Human perturbations to N Cycle

L. Superior
Mississippi R.

N2O Emissions:310 x greenhouse effect of CO2
U.S. Emissions increased 1.1% in 1990s30% of anthropogenic emissions occur in “coastal” areasNo reliable estimates of emissions from Great Lakes

93.5 92.5 91.5 90.5 89.5
Longitude (deg.)
28.5
29.0
29.5
30.0
Latit
ude
(deg
.)
July 23-28, 1999, Shelfwide Oxygen Survey
Bottom Dissolved Oxygen Less than 2.0 mg/L
Atchafalaya R.Mississippi R.
(Rabalais, Turner & Wiseman)
50 km
TerrebonneBay
Sabine L.L. Calcasieu
Gulf of Mexico Hypoxic Zone
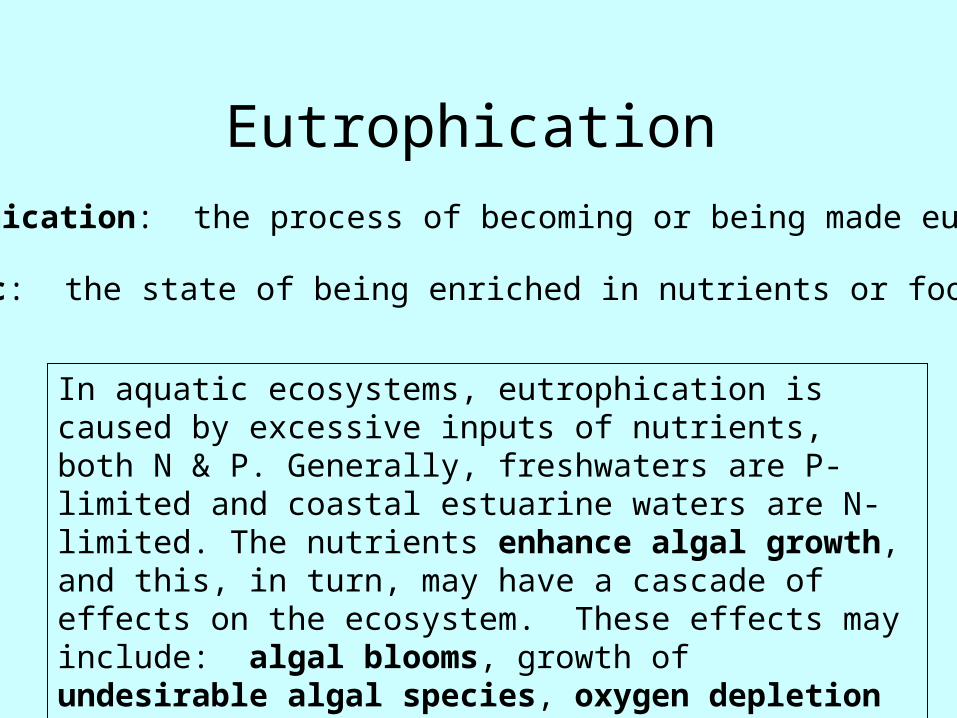
EutrophicationEutrophication: the process of becoming or being made eutrophic
Eutrophic: the state of being enriched in nutrients or food sources
In aquatic ecosystems, eutrophication is caused by excessive inputs of nutrients, both N & P. Generally, freshwaters are P-limited and coastal estuarine waters are N-limited. The nutrients enhance algal growth, and this, in turn, may have a cascade of effects on the ecosystem. These effects may include: algal blooms, growth of undesirable algal species, oxygen depletion or anoxia in bottom waters, loss of cold-water fish species, abundance of “rough fish”, fish kills, unpleasant tastes and odors.

Sources of nutrients
• Point sources– Sewage treatment plant discharges– Storm sewer discharges– Industrial discharges
• Non-point sources– Atmospheric deposition– Agricultural runoff (fertilizer, soil erosion)– Septic systems

Solution: Reduce nutrient inputs
• Agriculture– Reduce animal density, restrict timing of manure spreading,
buffer strips by streams, reduced tillage, underground fertilizer application, wetland preservation and construction
• Watershed management– Buffer zones, wetland filters
• Storm runoff– Eliminate combined sewer systems (CSO’s)– Stormwater treatment required (holding ponds, alum)– Education on yard fertilization
• Erosion from construction, forestry– Erosion barriers, soil cover, road and bridge stabilization
• Septic systems– Distance from lake, adequate drainfields
Mitigation strategies
Often there is pressure for quick actions that will reduce the severity of the symptoms. Numerous options exist. To understand these options and choose among them, one should understand the nutrient cycle within the aquatic system (lake).
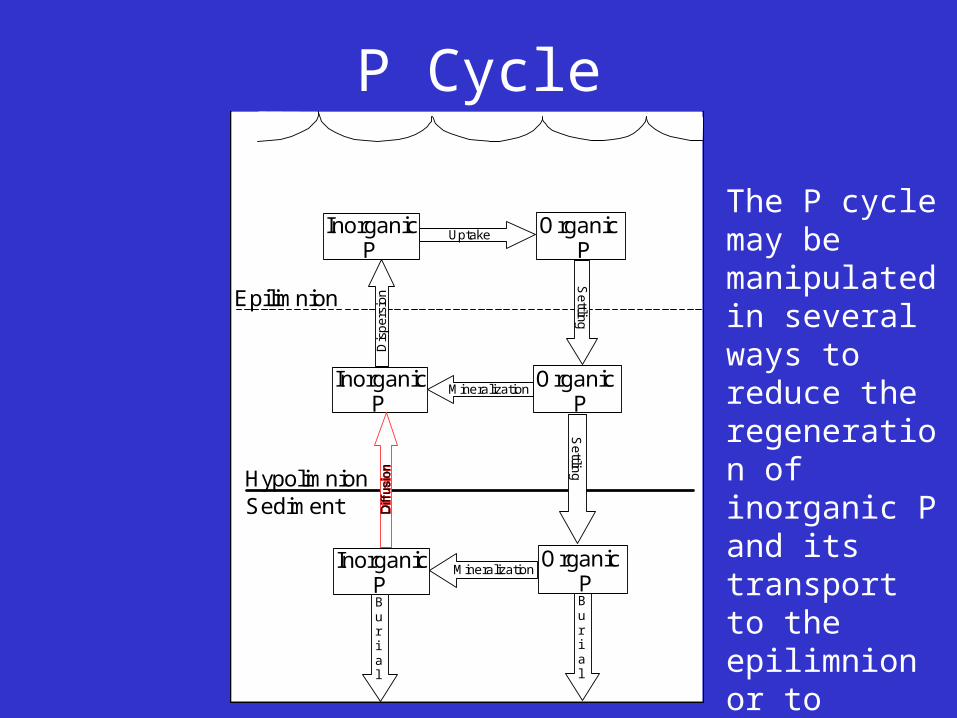
P Cycle
InorganicP
OrganicP
SedimentHypolimnion
Epilimnion
InorganicP
InorganicP
OrganicP
OrganicP
Burial
Settling
Settling
Dis
pers
ion
Uptake
Mineralization
Mineralization
Burial
The P cycle may be manipulated in several ways to reduce the regeneration of inorganic P and its transport to the epilimnion or to reduce the algal uptake of P.
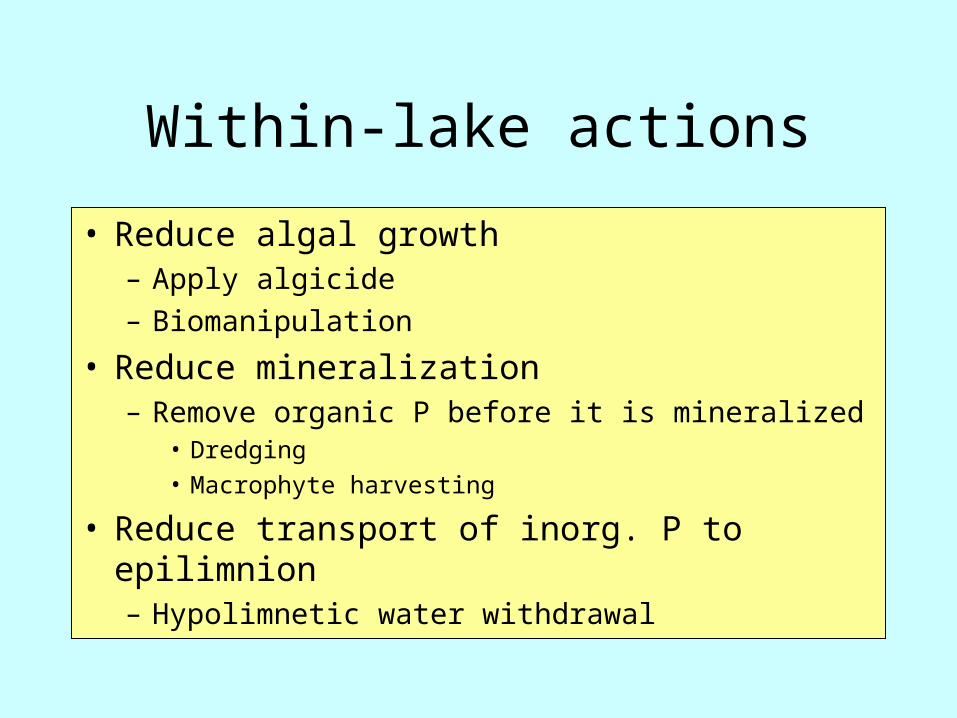
Within-lake actions
• Reduce algal growth– Apply algicide– Biomanipulation
• Reduce mineralization– Remove organic P before it is mineralized
• Dredging• Macrophyte harvesting
• Reduce transport of inorg. P to epilimnion– Hypolimnetic water withdrawal

Macrophyte harvesting

Lake Phosphorus CycleLoading, W
O utflowQCl
SettlingBuria l
V dCdt
W QC v CAs
V dCdt
m m rxnin out

Vollenweider Model
Steady State Solution:
C WQ v A
C WQ v A
AA
WA
QA
v
Jq v
s
ss
s
log( ) log log( )J C q vs
0.1
1
10
100
1 10 100 1000
Hydraulic Loading rate, q, (m3/m2-yr)
P lo
adin
g ra
te, J
, (g
P/m
2 yr)

Terms to know:EpilimnionHypolimnionThermoclineMetalimnionOligotrophicEutrophicMesotrophic
Oxygen sag curveCritical pointOxygen deficitSaturationReaerationDeoxygenation
DenitrificationNitrificationAcid rainMineralizationLimiting nutrientLiebig’s LawSulfate reductionNitrogen fixationHydrologic cycleEvapotranspirationBiogeochemical cycleMicronutrientMacronutrient

Review of previous terms:BioticAbioticAtmosphereHydrosphereLithosphereBiosphereEcosphereEcologySpeciesPopulationCommunity
Organism groups:virusesbacteriaalgaefungiprotozoarotifersmicrocrustaceansmacrophytesmacroinvertebratesfish
PhotosynthesisChlorophyllRespirationRedoxReductionOxidationElectron donorElectron acceptorAerobesObligate vs. facultativeAnaerobic respirationAerobic respirationanoxic
AnaerobicFermentationAutotrophHeterotrophBiomassProductivityPrimary productionSecondary productionLithotrophsPhotoautotrophsPhotoheterotrophsChemoheterotrophsChemoautotrophsProducers Consumers
Herbivores CarnivoresOmnivores Trophic levelFood chain Food webMicrobial loop Decomposers


