Ji Won Suk , Karen Kirk , Yufeng Hao , Neal A. Hall , * and Rodney S. Ruoff *
Thermoacoustic Sound Generation from Monolayer Graphene for Transparent and Flexible Sound Sources
ATIO
N
When alternating current is applied to a conductor, it periodi-cally heats the conductor, resulting in a temperature oscilla-tion. The temperature oscillation of the conductor produces a density oscillation in air, which causes a pressure oscilla-tion (i.e., sound waves); this is called the “thermoacoustic effect”. Contrary to conventional speakers, thermoacoustic loudspeakers emit sound without any mechanically moving parts. Although the conversion of Joule heating into sound was proposed nearly a hundred years ago, the development of effi cient thermoacoustic devices has been hindered by lim-ited material choices and fabrication methods. Effi cient ther-moacoustic sound generation can be achieved by meeting two conditions: 1) a conductor needs to have low heat capacity per unit area (HCPUA); and 2) heat should conduct effi ciently to the surrounding fl uid. The fi rst condition can be satisfi ed by using very thin conductors. The latter can be obtained by ensuring that the heat conduction to air dominates and heat loss to the substrate, which supports the conductor, is minimized.
The development of nanomaterials and nanofabrication techniques has renewed interest in thermoacoustic sound gen-eration. Thin metal fi lms [ 1 ] and wires [ 2 ] suspended on porous substrates have demonstrated ultrasonic sound emission. Free-standing carbon-nanotube (CNT) thin fi lms have also been demonstrated as fl exible, stretchable, and transparent loud-speakers that can be used in both air [ 3 ] and water. [ 4 ] Compared with other nanomaterials, graphene, one-atom-thick two-dimen-sional sp 2 -bonded carbon, offers an extremely low HCPUA; the HCPUA ( C s = d ρ C p , where d is the thickness, ρ is the density, and C p is the specifi c heat) of monolayer graphene is ≈ 5.8 × 10 − 4 J m − 2 K − 1 ( d = 0.335 nm, ρ ≈ 2200 kg m − 3 , C p ≈ 790 kJ kg − 1 K − 1 ), [ 5 ] which is one order of magnitude lower than that of a one-layer CNT thin-fi lm speaker ( C s = 7.7 × 10 − 3 J m − 2 K − 1 ). [ 3 ] More-over, the superior thermal conductivity of graphene [ 6–8 ] makes it advantageous in thermal applications because it quickly delivers
Dr. J. W. Suk, Dr. Y. Hao, Prof. R. S. RuoffDepartment of Mechanical Engineering and the Materials Science and Engineering ProgramThe University of Texas at AustinOne University Station C2200Austin, TX 78712, USA E-mail: [email protected] K. Kirk, Prof. N. A. HallDepartment of Electrical and Computer EngineeringThe University of Texas at AustinOne University Station C2200Austin, TX, 78712, USAE-mail: [email protected]
DOI: 10.1002/adma.201201782
Adv. Mater. 2012, DOI: 10.1002/adma.201201782
heat to the environment, resulting in faster heating and a more uniform temperature distribution. In this respect, Tian et al. demonstrated sound generation from 20–100 nm thick multi-layer graphene fi lms on paper, [ 9 ] as well as monolayer graphene on porous anodic aluminum oxide. [ 10 ] In addition to its low HCPUA, monolayer graphene is extremely transparent and mechanically robust; the transmittance of monolayer graphene is ≈ 97.7% with white light [ 11 ] and single-crystal graphene can sustain more than 20% of strain prior to its fracture. [ 12 ] These features have further motivated the development of transparent, fl exible, and stretchable graphene-based applications. [ 13–16 ]
In this work, thermoacoustic sound generation from large-area monolayer graphene is demonstrated on various trans-parent substrates: glass, polyethylene terephthalate (PET), and polydimethylsiloxane (PDMS). The acoustic performances are analyzed by the effect of the supporting substrate. Particularly, transparent and fl exible large-area monolayer graphene loud-speakers are realized by the transfer of monolayer graphene on PET, and the acoustic performance is characterized with cylin-drically deformed confi gurations. Moreover, in order to better understand the graphene-based sound sources, the substrate effect on sound performance is further investigated by trans-ferring graphene onto patterned substrates having different surface porosities. Two or three monolayer graphene fi lms are stacked to improve the mechanical robustness and the quality of the transfer onto patterned substrates made of silicon or PDMS. The acoustic measurements from the 2-layer or 3-layer graphene on patterned substrates show that the substrate with the highest porosity generates the highest sound pressure due to its lower thermal effusivity, which reduces heat loss to the supporting substrate.
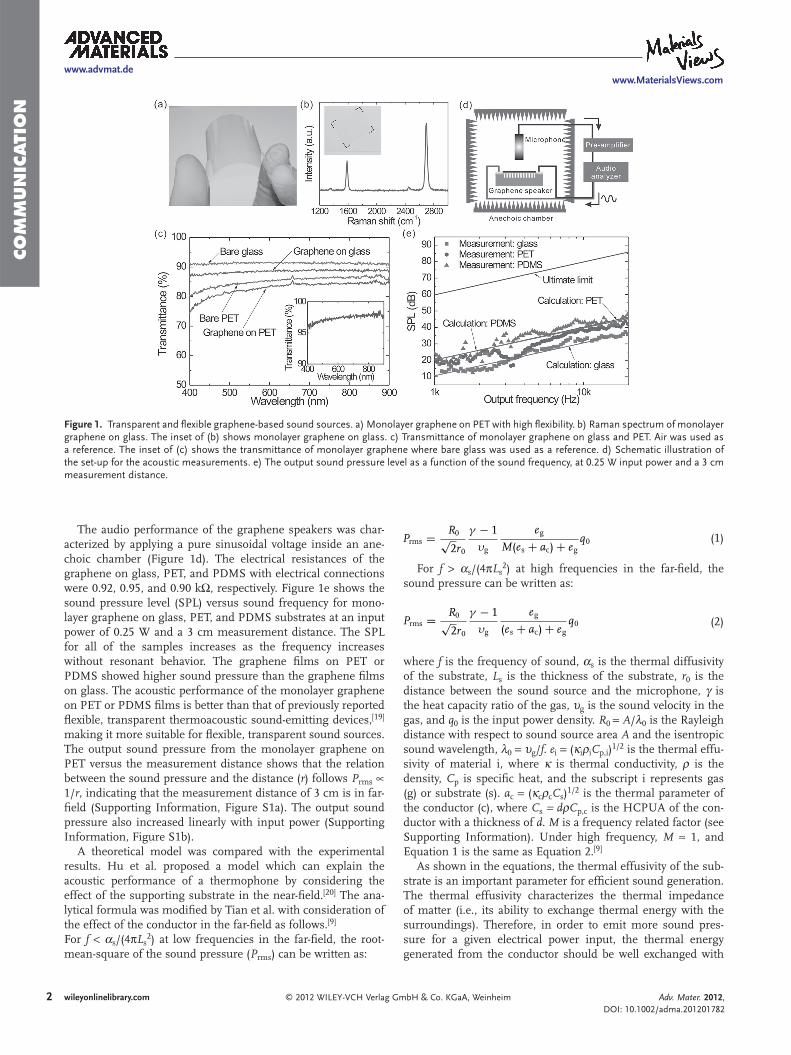
Monolayer graphene grown by chemical vapor deposi-tion (CVD) on copper foils [ 17 ] with an area of ≈ 1.5 × 1.5 cm 2 were transferred onto transparent substrates (glass, PET, and PDMS) using a wet transfer technique. [ 18 ] Figure 1 a shows the graphene transferred onto PET. The Raman spectrum of graphene on glass shows the typical characteristic peaks of monolayer graphene (Figure 1 b) with G (1585 cm − 1 ) and 2D (2695 cm − 1 ) peaks. A minimal D peak at 1350 cm − 1 indicates that the transferred graphene was of high quality with minimal structural defects. Because of the superior transparency of monolayer graphene, graphene on glass ( ≈ 1 mm thickness) and PET ( ≈ 50 μ m thickness, Mylar) showed excellent transmittance over a wide range of wavelengths, as shown in Figure 1 c. At a wavelength of 550 nm, graphene on glass and PET showed transmittances of 88.4% and 82.4%, respectively, when air was used as a reference. When bare glass was used as a reference, the transmittance of the transferred graphene at a wavelength of 550 nm was 97.3%, further confi rming that the graphene fi lm was monolayer. [ 11 , 14 ]
Figure 1 . Transparent and fl exible graphene-based sound sources. a) Monolayer graphene on PET with high fl exibility. b) Raman spectrum of monolayer graphene on glass. The inset of (b) shows monolayer graphene on glass. c) Transmittance of monolayer graphene on glass and PET. Air was used as a reference. The inset of (c) shows the transmittance of monolayer graphene where bare glass was used as a reference. d) Schematic illustration of the set-up for the acoustic measurements. e) The output sound pressure level as a function of the sound frequency, at 0.25 W input power and a 3 cm measurement distance.
The audio performance of the graphene speakers was char-acterized by applying a pure sinusoidal voltage inside an ane-choic chamber (Figure 1 d). The electrical resistances of the graphene on glass, PET, and PDMS with electrical connections were 0.92, 0.95, and 0.90 k Ω , respectively. Figure 1 e shows the sound pressure level (SPL) versus sound frequency for mono-layer graphene on glass, PET, and PDMS substrates at an input power of 0.25 W and a 3 cm measurement distance. The SPL for all of the samples increases as the frequency increases without resonant behavior. The graphene fi lms on PET or PDMS showed higher sound pressure than the graphene fi lms on glass. The acoustic performance of the monolayer graphene on PET or PDMS fi lms is better than that of previously reported fl exible, transparent thermoacoustic sound-emitting devices, [ 19 ] making it more suitable for fl exible, transparent sound sources. The output sound pressure from the monolayer graphene on PET versus the measurement distance shows that the relation between the sound pressure and the distance ( r ) follows P rms ∝ 1/ r , indicating that the measurement distance of 3 cm is in far-fi eld (Supporting Information, Figure S1a). The output sound pressure also increased linearly with input power (Supporting Information, Figure S1b).
A theoretical model was compared with the experimental results. Hu et al. proposed a model which can explain the acoustic performance of a thermophone by considering the effect of the supporting substrate in the near-fi eld. [ 20 ] The ana-lytical formula was modifi ed by Tian et al. with consideration of the effect of the conductor in the far-fi eld as follows. [ 9 ] For f < α s /(4 π L s 2 ) at low frequencies in the far-fi eld, the root-mean-square of the sound pressure ( P rms ) can be written as:
For f > α s /(4 π L s 2 ) at high frequencies in the far-fi eld, the sound pressure can be written as:
Prms = R0√
2r0
γ − 1
υg
eg
(es + ac) + egq0
(2)
where f is the frequency of sound, α s is the thermal diffusivity of the substrate, L s is the thickness of the substrate, r 0 is the distance between the sound source and the microphone, γ is the heat capacity ratio of the gas, υ g is the sound velocity in the gas, and q 0 is the input power density. R 0 = A / λ 0 is the Rayleigh distance with respect to sound source area A and the isentropic sound wavelength, λ 0 = υ g / f . e i = ( κ i ρ i C p,i ) 1/2 is the thermal effu-sivity of material i, where κ is thermal conductivity, ρ is the density, C p is specifi c heat, and the subscript i represents gas (g) or substrate (s). a c = ( κ c ρ c C s ) 1/2 is the thermal parameter of the conductor (c), where C s = d ρ C p,c is the HCPUA of the con-ductor with a thickness of d . M is a frequency related factor (see Supporting Information). Under high frequency, M ≈ 1, and Equation 1 is the same as Equation 2 . [ 9 ]
As shown in the equations, the thermal effusivity of the sub-strate is an important parameter for effi cient sound generation. The thermal effusivity characterizes the thermal impedance of matter (i.e., its ability to exchange thermal energy with the surroundings). Therefore, in order to emit more sound pres-sure for a given electrical power input, the thermal energy generated from the conductor should be well exchanged with
the surrounding air, but not with the substrate. PET and PDMS have a lower thermal effusivity than glass (Supporting Infor-mation, Table S1). Therefore, at a fi xed input power, graphene fi lms on PET or PDMS would be expected to generate a higher sound pressure than graphene fi lms on glass, as confi rmed in Figure 1 e. Calculations predict that the SPL of the PET and PDMS samples would be similar to each other, while acoustic tests revealed higher SPLs for PDMS. This might be due to an air gap between the PDMS and poly(methyl methacrylate) (PMMA) (used as an adhesion layer between the graphene and the PDMS). The theoretical upper limit of SPL is also shown for comparison. The upper limit of thermoacoustics in a half-space can be expressed as: [ 21 ]
Prms,max = Q f√
2r0Cp,gT0 (3)
where Q is the input power and T 0 is ambient temperature. In this case, the substrate is thermally insulating. The purple solid line in Figure 1 e shows the calculated theoretical limit of the SPL. Therefore, the acoustic performance of graphene speakers has more room to be improved beyond this demonstration. A primary challenge is minimizing the heat loss to the substrate (ideally, by suspending the graphene fi lms in air or using a thermally insulating medium).
Unlike glass, PET and PDMS have a superior fl exibility. Moreover, PDMS is an elastomeric (rubbery), stretchable material. Therefore, graphene on PET or PDMS has the
Figure 2 . Acoustic performance of cylindrically deformed graphene/PET fi(b) confi gurations as a function of the radius of curvature at 0.25 W input plevels of the concave fi lm as a function of the measurement distance with r
Adv. Mater. 2012, DOI: 10.1002/adma.201201782
potential for transparent, fl exible, and stretchable loudspeakers. A transparent, fl exible loudspeaker was demonstrated with monolayer graphene on PET ( ≈ 2.5 × 2.5 cm 2 ) while bending the fi lm. Figure 2 a,b show the SPL versus the sound frequency of cylindrically deformed fi lms, with various radii, at a fi xed meas-urement distance (3 cm). For the convex confi guration, the overall SPL of the fi lm was slightly decreased with increased curvature (Figure 2 a). The minimal decrease of the SPL while bending the fi lm might be because most of the sound intensity of the thermoacoustic radiation by graphene is focused on the on-axis with ± 30 ° . [ 9 ] For the concave confi guration with a fi xed measurement distance, the SPL at low frequency ( < ≈ 7 kHz) increased with increased curvature, while the SPL at high fre-quency was fl attened in this measurement range (Figure 2 b). This demonstrates the ability to fabricate fl exible loudspeakers having a high transmittance, as well as fl exible transducers, which may have signifi cance in applications such as focused sound fi elds. The acoustic performance of the concave fi lms was further characterized as a function of the measurement distance with two different radii of curvature (Figure 2 c,d). At lower frequency, the SPL decreased with increased measure-ment distance. However, the higher-frequency region showed different behaviors. The sharp drop and jump of the SPLs for both cases are positioned at different frequencies. This might be due to the superposition of radiated sound, but it is known that the effective focal region of a concave source is not located at the center of curvature and is highly dependent on frequency due to the phase. [ 22 ] Further study is needed for
3wileyonlinelibrary.combH & Co. KGaA, Weinheim
lms. a,b) The output sound pressure levels of convex (a) and concave ower and a 3 cm measurement distance. c,d) The output sound-pressure
adii of 4.4 cm (c) and 1.9 cm (d).
www.advmat.dewww.MaterialsViews.com
CO
MM
UN
ICATI
ON
better understanding of the complicated behaviors of the cylin-
drically deformed thermoacoustic speaker. On the basis of the above experiments, the sound pressure
generated from large-area monolayer graphene can be altered by choosing an appropriate substrate and different geometrical confi gurations. The effect of the underlying substrate on ther-moacoustic sound generation was further systematically inves-tigated using suspended graphene structures. 300 μ m thick sil-icon substrates of varying surface porosities, defi ned as the area fraction of the patterns to the entire surface area of the sub-strate, were compared. Figure 3 a shows a schematic illustration of the fabricated devices. 20 μ m deep holes with ≈ 2.3 μ m diam-eter were etched into the silicon substrates with different hole-to-hole spacing to obtain ≈ 11% and ≈ 45% surface porosities.
Figure 3 . Comparison of the acoustic performance of 2-layer graphene accsubstrate device. b,c) Top- and cross-sectional-view SEM images of a subsSiO 2 deposited on the patterned silicon substrate. d) SEM images of 2-layeroutput sound-pressure level as a function of sound frequency at 0.25 W inpat sound frequencies of 2.5, 5, and 18 kHz. g) Schematic illustration of a cin the patterned substrate and surrounding air. h,i) Cross-sectional tempeporosities at the same input power: ≈ 11% (h) and ≈ 45% (i). The plots weresurface is marked with a red box (the unit is K).
Figure 3 b,c show SEM images of the patterned substrates with ≈ 45% surface porosity. Graphene fi lms were transferred onto these patterned substrates using a dry transfer technique to avoid trapping of water inside the holes. [ 18 ] In order to enhance the robustness of the graphene fi lms during the dry transfer, 2-layer graphene fi lms were used by stacking two monolayer graphene fi lms (the detailed transfer method is described in the Supporting Information). Figure 3 d shows the 2-layer graphene transferred onto the patterned substrate ( ≈ 1 × 1 cm 2 ) with ≈ 45% surface porosity.
Figure 3 e shows the SPL of the 2-layer graphene on the pat-terned substrates as a function of sound frequency at an input power of 0.25 W. Overall, the substrate with the higher surface porosity generated a higher sound pressure. Interestingly,
mbH & Co. KGaA, Weinheim
ording to the surface porosities. a) Schematic illustration of the patterned trate with ≈ 45% surface porosity. The inset of (c) shows the 300 nm-thick graphene on the patterned substrate with a ≈ 45% surface porosity. e) The ut power and a 3 cm measurement distance. f) The output sound pressure ross-sectional view of a model for numerical analysis of the heat transfer rature distribution of the patterned substrates with two different surface taken along the dotted lines. The maximum temperature of the substrate
Adv. Mater. 2012, DOI: 10.1002/adma.201201782
www.advmat.dewww.MaterialsViews.com
CO
MM
UN
ICATIO
N
Figure 4 . The output sound pressure level of 3-layer graphene on pat-terned PDMS as a function of sound frequency at 0.25 W input power and a 3 cm measurement distance. The inset of the graph shows an optical profi ler image of the patterned PDMS with ≈ 80% porosity and an SEM image of 3-layer graphene with ≈ 100 nm-thick PMMA transferred on the patterned PDMS.
the substrate with ≈ 45% surface porosity showed prominent increases of the SPL around 3.1 kHz and 6.8 kHz. This might be attributable to the patterned holes modifying the generated sound pressure. Figure 3 f shows the sound pressure from three substrates at the sound frequencies of 2.5, 5, and 18 kHz. The sound pressure increased as the surface porosity increased. It was thereby found that the thermal properties of the substrates play an important role in thermoacoustic sound generation. With an increase in the surface porosity, the effective proper-ties, such as thermal conductivity, density, and specifi c heat of the substrates, are reduced due to the increased effect of air. Thus, it is expected that the substrate with higher porosity has a lower thermal effusivity, which induces a higher thermo-acoustic sound pressure, as confi rmed by our measurements.
Finite element analysis was used for evaluating the heat transfer in the patterned substrates and the surrounding air. For simplicity, only a 12.2 × 12.2 μ m 2 area section was mod-eled, containing circular cavities with 2.3 μ m diameter and 20 μ m depth (see more details in the Supporting Information). Figure 3 g shows a schematic illustration of the model for the heat transfer analysis. Figure 3 h,i show the calculated tempera-ture distribution of the substrates with ≈ 11% and ≈ 45% surface porosities, respectively, and identical input power to both. The maximum temperature of the surface is higher for the higher surface porosity, indicating that the heat loss to the substrate can be minimized by reducing the contact area of the graphene fi lms with the supporting substrate. Therefore, the sound pres-sure generated from the graphene fi lms can be enhanced by increasing the porosity of the underlying substrate. This dem-onstration of graphene fi lms on patterned silicon substrates also suggests the potential for integrating graphene speakers with micro-electromechanical systems (MEMS) acoustic devices such as microphones and ultrasound sensors.
Another supporting substrate, PDMS, was tested to com-pare the acoustic performance as a function of the surface porosity of the substrate. Three monolayer graphene fi lms were stacked with ≈ 100 nm thick PMMA fi lm for enhanced mechanical robustness and adhesion to PDMS. The PMMA/3-layer-graphene fi lm was transferred onto a patterned PDMS substrate having circular pillars with ≈ 2.3 μ m diameter and ≈ 1 μ m height. The patterned PDMS substrate was replicated from the prepatterned silicon substrate used in Figure 3 (the detailed procedure is described in the Supporting Informa-tion). Figure 4 shows the acoustic performance of the 3-layer graphene fi lms as a function of the surface porosities at 0.25 W input power and a 3 cm measurement distance. Compared with the silicon substrate shown in Figure 3 , the PDMS substrate more clearly generated a higher SPL as the surface porosity increased, indicating that a proper material combined with a designed surface morphology can minimize the heat loss to the underlying substrate.
In conclusion, monolayer graphene grown on copper by CVD was used to demonstrate thermoacoustic sound generation. Various transparent substrates with different thermal proper-ties were studied for their effects on sound generation. Sub-strates having a lower thermal effusivity showed better acoustic performance, as predicted by the theoretical study. Due to its transparency, atomic thickness, and mechanical robustness, monolayer graphene demonstrates the potential for transparent,
fl exible, and stretchable loudspeakers with intriguing features such as focused sound fi elds. Moreover, the effect of the under-lying substrates on the acoustic performance of graphene was further investigated by transferring it onto patterned substrates with different surface porosities. The substrate with highest sur-face porosity generated the highest sound pressure. This proves that the thermoacoustic sound generation from graphene can be enhanced by the choice of proper substrates, as well as the design of the morphology of the substrates.
Experimental Section Graphene Transferred on Transparent Substrates : The transfer
onto glass and PET was achieved by polymer-assisted wet transfer. PMMA solution (10 mg mL − 1 in chlorobenzene) was spin-coated on a graphene/copper foil at 4000 rpm for 30 s. The copper was etched in ammonium persulfate (0.5 M ) by fl oating the sample over the etchant surface. The PMMA/graphene was rinsed with distilled water and transferred onto the target substrates. After drying the sample, the PMMA was removed with acetone. For the transfer onto PDMS, the same wet transfer method did not result in a quality transfer; the monolayer graphene was cracked and discontinuous after the transfer. A thin PMMA layer ( ≈ 0.6 μ m thickness) was used as an adhesion layer to hold the monolayer graphene onto the PDMS (see Supporting Information). Raman spectroscopy (488 nm excitation laser with a 100 × objective lens, WITec Alpha 300 micro-Raman imaging system) was used to characterize the quality of the transferred graphene. The optical transmittance was measured using a spectroscopic ellipsometer system (JA Woolham M2000).
Acoustic Tests : For the acoustic measurements, electrical wires were connected onto the transferred graphene with silver paste. A microphone (Type 40AC, G.R.A.S Sound and Vibration) was placed in front of the sample. The frequency response was measured by an audio analyzer (dScope Series III, Prism Sound). A pure sinusoidal voltage at an input frequency sweeping from 500 Hz to 10 kHz was applied to the loudspeaker without any DC bias. Due to the nature of thermoacoustic sound generation, the output frequency doubled that of the input; thus, the audio analyzer was set to detect the signal at the doubled frequency.
5wileyonlinelibrary.combH & Co. KGaA, Weinheim
6
www.advmat.dewww.MaterialsViews.com
CO
MM
UN
ICATI
ON
Two-Layer Graphene onto Patterned Substrates : On fl at silicon
substrates (300 μ m thick), circular patterns were fabricated by UV photolithography and deep reactive-ion etching. A 300 nm-thick silicon dioxide fi lm was deposited by plasma-enhanced CVD onto the patterned substrates to electrically insulate silicon from graphene. Electrodes made of Cr(20 nm)/Au(100 nm) were then thermally deposited onto the substrates. Scanning electron microscopy (SEM) images were taken using an FEI Quanta-600 FEG Environmental SEM system. Conventional wet transfer techniques could not be used for these substrates because water would easily become trapped inside the holes. Therefore, a dry transfer technique using a PDMS block was used for transferring 2-layer graphene onto the patterned substrate (see Supporting Information). The heat transfer in the patterned substrates and the surrounding air was numerically analyzed using COMSOL Multiphysics (see Supporting Information).
Supporting Information Supporting Information is available from the Wiley Online Library or from the author.
Acknowledgements This work was supported by the NSF (#0969106; CMMI: Mechanical Characterization of Atomically Thin Membranes).
Received: May 2, 2012 Revised: July 25, 2012
Published online:
[ 1 ] H. Shinoda , T. Nakajima , K. Ueno , N. Koshida , Nature 1999 , 400 , 853 .
[ 2 ] A. O. Niskanen , J. Hassel , M. Tikander , P. Maijala , L. Gronberg , P. Helisto , Appl. Phys. Lett. 2009 , 95 , 163102 .
[ 3 ] L. Xiao , Z. Chen , C. Feng , L. Liu , Z. Q. Bai , Y. Wang , L. Qian , Y. Y. Zhang , Q. Q. Li , K. L. Jiang , S. S. Fan , Nano Lett. 2008 , 8 , 4539 .
[ 4 ] A. E. Aliev , M. D. Lima , S. L. Fang , R. H. Baughman , Nano Lett. 2010 , 10 , 2374 .
[ 5 ] N. Mounet , N. Marzari , Phys. Rev. B: Condens. Matter 2005 , 71 , 205214 .
[ 6 ] J. H. Seol , I. Jo , A. L. Moore , L. Lindsay , Z. H. Aitken , M. T. Pettes , X. S. Li , Z. Yao , R. Huang , D. Broido , N. Mingo , R. S. Ruoff , L. Shi , Science 2010 , 328 , 213 .
[ 7 ] A. A. Balandin , S. Ghosh , W. Z. Bao , I. Calizo , D. Teweldebrhan , F. Miao , C. N. Lau , Nano Lett. 2008 , 8 , 902 .
[ 8 ] W. W. Cai , A. L. Moore , Y. W. Zhu , X. S. Li , S. S. Chen , L. Shi , R. S. Ruoff , Nano Lett. 2010 , 10 , 1645 .
[ 9 ] H. Tian , T. L. Ren , D. Xie , Y. F. Wang , C. J. Zhou , T. T. Feng , D. Fu , Y. Yang , P. G. Peng , L. G. Wang , L. T. Liu , ACS Nano 2010 , 5 , 4878 .
[ 10 ] H. Tian , D. Xie , Y. Yang , T. L. Ren , Y. F. Wang , C. J. Zhou , P. G. Peng , L. G. Wang , L. T. Liu , Nanoscale 2012 , 4 , 2272 .
[ 11 ] R. R. Nair , P. Blake , A. N. Grigorenko , K. S. Novoselov , T. J. Booth , T. Stauber , N. M. R. Peres , A. K. Geim , Science 2008 , 320 , 1308 .
[ 12 ] C. Lee , X. D. Wei , J. W. Kysar , J. Hone , Science 2008 , 321 , 385 . [ 13 ] S. Bae , H. Kim , Y. Lee , X. F. Xu , J. S. Park , Y. Zheng , J. Balakrishnan ,
T. Lei , H. R. Kim , Y. I. Song , Y. J. Kim , K. S. Kim , B. Ozyilmaz , J. H. Ahn , B. H. Hong , S. Iijima , Nat. Nanotechnol. 2010 , 5 , 574 .
[ 14 ] X. S. Li , Y. W. Zhu , W. W. Cai , M. Borysiak , B. Y. Han , D. Chen , R. D. Piner , L. Colombo , R. S. Ruoff , Nano Lett. 2009 , 9 , 4359 .
[ 15 ] K. S. Kim , Y. Zhao , H. Jang , S. Y. Lee , J. M. Kim , K. S. Kim , J. H. Ahn , P. Kim , J. Y. Choi , B. H. Hong , Nature 2009 , 457 , 706 .
[ 16 ] J. Kang , H. Kim , K. S. Kim , S. K. Lee , S. Bae , J. H. Ahn , Y. J. Kim , J. B. Choi , B. H. Hong , Nano Lett. 2011 , 11 , 5154 .
[ 17 ] X. S. Li , W. W. Cai , J. H. An , S. Kim , J. Nah , D. X. Yang , R. Piner , A. Velamakanni , I. Jung , E. Tutuc , S. K. Banerjee , L. Colombo , R. S. Ruoff , Science 2009 , 324 , 1312 .
[ 18 ] J. W. Suk , A. Kitt , C. W. Magnuson , Y. F. Hao , S. Ahmed , J. H. An , A. K. Swan , B. B. Goldberg , R. S. Ruoff , ACS Nano 2011 , 5 , 6916 .
[ 19 ] H. Tian , D. Xie , Y. Yang , T. L. Ren , Y. X. Lin , Y. Chen , Y. F. Wang , C. J. Zhou , P. G. Peng , L. G. Wang , L. T. Liu , Appl. Phys. Lett. 2011 , 99 , 253507 .
[ 20 ] H. P. Hu , T. Zhu , J. Xu , Appl. Phys. Lett. 2010 , 96 , 214101 . [ 21 ] V. Vesterinen , A. O. Niskanen , J. Hassel , P. Helisto , Nano Lett. 2010 ,
10 , 5020 . [ 22 ] R. R. Boullosa , A. O. Santillan , Eur. J. Phys. 2006 , 27 , 95 .


![Lanthanide- and actinide-based fullerite compounds: potential A …utw10193.utweb.utexas.edu/Archive/RuoffsPDFs/37.pdf · 2013-05-08 · bonds [ 2 ]. With this chemistry as a background,](https://static.documents.pub/doc/80x56/5f0a5e207e708231d42b4ba7/lanthanide-and-actinide-based-fullerite-compounds-potential-a-2013-05-08-bonds.jpg)
