Page 1
General rights Copyright and moral rights for the publications made accessible in the public portal are retained by the authors and/or other copyright owners and it is a condition of accessing publications that users recognise and abide by the legal requirements associated with these rights.
• Users may download and print one copy of any publication from the public portal for the purpose of private study or research. • You may not further distribute the material or use it for any profit-making activity or commercial gain • You may freely distribute the URL identifying the publication in the public portal
If you believe that this document breaches copyright please contact us providing details, and we will remove access to the work immediately and investigate your claim.
Downloaded from orbit.dtu.dk on: Jun 22, 2018
Thermodynamic and Thermoeconomic investigation of an Integrated GasificationSOFC and Stirling Engine
Rokni, Masoud
Published in:Proceedings of the 8th Conference on Sustainable Development of Energy, Water and Environment Systems
Publication date:2013
Link back to DTU Orbit
Citation (APA):Rokni, M. (2013). Thermodynamic and Thermoeconomic investigation of an Integrated Gasification SOFC andStirling Engine. In Proceedings of the 8th Conference on Sustainable Development of Energy, Water andEnvironment Systems
Page 2
SDEWES2013 Conference, Dubrovnik, Croatia, pp:0166-1 to 0166-23.
THERMODYNAMIC AND THERMOECONOMIC INVESTIGATION
OF AN INTEGRATED GASIFICATION SOFC AND STIRLING
ENGINE
Masoud Rokni
Department of Mechanical Engineering Thermal Energy Section, Copenhagen, Denmark
email: [email protected]
ABSTRACT
Thermodynamic and thermoeconomic investigation of a small scale Integrated Gasification
Solid Oxide Fuel Cell (SOFC) and Stirling engine for combined heat and power (CHP) with a
net electric capacity of 120kW have been performed. Woodchips are used as gasification
feedstock to produce syngas which is then utilized for feeding the anode side of SOFC stacks.
Thermal efficiency of 0.424 LHV for the plant is found to use 89.4kg/h of feedstock for
producing 120kW of electricity. Thermoeconomic analysis shows that the production price of
electricity is 0.1204$/kWh. Further, hot water is considered as a by-product and the cost of
hot water was found to be 0.0214$/kWh. When compared to other renewable systems at
similar scale, it shows that if both SOFC and Stirling engine technology emerges enter
commercialization phase, then they can deliver electricity at a cost rate which is competitive
with corresponding renewable systems at the same size and therefore.
KEYWORDS
SOFC, Stirling, fuel cell, hybrid cycle, gasification, thermoeconomy.
INTRODUCTION
With an ever increasing demand for more efficient power production and distribution, the main
research and development for the electricity production are identifies as efficiency enchantments
and pollutant reduction, especially carbon dioxide among others. Today there is an increased
interest of developing a distributed system of smaller scale facilities than large scale capacity at a
specified location. It means that the electricity and heat can be produced and distributed close to
the end user, and thereby minimize the costs associate with transportation [1, 2].
SOFC stacks will soon enter commercialization phase, while small Stirling engines has almost
reached this phase. Therefore it might be interesting to combine these two technologies in a
single system which would then quantify the benefits of each system to establish a new
technology. Together, with an integrated gasification plant that gasifies wood chips in a two
steps gasification process, one then may produce electricity and heat in an environmentally
friendly way.
The SOFC is one of the most promising types of fuel cells, particularly when it comes to energy
production. They are expected to produce clean electrical energy at high convention rates, with
low noise and low emissions when it comes to pollution [3].
Due to high exhaust temperatures from SOFC caused by the high operating temperature of the
cells and the fact that the fuel utilization in the fuel cell never reaches 100 %, the unreacted fuels
needs to be combusted in burner which in turn produces off-gases with even higher temperature
Page 3
SDEWES2013 Conference, Dubrovnik, Croatia, pp:0166-1 to 0166-23.
that perfectly can be used in a heat engine, such as a Stirling engine, for production of power and
heat for domestic purposes.
There exist numerous investigations on SOFC-based power systems suggesting high thermal
efficiencies in the open literature. However, the majority of the studies use gas turbines as the
bottoming cycle see e.g. [4, 5, 6]. Sometimes, a steam turbine (ST) was also used as a bottoming
cycle [7] resulting in high plant efficiency. Only a few number of studies have been carried out
with Stirling engine as a bottoming cycle when a fuel cell cycle is used as topping cycle, see e.g.
[1]. At present using Brayton cycle and Rankine cycle as bottoming cycles seems to be more
applicable, because of maturity of these technologies. As the development suggest that the
operating temperature of the SOFC shall be decreased, then using gas turbine as bottoming cycle
will be less beneficial.
Integrated gasification SOFC systems have also been studied for a while, see for example [8, 9,
10]. But there is no study on integrated biomass gasification SOFC-Stirling CHP plants in the
open literature which is also the basis of this study.
The present work is an analytical study that conducts both thermodynamic and thermoeconomic
investigation of systems with integrated gasification of wood chips, where the syngas is used as
fuel for a SOFC plant which is also functioning as a topping cycle for a Stirling engine by
utilizing the heat from the off-gasses exhausted from the topping cycle. System net capacity is
120kW which is suitable for decentralized CPH plants. The gasifier model used for the analysis
is based on and downscaled version of the Viking two-stage gasifier build at DTU-MEK and
now located at DTU Risø. The Viking gasifier plant is a 75kWth biomass gasifier using a
autothermal (air blown) fixed bed gasifier which produces a clean syngas which can be directly
fed into a SOFC, for more information of the gasifier plant turn to [11, 12, 13]. The SOFC is
based on theoretical equations with empirical coefficients from an experimental setup. While the
Stirling engines parameters is chosen for a fitting a validated feasible engine regards to
construction.
METHODOLOGY
The thermodynamic results in this paper were obtained from the simulation tool DNA
(Dynamic Network Analysis), see e.g. [14]. The software is a result of an ongoing
development process at the thermal energy section at the Mechanical Department of the
Technical University of Denmark, which began with a Master’s Thesis work [15]. After that
the program has been continuously developed to be generally applicable covering unique
features and hence supplementing other simulation programs.
The program includes a component library, thermodynamic state models for fluids and
standard numerical solvers for differential and algebraic equation systems. The component
library contents models ranging from heat exchangers, burners, turbo machinery, dryers,
decanters, energy storages, engines, valves, controllers etc. The thermodynamic state models
for fluids covers most of the basic fluids and compounds such as ash and tar, used in energy
system analyses.
DNA is a component based simulation tool, means that the model is formulated by connection
components together with nodes and adding operating conditions to build up a system. Then
will the physical model be converted into a set of mathematical equations and solved
numerically. The equations will include mass and energy conservation for all components and
nodes together will relations for thermodynamic properties of the fluids in the system. The
total mass balance and energy balance for the entire system is also included to account for
heat loss and heat exchange between different components. In addition, the components
include a number of constitutive equations representing their physical properties, e.g., heat
transfer coefficients for heat exchangers and isentropic efficiencies for compressors and
Page 4
SDEWES2013 Conference, Dubrovnik, Croatia, pp:0166-1 to 0166-23.
turbines. The program is written in FORTRAN and users may also implement additional
components and thermodynamic state models to the libraries.
For the thermoeconomy, the general theory is used together with governing component costs
equations is used for making of the linear equation system, and solved in Engineering
Equation Solver (EES).
Modelling of SOFC stacks
The SOFC model developed in this investigation is based on the planar type developed by
DTU-Risø and TOPSØE Fuel Cell (TOFC). The model was calibrated against experimental
data in the range of 650C to 800C (the operating temperature), as described in [16]. For the
sake of clarity, it is shortly described here. The model is assumed to be a zero-dimensional,
thus enabling calculation of complicated energy systems. In such modeling one must
distinguish between electrochemical modeling, calculation of cell irreversibility (cell voltage
efficiency) and the species compositions at outlet. For electrochemical modeling, the
operational voltage (Ucell) was found to be
concohmactNernstcell UUUUU . (1)
Assuming that only hydrogen is electrochemically converted, then the Nernst equation can be
written as
OH
Otot,H
ee
0
f
2
22
lnΔ
p
pp
Fn
RT
Fn
gU Nernst , (2)
CH4COH2totH2, 4pppp (3)
where gf0 is the Gibbs free energy (for H2 reaction) at standard pressure. The water-gas shift
reaction is very fast and therefore the assumption of hydrogen as only species to be
electrochemically converted is justified, see [17] and [18]. In the above equations pH2 and
pH2O are the partial pressures for H2 and H2O respectively.
The activation polarization can be evaluated from the Butler–Volmer equation, which is
isolated from other polarizations to determine the charge transfer coefficients and exchange
current density from the experiment by the curve fitting technique see e.g. [19-20].
The ohmic polarization depends on the electrical conductivity of the electrodes as well as the
ionic conductivity of the electrolyte see e.g. [21-22]. This was also calibrated against
experimental data for a cell with anode thickness, electrolyte thickness and cathode thickness
of 600 m, 50 m and 10 m respectively.
The concentration polarization is dominant at high current densities for anode-supported
SOFCs, wherein insufficient amounts of reactants are transported to the electrodes and the
voltage is then reduced significantly. Again the concentration polarization was calibrated
against experimental data by introducing the anode limiting current (see, e.g. [23-24]), in
which the anode porosity and tortuosity were also included among other parameters.
The fuel composition at anode outlet was calculated using the Gibbs minimization method as
described in [25]. Equilibrium at the anode outlet temperature and pressure was assumed for
the following species: H2, CO, CO2, H2O, CH4 and N2. Thus the Gibbs minimization method
calculates the compositions of these species at outlet by minimizing their Gibbs energy. The
equilibrium assumption is fair because the methane content in this study is very low.
To calculate the voltage efficiency of the SOFC cells, the power production from the SOFC
(PSOFC) depends on the amount of chemical energy fed to the anode, the reversible efficiency
Page 5
SDEWES2013 Conference, Dubrovnik, Croatia, pp:0166-1 to 0166-23.
(rev), the voltage efficiency (v) and the fuel utilization factor (UF). It is defined in
mathematical form as
FvrevinCHCHinCOCOinHHSOFC UnLHVnLHVnLHVP ,,, 4422 , (4)
where UF was a set value and v was defined as
NernstU
U cell
v
(5)
The reversible efficiency is the maximum possible efficiency defined as the relationship
between the maximum electrical energy available (change in Gibbs free energy) and the fuels
LHV (lower heating value) as follows, (see e.g. [26])
fuel
fuelf
revLHV
g (6)
inCHOfCHfOHfCOf
inCOOfCOfCOf
inHOfHfOHffuelf
ygggg
yggg
ygggg
,
,21
,21
42422
22
2222
22
(7)
The partial pressures were assumed to be the average between the inlet and outlet as
c
in,Oout,O
O
22242
in,out,
2
}NO,H,CO,CHCO,,H{ 2
22
2p
yyp
jpyy
pjj
j
(8)
In addition, equations for conservation of mass (with molar flows), conservation of energy
and conservation of momentum were also included into the model.
Modelling of Stirling engine
The Stirling engine is noted for its quiet operation and the ease with which it can make use of
almost any heat source. Stirling engines are referred to as external combustion heat engines,
operated based on a regenerative closed power cycle using helium, nitrogen, air or hydrogen
as the working fluid. An ideal regenerative Stirling cycle consists of four processes in one
cycle. First, the working fluid absorbs the heat from a high temperature reservoir and
experiences an isothermal expansion. Second, the hot working fluid flows through a
regenerator, and the regenerator absorbs heat from the hot working fluid. Thus, the
temperature of the working fluid decreases in an isochoric process. Third, the working fluid
rejects heat to a low temperature reservoir and experiences an isothermal compression.
Finally, the cold working fluid flows back through the regenerator, and the regenerator rejects
heat to the working fluid. The temperature of the working fluid increases in the second
isochoric process.
The model of the Stirling engine gives a rater conservative engine related to e.g. efficiency.
And used mainly to show the applicability of the technology as a functioning bottoming cycle
for usage of a hot exit flow, which in this case is generated by the means of combustion after
achieving a rather high temperature even before in the SOFC topping cycle. Further the model
parameter inputs are selected so that construction is feasible means no infinite surface areas of
Page 6
SDEWES2013 Conference, Dubrovnik, Croatia, pp:0166-1 to 0166-23.
heat exchangers etc. The heat source used in the analysis is the combustion product gasses
from the catalytic gas burner, while water used for domestic purposes are used as the sink.
In this study, a pseudo Stirling cycle which has a better agreement to engine performance data
is adopted [27]. The power output for the Stirling engine are modeled as
losshighpcyStirling QQP (9)
where Qloss is defined as
stirlmechighloss QQ ,1 (10)
where ηmec,Stirl is the mechanical efficiency of the Stirling engine and Qhigh is the amount of
heat the Stirling engine absorbs from the hot source. The polytrophic efficiency ηpcy is defined
accordingly to as [27]
stirl
pcyRV
RVRV
111
111
11
(11)
where RV, εstirl, are the reversibility factor for the Stirling engine, the effectiveness of the
internal heat exchangers in the engine respectively, whilst the constant γ is 1.667 and ζ
defined as the temperature of the cooler gas over the heater gas as
15.273
15.273
,
,
gasheater
gascooler
T
T (12)
where Theater gas is
highwallheatergasheater TTT ,, (13)
waterinletwaterwallcooler TTT 66667.0,, (14)
lowwallcoolergascooler TTT ,, (15)
Modelling of Gasifier
A downscaled version of the two-stage gasifier, Viking is modeled and used for the analysis
in this investigation. The Viking gasifier is a 75 kWth gasifier build and developed by the
Biomass Gasification Group at the Technical University of Denmark [8]. Wood pellets are
used as feedstock, those are firstly dried for removal of surface moisture and pyrolysed in the
first reactor, then the pyrolysed products (600°C) is fed into a downdraft fixed bed char
gasifier reactor. The produced exhaust gases are used for heating of the reactor for the drying
and pyrolysis processes, see Fig. 1. Between pyrolysis and char gasification, partial oxidation
of the pyrolysis products provides the heat for the endothermic char gasification reactions.
Char is gasified in the fixed bed while H2O and CO2 are the gasifying agents in the char
gasification reactions. Further the gasifier operates at nearly atmospheric pressure levels.
The gasifier is modeled by implementation of a simple Gibbs reactor, which when reached
chemical equilibrium, the Gibbs free energy is at its minimum. Such characteristic is used to
calculate the gas composition at a specific temperature and pressure without taking the
reaction paths into account [25], and will be briefly explained underneath. The Gibbs free
energy of a gas (assumed a mixture of k perfect gases) is shown as
k
i
iii pnRTgnG1
0 ln (16)
Page 7
SDEWES2013 Conference, Dubrovnik, Croatia, pp:0166-1 to 0166-23.
Further, each atomic element in the inlet gas is in balance with the outlet gas composition,
which shows that the flow of each atom has to be conserved. For N elements, this balance is
expressed as
,Njnnw
m
mjoutm
k
i
ijini 1for 1
,
1
,
AA (17)
where N elements corresponds to H2, O2, N2, CO, NO, CO2, steam, NH3, H2S, SO2, CH4, C,
NO2, HCN (hydrogen cyanide), COS (carbonyl sulfide), Ar, and Ashes (SiO2) in the gasifying
process. Amj is the number of atoms of element j (H, C, O, N) in each molecule of entering
compound i (H2, CH4, CO, CO2, H2O, O2, N2, and Ar), whilst Aij is the number of atoms of
element j in each molecule of leaving compound m (H2, O2, N2, CO, NO, CO2, steam, NH3,
H2S, SO2, CH4, C, NO2, HCN (hydrogen cyanide), COS, Ar and Ashes). The minimization of
the Gibbs free energy was formulated by introducing a Lagrange multiplier, , for each of the
N constraints obtained. The expression can be minimized to
N
j
k
i
w
m
mjinmijoutijouttot AnAnG1 1 1
,,, (18)
Further, by setting the partial derivation of this equation with respect to outin ,
to zero then the
function can be minimized as
kipnRTg
ki
n
G
nN
j
ijjoutoutiouti
N
j
ijj
outi
outtot
outi
,1for 0ln
,1for 0
1
,
0
,
1,
,
,
A
A
(19)
Thus a set of k equations are defined for each chemical compound leaving the system.
Modelling of other components
The compressors power consumption are modeled based on the definition of isentropic
ηisentropic and mechanical efficiencies ηmechanical as
compressorinexit
inexit
isentropicTT
TT
h
h
W
W
'''
0
0 (20)
compressor
mechanicalW
h
0 (21)
where the mark ' represents the compression process without isentropic losses.
Heat exchangers are all assumed counter flow and it is assumed that all of the energy is
transferred from one to the other side as if heat losses are neglected, both LMTD
(Logarithmic Mean Temperature Difference) and -NTU (effectiveness-Number of
Transferred Unit) methods is used in the calculation of the flows in the heat exchangers
depending on the type [28].
For modeling the methanator which is used to increase the content of methane in the fuel, a
methanation process is used which is mainly expressed by the exothermic reaction of CO and
H2 are reformed to CH4 and steam. However some other minor reactions will also occur.
OHCHHCO 2423 (22)
Regarding the catalytic gas burner where unused fuel are reformed in a highly exothermic
process are modeled to following the general equation for burning of hydrocarbons in oxygen
shown as
Page 8
SDEWES2013 Conference, Dubrovnik, Croatia, pp:0166-1 to 0166-23.
OHm
nCOOm
nHC mn 222 )2
()4
( (23)
where n and m denotes the amount present of the hydrocarbon present in the reaction. Further,
for all reforming component the analyzing software uses the Gibbs free energy for the
different compounds. So that chemical equilibrium is obtained by the minimizing of the Gibbs
free energy for the reactions.
The pumps power consumption is obtained by volumetric and pressure states as
pump
inoutin
pump
ppmW
. (24)
Cost model and cost of components
For the making of the cost model, general theory from [29] is used, for obtaining the costs of
each separate stream in the energy system and to determine a cost of the produced electricity
and domestic hot water which is considered as a by-product. The system which is modeled
together with different components, denoted k has different cost associated with it. Cost rates
of each component are made as OM
k
CI
k ZZCC
kF,kP, (25)
where kPC , is the total cost rate associated by the product of the component, whilst kFC ,
is the
cost rate associated with the fuel (inflow) to the component. CI
kZ and OM
kZ are the cost rates
associated with the annual contribution to investment, and operation and maintenance
respectively of the component k divided by the annual operation time in hours of the system.
Thus for finding the cost of the entire system, all components cost balances needs to be taken
into consideration.
Regarding the component cost rates, those are found by finding the total capital investment
cost (TCI), which is found by defining the purchase cost of each component (PEC). PEC cost
equations are shown in Table 1 which obtained from [30] and [32], and are in $.
Table 1. Component investment costs.
Component Equation
SOFC
SOFCSOFCaux
cellcellcellcellSOFCstack
SOFCauxSOFCstackSOFC
II
TLDNI
III
10.0
190796.2)(
,
,
,,
SOFC Inverter
7.0
5
,500
10
el
inverterSOFC
WI
Compressor
67.0
44591562
compressor
compressor
WI
Heat exchanger
78.0
093.0130
hex
hex
AI
Gas cleaner,
methanator and PRPR
finPR
PR VVA
I 21283240093.0
1304.0
78.0
,
Page 9
SDEWES2013 Conference, Dubrovnik, Croatia, pp:0166-1 to 0166-23.
catalytic burner
Pump
pump
pumppump WI1
8.01141.1442
71.0
Gasifier 67.01600 drywoodgasifier mI
For the SOFC the cylindrical cells with a diameter of 0.005m and a length of 0.12m are
assumed. For the SOFC inverter elW is in Watts only, while for the other components, e.g.
compressors are in kW.
The cost of Stirling engine is assumed from [1] with the assumption that the total TCI is
2200$/kW installed effect. Further, such price represents the present cost, and therefore it is
expected to decrease when Stirling engines reach commercialization levels.
Heat exchanger area is calculate by
ml
hexTk
hmA
(26)
where the values for k are used as 35 W/m2K for gas-gas heat exchangers and 135 W/m
2K for
gas-liquid heat exchangers. Tlm is the logarithmic mean temperature difference of the heat
exchangers.
For the fuel reformers (methanator and gas cleaner) the finned area is assumed to be 10
percent of the volume of the fuel reformer. VPR is assumed from the inlet mass flow and the
reaction time of the process. Reaction time is assumed from [31] to be 1 second for the gas
cleaner and 0.5 seconds for the methanator. The gas burner is assumed to be a catalytic burner
and therefore, its equation cost is assumed to be the same as for the fuel reformers.
Gasifier purchase cost is assumed from [32] as due to the small scale of the gasifier and the
drywood mass flow is given in kg/h.
Purchase cost of splitters, mixers, and valves are neglected due to the sizing and therefore
they are considered to be a part of the direct costs related to the investment, e.g. piping,
instrumentation and controls.
TCI of PEC for each component k are gained form
100
151
100
231
100
1491k
tot
k II (27)
where the relation of direct and indirect costs related to the investment used are shown in
Table 2.
Table 2. Estimates of rates for total investment cost
Total capital investment
Direct costs Percentage of PEC
(a) Onside costs
Purchased equipment installation
Piping
Instrumentation and controls
Electrical equipment and materials
33%
35%
12%
13%
(b) Offsite costs
Civil, structural and architectural work
Service facilities
21%
35%
Page 10
SDEWES2013 Conference, Dubrovnik, Croatia, pp:0166-1 to 0166-23.
Indirect costs
Engineering and supervision
Construction, and contractors profit
8%
15%
From the TCI of each component the two cost rates CI
kZ and OM
kZ can be derived by taking
into account the total investment cost and number of operation hours per year, see e.g. [30].
Then the TCI of component k is amortized in n years by the annuity factor, by means of the
interest factor in which interest rate and rate of inflation are accounted. Construction period,
interest rate, and rate of inflation are shown in Table 3. For simplification lifetime of the
whole system is assumed 20 years. For the construction period it is assumed that it covers the
time from initial planning until final completion and commissioning. Interest rate and
inflation rates are assumed from [33] with Denmark as area of reference.
Table 3. Assumed economical parameters for the cost rates
Parameter Value
Annually operating hours 7500 [h/year]
Interest rate 3 %
Inflation rate 2 %
Equipment lifetime 20 [years]
Construction period 1 [year]
Maintenance factor 1.1
The average price for wood chips are assumed to be approximately 45 DKK/GJ [34], which is
then converted into $ per kWh. Transportation costs are not considered, however feedstock
are assumed to be derived locally, hence low costs associated.
By adding all component equations, a linear system was built in EES (Engineering Equation
Solver) to obtain costs of all streams in the system. Further, for all components a single fuel
and product were defined for each component, so that cost balances for all components could
be found. No heat loss are considered in the thermodynamic analysis, hence Ėq was
neglected. Thus, the system could be solved with adding a number of auxiliary equations
based on the assumptions that fuel which flows through a component can be used in a later
stage, and therefore the fuel had the same unit costs at inlet and outlet. If the product of a
component was composed by two or more streams then the unit cost of those were assumed to
be the same. Thus for the heat exchangers and dryer, the hot streams specific energy cost was
considered to be equal. Furthermore, for compressors and pumps, the specific energy cost of
the inlet ambient air or ambient water are assumed to be zero. For the gas cleaner and gasifier,
the disposal costs of sulfur and ash were neglected meaning that the specific energy cost was
zero. The splitters outlet streams were assumed to be equal. For SOFC, the assumptions were
so that the energy difference of the inlet fuel and the outlet used fuel were the fuel
consumption of the SOFC, hence specific energy cost to be equal and secondly, the flue gas
was considered as waste, hence specific energy cost was zero. This leads to that the fuel for
Stirling bottoming cycles still had costs related to the streams, and if more fuel was left in the
fuel (caused by lower fuel utilization factor of SOFC) then such assumption was reasonable
and in this way the bottoming cycle was not considered as a full regenerative cycle. For the
Stirling engine, two auxiliary equations are needed which are made from the assumption that
the outlet stream on the hot side was considered as waste, hence it was zero. Also, the water
heater utilizing this was assumed to recover energy from the waste. The second assumption
Page 11
SDEWES2013 Conference, Dubrovnik, Croatia, pp:0166-1 to 0166-23.
was that the products from the Stirling components are mechanical power from the engine and
therefore the absorbed heat by the heat source leads to
outcoldincold
outcoldoutcoldincoldincold
mecPEE
EcEcc
,,
,,,,
,. (28)
Electricity is considered as the main product of the plant, and heat as secondary product
which will be presented as long as electricity is produced. It is thus assumed that internal
power consumption is covered by the production hence the internal power cost will be equal
to the cost of produced electricity by
StirlingPSOFCP
StirlingPStirlingPSOFCPSOFCP
elEE
cEcE
,,
,,,,Price . (29)
PLANT CONFIGURATION
The system investigated here is a small scale CHP consisting of an integrated biomass
gasification plant with a SOFC system functioning as topping cycle whilst a Stirling engine
with a water heater are making up the bottoming cycle, see Fig. 1.
Figure1. System lay-out for the Intergraded Gasification SOFC-Stirling based CHP plant
Wood chips are fed into the system for production of syngas. This is done in a two-step
process, wherein the first one is the drying and pyrolysing of the feedstock, and the second
process is a fixed bed gasifier, were the pyrolysed feedstock is going to be gasified by steam
and air as gasification agents. Air is preheated in a heat exchanger (GAP) before sending to
the gasifier. Fuel is dried using a steam loop in which a steam generator (SG) provides the
needed steam for drying the fuel. Even though reported in [13] that the produced syngas is
clean enough to be fed directly into the SOFC without additional fuel processing, a gas
cleaner is introduced for removal of small containments presented in the syngas, mainly
sulfur. The gas cleaner is assumed working at a temperature of 250°C.
For the topping SOFC cycle, the ambient air at 15°C is compressed to the working pressure of
the SOFC (normal pressure) before being heated up in the cathode air preheater (CP) to
cathode inlet temperature of 600°C. The cathode preheater uses some of the SOFC off-air for
Page 12
SDEWES2013 Conference, Dubrovnik, Croatia, pp:0166-1 to 0166-23.
the heating. The off-air is split in two streams; one entering the CP and the other one entering
the catalytic burner (CB). For the anode side, firstly the cleaned syngas is pumped to
compensate the pressure drop along its way. Then the syngas is reformed exothermically in a
methanator, wherein CH4 content in the gas is increased from a molar fraction of about 0.01
to nearly 0.05. This is on extent of the molar fraction of H2, CO, and steam, while N2 and
CO2 also have also increased the share of the molar fraction of the gas. This will not inflict
the SOFCs electrical production in any particular way, however due to the fact that the
reformation is highly exothermic less heat is needed to be extracted from the SOFC off-fuel to
heat up the incoming fuel to the SOFC fuel inlet temperature of 650°C in the anode preheater
(AP). This will eventually lead so that the Stirling engine will get a larger amount of heat to
be used, which is caused by the fact that the fuel will have a higher temperature when entering
the CB, and therefore the combustion processes takes place at higher temperature. The CB is
implemented since all the fuel is not reacted in the SOFC stacks due to fuel utilization. The
entering temperatures are essential requirements for proper functioning of SOFC stacks, not
only to initiate the chemical reactions but also for avoiding cell thermal fractures.
Secondly, a larger portion of CH4 in SOFC causes endothermic internal reforming, which
leads to less air will be used to cooling purpose to maintain the SOFC operating temperature
at 780°C. It means that the workload of the cathode compressor/air blower will decrease.
For the bottoming cycle, a Stirling engine is implemented. The Stirling engine utilizes the
combustion products leaving the CB as the heat source. For the heat sink, water is used with
an incoming temperature of 20°C and an exit temperature of 60°C so that it can be used as
e.g. hot water for room heating, not only at a temperature that is enough for addressing
problems related to bacteria’s e.g. Legionella [35], but also sufficient high temperature for
heating (and/or domestic) purposes. The remaining heat after the Stirling engine is used for
domestic water heating. Water is constrained in the same manner as the heat sink and the
combustion products leaves the system into the environments at about 95°C, high enough to
avoid corrosion problems.
RESULTS AND DISCUSSIONS
The main operating parameters for the plant are presented in Table 4. Ambient conditions are
assumed to be 1bar and 15°C. The presented values are the final ones used after the
optimization.
Table 4. System operating input parameters
Parameter Value
Wood chips temperature
Dry wood temperature
Gasifier temperature
Gasifier pressure drop
Gasifier carbon conversion factor
Gasifier non-equilibrium methane
Steam blower isentropic efficiency
Steam blower mechanical efficiency
Steam temperature in steam loop
Wood gas blower isentropic efficiency
Wood gas blower mechanical efficiency
Gas cleaner pressure drop
Cathode compressor air intake temperature
Compressor isentropic efficiency
15 °C
150 °C
800 °C
0.005 bar
1
0.01
0.8
0.98
150 °C
0.7
0.95
0.0049 bar
25°C
0.7
Page 13
SDEWES2013 Conference, Dubrovnik, Croatia, pp:0166-1 to 0166-23.
Compressor mechanical efficiency
SOFC operating temperature
Anode inlet temperature
Cathode inlet temperature
Pressure drop anode side
Pressure drop cathode side
SOFC fuel utilization rate
Number of cells in stack
Number of stacks
Heat exchangers pressure drop
Pinch temperature CP
Burner ratio inlet outlet pressure
Stirling engine heater wall temperature
Stirling engine ΔThigh
Stirling engine ΔTlow
RV Loss factor regenerator Stirling engine
Heat exchanger efficiency Stirling engine
Stirling engine mechanical efficiency
Water pump efficiency
Inlet water temperature water heater
Outlet water temperature water heater
Outlet combustion products temperature water heater
0.95
780°C
650°C
600°C
0.02 bar
0.055 bar
0.675
74
160
0.01 bar
20 °C
0.97
600 °C
125 °C
60 °C
1.44
0.98
0.8
0.95
20 °C
60 °C
95 °C
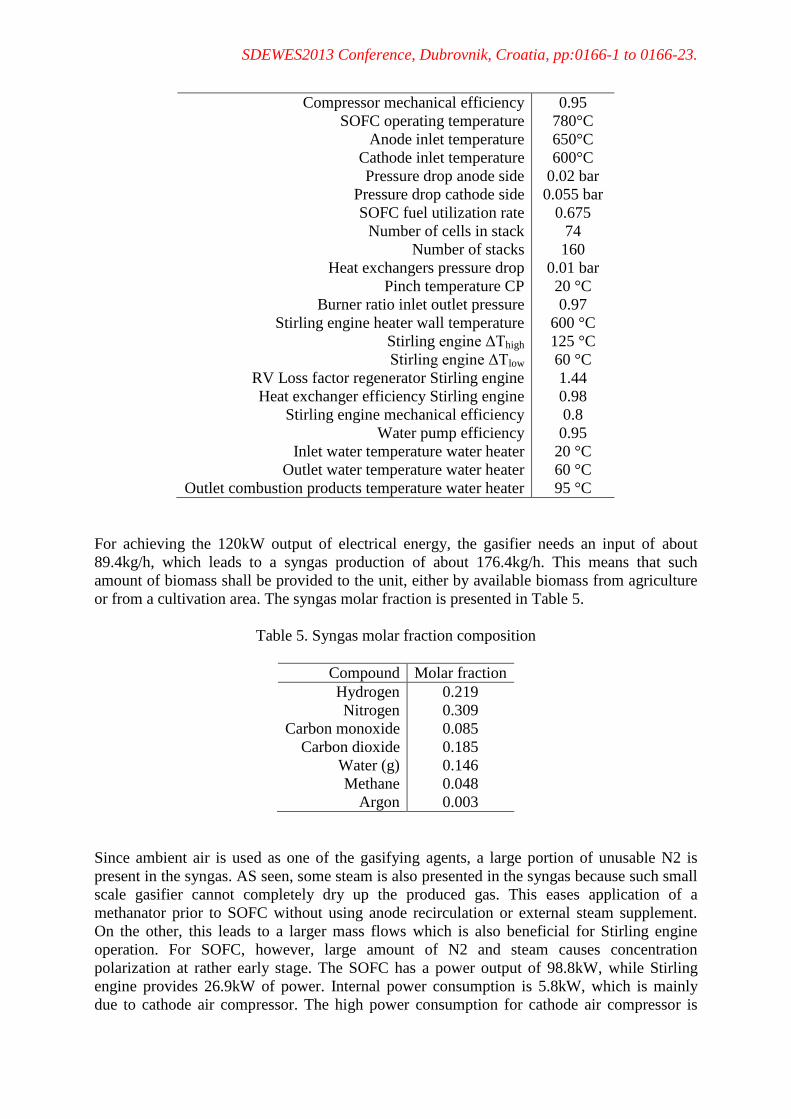
For achieving the 120kW output of electrical energy, the gasifier needs an input of about
89.4kg/h, which leads to a syngas production of about 176.4kg/h. This means that such
amount of biomass shall be provided to the unit, either by available biomass from agriculture
or from a cultivation area. The syngas molar fraction is presented in Table 5.
Table 5. Syngas molar fraction composition
Compound Molar fraction
Hydrogen
Nitrogen
Carbon monoxide
Carbon dioxide
Water (g)
Methane
Argon
0.219
0.309
0.085
0.185
0.146
0.048
0.003
Since ambient air is used as one of the gasifying agents, a large portion of unusable N2 is
present in the syngas. AS seen, some steam is also presented in the syngas because such small
scale gasifier cannot completely dry up the produced gas. This eases application of a
methanator prior to SOFC without using anode recirculation or external steam supplement.
On the other, this leads to a larger mass flows which is also beneficial for Stirling engine
operation. For SOFC, however, large amount of N2 and steam causes concentration
polarization at rather early stage. The SOFC has a power output of 98.8kW, while Stirling
engine provides 26.9kW of power. Internal power consumption is 5.8kW, which is mainly
due to cathode air compressor. The high power consumption for cathode air compressor is
Page 14
SDEWES2013 Conference, Dubrovnik, Croatia, pp:0166-1 to 0166-23.
because this compressor also provides cooling effect needed to maintain the SOFC
temperature at the desired level. The reaction inside the SOFC is highly endothermic and
therefore it needs relatively large flow of air for cooling of the cells.
The thermal efficiency of the topping SOFC cycle is 0.329 LHV, which is somewhat low
range for a SOFC system. However, the entire plant has a thermal efficiency of 0.424 LHV,
which is a decent value for such a small scale system. The implementation of the bottoming
Stirling engine gives a remarkable increase in plant efficiency of 28.9 percent, see Table6.
Table 6. Plant output for the initial operating parameters
Parameter System output
Feedstock consumption
Produced amount of syngas
Power output SOFC
Power output Stirling engine
Total power consumption
Thermal efficiency SOFC cycle
Thermal efficiency of plant
Percentage increase when adding Stirling cycle
89.4kg/h
176.4kg/h
98.8kW
26.9kW
5.8kW
0.329
0.424
28.9%
Component Produced Heat [kW]
Stirling engine
Water heater
Total hot water production
53.5
73.83
127.33
It is found that the water heater produces nearly two third of the total heat produced. The two
heaters (water heater and room heater) together produce 127.33kW.
It is also assumed that the plants internal electrical consumption is covered by its production,
meaning that the 120kW production of electricity is the net production
consumednelnStirlingSOFCnet PPPP ,, (30)
where Pel,n,consumed is the consumption of power from the n’th component. The thermal
efficiency of the plant is calculated by the net power production SOFC and the Stirling engine
compared to fuel input as
fuelfuel
netplantth
LHVm
P
, (31)
Thermodynamic investigation
The most important parameters to be investigated are woodchips mass flow, number of SOFC
stacks and SOFC cell utilization factor. The woodchips mass flow indicates the cultivation
area to be allocated for providing the needed mass flow of the fuel. Number of SOFC stacks is
directly related to the SOFC purchased cost and thereby investment cost while utilization
factor affects the amount of off-fuel (rest fuel after the SOFC stacks) which would be
available for the bottoming cycle (Stirling engine in this case). The lower utilization factor
means that more fuel will be available for the Stirling engine and therefore the engine will
produce more power. In other words, the utilization factor affects the cooperation between the
two cycles namely SOFC plant and Stirling engine.
Following the discussions above the first parameters to be investigated was the woodchips
mass flow. In order to study the system performance with different woodchips mass flow, the
initial analysis was performed on a system using 100 and 150 SOFC stacks with 74 cells for
Page 15
SDEWES2013 Conference, Dubrovnik, Croatia, pp:0166-1 to 0166-23.
each stack. Fuel utilization for SOFC cells was assumed to be 0.8. The final utilization factor
will decided later on. Plant efficiency and net power production as function of woodchips
mass flow are shown in Fig. 2.
Woodchips mass flow [kg/h]
Pla
nt
Eff
icie
ncy [
%]
Net
Po
wer
[kW
]
30 45 60 75 90 105 120 1350 0
5 15
10 30
15 45
20 60
25 75
30 90
35 105
40 120
45 135
EfficiencyPower
Woodchips mass flow [kg/h]P
lan
t E
ffic
ien
cy [
%]
Net
Po
wer
[kW
]
30 45 60 75 90 105 120 1350 0
5 15
10 30
15 45
20 60
25 75
30 90
35 105
40 120
45 135
EfficiencyPower
a) b)
Figure 2. Plant thermal efficiency and net power production as function of woodchips mass,
a) 100 stacks and b) 150 stacks.
As shown the thermal efficiency of the system tends to drop as the mass flow in the system
increases, at a certain level of fuel mass flow it tends to drop drastically. For the case with 100
stacks, the power increases as the woodchips mass flow increases to reach a maximum and
then tends to decrease as the fuel mass flow is further increased. Such a behavior is also true
for the case with 150 stacks but with much higher woodchips mass flow instead. Assuming
other values for SOFC utilization factor than 0.8 then the results will be slightly changed but
the overall conclusions remains the same.
Another important parameter to be studied is the SOFC utilization factor. To study this
parameter the woodchips mass flow is fixed to produce a net power of 120 kW at utilization
factor of about 0.7. Figure 3 shows the variation of plant efficiency and net power production
when SOFC utilization factor is changed. The results are shown for two different numbers of
stacks (100 stacks respective 150 stacks) to study the plant performance.
Several interesting points can be concluded from this figure. There exist a utilization factor
for which the plant efficiency is maximum; 0.625 for 100 stacks and 0.65 for 150 stacks. Such
maxima point is unique for a certain number of stacks which must be found out whenever the
number of stacks is decided from economic analysis. Another issue to be mentioned is that the
net power production as well as plant efficiency decreases sharply after a certain utilization
factor. This point is found out to be about 0.8 for 100 stacks and 0.83 for 150 stacks. At this
point the concentration losses in the SOFC cells dominate, and as a result the cell voltage
decreases significantly. Obviously this point will be shifted to the right when number of
stacks is increased. Increasing number of stacks decreases the fuel amount for each stack
when total fuel mass flow remains constant.
Page 16
SDEWES2013 Conference, Dubrovnik, Croatia, pp:0166-1 to 0166-23.
Utilization factor
Pla
nt
Eff
icie
ncy [
%]
Net
Po
wer
[kW
]
0.6 0.66 0.72 0.78 0.84 0.90 0
10 25
20 50
30 75
40 100
50 125
EfficiencyPower
Utilization factor
Pla
nt
Eff
icie
ncy [
%]
Net
Po
wer
[%]
0.6 0.66 0.72 0.78 0.84 0.90 0
10 25
20 50
30 75
40 100
50 125
EfficiencyPower
a) b)
Figure 3. Plant thermal efficiency and net power production as function of utilization factor
when woodchips mass is fixed, a) 100 stacks and b) 150 stacks.
As mentioned above the number of stacks is also an important issue to be studied. For this
reason several calculations were performed and the results are illustrated in Fig. 4. For
distinguish purposes two utilization factors are selected; 0.8 which is a rather high value and
0.65 which was the optimum value when 150 stacks were used. Again the fuel mass flow is
fixed for these cases. For the case with 0.8 utilization factor, increasing stack number from
100 to about 120 numbers increases plant efficiency and power sharply and further increase of
stack numbers increases plant performance significantly. Eventually, the amount of fuel per
stack is too large and ionic concentration has reached its limit. Increasing stack numbers
distributes the fixed fuel to more stacks and releases the concentration below its limit.
Numebr of Stacks
Pla
nt
Eff
icie
ncy [
%]
Net
Po
wer
[kW
]
100 120 140 160 180 2000 0
5 15
10 30
15 45
20 60
25 75
30 90
35 105
40 120
45 135
EfficiencyPower
Number of Stacks
Pla
nt
Eff
icie
ncy [
%]
Net
Po
wer
[kW
]
100 120 140 160 180 2000 0
5 15
10 30
15 45
20 60
25 75
30 90
35 105
40 120
45 135
EfficiencyPower
a) b)
Figure 4. Plant thermal efficiency and net power production as function of number of stacks
when woodchips mass is fixed, a) utilization factor = 0.8 and b) utilization factor = 0.65.
For the case with 0.65 utilization factor, increasing stack numbers increases plant efficiency
and power slightly. The problem of ionic concentration does not exist for such relatively low
utilization factor. Another conclusion from these results is that the plant efficiency for the
case with 0.65 utilization factor is higher than the case with 0.8. However, the power
produced with 0.8 utilization factor could be more than the power produced with 0.65
utilization factor if the number of stacks are high enough (more than about 160 stacks).
Page 17
SDEWES2013 Conference, Dubrovnik, Croatia, pp:0166-1 to 0166-23.
Number of stacks is directly associated with plant investment cost and therefore a limit must
be chosen to avoid high investment cost as well as price of produced electricity. The higher
the number SOFC stack is the higher associated investment cost would be. By closer
inspection of Fig. 4, choosing 160 SOFC results in rather high plant efficiency compared to
120 stacks. On the other hand, the investment cost of 160 SOFC stacks is significantly lower
than 200 stacks. Preliminary test results showed that choosing 160 will be a reasonable value
from plant efficiency as well as investment cost. For this reason, 160 stacks are chosen from
now on for analyzing the cost, even though other values could be selected.
Thermoeconomical investigation
Based on the results from the thermodynamic analysis and then combined with the cost
equations of each component along with economic parameters, the operation cost per hour
[$/hour] was obtained, see Table 7. The operation cost is denoted Ztot
, which is the component
investment cost over its lifetime. The operation and maintenance cost are denoted ZCI
respective ZOM
.
Table 7. System and component cost rates [$/hour]
Component ZCI
[$/hour] ZOM
[$/hour] Ztot
[$/hour]
SOFC 0.834445 0.917889 1.752
Inverter 0.007102 0.007812 0.015
AP 0.030144 0.033158 0.063
Methanator 0.035623 0.039185 0.074
Syngas compressor 0.055377 0.060914 0.116
Gas Cleaner 0.057162 0.062878 0.120
CP 0.579426 0.637368 1.217
Cathode compressor 0.103230 0.113553 0.217
Catalytic gas burner 0.103073 0.113380 0.216
Stirling engine 0.396511 0.436163 0.833
Water pump 0.003295 0.003625 0.007
Water heater 0.043093 0.047402 0.090
Gasifier 0.714470 0.785917 1.500
GAP 0.062926 0.069219 0.132
Steam generator 0.057336 0.063069 0.120
Steam loop blower 0.030753 0.033828 0.065
Total operating cost 2.949469 3.244416 6.194
As the table shows, the largest cost is associated with the SOFC of 1.752 $/hour, here with
160 stacks and 74 cells in each stack, followed by the gasifier 1.5 $/hour, then CP (cathode air
preheater) 1.217 $/hour which is a relatively a large heat exchanger, and the Stirling engine
0.833 $/hour. For the other components the costs are relatively low. The entire plant’s
operating cost is found to be 9.447 $/hour, with the current inputs and assumptions.
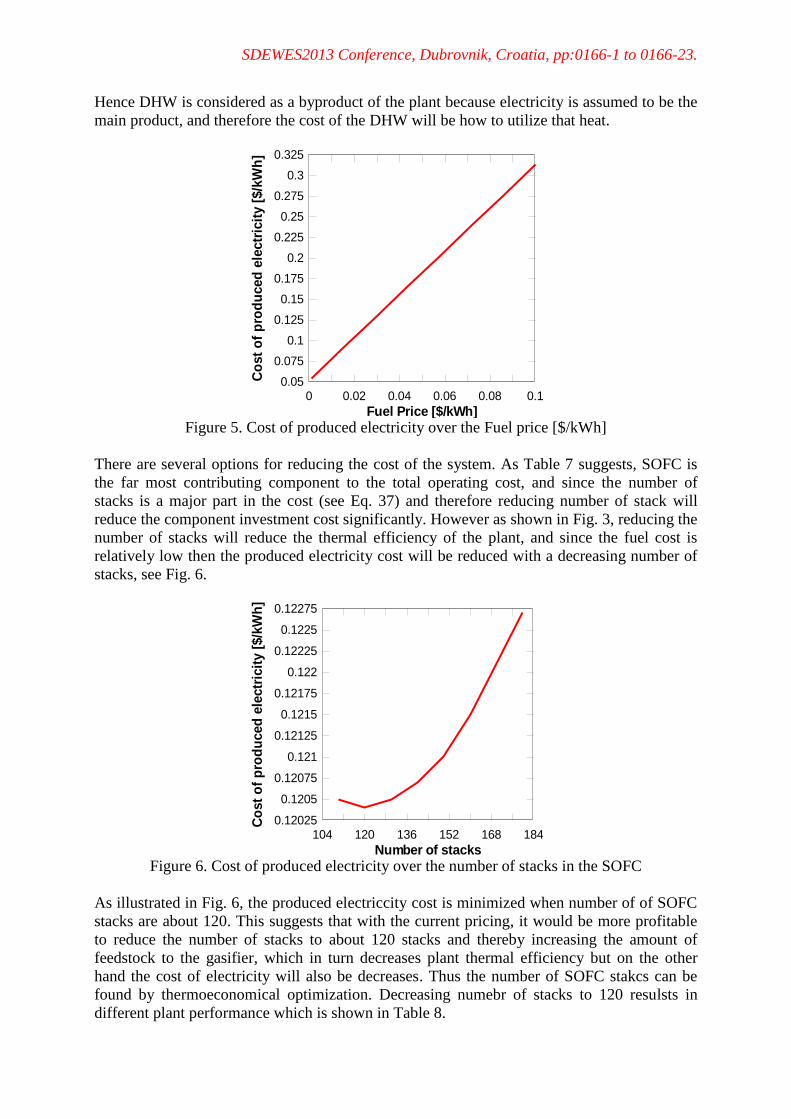
Systems sensitivity to the fuel price is illustrated in Fig. 5, for which the system costs shown
in Table 7 are used. As seen increasing the fuel price with 0.02 $/kWh increases the produced
electricity price by approximately 0.05 $/kWh. For the system with the current price of wood
chips described in the cost model section, a production price of 0.1215 $/kWh is found. The
price of produced domestic hot water (the price of DHW) was found to be 0.0219 $/kWh.
Such low cost is caused by the assumption that the cost of DHW is the cost rate of the water
heater and the energy difference of the “in” and “outflow” of the WH and the Stirling engine.
Page 18
SDEWES2013 Conference, Dubrovnik, Croatia, pp:0166-1 to 0166-23.
Hence DHW is considered as a byproduct of the plant because electricity is assumed to be the
main product, and therefore the cost of the DHW will be how to utilize that heat.
Fuel Price [$/kWh]
Co
st
of
pro
du
ced
ele
ctr
icit
y [
$/k
Wh
]
0 0.02 0.04 0.06 0.08 0.10.05
0.075
0.1
0.125
0.15
0.175
0.2
0.225
0.25
0.275
0.3
0.325
Figure 5. Cost of produced electricity over the Fuel price [$/kWh]
There are several options for reducing the cost of the system. As Table 7 suggests, SOFC is
the far most contributing component to the total operating cost, and since the number of
stacks is a major part in the cost (see Eq. 37) and therefore reducing number of stack will
reduce the component investment cost significantly. However as shown in Fig. 3, reducing the
number of stacks will reduce the thermal efficiency of the plant, and since the fuel cost is
relatively low then the produced electricity cost will be reduced with a decreasing number of
stacks, see Fig. 6.
Number of stacks
Co
st
of
pro
du
ced
ele
ctr
icit
y [
$/k
Wh
]
104 120 136 152 168 1840.12025
0.1205
0.12075
0.121
0.12125
0.1215
0.12175
0.122
0.12225
0.1225
0.12275
Figure 6. Cost of produced electricity over the number of stacks in the SOFC
As illustrated in Fig. 6, the produced electriccity cost is minimized when number of of SOFC
stacks are about 120. This suggests that with the current pricing, it would be more profitable
to reduce the number of stacks to about 120 stacks and thereby increasing the amount of
feedstock to the gasifier, which in turn decreases plant thermal efficiency but on the other
hand the cost of electricity will also be decreases. Thus the number of SOFC stakcs can be
found by thermoeconomical optimization. Decreasing numebr of stacks to 120 resulsts in
different plant performance which is shown in Table 8.
Page 19
SDEWES2013 Conference, Dubrovnik, Croatia, pp:0166-1 to 0166-23.
Table 8. Plant performance by thermoeconomical optimization
Parameter Value
Produced amount of syngas 180.05 kg/h
Fuel consumption 91.33 kg/h
Power output SOFC 98.48 kW
Power output Stirling engine 27.62 kW
Total internal power consumption 6.10 kW
Thermal efficiency SOFC cycle 0.3195
Thermal efficiency of the plant 0.4149
Increase when adding bottoming cycle 29.88 %
Produced heat 130.52 kW
Cost of electricity 0.1204 $/kWh
Cost of DHW 0.0214 $/kWh
Total TCI over installed capacity 3432.97 $/kW
The fuel consumption of 91.33 kg/h of wood is needed to be fed to the gasifier for achieving a
net power production of 120 kW. This amount of feedstock to the gasifier will lead to a
syngas production of 180.05 kg/h, which means that an air intake to the gasifier is nearly
equal to that of wood, for the gasification processes. After methanation of the syngas (for
slightly increasing the methane content), the power production of the SOFC plant will be
about 98.48 kW. As explained earlier, the methanator increases the amount of methane in the
fuel which in turn results in endothermic internal reforming. This will lead to that a smaller
amount of air in the cathode side is needed to cool the SOFC to maintain the SOFC operation
temperature. Thus the power consumption of the compressor will also be reduced. The total
internal power consumption will be about 6.10 kW. The power production from the Stirling
engine is about 27.62 kW, leading to plant thermal efficiency of 0.41 (LHV based). The
integrated gasification and SOFC topping cycle will have a thermal efficiency of 0.32 (LHV
based). Thus applying the Stirling engine as bottoming cycle, increases plant thermal
efficiency by nearly 28 percent, which is significant. This is due to the fact that the integrated
gasification and SOFC plant has a low thermal efficiency and therefore more energy will be
available for the bottoming cycle. A thermal efficiency of 41% sounds to be somewhat low,
but for an integrated gasification plant producing only 120 kW is in fact high enough. Note
that an integrated gasification combined cycle has an efficiency of about 40% at about 500
MW power output. Note also that SOFC fuel utilization is relatively low, 0.675 as explained
earlier. Further130.52 kW of district heat water s produced as a byproduct.
The cost of produced electricity is 0.1204 $/kWh, and the cost of produced DHW is 0.0214
$/kWh. These prices will be changed if the assumptions given above are changed. However,
the results obtained here give a relatively good overview on the cost situation.
The obtained costs are a result of low fuel costs and high component and installation costs
with respect to the plant size. As stated in energy.eu [36], that electricity price for a household
with a consumption of 7500kWh/year (±30%) is 0.2562€/kWh in Denmark, and for the
industry with a consumption of 2GWh/year (±50%) the price is 0.0982€/kWh. The obtained
results with today’s exchange rate from € to $ leads to an electricity price that are within the
border of what to be expected when buying it from the grid, hence the system most likely to
be competitive for installation in places such as a hotel, malls, etc. It means that the system
might be cost effective when SOFC and Stirling engine enter the commercialization phase
and their price will be close to what it is predicted here. Regarding DHW here it is considered
Page 20
SDEWES2013 Conference, Dubrovnik, Croatia, pp:0166-1 to 0166-23.
to be a byproduct and the cost is obtained as 0.0214 $/kWh, which is much lower than the
price of district heating networks as 0.1143$/kWh provided by København Energi 2012 [37].
Thus, for in-house usage the electricity is produced at cost level that is nearly competitive
when fuel prices are held at the assumed level. However, for selling the electricity to the grid,
the production cost is considered to be high. Comparing to other renewable energy sources at
similar size, conventional biomass gasifiers at 20-50000kW sizes produces energy with
approximately 0.13 $/kWh, while small scale wind turbines produces energy at even higher
rates [38].
Here, the total TCI for installed capacity is 3432.97 $/kW, which is in the higher range when
compared to other renewable energy systems.
CONCLUSIONS
A small scale integrated gasification SOFC-Stirling CHP plant with a net capacity of 120kW
is presented. Both thermodynamic and thermoeconomic investigations are analyzed. A rather
modest plant thermal efficiency is found to be 0.41 after thermoeconomic optimization. This
was also partly because the parameter inputs for the different components have been chosen
from a conservative point of view, and partly because the produced syngas have a large
fraction of non-usable compounds which in turn resulted in lower utilization factor for SOFC
stacks.
The thermoeconomical analyses showed that by reducing the number of stacks from 160
stacks with 74 cells to 120 stacks, the cost of produced electricity will be decreased in
expense of lower plant thermal efficiency. An electricity production price of 0.1204 $/kWh is
found with a DWH production cost of 0.0214 $/kWh, based on assumption of component cost
equations for future pricing of SOFC and Stirling engine when emerged into
commercialization phase. These prices are competitive in the Danish market for in-house
usage but slightly higher if the electricity is sold to the grid.
Neglecting different disposal costs, the plant cost is estimated to 3433 $/kW which is
competitive when compared to the other types of environmentally friendly energy systems at
similar size.
NOMENCLATURE
Ahex Heat exchanger area, m2
Ai,j Matrix
PC Product cost rate, $/kWh
FC Fuel cost rate, $/kWh
cp specific energy cost, $/kW
Dcell Cell diameter, m
E Energy, kJ/kg
F Faradays constant, C/mol
f Annuity factor
fη Efficiency correction factor
k Thermal conductivity, W/m2K
g0 Standard Gibbs free energy, J/mol
gf Gibbs free energy, J/mol
h Enthalpy, J/kg
hf Enthalpy of formation, J/mol
Icomp Purchase cost of component k
Lcell Cell length, m
Page 21
SDEWES2013 Conference, Dubrovnik, Croatia, pp:0166-1 to 0166-23.
m Mass flow rate, kg/s
2Hn
Molar reaction rate of H2, mol/s
ne Number of electron
P Power, W
p Pressure, bar
pH2 Partial pressures for H2 , bar
pH2O Partial pressures for H2O, bar
Q heat, J/s
qi Interest rate
T Operating temperature, K
t Thickness, m
R Universal gas constant, J/K mol
RV Reversibility factor
UF Fuel utilization factor
U Voltage, V
V Volume, m3
Van Anode porosity
W Work, W
y Molar fraction
ZCI
Annual contribution to investment, $/kWh
ZOM
Annual contribution to operation and maintenance, $/kWh
Greek symbols
Change/difference
Tml Logarithmic mean temperature difference, K
ε Effectiveness factor
Efficiency
pcy Polytrophic efficiency
υ specific volume, m3/kg
Subscript
act Activation polarization
an Anode
aux Auxiliary
ca Cathode
conc Concentration polarization
el Electricity
FC Fuel cell
mec Mechanical
Nernst Nernst ideal reversible voltage
ohm Ohmic polarization
ref Reference
rev reversible
th Thermal
v Voltage
Abbreviations
AP Anode pre-heater
CHP Combined Heat and Power
Page 22
SDEWES2013 Conference, Dubrovnik, Croatia, pp:0166-1 to 0166-23.
CP Cathode air pre-heater
DHW Domestic Hot Water
DNA Dynamic Network Analysis
EES Engineering Equation Solver
GAP Gasifier air pre-heater
CB Catalytic burner
GT Gas turbine
LHV Lower heating value
SG Steam generator
PEC Component purchase cost
SOFC Solid oxide fuel cell
TCI Total investment cost
WH Water heater
REFERENCES
1. Sanchez D., Chacartegui R., Torres M., Sanchez T., Stirling based fuel cell hybrid systems: an
alternative for molten carbonate fuel cells, J Power Sources, Vol. 192: pp. 84-93, 2008.
2. Rokni M. Plant Characteristics of a Multi-Fuel SOFC-Stirling Hybrid Configuration. 5th
International Conference on Sustainable Energy and Environmental Protection – SEEP2012,
5 – 8 June, Dublin City University, Dublin, Ireland, ISBN: 978-1-873769-11-9, 2012; 269-
274.
3. Calise F., Dentice d’Accadia M., Palombo A., Vanoli L., Simulation and exergy analysis of a
hybrid solid oxide fuel cell (SOFC)–Gas turbine system, J Energy, Vol. 31, pp.3278–99,
2006.
4. EG&G and G Technical Services Inc, Fuel Cell Handbook, edition 7, U.S. Departement of
Energy, Office of Fossil Energy, National Energy Technology Laboratory, 2004.
5. Riensche E., Achenbach E., Froning D., Haines M.R., Heidug W.K., Lokurlu A. and Adrian
S., Clean combined-cycle SOFC power plant–cell modeling and process analysis. J Power
Sources, Vol. 86, No. 1-2, pp. 404-410, 2000.
6. Pålsson J., Selimovic A., Sjunnesson L., Combined solid oxide fuel cell and gas turbine
systems for efficient power and heat generation, J Power Sources, Vol. 86, No. 1, pp. 442-
448, 2000.
7. Rokni M., Plant characteristics of an integrated solid oxide fuel cell and a steam cycle. J
Energy, Vol. 35, pp. 4691–99, 2010.
8. Proell T, Aichering C, Rauch R, Hofbauer H. Coupling of biomass steam gasification and
SOFC-gas turbine hybrid system for highly efficient electricity generation. ASME turbo Expo
Proceeding, GT2004-53900, pp. 103-112, 2004.
9. Bang-Møller C., Rokni M., Thermodynamic Preformance Study on Biomass Gasification,
Solid Oxide Fuel Cell and Micro Gas Turbine Hybrid Systems. J Energy Conversion and
Management, Vol. 51, pp. 2330-2339, 2010.
10. Rokni M., Thermodynamic investigation of an integrated gasification plant with solid oxide
fuel cell and steam cycles, J Green, Vol. 2: pp. 71–86, 2012.
11. Henriksen U, Ahrenfeldt J, Jensen TK, Gøbel B, Bentzen JD, Hindsgaul C, Sørensen LH. The
design, construction and operation of a 75 kW two-stage gasifier, J Energy, Vol. 31 No. 10-
11, pp. 1542-1553, 2006
12. Ahrenfeldt J., Henriksen U., Jensen T.K., Gøbel B., Wiese L., Kather A., Egsgaard H.,
Validation of a continuous combined heat and power (CHP) operation of a two-stage boimass
gasifier, J Energy and Fuels, Vol. 20, No. 6, pp. 2672-2680, 2006.
Page 23
SDEWES2013 Conference, Dubrovnik, Croatia, pp:0166-1 to 0166-23.
13. Hofmann P.H., Schweiger A., Fryda L., Panopoulos K., Hohenwarter U., Bentzen J.,
Ouweltjes J.P., Ahrenfeldt J., Henriksen U., Kakaras E., High temperature electrolyte
supported Ni-GDC/YSZ/LSM SOFC operation on two stage Viking gasifier product gas. J
Power Sources, Vol. 173, No. 1, pp. 357-366, 2007.
14. Elmegaard B., Houbak N., DNA – A general energy system simulation tool, proceeding of
SIMS, Trondheim, Norway; 2005.
15. Perstrup C., Analysis of power plant installation based on network theory (in Danish), M.Sc.
thesis, Technical University of Denmark, Laboratory of Energetics, Denmark; 1989.
16. Petersen T.F., Houbak N., Elmegaard B., A zero-dimensional model of a 2nd generation
planar SOFC with calibrated parameters. Int. J. Thermodynamic, Vol. 9, No. 4, pp. 161–169,
2006.
17. Holtappels P., DeHaart L.G.J., Stimming U., Vinke I.C. and Mogensen M., Reaction of
CO/CO2 gas mixtures on Ni-YSZ cermet electrode. J Applied Electrochemistry, Vol. 29: pp.
561–568, 1999.
18. Matsuzaki Y. and Yasuda I., Electrochemical oxidation of H2 and CO in a H2-H2O-CO-CO2
system at the interface of a Ni-YSZ cermet electrode and YSZ electrolyte. J Electrochemistry
Society, Vol. 147, No. 5, pp. 1630–35, 2000.
19. Keegan K.M., Khaleel M., Chick L.A., Recknagle K., Simner S.P. and Diebler J., Analysis of
a planar solid oxide fuel cell based automotive auxiliary power unit. SAE technical paper
series No. 2002-01-0413, 2002.
20. Prentice G. Electrochemical Engineering Principles. Prentice Hall International, Houston,
USA, 1991.
21. Achenbach E. Three-dimensional and time-dependent simulation of a planar solid oxide fuel
cell stack. J Power Sources, Vol. 49, No. 1–3, pp. 333–348, 1994.
22. Zhu H. and Kee R.J., A general mathematical model for analyzing the performance of fuel-
cell membrane-electrode assemblies. J Power Sources, Vol. 117, pp. 61-74, 2003.
23. Costamagna P., Selimovic A., Del Borghi M. and Agnew G., Electrochemical model of the
integrated planar solid oxide fuel cell (IP-SOFC), J Chemical Engineering, Vol. 102, No. 1,
pp. 61–69, 2004.
24. Kim J.W. and Virkar A.V., The effect of anode thickness on the performance of anode-
supported solid oxide fuel cell. In: Proceedings of the sixth international symposium on
SOFCs, (SOFC-VI), PV99-19. The Electrochemical Society, pp. 830–839, 1999.
25. Smith J.M., Van Ness H.C. and Abbott M.M., Introduction to chemical engineering
thermodynamics. 7th ed. Boston: McGraw-Hill; 2005.
26. Winnick, J. Chemical engineering thermodynamics, John Wiley &Sons, New Yourk, 1997.
27. Reader GT. The Pseudo Stirling Cycle – A suitable performance criterion, Proceeding of the
13th intersociety energy conversion engineering conference. Vol. 3, pp. 1763–770, San Diego,
California, August 20–25, 1979.
28. Incropera F.P., DeWitt D.P., Bergman T.L. and Lavine A.S., Introduction to Heat Transfer,
5th ed, Wiley 2006, ISBN 978-0471457275.
29. Bejan A., Tsatsaronis G., Moran M., Thermal design and optimization. New York: John wiley
and Sons Inc.; 1996.
30. Arsalis A., Spakovsky M., Calise F., Thermoeconomic modeling and parameter study of
hybrid solid oxide fuel cell-gas turbine-steam turbine power plants ranging from 1.5 MWe to
10MWe, J Fuel Cell Science and Technology, Vol. 6, pp. 011015, 2009.
31. Gary J.H., Handwerk G.E., Kaiser M.J., Petroleum refining, technology and economics. 5th
edition, CRC press, 2007, ISBN: 0849370388.
32. Kempegowda R.S., Tran K.Q., Skreiberg Ø., Economic analysis of combined cycle biomass
gasification fuelled SOFC systems. International Conference on Future Environment and
Energy (ICFEE 2011), pp. 134-141, 2011.
Page 24
SDEWES2013 Conference, Dubrovnik, Croatia, pp:0166-1 to 0166-23.
33. Trading Economics August 2012. (Available online) from
http://www.tradingeconomics.com/denmark
34. Ea Energy Analysis, Analysis of the market for bio energy, locally and internationally, Series:
NEI-DK-5426, sys.no.: 000492186, 2010.
35. Institute of Plumbing & Heating Engineering, Safe hot water temperature, July 2012.
(Available online): http://www.chipe.org.uk/Global/databyte/safe%hot%water.pdf.
36. European Union, August 2012. (Available online): http://www.energy.eu.
37. Københavns Energi, August 2012. (Available online):
http://www.ke.dk/portal/page/portal/Erhverv/Varme/prisen\_paa\_fjernvarme\_2012?page=91
6.
38. Renewables 2011. Global status report. REN 21, Renewable energy policy for the 21st
Century, Paris, 2011.