THERMODYKAMIC PROPERTIES IN THE SYSTEMS V-H, Nb-H, AND Ta-H 683 has an open hydronium hydrogen, and so Ccl4 can sol- vate this complex better than can isooctane. This en- hanced solvation by CC1, just about compensates for the effect of the enhanced interaction of CC14 with TBP itself, and so the values of Kza are almost alike in the two diluents. The diluent 1,2-dichloroethane also must interact with TBP more strongly than does iso- octane, thus hindering formation of the acid complex,17 but its most important property is its relatively high dielectric constant, which favors extraction and leads to dissociated ions in the extracted species. KO evidence for a 2 :1 species was found in this system in the concentration range studied, and we believe that the loss of interaction with the anion in the dissociated species requires a more complete solvation of the cation by the TBP, thus favoring the 3:l complex. In this paper we have shown that the hydronium ion-TBP complex can have lower complexes than the saturated 3:l species, and that the nature of the diluent employed affects both the magnitude of the extraction and the nature of the extracted complex in a reasonable way. Several other studies of HC10419J0 or HReOP extraction by TBP or TBP-diluent systems have been made. These studies, however, are either at higher concentrations of TBP than used in this study or use a different diluent, so that comparisons with the present work are difficult. In the next paper, this type of study will be extended to chloroform and to aromatic diluents. (19) See ref 1-9 in D . C. Whitney and R. M. Diamond, J. Phys. Chem., 67, 209 (1963). (20) K. Naito and T. Suzuki, ibid., 66, 983 (1962). (21) R. Colton, U.K.A.E.A. Report AE!RE-R3823 (Sept 1961). Thermodynamic Properties in the Systems Vanadium-Hydrogen, Niobium-Hydrogen, and Tantalum-Hydrogen’ by Ewald Veleckis2 and Russell K. Edwards Department of Chemistry, Illinois Institute of Technology, Chicago, Illinois 60616 (Received July 89, 1968) Comprehensive thermodynamic studies have been conducted for the systems V-H (246-554’), Nb-H (352- 671°), and Ta-H (350-631’) in the pressure range 1-800 Torr by measuring the equilibrium hydrogen pressure as a function of composition. Each of these system is comprised of a single solid phase in the temperature and pressure ranges studied. For each system a semiempirical equation, based on the statistical formulation of the simple interstitial solid solution model, is presented. The equations not only adequately reproduce the P-C-T data within the ranges of study but appear to be reliable to much lower temperatures. For example, they have been used to predict the T-C boundaries of immiscibility regions; for one system (Nb-H), for which comparison with an experimentally derived diagram is possible, agreement is very good. Calculated critical compositions, temperatures, and pressures are given. The partial and integral entropies and enthalpies of formation were calculated for the single-phase regions at 1 atom % intervals up to the maximum compositions of 34 (V-H), 39 (Nb-H), and 27 (Ta-H) atom 70 H. The results are compared in detail with those of other work. Introduction Like palladium, the group Vb transition metals, vanadium, niobium, and tantalum, form with hydrogen wide ranges of solid solutions which, at lower tempera- tures, are interrupted by miscibility gaps. For the palladium-hydrogen system the pressure-composition- temperature (P-C-T) data have been obtained both above and below the critical temperature. For the V-H, Nb-H, and Ta-H systems such data below the critical temperature are difficult to obtain because of the slowness of achieving equilibrium ; nonetheless, these systems afford the opportunity of obtaining extensive P-C-T data above the critical temperatures to contribute to the advance of theoretical models. The reported P-C-T work from which useful thermo- dynamic data have been or may be calculated consists principally of the following studies.s Kofstad and Wallace4 obtained data for the system V-H in the range 165 to 456’. The Nb-H system, which received considerable attention because of the use of niobium in nuclear reactors, was investigated by Albrecht, (1) Abstracted from the P b D . Thesis of E. Veleckis, Illinois Insti- tute of Technology, 1960. (2) Address correspondence to the authors at Argonne National Laboratory, Chemical Engineering Division, Argonne, Ill. (3) For more complete literature references refer to H. J. Gold- Schmidt, “Interstitial Alloys,” Butterworth and Co., Ltd., London, 1967, Chapter 9. (4) P. Kofstad and W. E. Wallace, J. Amer. Chem Soc., 81, 6019 (1959). 60439. Volume 7S, Number 9 March 1060
Transcript
THERMODYKAMIC PROPERTIES IN THE SYSTEMS V-H, Nb-H, AND Ta-H 683
has an open hydronium hydrogen, and so Ccl4 can sol- vate this complex better than can isooctane. This en- hanced solvation by CC1, just about compensates for the effect of the enhanced interaction of CC14 with TBP itself, and so the values of Kza are almost alike in the two diluents. The diluent 1,2-dichloroethane also must interact with TBP more strongly than does iso- octane, thus hindering formation of the acid complex,17 but its most important property is its relatively high dielectric constant, which favors extraction and leads to dissociated ions in the extracted species. KO evidence for a 2 :1 species was found in this system in the concentration range studied, and we believe that the loss of interaction with the anion in the dissociated species requires a more complete solvation of the cation by the TBP, thus favoring the 3: l complex.
In this paper we have shown that the hydronium ion-TBP complex can have lower complexes than the saturated 3:l species, and that the nature of the diluent employed affects both the magnitude of the extraction and the nature of the extracted complex in a reasonable way. Several other studies of HC10419J0 or H R e O P extraction by TBP or TBP-diluent systems have been made. These studies, however, are either a t higher concentrations of TBP than used in this study or use a different diluent, so that comparisons with the present work are difficult. In the next paper, this type of study will be extended to chloroform and to aromatic diluents.
(19) See ref 1-9 in D. C. Whitney and R . M. Diamond, J. Phys. Chem., 67, 209 (1963). (20) K. Naito and T. Suzuki, ibid., 66, 983 (1962). (21) R. Colton, U.K.A.E.A. Report AE!RE-R3823 (Sept 1961).
Thermodynamic Properties in the Systems Vanadium-Hydrogen,
Niobium-Hydrogen, and Tantalum-Hydrogen’
by Ewald Veleckis2 and Russell K. Edwards Department of Chemistry, Illinois Institute of Technology, Chicago, Illinois 60616 (Received July 89, 1968)
Comprehensive thermodynamic studies have been conducted for the systems V-H (246-554’), Nb-H (352- 671°), and Ta-H (350-631’) in the pressure range 1-800 Torr by measuring the equilibrium hydrogen pressure as a function of composition. Each of these system is comprised of a single solid phase in the temperature and pressure ranges studied. For each system a semiempirical equation, based on the statistical formulation of the simple interstitial solid solution model, is presented. The equations not only adequately reproduce the P-C-T data within the ranges of study but appear to be reliable to much lower temperatures. For example, they have been used to predict the T-C boundaries of immiscibility regions; for one system (Nb-H), for which comparison with an experimentally derived diagram is possible, agreement is very good. Calculated critical compositions, temperatures, and pressures are given. The partial and integral entropies and enthalpies of formation were calculated for the single-phase regions a t 1 atom % intervals up to the maximum compositions of 34 (V-H), 39 (Nb-H), and 27 (Ta-H) atom 7 0 H. The results are compared in detail with those of other work.
Introduction
Like palladium, the group Vb transition metals, vanadium, niobium, and tantalum, form with hydrogen wide ranges of solid solutions which, a t lower tempera- tures, are interrupted by miscibility gaps. For the palladium-hydrogen system the pressure-composition- temperature (P-C-T) data have been obtained both above and below the critical temperature. For the V-H, Nb-H, and Ta-H systems such data below the critical temperature are difficult to obtain because of the slowness of achieving equilibrium ; nonetheless, these systems afford the opportunity of obtaining extensive P-C-T data above the critical temperatures to contribute to the advance of theoretical models.
The reported P-C-T work from which useful thermo- dynamic data have been or may be calculated consists principally of the following studies.s Kofstad and Wallace4 obtained data for the system V-H in the range 165 to 456’. The Nb-H system, which received considerable attention because of the use of niobium in nuclear reactors, was investigated by Albrecht,
(1) Abstracted from the PbD. Thesis of E. Veleckis, Illinois Insti- tute of Technology, 1960. (2) Address correspondence to the authors at Argonne National Laboratory, Chemical Engineering Division, Argonne, Ill. (3) For more complete literature references refer to H. J. Gold- Schmidt, “Interstitial Alloys,” Butterworth and Co., Ltd., London, 1967, Chapter 9. (4) P. Kofstad and W. E. Wallace, J. Amer. Chem Soc., 81, 6019 (1959).
60439.
Volume 7S, Number 9 March 1060
684 EWALD VELECKIS AND RUSSELL K. EDWARDS
3- rli
S
I I A ( 1 1
TO VACUUM PUMPS I 11 ''4 TO McLEOD GAUGE
+- TO HYDROGEN OR HELIUM
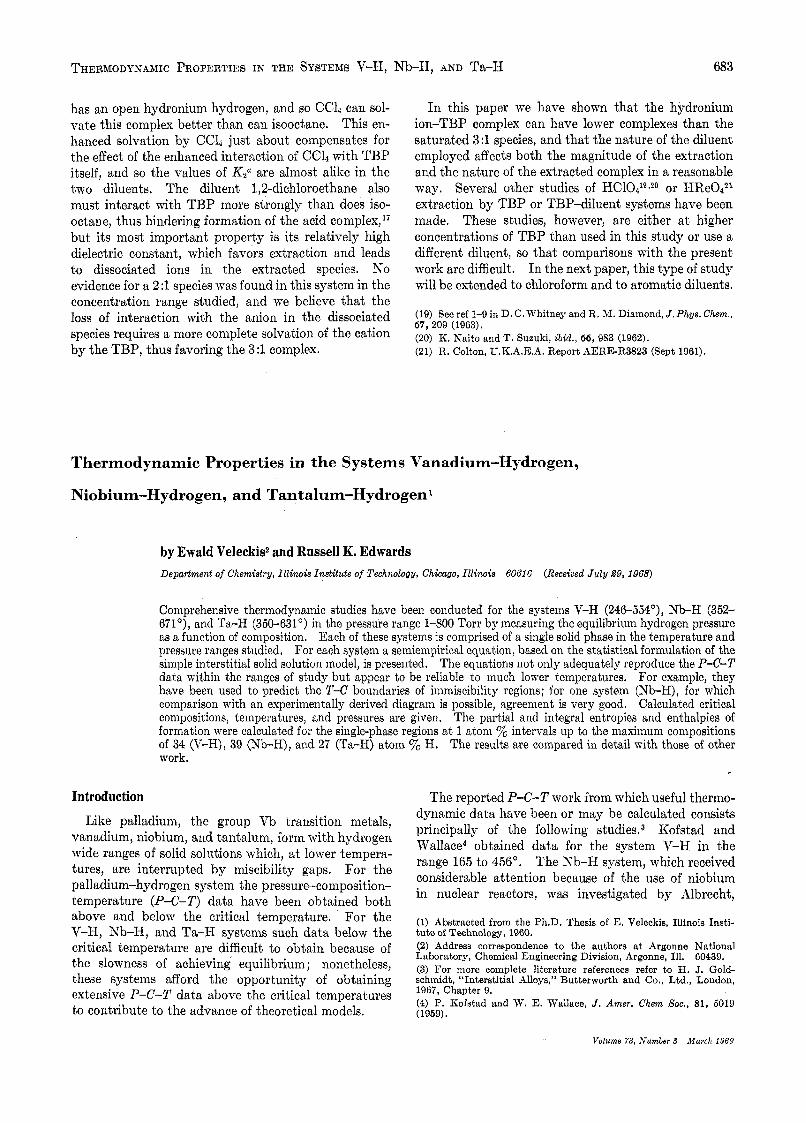
Figure 1. Schematic diagram of hydrogen-metal equilibration apparatus: A, porcelain specimen container; B, Vycor tube; C, porcelain protection tube; D, liquid metal bath; E, gas displacement rod; FL, purification and storage furnace for hydrogen; F1, gettering furnace for helium purification; G, calibrated bulb for gas measurements; MI, mercury manometer; N2, Ma, oil manometers; TI, Tg, cold traps.
et aL6 (100-900°), I<omjathye (300-1500"), and Katz and Gulbransen' (225-513", by the microbalance tech- nique). The Ta-H system was studied by Kofstad, et aL8 (300-400") and by Mallett and Koehlg (300- 700").
The present work was undertaken to establish for these systems more comprehensive and reliable P-C-T data suitable for detailed thermodynamic evaluation and for testing theoretical models.
Experimental Section Appamtus. Figure 1 shows a scheinatic diagram of
the apparatus. The metal specimen was placed in a small porcelain crucible, A, which, in turn, was intro- duced into a long Vycor tube, B. The tube was situ- ated within the porcelain protection tube, C, which was submerged in the liquid metal bath, D. A Vycor rod, E, was placed within the tube to minimize the gas volume. The gas pressure in the tube was measured with one of the two manometers: manometer MI filled with mercury was used to measure pressures above 20 Torr; manometer Mz filled with octoil was used for pressures in the range 1-20 Torr. In either case, during measurement, the mercury level was adjusted to mark a in the left arm of manometer illl to maintain a fixed residual gas volume. The number of moles of gas to be introduced into this residual volume was quan- titatively measured in a calibrated bulb, G, having a
volume of 509.8 em*. Fluctuations in the temperature of the bulb were reduced by covering i t with several wrappings of aluminum foil. Temperatures of the bulb were measured with two thermocouples attached di- rectly to the glass; pressures of the gas in the bulb were read on manometer M3 filled with octoil. To provide parallax-free readings the manometers were attached to etched scales backed by mirrors.
Hydrogen was admitted to the system through a liquid nitrogen trap, TI, to rid the gas of condensible impurities. It next was passed over zirconium turnings contained in furnace FI for further purification from gaseous impurities by the gettering action of zirconium. The turnings also served as a reservoir for storage of the large quantities of purified hydrogen needed for the experiments. Purification of helium, used for calibration, was accomplished in a parallel purification train consisting also of a trap, Tz, and a furnace, Fz. Furnaces F1 and Fz were operated at 800" whenever
(5) W. M. Albrecht, M. W. Mallett, and W. D. Goode, J. Electrochem. Soc., 105, 219 (1968); 106, 981 (1959). (6) 8. Komjathy, J . Less-Common Metals, 2,466 (1960). (7) 0. M. Katz and E. A. Gulbransen. "Columbium Metallurw," D; L. Douglass and F. W. Kunz, Ed., Interscience Publishers, New York, N. Y., 1961, pp 623-537. (8) P. Kofstad, W. E. Wallace, and L. J. Hyvonen, J. Amer. Chem. Soc., 81, 6016 (1969). (9) M. W. Mallett and B. G. Koehl, J. Electrochem. Soc., 109, 611 (1962) *
The Journal of Physical Chemistry
THERMODYNAMIC PROPERTIES IN THE SYSTEMS V-H, Nb-H, AND Ta-H 685
purification of either of the gases by gettering action was desired.
The system was evacuated by means of a mechanical forepump and a mercury diffusion pump. The vacuum obtained was generally 5 X Torr as read with the aid of a McLeod gauge.
An electric pot furnace was used for heating the liquid bath in which tube C (containing the hydrogen equilibration zone) was submerged. Above 350" lead was used for the bath; for lower temperatures Wood's metal was employed. Pot capacity was about 20 1. The temperature of the bath was controlled so that the temperature of the metal sample was held constant to within 0.5". A calibrated chromel-alumel thermo- couple was used for temperature measurements. It rested against the Vycor tube in the immediate vicinity of the specimen. The thermocouple was frequently recalibrated against tin, lead, zinc, antimony, and silver freezing point standards.
Procedure. A typical run was made as follows. A specimen of metal in foil form was accurately weighed and placed in a small porcelain crucible. The latter, along with the gas displacement rod, E, was enclosed within the Vycor tube, B, which was then attached to an auxiliary apparatus (not shown) and degassed at 800-900" until a vacuum of Torr was established. Following degassing, the specimen was saturated with hydrogen several times by repeated sorption and de- sorption. After the final desorption i t was quenched in vacuo to room temperature by immersion of the Vycor tube in cold water. Pretreated in this manner the metals exhibited distinctly increased absorption rates.
The evacuated reaction tube was then attached to the main apparatus as shown in Figure 1 after the fur- nace had been heated to the desired temperature, The effective residual volume surrounding the sample (ex- tending to mark a of manometer && and stopcock S for the higher pressure measurements or to mark a and the variable meniscus level of the left arm of manometer hir, for the low-pressure measurements) was determined by calibration with helium at each furnace temperature anticipated for the subsequent hydrogen P-C-T measurements. For this purpose purified helium was first admitted to the volume G where its pressure and temperature were measured. The gas was then transferred to the residual volume by simultaneously raising the mercury levels in the gas bulb G and in manometer MI up to mark a in the left arm thus using the apparatus essentially as a Toepler pump-
After the helium was removed, hydrogen (obtained by heating the turnings in furnace R) was admitted to the residual volume in a manner similar to that per- formed in the helium calibration. Equilibrium pres- sures were measured following each successive addition of hydrogen.
The uptake of hydrogen by the metal specimen was generally quite rapid, but an equilibration interval was allowed before taking pressure readings. The attain- ment of equilibrium was judged to be complete when the pressure remained constant to within the error of observation for a period of a t least 20 min. Tests with longer equilibration times established that this was a reliable criterion. The equilibration periods were, of course, temperature dependent. Thus, for tempera- tures above 400" equilibrium was achieved within 20 min; a t 300", however, an interval of 2 hr was neces- sary.
Immediately after the equilibration and measure- ments following the final hydrogen addition, a "desorp- tion" measurement was carried out as a test of thermo- dynamic reversibility. This was accomplished by removing a measured amount of hydrogen from the specimen by Toepler pumping and measuring the pres- sure after the reestablishment of equilibrium.
At the end of the determination of a given pressure os. composition isotherm the Vycor tube was closed off and disconnected from the apparatus by separation at the ball-socket joint. The metal specimen was then completely degassed in the auxiliary apparatus, quenched in vacuo to room temperature, and stored in preparation for the determination of another isotherm.
The composition of the solid solution after each suc- cessive equilibration (and pressure measurement) could be calculated from the net amount of hydrogen ab- sorbed (or desorbed) and the weight of the metal speci- men, Appropriate corrections were made for the gas remaining in the residual volume.
Materials. Niobium (99.8% pure) and tantalum (99.9% pure) were obtained from Fansteel Netallurgi- cal Corp. in the form of cold-rolled foil. The thickness of the niobium foil was 10 mils and of the tantalum foil 5 mils. Vanadium (99.5% pure), refined by the electron-gun process, was supplied in pellet form by the Vanadium Corp. of America; the pellets were flattened
Since, for a given system, a single metal specimen was used for all absorption experiments, accumulation of contaminants from gaseous impurities was a possibility. Therefore, the impurity content was assayed (by means of vacuum fusion analysis) in both the degassed specimens remaining from the experiments and in rep- resentative portions of the as-received metals. The results of these analyses, shown in Table I, indicate that the accumulation of impurities was not large.
Before use the metal foils were cut in strips approxi- mately Q in. wide. Specimen sizes were approximately 2.5 g for vanadium, 5 g for niobium, and 7 g for tan- talum. Results
to 5-10 mils.
Presentation of Data. The basic data for each of the three studies are sets of pressure-temperature-com-
Volume 7% Number S March 1960
686 EWALD VELECKIS AND RUSSELL K. EDWARDS
Table I : Gas Analysis Results for As-Received (a) and Used (b) Specimens of Vanadium, Niobium, and Tantaluma
-Gas content, ppm- Sainple 02 Nz Hi
Vanadium (a) 1360 43 4 (b 1 1460 39 2
(b) 487 5 4
Tantalum (a) 101 6 9 (b ) 228 8 9
Niobium (a) 233 0 . 5 23
a Vacuum fusion analyses performed by the Chemical Research Services, Inc., Addison, Ill.
position values. Because of the great bulk of data, they are only presented here graphically; however, they are also available in tabular form in a report.'O The graphs (Figures 2, 3, and 4) consist of families of iso- therms projected on the square root1' of hydrogen pres- sure vs. composition planes. The lines in Figures 2, 3, and 4 result from drawing smooth curves connecting the data points for each set of isothermal measurements. In the temperature ranges studied, all isotherms show monotonic increases of the hydrogen pressure with com- position. This indicates that each of the condensed hydrogen-metal systems has only a single homogeneous
Figure 3. Pressure isotherms for the system Nb-H: 0, absorption measurements; 0, desorption measurements.
phase region. It is evident that with increasing tem- peratures and the consequent lower solubilities of hydrogen in the metal, the isotherms progressively ap- proach linearity as is expected according to Sieverts' law. On the other hand, the isotherms become pro- gressively more curved with decreasing temperatures in a manner which suggests that a t still lower temperatures a miscibility gap would exist in the condensed systems.
The desorption data are also shown in the graphs. No evidence of hysteresis was observed in any case; thus the hydrogen-metal reactions appear to be re- versible. Because of the particular apparatus used, the hydrogen pressures were limited within the range 1-800 Torr. The error in the individual pressure measure- ments was estimated to be AO.2 Torr.
The relative partial molal entropies and enthalpies were derived from sets of data taken from the smooth curves of Figures 2, 3, and 4 at selected compositions (1 atom % intervals). A least-squares treatment of In d P ( T o r r ) = A + BT-' was performed to evaluate for each composition the parameters A and B which
(10) E. Veleckis and R. K. Edwards, Report AFOSR-1107 (available through the Clearinghouse for Federal Scientific and Technical In- formation, U. s. Department of Commerce, Springfield, Va., as AD- 282483). (11) At lower hydrogen concentrations it is generally expected that Sieverts' law is obeyed ;.e., -,@/NE = constant, where P is the hydro- gen pressure and N H is the atom fraction of hydrogen. This form of plotting is convenient since any nonlinearity of the plots provides a ready measure of the extent to which the solution deviates from Sieverts' law.
This report is essentially identical with ref 1.
The Journal of Physical Chemistry
THERMODYNAMIC PROPERTIES IN THE SYSTEMS V-H, Nb-H, AND Ta-H 687
2 5
20
15
10
5
" Figure 4. Pressure isotherms for the system Ta-H: 0, absorption measurements; 0, desorption measurements.
yield, respectively, the relative partial molal entropy ($13 - 1 / ~ X ' ~ 2 ) = R ( 1 n d m - A ) and enthalpy (BH - 1 / ~ H ' ~ 2 ) = RB for atomic hydrogen. The cor- responding integral quantities were derived, via the Gibbs-Duhem relation, from the relative partial molal quantities for hydrogen by a graphical evalua- tion of the integral12
"INni AXr = N M (XH - gXoH2)d("/NM) (1)
Here, AXf (X = S, H) is the entropy (or enthalpy) of formation of one gram-atom of solid solution at atom fraction NH from the solid metal and gaseous diatomic hydrogen (as an ideal gas) a t a pressure of 1 atm; likewise (.&I - 1/gXo~2) is the partial molal entropy (or enthalpy) of hydrogen atoms relative to gaseous diatomic hydrogen a t 1 atm.
To handle the familiar problem of integration of the entropy from the infinite dilution limit, Sieverts' law for hydrogen (and consequently Raoult's law for metal) was assumed to be applicable for the composition in- terval NH _< 0.01. Therefore, the contribution to the entropy of formation in the interval NH = 0 to N H =
0.01 was taken to be ~ ( S H - l / z S " ~ ~ ) ~ + R In (1 + x ) , where x is the value of N H / N ~ ~ a t NH = 0.01, and (BH - 1/ZS'H2)z is the particular value of the relative partial molal entropy of hydrogen a t the concentration repre- sented by x .
The use of Sieverts' law at compositions NH 5 0.01 is subject to some question since more detailed plots than those shown in Figures 2, 3, and 4 indicate that at the lower temperatures appreciable deviations from Sieverts' law occur eveninthis compo~itionrange.'~ To assess the possible error resulting from the Sieverts' law assumption, an alternative evaluation of (8, - 8 ' ~ ) ~ was carried out using data derived from a linear extrapolation to N H = 0 (with the slope corresponding to that a t the last observed point) of f l / N us. NHH plots. The discrepancy between the results for the two cases was <5%, i.e., well within the experimental error. Thus, barring extraordinary deviations in the region of extrapolation, the Sieverts' law assumption seems to be adequate.
The relative partial and integral entropies and en- thalpies for the three systems are listed as a function of composition a t 1 atom % intervals in Tables I1 and 111. The assigned errors are the 95% confidence limits.
The partial molal entropy and enthalpy of the metal relative to pure solid metal (aM - XoIII) are not listed since they can be readily calculated from the cor- responding partial quantities for hydrogen and the derived (eq 1) integral quantities by use of eq 2
AXr = NH(XH - '/zXOH,) + N M ( X M - Xox) (2)
The results from this study are discussed below along with other work in the literature. The quality of ex- perimentation in metal-hydrogen systems has im- proved in recent years to a level which merits a detailed comparison among related investigations. For the three systems studied comparisons are made in Figure 5 where the relative partial molal entropies, enthalpies (both taken as invariant with temperature), and free energies (calculated from the first two quantities for the arbitrary temperature, 400") are plotted against composition. Only those studies which are readily amenable to the extraction of thermodynamic results were used in the comparison.
The data for the 13 isotherms (246- 554') measured in the V-H system are shown in Figure 2. The thermodynamic data are summarized in Tables IIa and IIIa. The results are in good agree- ment (see Figure 5a) with those obtained by Kofstad and whose experiments were performed using vanadium of comparable purity. The free energy
V-H System.
(12) See, e.g. (a) 0. Kubaschewski, E. L. Evans, and C. B. Alcock, "Metallurgical Thermochemistry," Pergamon Press, Oxford, 4th ed, 1967, p 43 or (b) G. G. Libowitz, "The Solid-state Chemistry of Binary Metal Hydrides," W. A. Benjamin, Inc,, New York, N. Y., 1965, Chapter 4. (13) This observation supports the earlier findings of "complex be- havior in dilute solutions" by Kofstad, et al., for the Ta-H8 and V-H4 systems.
Volume Y% Number 9 March 1060
688 EWALD VELECKIS AND RUSSELL K. EDWARDS
Table 11: Entropy Data in the Systems V-H, Nb-H, and Ta-H
100"
0 1 2 3 4
5 6 7 8 9
10 11 12 13 14
15 16 17 18 19
20 21 22 23 24
25 26 27 28 29
30 31 32 33 34
35 36 37 38 39
(a) V-H - [#H - '/ZSaH21v
oal/deg g-atom of H - ASr,
oal/deg g-atom
- - m
4.33 f 0.22 5.94 1 0 . 1 6 6.89 f 0.15 7.54 rt 0.13
8.07 f 0.08 8.50 rt 0.06 8.89 f 0.05 9.21 1 0 . 0 5 9.51 f 0.05
0 0.023 1 0 . 0 0 2 0.074 f 0.003 0 . 1 3 9 f 0 0 . 0 0 4 0.211 f 0.005
0 .29110.006 0.375 f 0.007 0.463 f 0.007 0 .556f0 .008 0.652f0.009
9.77 f 0.06 0.751 f 0.010 10.00 f 0.07 0.852 f 0.011 10.25 f 0.07 0 . 9 5 6 1 0 . 0 1 1 10.45 1 0 . 0 8 1.06 f O . 0 1 10.67 rt 0.08 1.17 f O . 0 1
1 .31 f 0 . 0 3 1.42 f 0 . 0 3 1.54 f 0 . 0 3 1.66 f 0 . 0 3 1.78 1 0 . 0 4
1.91 2.04 2.16 2.30 2.43
2.57 2.71 2.85
f 0.04 f 0.04 f 0.05 f 0.05 -I: 0.05
1 0 . 0 8 1 0 . 0 8 f 0.08 . . . . . ,
. . , . . .
... . . .
. . . . . .
. . . . . .
. . . I . .
. . . . . .
. . . * . .
. . . . . .
. . . . . .
. . . . . .
curves of both studies superimpose throughout the entire composition range although the entropy and enthalpy curves diverge beyond the experimental error below NH Z 0.15.
The twelve isotherms obtained for the niobium-hydrogen system in the temperature range 352-671' are represented in Figure 3. The thermodynamic data are listed in Tables I Ib and IIIb.
The detailed comparison of the thermodynamic results of this study with other work reportedb-7 is made in Figure 5b. The free energy data are in excellent agreement with those of Katz and Gulbran-
Nb-H System.
sell7 and the generally good agreement with the data of Albrecht, et ~ l . , ~ over most of the composition range becomes excellent a t the more dilute concentrations.
The agreement in the entropies and enthalpies among these three studies is also quite satisfactory although the values obtained by Albrecht, et al., do not quite fall within the combined error limits. The re- sults of Katz and Gulbransen, which are in excellent agreement with this work over most of the composition range, show divergence at compositions N H 5 0.07. For instance, in this range, their (BH - 1/2H'~x2) vs. NH plot shows an abrupt change in slope. No such change was observed either by us or by Albrecht, et al.,
The Journal of Physical Chemistry
THERMODYNAMIC PROPERTIES IN THE SYSTEMS V-H, Nb-H, AND Ta-H 689
Table 111: Enthalpy Data in the Systems V-H, Nb-H, and Ta-H
lOONa
0 1 2 3 4
5 6 7 8 9
10 11 12 13 14
15 16 17 18 19
20 21 22 23 24
25 26 27 28 29
30 31 32 33 34
35 36 37 38 39
-(a) V-H -. - [ZH - '/zH0a21, kcal/g-atom of H
6.93 rfr 0.13 7.00 i 0.14 7.03 i 0.10 7.15 i 0.10 7.23 i 0.08
7.32 f 0.05 7.38 f 0.04 7.46 f 0.03 7.52 i 0.04 7.58 rt 0.03
7.61 1 0.05 7.68 f 0.05 7.75 f 0.04 7.79 f 0.05 7.85 rt 0.05
7.91 rt 0.05 7.98 f 0.05 8.02 i 0.06 8.06 rfr0.08 8.10 rt 0.07
8.14 f 0.08 8.19 i 0.07 8.25 f 0.11 8.30 i 0.09 8.38 i 0.09
8.45 f 0.10 8.52 1 0.18 8.59 rfr 0.19 8.62 f 0.17 8.62 f 0.22
8.61 i 0 . 2 2 8.64 f 0.19 8.49 rt 0.19 8.40 f 0.38 8.39 f 0.22
. . .
...
. . . * . . . . .
- AHi, kcal/g-atom
0 0.070 f 0.001 0.140 f 0.002 0 . 2 1 1 f 0 . 0 0 3 0.283 rt 0.004
1.28 i 0 . 0 2 1.36 1 0 . 0 2 1.45 f 0 . 0 2 1.54 f 0 . 0 2 1.64 1 0 . 0 3
1.73 r t 0 . 0 3 1.82 f 0 . 0 3 1.91 1 0 . 0 4 2.00 f O . 0 4 2.10 rfr0.04
2.19 1 0 . 0 5 2.29 i O . 0 5 2.38 f 0 . 0 6
. . .
. . .
. . .
. . .
. . .
. . .
. . .
. . .
. . .
. , .
. . . . . .
and the conclusion of Katz and Gulbransen that the change in M-H bond strength is "larger for the first small additions of hydrogen" does not seem to be war- ranted.
The nine isotherms obtained for the tantalum-hydrogen system in the temperature range 350-631' are represented in Figure 4. The thermody- namic data are listed in Tables I Ic and IIIc.
Comparison of the thermodynamic results of this study with those of other work is made in Figure 5c. The free energy data of Kofstad, et U Z . , ~ and of Mallett and KoehP are in excellent agreement with ours. The entropy and enthalpy data of the two studies diverge from ours beyond the experimental error. Since the
Tu-H System.
divergence is in opposite directions, our values are probably to be preferred.
Discussion In the simplest of the several theoretical models14
which have been used to describe metal-hydrogen sys- tems, i t is assumed that hydrogen atoms form solutions by entering interstitial positions within a perfect metal lattice.16 This assumption may be adequate for the systems V-H, Nb-H, and Ta-H (as well as Pd-H) since in these cases the hydrided materials have the
(14) See, e.g., G. G. Libowitz, J. Nucl. Mat., 2, 1 (1960). (16) A. L. G. Rees, Trans. Faraday Soc., 50,336 (1954).
Volume 79, Number 9 iMnrch lgfi.9
600 EWALD VELECKIS AND RUSSELL K. EDWARDS
(01 V - H (b) Nb-H
THIS STUDY - THIS STUDY --- KOFSTAD 8 WALLACE --- KATZ R GULBRANSEN ALBRECHT, GOODE R
KOMJATHY
- MALLETT -----
e-[
I
B - e x g
0 0
2o I
( c ) T a - H
- THIS STUDY --- KOFSTAD, WALLACE R HYVONEN
-.-a- MALLETT I KOEHL
t I
NH ”
, 0 0.1 0.2 0.3
NH
Figure 5 . Comparison of thermodynamic data with literature values for the systems V-H, Nb-H, and Ta-H. The free energies are calculated for 400’.
same crystal structures as their parent metals. Nmr studiesI6 of tantalum and vanadium hydrides have been interpreted’’ as indicating that hydrogen atoms are quite mobile within the lattice as would be appropriate for solution behavior. Thus this simple model was chosen to provide a mathematical framework for extrapolation of data toward lower temperatures where phase diagram features might be revealed.
According to the model chosen, the P-C-T rela- tionships can be represented by eq 316J8
dF = K [ r / ( s - r ) ] exp[(l/RT) X
( a l a r ) (W + WO)] (3)
where P is the hydrogen pressure, r is the H/M atom ratio, s is the number of sites available for hydrogen atoms in .the metal lattice per metal atom, W is the energy of hydrogen atoms dissolved in 1 gram-atom of metal with the reference state taken as that of free hydrogen atoms a t rest, Do is the dissociation energy of the hydrogen molecule in the ground state, and K is a
(16) R A. Oriani, E. McCliment, and J. F. Youngblood, J. Chem. Phys. , 27,330 (1957). (17) K. M. Mackay, “Hydrogen Compounds of the Metallio Ele- ments,” E. and F. N. Spon, Ltd., London, 1966, p 48. (18) .R. H. Fowler and E. A. Guggenheim, “Statistical Thermody- namics,” The University Press, Cambridge, 1956, Chapter XIII.
The Journal of Phgsical Chemiatrg
THERMODYNAMIC PROPERTIES IN THE SYSTEMS V-H, Nb-H, AND Ta-H 69 1
slowly varying function of temperature generally as- sumed to be constant over the temperature ranges involved.
Equation 3 being an equivalent form of the expression for the relative partial molal free energy of hydrogen, (8, - ' / ~ G O H J = RT In dF, can be conveniently sepa- rated into its entropy and enthalpy components
( 8 ~ - BLS'H~) = -R{ln K + In [ r / ( s - r ) ] ) (4)
(BH - BH'Hz) = (d/dr) (w + (r/a)DO) ( 5 )
From the observed entropy data (Table II), the values of parameters K and s were computed by the Newton-Raphson successive approximation methodIg in which assumed values were statistically adjusted to provide the best fit to eq 4. For the analysis of the relative partial molal enthalpy, eq 5 was expressed as
2-4
(8, - JHoH2) = Airi (6) i-0
where Ai's are the interaction energy parameters. A quartic polynomial was required to fit the enthalpy data (Table 111) adequately, although, in the case of the Pd-H system polynomials of only twozo or threez1 terms have proven to be satisfactory. Calculated values of the parameters K , s, and Ai are listed in Table IV.
Table IV : Parameters of Eq 7 and Critical Constants in the Systems V-H, Nb-H, and Ta-H
V-H N b-H Ta-I1
K, atm1/2 80 1 s 0.779 Ao, cal/g-atom
A I , cal/g-atom
A*, cal/g-atom
At, cal/g-atom
Ad, cal/g-atom
ro 0.21 t o , OC 51
of H -6.93 X 10⁸
of H -6.50 X 10'
of H 5.09 X 10'
of H -1.51 X 10⁸
of H 9.57 x 10s
P,, Torr 9.0 x 10⁻⁴
1024 0.904
-8.43 X 10'
-7.95 x 10⁸
1.76 x 10⁴
-3.84 x 10⁴
3.22 x 10⁴ 0.37
5 .2 x 183
760 0.702
-8.05 X 10'
-6.62 X 10³
1.66 x 10⁴
-3.39 x 10⁴
3.37 x 10⁴ 0.20
4 .2 X lo-" - 59
Combination of eq 3, 5, and 6 gives the semiempirical equation
where P is the hydrogen pressure in atmospheres and R, the gas constant, is 1.987 cal/deg g-atom of H. With the listed parameters i t permits the calculation of the P-C-T relationships for the systems V-H, Nb-H, and Ta-H for the temperature and composition range
of the experiments. The families of isotherms in Figures 2, 3, and 4 can be reproduced generally within -3% and with a maximum discrepancy of -10% in P except for the steepest portions of the two lowest temperature isotherms in the V-H system where the error reaches -200/,. It seems reasonable that eq 7 will retain its validity to both higher and lower tem- peratures.
The equation was therefore used to extend the P-C- T relations to lower temperatures where hydrogen pres- sure measurements are impractical. The critical compositions, temperatures, and pressures were cal- culated (also listed in Table IV) from eq 7 and from the two additional equations that characterize the critical
50
0
I I Y \ \ \ R \ I
-60
- 80
-100 0.1 0.2 0.3 0.4
" Figure 6.
, from Nb-H, and Ta-H: - , calculated from eq 7; - - - 25, 24, and 26, respectively.
Phase diagrams and isobars for the systems V-H,
(19) J. B. Scarborough, "Numerical Mathematical Analysis," 4th ed, The Johns Hopkins Press, Baltimore, Md., 1958. (20) J. R. Lacher, PTOC. Roy. Soc., A161, 525 (1937). Lacher used W = - EHT - (&H/S)r2, where EH is the molal energy of hydrogen atoms and E" is the nearest-neighbor molal interaction energy. Substitution of this expression into eq 3 gives what i s widely known as Lacher's formula. (21) A Harasima, T. Tanaka, and K. Sakaoku, J. Phys. SOC. Jap., 3, 208 (1948).
Volume 75, Number 3 March 2960
692 EWALD VELECKIS AND RUSSELL K. EDWARDS
point, i.e.
[ (d In d p ) /d‘r]TO = 0; [ ( dZ In 1/F/df2) ]To = 0 (8)
Comparison of these critical constants with those from another evaluation (Albrecht, el aL6) can be made for the case of Nb-H systems. These investigators used both X-ray and hydrogen pressure data to obtain rc = 0.3, to = 140°, and P, = 0.01 Torr with which our results are in good agreement.
Equation 7 was also used to estimate the boundaries of the region in which the metal phase, a, coexists a t equilibrium with the hydride phase, a’. Throughout this region the hydrogen pressure isotherms derived from eq 7 assume sigmoidal shapes characteristic22 of phase instability. For the systems a t equilibrium the sigmoid regions must, of course, be replaced by horizon- tal lines. These were evaluated by making use of the equal area rule.2a The terminal intersections of the horizontal lines with the derived isotherms define the boundaries of the (a + a’) coexistence regions. The conventional temperature os. composition diagrams (ie., projections of the boundary points on the t vs. N E plane) constructed by this method are shown in Figure 6. Also shown are some representative isobars as calculated from eq 7.
For the Nb-N system a complete phase diagram was recently determined by Walter and Chandlerz4 by hot- stage X-ray diffraction and differential thermal analysis. Their diagram is shown for comparison in Figure 6 (dashed lines). Except for minor discrepancies a t the higher temperatures, there is exceptionally good agree- ment between our calculated and their experimental boundaries in the (a + a‘) region. A more complicated theoretical model, such as that proposed by Rees,I6 subdividing the sites available for hydrogen occupancy into statistical classes, would have been required to have provided an adequate framework for an equation capable of predicting the second two-phase field (a’ + p). The isobars sketched in Figure 6 in the (a + P ) , (a’ + p) , and P-phase regions are invalid since the exist-
ence of the B phase was not recognized by the model used.
Directly determined phase diagrams for the V-H and Ta-H systems are not well defined, but those available are shown in Figure 6 (dashed lines) for comparison. The tentative diagram obtained from X-ray diffraction etudies a t temperature has been presented by Maeland26 for the V-H system. The two-phase region predicted by our calculations is confirmed by Maeland’s diagram although the agreement of the boundary compositions is not good. For the Ta-H system Waite, Wallace, and Craigz6 have constructed a composite phase dia- gram using the heat capacity data of KelleyZ7 and their own X-ray diffraction and electrical resistance results. Here again the two-phase field which we predict is confirmed but the agreement of the boundary composi- tions is poor.
A comment is in order on the magnitude of the param- eter s. The values listed in Table IV do not nec- essarily represent actual solubility limits as might be inferred from eq 7. Higher hydrogen concentrations have been obtained by use of more severe hydriding conditions.28 The implication in eq 7 results from the simplicity of the model used.
Acknowledgments. Financial support of the ONR and AFOSR during the course of this study is gratefully acknowledged. The authors wish to thank the Chemi- cal Engineering Division of Argonne National Labora- tory for the support during the preparation of the man- uscript.
(22) Reference 18, p 558. (23) Reference 18, p 315. (24) R, J. Walter and W. T. Chandler, Trans. Met. SOC. AIME, 233, 762 (1965). (26) A. J. Maeland, J. Phys. Chem., 68, 2197 (1964). (26) T. R. Waite, W. E. Wallace, and R. 8. Craig, J. Chem. Phys., 24, 634 (1966). (27) K. K. Kelley, ibid., 8, 316 (1940). (28) A. J. Maeland, T R. Gibb, Jr., and D. P. Schumacher, J. Amer. Chem, Soc., 83, 3728 (1961).