DAVI ÉBER SANCHES DE MENEZES Thermodynamic study on gas hydrates: experimental determination of equilibrium data by high-pressure microcalorimetry and modeling up to 100 MPa. São Paulo 2020
Transcript
DAVI ÉBER SANCHES DE MENEZES
Thermodynamic study on gas hydrates: experimental
determination of equilibrium data by high-pressure microcalorimetry and
modeling up to 100 MPa.
São Paulo
2020
DAVI ÉBER SANCHES DE MENEZES
Thermodynamic study on gas hydrates: experimental
determination of equilibrium data by high-pressure microcalorimetry and
modeling up to 100 MPa
Revised Version
Thesis presented to the Polytechnic School
of the University of São Paulo, to obtain the
degree of Doctor of Science.
Concentration area:
Chemical Engineering
Advisor:
Dra. María Dolores Robustillo Fuentes
São Paulo
2020
Autorizo a reprodução e divulgação total ou parcial deste trabalho, por qualquer meioconvencional ou eletrônico, para fins de estudo e pesquisa, desde que citada a fonte.
Este exemplar foi revisado e corrigido em relação à versão original, sob responsabilidade única do autor e com a anuência de seu orientador.
São Paulo, ______ de ____________________ de __________
Assinatura do autor: ________________________
Assinatura do orientador: ________________________
Catalogação-na-publicação
Menezes, Davi Eber Sanches Thermodynamic study on gas hydrates: experimental determination ofequilibrium data by high-pressure microcalorimetry and modeling up to 100MPa / D. E. S. Menezes -- versão corr. -- São Paulo, 2020. 269 p.
Tese (Doutorado) - Escola Politécnica da Universidade de São Paulo.Departamento de Engenharia Química.
1.Equilíbrio Polifásico 2.Microcalorimetria de Alta Pressão 3.Hidratos deGás 4.Entalpia de Dissociação 5.Inibidores de Hidratos I.Universidade de SãoPaulo. Escola Politécnica. Departamento de Engenharia Química II.t.
To my beloved father. (in memorian)
ACKNOWLEDGEMENTS
First I must thank God, the one who has given me life, health and strength during
hard times. To his Son, by whom I began this work and could conclude it.
I also owe thanks to people who supported me in many ways throughout my work:
Dr. María D. Robustillo Fuentes for being my advisor and doing so in an excellent
manner. I thank Dr. Pedro de Alcântara Pessôa Filho for all the time he spent helping
me with thermodynamics and other issues. These helpful and understanding mentors
motivated me and facilitated the development of this research.
Dr. Amadeu K. Sum (Colorado School of Mines, USA) and Dr. Arnaud Desmedt
(Université de Bordeaux, France) for the great opportunity to extend my work in their
laboratories. The knowledge I gained through them has unquestionably improved my
technical and personal skills. To Aline Melchuna, Xianwei Zhang, Yue Hu, Jeong-Hoon
Sa, Claire Pétuya-Poublan and Morgane Lemaire. All of these colleagues from abroad
were of great disposition and vital to my research.
The faculty and grad students in the Chemical Engineering Department from
Polytechnic School at the University of São Paulo for the time we spent together.
Thanks to all my friends. They brightened my academic life even more and
provided me with pleasant times during breaks and weekends.
To my family for all the love and support they gave during these times, specially
my father, who passed away in the first year of my doctorate.
Finally, I thank to FAPESP (Fundação de amparo à pesquisa de São Paulo) for
financial support I received in Brazil and abroad (processes: 2017/01351-2,
2015/23148-9, 2014/02140-7 and 2014/25740-0). All the requests approved by the
agency were essential to the completion of this work.
ABSTRACT
MENEZES, D.E.S. Thermodynamic study on gas hydrates: experimental
determination of equilibrium data by high-pressure microcalorimetry and
modeling up to 100 MPa. 2020. 265 f. DSc. Thesis – Chemical Engineering,
Polytechnic School, University of São Paulo, São Paulo, 2020.
Clathrate hydrates are crystalline structures formed by water molecules linked through
hydrogen bonds. Regarding gas hydrates, the crystalline lattice hosts low molecular
weight gases inside the cavities known as “cages”. These compounds are formed at
low temperature and high pressure conditions, such as those characteristic of deep
water regions. Many efforts have been made in research to avoid the formation of these
structures during oil and gas exploitation and transport, as these compounds may clog
the flowlines. Moreover, current studies are aimed at exploiting natural reservoirs of
gas hydrates as an alternative energy resource or using them for capture and
sequestration of carbon dioxide, among others. However, the technology and
techniques required to extract them commercially are not yet available. For that
purpose, a good knowledge about their thermodynamic equilibrium is needed to predict
the conditions that may favor, delay or inhibit the formation of these structures.
Nevertheless, few experimental data of gas hydrate dissociation over 20 MPa are
found in the literature to assess the reliability of thermodynamic models and improve
their accuracy due to the instrumental limitations at extreme conditions. In this context,
this work presents new data up to 100 MPa obtained by High-Pressure micro
Differential Scanning Calorimetry (HP-µDSC), a relatively new technique of analysis
whose application on gas hydrates studies is currently growing. Temperatures of
dissociation are shown for single and double hydrates and compared to computational
predictions from commercial software packages (CSMGem and Multiflash). Enthalpies
of dissociation were estimated for CH4, C2H6 and CO2 single hydrates through the
integration of dissociation curves from thermograms and compared to the results
obtained by applying the Clapeyron equation. No data has been found so far in the
literature for enthalpies of dissociation of ethane and carbon dioxide hydrates at the
pressure and temperature ranges addressed in this work. Double hydrates composed
of CH4-C2H6, CH4-C3H8 and CH4-CO2 were also studied, and the dissociation
temperature profiles are discussed considering the occupancy degree of cages,
according to the gas phase composition, and the existence of empty cavities. In
systems composed of CH4-C3H8-H2O, a secondary structure, likely metastable
methane hydrate, was unexpectedly formed along with the methane-propane hydrate,
emphasizing the importance of the experimental study. Moreover, experiments based
on the isochoric method using a PVT cell and Raman spectroscopy analyses were
performed to complement the results found by microcalorimetry. Finally, methanol and
imidazolium-based ionic liquids were evaluated as methane hydrate inhibitors.
Although methanol has shown better efficiency in mass fraction terms, the ionic liquids
usually present a dual inhibition effect when used at appropriate concentrations, with
respect to the thermodynamic and kinetic behavior of gas hydrates.
Keywords: High-pressure microcalorimetry (HP-µDSC). Gas hydrates. Equilibrium
data. Enthalpy of dissociation. Hydrate inhibitors.
RESUMO
MENEZES, D.E.S. Estudo termodinâmico em hidratos de gás: determinação
experimental de dados de equilíbrio por microcalorimetria de alta pressão e
modelagem até 100 MPa. 2020. 265 f. Tese de Doutorado em Ciências (Engenharia
Química) – Escola Politécnica, Universidade de São Paulo, São Paulo, 2020.
Hidratos de clatratos são estruturas cristalinas formadas por moléculas de água
ligadas através de ligações de hidrogênio. No caso dos hidratos de gás, a rede
cristalina hospeda moléculas de gás de baixo peso molecular dentro de cavidades
conhecidas como "gaiolas". Esses compostos são formados em condições de baixas
temperatura e altas pressões, como em regiões de águas profundas. Muitas
pesquisas têm sido realizadas a fim de evitar a formação dessas estruturas durante a
exploração e transporte de petróleo e gás, visto que esses compostos podem obstruir
os oleodutos. Além disso, estudos mais recentes têm como objetivo explorar
reservatórios naturais de hidratos de gás como um recurso alternativo de energia ou
utilizá-los para captura e armazenamento de dióxido de carbono, entre outros. No
entanto, a tecnologia e as técnicas necessárias para extraí-los comercialmente ainda
não estão disponíveis. Considerando tais aplicações, é necessário um profundo
conhecimento sobre o equilíbrio termodinâmico dos hidratos de gás, de modo a prever
as condições que favorecem, retardam ou inibem a formação dessas estruturas.
Contudo, poucos dados experimentais de dissociação de hidratos de gás são
encontrados na literatura acima de 20 MPa, devido a limitações de equipamentos em
condições extremas. Nesse contexto, este trabalho apresenta dados inéditos de
dissociação até 100 MPa através de uma configuração experimental baseada na
microcalorimetria de alta pressão (HP-µDSC), uma técnica relativamente recente que
vem sendo cada vez mais aplicada em estudos de hidratos de gás. Temperaturas de
dissociação são apresentadas para hidratos simples e compostos, e comparadas com
predições computacionais a partir de softwares comerciais (CSMGem e Multiflash).
Entalpias de dissociação foram estimadas para hidratos simples de CH4, C2H6 e CO2
por meio de integração das curvas de dissociação nos termogramas gerados, e
comparadas com cálculos aplicando a equação de Clapeyron. Nenhum trabalho foi
encontrado na literatura até então que reportasse entalpias de dissociação de hidratos
de etano e dióxido de carbono nas condições de pressão e temperatura abordadas
nesse trabalho. Hidratos duplos de CH4-C2H6, CH4-C3H8 e CH4-CO2 também foram
estudados, e os perfis de temperatura de dissociação são discutidos considerando o
grau de ocupação das gaiolas, de acordo com a composição da fase gasosa, e a
existência de cavidades vazias. No sistema composto por CH4-C3H8-H2O, uma
estrutura secundária de hidrato, provavelmente metaestável e constituída por metano,
foi formada simultaneamente com o hidrato duplo de metano-propano, embora não
prevista por simulações, o que ressalta a importância do estudo experimental. Além
disso, experimentos usando o método isocórico em célula PVT e análises por
espectroscopia Raman foram realizadas e complementam os resultados encontrados
por meio da microcalorimetria. Finalmente, metanol e dois líquidos iônicos à base de
imidazólio foram avaliados como inibidores de hidrato de metano. Embora o metanol
tenha mostrado melhor eficiência em frações mássicas, os líquidos iônicos
apresentam um efeito duplo de inibição quando em concentrações adequadas, com
relação a abordagem termodinâmica e cinética dos hidratos de gás.
Palavras-chave: Microcalorimetria de alta pressão (HP-µDSC). Hidratos de gás.
Dados de equilíbrio. Entalpia de dissociação. Inibidores de Hidratos.
LIST OF FIGURES
1.1 Illustration of a phase diagram for a gas hydrate-forming system………. 29
1.2 Phase diagram for the methane-water system obtained using the software CSMGem………………………………………………………….. 30
2.1 Main transitions observed in thermograms obtained by HP-μDSC.…… 51
2.2 Calorimetric transducer of µDSC7 Evo apparatus (SETARAM)……….. 52
2.3 High-pressure cells used in microcalorimetric experiments…………….. 53
2.4 Experimental setup employed for gas hydrates studies based on high-pressure microcalorimetry……………………..………………..…………. 54
2.5 Calibration of pressure for isochoric experiments in the HP-µDSC…….. 55
2.6 Methodology applied to microcalorimetric analyses: A) Temperature profile throughout the analysis; B) Thermogram indicating usual transitions occurring during the analysis (…) ……...…………………….. 57
2.7 Determination of onset, peak and endset values for the CH4-C3H8 hydrate dissociation curve (sII, 39.3 MPa) using the data processing software Calisto (SETARAM)……………………………………………… 57
2.8 Establishment of baseline for calculating enthalpy of hydrate dissociation ………………………..…………………….………………….. 60
2.9 Illustration of the multicycle method for higher conversion of ice to gas hydrate……………………………………………………………………….. 68
2.10 Ultra-High-Pressure System used to analyze hydrates through the PVT-isochoric method…………………...……………………………….… 71
2.11 Commercial gas cylinder joined to the gas booster……………………… 72
2.12 Swagelok cylinder used for homemade gas mixtures (methane + propane) (A) and high-performance balance (B)………………………… 72
2.13 Thermodynamic parameters calculated for gas transfer from the mixing cylinder to the PVT cell……………………………………………………… 73
2.14 Experimental stages followed in a methane hydrate analysis through the isochoric method in the PVT cell……………………………….……… 75
2.15 Temperature and pressure profiles obtained for a methane-water system through the PVT - isochoric method …..…………………………. 75
2.16 Light scatterings involved in Raman spectroscopy……………………… 76
2.17 Trajectory of the radiation along the Raman spectrometer (Labram UV) 77
2.18 Pumps employed for the preparation of gas mixtures and pressurization of the hydrate-forming systems A) Isco (260 cm3); B) Top Industrie (100 cm3).......................................................................... 78
2.19 Schematic illustration of methane-propane mixtures preparation……… 79
2.20 High-Pressure cell used to prepare ex-situ gas hydrate samples……… 80
2.21 Optical cell (Linkam) used in the Raman spectroscopy of gas hydrates prepared ex-situ……………………………………………………………... 80
2.22 Setup for Raman spectroscopy measurements of samples prepared ex-situ…………………………………………………………………..……. 81
2.23 Capillary cell (Linkam CAP500) used for in situ analysis of gas hydrates.. 81
2.24 Illustration of the sample settled on the capillary cell (Linkam CAP500).. 82
2.25 Cylindrical cell (Linkam THMS600) used for in situ analyses of gas hydrates……………………………………………………………………… 83
2.26 Scheme of Raman spectroscopy analyses by placing the cell (THMS600) vertically……………………………………………...………... 83
3.1 Vapor-liquid equilibrium lines (Aspen) for single gases and their
3.2 Schematic illustration of possible phases during injection, pressurization and analysis performed by HP-µDSC……………………. 90
3.3 Thermodynamic envelopes for CH4-C2H6 gaseous mixtures (…) ……… 91
3.4 Thermodynamic envelopes for CH4-C3H8 gaseous mixtures (…) …..…. 91
3.5 Thermodynamic envelopes for CH4-CO2 gaseous mixtures (…) ………. 92
3.6 Influence of water content on dissociation temperature of of single hydrates composed of CH4 (A), C2H6 (B), C3H8 (C) and CO2 (D)………. 93
3.7 Influence of water content on dissociation temperature of double hydrates (10 mol% CH4): CH4-C2H6 (A), CH4-C3H8 (B) and CH4-CO2 (C)…………... 94
3.8 Influence of water content on dissociation temperature of double hydrates (90 mol% CH4): CH4-C2H6 (A), CH4-C3H8 (B) and CH4-CO2 (C)………….. 95
3.9 (A) Methane densities by Peng-Robinson equation and from NIST; (B) Relative deviations of methane densities…………………………………. 96
3.10 (A) Methane-propane densities by Peng-Robinson equation and reported by Sage et al. (1934); (B) Relative deviations of methane-propane densities…………………………………………………………… 97
3.11 Resultant heat flow on the calorimetric thermograms…………………… 98
3.13 Teflon transitions that occur in the sample and reference cells during heating in HP-µDSC analyses …………………………………………...... 99
4.1 Heating thermograms of the CH4-H2O system at 1 K·min-1 and at
different pressures (A). Ice melting and hydrate dissociation are expanded in B and C figures, respectively……………………………...… 106
4.2 Dissociation data of CH4 hydrates obtained by HP-µDSC at 1 K·min-1 (…) 107
4.3 Overlapping of ice melting and CH4 hydrate dissociation curves at low pressures…………………………………………………………..………... 111
4.4 Thermograms of cooling (A) and heating (B) indicating the effect of water sample size on the ice / CH4 hydrate formation and dissociation, respectively……….…………………………………………………………. 112
4.5 Effect of the heating rate on the onset data corresponding to CH4 hydrate dissociation curves (A) and their respective absolute deviations (B)……. 115
4.6 Effect of the heating rate on the peak data corresponding to CH4 hydrate dissociation curves (A) and their respective absolute deviations (B)……. 115
4.7 Effect of the heating rate on the endset data corresponding to CH4 hydrate dissociation curves (A) and their respective absolute deviations (B)……… 115
4.8 Absolute deviations of onset temperatures with respect to predictions for CH4 hydrates (…) ……………………………………………………….. 117
4.9 Thermograms of CH4 hydrates dissociation by the multicycles method.. 118
4.10 Effect of H2O sample size on the dissociation of CH4 hydrates by multicycles at 20 MPa………………………………………………………. 119
4.11 Effect of H2O sample size on the conversion of ice to CH4 hydrate throughout 22 cycles at 20 MPa…………………………………………… 119
4.12 Effect of pressure on the ice conversion to CH4 hydrate: A) 56.6 mg of water and B) 64.6 mg of water…………..…………………………………. 120
4.13 Hydration number (n) for CH4 hydrates calculated through the iterative method (standard and multicycles methods) and by using CSMGem predictions…………………………………………………………………… 122
4.14 Enthalpies of CH4 hydrates dissociation determined by the Clapeyron equation based on experimental data: A) standard method; B) multicycles method………………………………..………………………… 123
4.15 Enthalpies of CH4 hydrates dissociation determined by the integration of curves from calorimetric thermograms: A) standard method; B) multicycles method….………………………………………………………. 123
4.16 Absolute deviations between enthalpies of CH4 hydrate dissociation by the Clapeyron equation and through the integration of the hydrate dissociation curve: A) standard method; B) multicycles method……….. 124
4.17 Thermograms of the C2H6-H2O system at 1 K·min-1 (A) and 0.2 K·min-
1 (B). The pressure applied in this analysis was 3 MPa………………….. 126
4.18 Heating thermograms of the C2H6-H2O system at 1 K·min-1 and at different pressures………………………………………………………….. 126
4.19 Dissociation data of C2H6 hydrates obtained by HP-µDSC at 1 K·min-1. 127
4.20 Absolute deviations of onset temperatures with respect to predictions for C2H6 hydrates (…) ………………………………………………………. 128
4.21 Thermograms of C2H6 hydrates dissociation by the multicycles method. 129
4.22 Ice conversion to C2H6 hydrate throughout multicycles. The analyses were influenced by both effects of pressure and H2O sample size…….. 130
4.23 Hydration number (n) for C2H6 hydrates calculated through the iterative method (standard and multicycles methods) and by applying CSMGem predictions…………………………………………………………………… 132
4.24 Enthalpies of C2H6 hydrates dissociation determined by the Clapeyron equation based on experimental data: A) standard method; B) multicycles method………………………………………………………….. 132
4.25 Enthalpies of C2H6 hydrates dissociation determined by the integration of curves from calorimetric thermograms (multicycles method): A) 𝑛 from CSMGem predictions; B) 𝑛 from the iterative method…………….. 133
4.26 Absolute deviations between enthalpies of C2H6 hydrate dissociation calculated by the Clapeyron equation and through the integration of the hydrate dissociation curve (multicycles method)………………………… 133
4.27 Dissociation data of CO2 hydrates obtained by HP-µDSC (…) ..………. 135
4.28 Heating thermograms of the CO2-H2O system at 1 K·min-1 and at different pressures………………………………………………………….. 136
4.29 Absolute deviations of dissociation temperatures with respect to predictions for CO2 hydrates……………………………………………….. 137
4.30 Thermograms of CO2 hydrate dissociation by the multicycles method.... 138
4.31 Effect of pressure on the ice conversion to CO2 hydrate: A) 48.9 mg of water and B) 53.4 mg of water…….……………………………………….. 139
4.32 Hydration number (n) for CO2 hydrates calculated through the iterative method: A) standard method; B) multicycles method (…) ……………... 140
4.33 Enthalpies of CO2 hydrates dissociation by the Clapeyron equation based on experimental data: A) standard method; B) multicycles method (…) …. 141
4.34 Enthalpies of CO2 hydrates dissociation determined by the integration of curves from calorimetric thermograms obtained by the multicycles method……………………………………………………………………….. 142
4.35 Absolute deviations of CO2 dissociation enthalpies calculated by the Clapeyron equation and integration of curves from thermograms……… 142
5.1 Cross-sections of ternary phase diagrams at constant water fractions.
The temperature profiles are similar, following either trajectory..………. 152
5.2 Dissociation data of CH4-C2H6 hydrates obtained by HP-µDSC at different methane concentrations (…) ……………………………………. 155
5.3 Ovelapping transitions in thermograms, evidencing the heterogeneity of CH4-C2H6 hydrate structures…………………………… 156
5.4 Ternary diagrams of dissociation temperatures of CH4-C2H6 hydrates... 158
5.5 Dissociation temperature profiles of CH4-C2H6 hydrates according to the gas phase composition (…) …………………………………………… 159
5.6 Evolution of the cages occupancy for sI hosting CH4 (blue) and C2H6 molecules (yellow) as methane fraction increases….…………………… 160
5.7 Evolution of the cages occupancy for sII hosting CH4 (blue) and C2H6 (yellow) molecules as methane fraction increases………………………. 160
5.8 Thermograms of CH4-C3H8 hydrates (20 MPa) at different gas phase compositions………………………………………………………………… 162
5.9 Thermograms of CH4-C3H8 hydrates (87.5 mol% CH4) at different pressures………………………………………………….…………………. 163
5.10 Dissociation data of CH4-C3H8 hydrates obtained by HP-µDSC at different methane concentrations (…) ……………………………………. 165
5.11 Evolution of absolute deviations (AD) of onset temperatures corresponding to sII (CH4-C3H8)…………………………………………… 166
5.12 Heat absorbed during ice melting and CH4-C3H8 hydrate dissociation according to the pressure…………………………………………………... 167
5.13 Dissociation temperature profiles of CH4-C3H8 hydrates according to the gas phase composition (…) …………………………………………… 167
5.17 Ternary diagrams of dissociation temperatures of CH4-C3H8 hydrates... 168
5.15 Evolution of the cages occupancy for sII hosting CH4 (blue) and C3H8 molecules (green) as methane fraction increases…..…………………… 169
5.16 Dissociation data of CH4-CO2 dioxide hydrates obtained by HP-µDSC at different methane concentrations (…) …………………………………. 172
5.17 Overlapping transitions in HP-µDSC thermograms, evidencing the heterogeneity of CH4-CO2 hydrate structures (3 mg H2O)………………. 173
5.18 Influence of H2O sample size on the hydrate fraction (…) ……………… 173
5.19 Dissociation temperature profiles of CH4-CO2 hydrates according to the gas phase composition (…) ...……………………………………………... 174
5.20 Ternary diagrams of dissociation temperatures of CH4-CO2 hydrates… 175
5.21 Evolution of the cages occupancy for sI hosting CH4 (blue) and CO2 molecules (purple) as methane fraction increases.……………………… 146
5.22 Dissociation temperature profiles of CH4-C2H6-C3H8 hydrates according to the ethane-propane ratio. Each plot presents a constant fraction of methane.………………………….……………………………… 177
5.23 Ternary diagrams of dissociation temperatures of CH4-C2H6-C3H8 hydrates………………………………..…………………………………….. 178
5.24 Equilibrium lines for CH4, C2H6 and C3H8 single hydrates………………. 179
5.25 Structural deformation of small cavities from sII due to the absence of methane molecules (…) ……………………………………………………. 180
5.26 Evolution of the cages occupancy for sII hosting CH4 (blue), C2H6 (yellow) and C3H8 molecules (green) as ethane fraction increases……. 180
5.27 Evolution of the cages occupancy for sI hosting CH4 (blue) and C2H6 molecules (yellow) as ethane fraction increases……….………………… 180
6.1 Dissociation data of CH4 hydrates by PVT-isochoric method and microcalorimetry (…) ……………………………………………….………. 188
6.2 Effect of cooling degree (CD) on the equilibrium point and the amount of methane hydrate formed………..……………………………………….. 190
6.3 Effect of mixing on the single methane hydrate-forming system……….. 191
6.4 Dissociation data of CH4-C3H8 hydrates (92 mol% CH4) by the PVT-isochoric method and microcalorimetry (…) ……………………………… 192
6.5 Equilibrium data obtained by the PVT-isochoric method at different compositions (…) …………………………………………………………… 193
6.6 Phenomenon of recrystallization just before the dissociation of sII in the CH4-C3H8 system at 67.7 MPa (92 mol% CH4)………………………….... 194
6.7 Diagram P vs T for the system CH4-C3H8-H2O (92 mol% CH4) by the PVT-isochoric method (…) ...………………………………………………. 195
6.8 Dissociation profiles of CH4-C3H8 hydrate-forming systems (92 mol% CH4) at different heating rates by the PVT-isochoric method (…) …….. 196
6.9 Thermograms of CH4-C3H8 hydrates (92.1 mol% CH4, 67 MPa) at different heating rates………………………………………………………. 197
6.10 Effect of stirring on the dissociation profiles of CH4-C3H8 hydrates (92 mol% CH4) by the PVT-isochoric method, initially at 70 MPa (…) ……… 198
6.11 Effect of stirring on the dissociation profile of CH4-C3H8 hydrate (92 mol% CH4) by the PVT-isochoric method, initially at 105 MPa (…) ……. 199
6.12 Effect of multiple cycles heated up to ice melting, on CH4-C3H8 system at 67.7 MPa (92.3 mol% CH4) by microcalorimetry (…) …….…………… 200
6.13 Effect of multicycles heated up to sI dissociation on CH4-C3H8 system at 68 MPa (92.1 mol% CH4) by microcalorimetry (…) …………..………. 201
6.14 Effect of multicycles on the dissociation profile for CH4-C3H8 hydrate (92 mol% CH4) by the PVT-isochoric method (…) ………………………. 203
6.15 Effect of gas phase composition on dissociation profile of CH4-C3H8 hydrates (…) ………………………………………………………………… 205
6.16 Effect of gas phase composition on CH4-C3H8 hydrate at 67.5 MPa by microcalorimetry (…) ………………………………………………….……. 206
7.1 Deconvolution of the peaks related to the CH4 molecules trapped in
large and small cavities of structure I……………………………………… 214
7.2 Raman spectra of single CH4 and C3H8 hydrates: assigned peaks for characterization of double hydrates……………………………………….. 215
7.3 Raman spectra of CH4-C3H8 hydrate samples prepared under different gas compositions……………………………………………………………. 216
7.4 Deconvolution of the peaks from the CH4-C3H8 hydrate (79.8 mol% CH4 in gas phase) formed at 8.7 MPa………………………………………….. 216
7.5 Ratios between intensities of Raman bands corresponding to propane (PA and PB) and methane (MA and MB) in CH4-C3H8 hydrates with different gas compositions…………………………………………………. 217
7.6 Gas hydrate growth towards the aqueous phase in capillary cell visualized through the microscope coupled to the Raman spectrometer. Time elapsed after the first visually observed hydrate crystals: A) 2 min; B) 2min 17s; C) 3min 5s……………………….……… 218
7.7 Raman spectra of CH4 hydrate (20 MPa) at different axial positions in the capillary cell…………….……………………………………………….. 219
7.8 Visual inspection of CH4 hydrate formation and growth in the cylindrical cell…………………………………………………………..………………... 220
7.9 Raman spectra of CH4 hydrate in the cylindrical cell at 16.4 MPa……… 221
8.1 Cooling (A) and heating (B) thermograms of hydrate-forming systems
composed of 5 mol% [BMIM][Br] at different pressures (…) …………… 228
8.2 Effect of ionic liquid concentration on CH4 hydrate formation and dissociation (20 MPa): A) Ionic liquid based on [BMIM][Br]; B) Ionic liquid based on [BMIM][Cl]…………..……………………………………... 229
8.3 Dissociation peak of CH4 hydrate in the presence of [BMIM][Cl] at 10% wt. and 9.6 MPa: A) Comparison of both thermograms obtained at 0.01 and 1 K·min-1; B) Comparison of original thermogram obtained at 0.01 K·min-1 and the treated one to reduce noise………………..…………….. 232
8.4 Dissociation peak of CH4 hydrate in the presence of [BMIM][Br] at 10% wt. and 9.6 MPa: A) Comparison of both thermograms obtained at 0.01 and 1 K·min-1; B) Comparison of original thermogram obtained at 0.01 K·min-1 and the treated one to reduce noise…………….……………….. 233
8.5 Inhibitor efficiency in reducing the hydrate dissociation temperatures…. 238
8.6 Comparison of CH4 hydrate dissociation by using different inhibition solutions (5 mol% inhibitor) at 20, 60 and 100 MPa……………………… 239
8.7 Comparison of CH4 hydrate equilibrium lines by using different inhibitors (experimental data and predictions using Multiflash): A) Constant molar fraction (…); B) Constant mass fraction (…) …………… 240
LIST OF TABLES
1.1 The main polyhedra-forming gas hydrate structures…………………….. 27
1.2 Nomenclature of the main gas hydrate structures……………………….. 27
1.3 Average radius (Å) of gas hydrate cavities in the main structures……… 28
2.1 Properties of gases used in microcalorimetric analyses………………… 51
2.2 Assessment of the instrument calibration (temperature and enthalpy) considering reference substances………………………………………… 54
4.1 Dissociation data of ice melting preceding the CH4 hydrate dissociation
by HP-µDSC and the respective absolute deviations (AD) from computational predictions………………………………………………….. 108
4.2 Dissociation data of CH4 hydrates by HP-µDSC and the respective absolute deviations (AD) from computational predictions………………. 109
4.3 Dissociation data of CH4 hydrates at different heating rates and their respective absolute deviations (AD) from computational predictions….. 114
4.4 Dissociation data of CH4 hydrates by standard and multicycles methods, and their respective absolute deviations (AD) from computational predictions………………………………………………….. 115
4.5 Enthalpies of CH4 hydrates based on experimental data obtained by the standard method (…) …………………………………………………... 121
4.6 Enthalpies of CH4 hydrates based on experimental data obtained by the multicycles method (…) ……………………………………………….. 121
4.7 Enthalpies of CH4 hydrates obtained in this work and found in the literature……………………………………………….……………………... 125
4.8 Dissociation data of C2H6 hydrates by HP-µDSC (1 K·min-1) and the respective absolute deviations (AD) from computational predictions….. 127
4.9 Dissociation data of C2H6 hydrates by standard and multicycles methods, and their respective absolute deviations (AD) from computational predictions………………………………………………….. 128
4.10 Enthalpies of C2H6 hydrates dissociation based on experimental data obtained by the standard method (…) ……………………………………. 131
4.11 Enthalpies of C2H6 hydrates dissociation based on experimental data obtained by the multicycles method (…) …………………………………. 131
4.12 Enthalpies of C2H6 hydrates obtained in this work and found in the literature…………………………………………………..………………….. 134
4.13 Dissociation data of CO2 hydrates by HP-µDSC and the respective absolute deviations (AD) from computational predictions………………. 135
4.14 Dissociation data of CO2 hydrates by standard and multicycles methods, and their respective absolute deviations (AD) from computational predictions ….………………………………………........... 136
4.15 Enthalpies of CO2 hydrates based on experimental data obtained by the standard method (…)…………………………………………………… 139
4.16 Enthalpies of CO2 hydrates based on experimental data obtained by the multicycles method (…) ….....…….................................................... 140
4.17 Enthalpies of CO2 hydrates obtained in this work and found in the literature….…………………………………..………………………………. 142
5.1 Ratio of guest and cavities diameters for structures sI and sII…….…… 153
5.2 Dissociation data of CH4-C2H6 hydrates obtained by HP-µDSC and the respective absolute deviations (AD) from computational predictions….. 153
5.3 Dissociation data of CH4-C3H8 hydrates (sII) obtained by HP-µDSC and the respective absolute deviations (AD) from computational predictions (…) …. 164
5.4 Dissociation data of likely CH4 hydrates (sI) formed in CH4-C3H8 systems through HP-µDSC and the respective absolute deviations (AD) from computational predictions (…) ………………………………… 164
5.5 Dissociation data of CH4-CO2 hydrates obtained by HP-µDSC and the respective absolute deviations (AD) from computational predictions….. 171
6.1 Dissociation data of CH4 hydrates by HP-µDSC at constant pressure
and the PVT-isochoric method (…) ........................................................ 189
6.2 Dissociation data of CH4-C3H8 hydrates obtained by HP-µDSC (…)…… 194
6.3 Dissociation data of CH4-C3H8 hydrates obtained by the PVT-isochoric method (…) ………….………………………………………………….…… 194
6.4 Dissociation data for CH4-C3H8 hydrates obtained by single runs and after multiple cycles by HP-µDSC (…) ….………………………………… 202
8.1 Comparison between experimental data of CH4 hydrates dissociation in the absence and in the presence of ionic liquids obtained in this work and found in the literature.………………………………………………….. 235
8.2 Ice melting temperatures (onset and peak) in the absence and presence of different inhibitors.……………………………………………. 236
8.3 Dissociation temperatures (onset and peak) of CH4 hydrates in the absence and presence of different inhibitors..……………………………. 237
A.1 Coefficients of equations fitted to the experimental data of CH4 hydrates.. 259
A.2 Results from equations fitted to the experimental data of CH4 hydrates by the standard method…………………………………………………….. 260
A.3 Results from equations fitted to the experimental data of CH4 hydrates by the multicycles method. …………………………………..…………….. 260
A.4 Coefficients of equations fitted to the experimental data of C2H6 hydrates..…………………………………………………………………….. 260
A.5 Results from equations fitted to the experimental data of C2H6 hydrates by the standard method…………………………………………………….. 261
A.6 Results from equations fitted to the experimental data of C2H6 hydrates by the multicycles method…………..………………………………….…... 261
A.7 Coefficients of equations fitted to the experimental data of CO2 hydrates.. 261
A.8 Results from equations fitted to the experimental data of CO2 hydrates by the standard method. …………………………………………………… 261
A.9 Results from equations fitted to the experimental data of CO2 hydrates by the multicycles method. ………………………………………………… 262
A.10 Linear thermal expansivity coefficients for CH4 hydrates found in this work and reported in the literature……………….………………………… 262
A.11 Methane hydrate volume by the standard method. ……………………... 263
A.12 Methane hydrate volume by the multicycles method…………………….. 263
A.13 Ethane hydrate volume by the standard method. ……………………….. 263
A.14 Ethane hydrate volume by the multicycles method………………………. 264
A.15 Carbon dioxide hydrate volume by the standard method………………... 264
A.16 Carbon dioxide hydrate volume by the multicycles method……………... 264
A.17 Volume change in CH4 hydrate dissociation by the standard method….. 265
A.18 Volume change in CH4 hydrate dissociation by the multicycles method.. 265
A.19 Volume change in C2H6 hydrate dissociation by the standard method… 265
A.20 Volume change in C2H6 hydrate dissociation by the multicycles method 266
A.21 Volume change in CO2 hydrate dissociation by the standard method….. 266
A.22 Volume change in CO2 hydrate dissociation by the multicycles method.. 266
A.23 Hydration number of CH4 hydrate by the standard method………......... 267
A.24 Hydration number of CH4 hydrate by the multicycles method…….......... 267
A.25 Hydration number of C2H6 hydrate by the standard method…………….. 268
A.26 Hydration number of C2H6 hydrate by the multicycles method………….. 268
A.27 Hydration number of CO2 hydrate by the standard method……………. 268
A.28 Hydration number of CO2 hydrate by the multicycles method………….. 269
TABLE OF CONTENTS
CHAPTER 1: INTRODUCTION, BACKGROUND AND STATE-OF-THE-ART………………. 24
1.1 INTRODUCTION TO GAS HYDRATES AND SCIENTIFIC APPLICATIONS………….. 24
1.2 STRUCTURAL CHARACTERISTICS OF GAS HYDRATES……………………...…. 26
1.2.1 Phase Transitions and Metastable Phases…………………………... 28
1.3 BACKGROUND ON GAS HYDRATES THERMODYNAMICS……………………….. 30
1.3.1 Thermodynamic Models for Describing Phase Equilibrium…………. 31
1.3.2 Instrumental Techniques for Experimental Determination of Thermodynamic Properties of Gas Hydrates….………………...…… 35
1.4 MOTIVATION AND THESIS OBJECTIVES………………………………………... 38
1.5 OUTLINE OF THE WORK………………………………………………………... 39
REFERENCES…………………………………………………………………... 41
CHAPTER 2: MATERIALS AND METHODS…………………...………………………..…….... 50
2.1 HIGH PRESSURE DIFFERENTIAL SCANNING CALORIMETRY: HP-µDSC…..….. 50
2.1.1 Gas Hydrate-Forming Species………………………………………... 51
This model was used to predict the heat capacity of different clathrates, including
N2 and CH4, and the results revealed this property as a linear function of the
composition (PARSONAGE; STAVELEY, 1984). Handa and Tse (1986) also applied
this model in heat capacity analysis of xenon, krypton and methane. In 1994, Avlonitis
proposed a computational scheme to calculate heat capacity of hypothetical empty
structure and of the guest species involved. This script allowed to reduce the data
obtained by Handa and Tse (1986) and predict the Cp for both simple and
multicomponent gas hydrates. The results indicate that this thermodynamic property
of hydrates is close but always greater than that of ice.
1.3.2 Instrumental Techniques for Experimental Determination of Thermodynamic
Properties of Gas Hydrates
The main experimental methods currently used to study equilibrium and thermal
properties of gas hydrates are based on isochoric experiments by using PVT cells and
High-Pressure Differential Scanning Calorimetry (HP-μDSC). The first experimental
setup for studying hydrate equilibrium was designed by Deaton and Frost (1937) and
came to be the prototype of PVT cells for further researches (MCLEOD; CAMPBELL,
1961; DALMAZZONE et al., 2002a; HU et al., 2017; MOHAMMAD-TAHERI et al.,
2013; THAKORE; HOLDER, 1987; VERMA, 1974; WARD et al., 2015). This type of
cell allows to set a homogeneous sampling due to the mixing in the liquid bulk and the
analysis is usually performed through isochoric methods. On the other hand, the
calorimetry came later not only for determining equilibrium data but also for obtaining
other thermal properties such as enthalpy and heat capacity, with advantages such as
36
shorter analysis, simple experimental procedure and smaller amount of material
required (DALMAZZONE et al., 2002b; GUPTA et al., 2008; HANDA et al., 1986;
PARLOUËR et al., 2004). Nevertheless, hydrate growth inside the cell undergoes
mass transfer issues since the hydrate layer is formed in the interface of gas and liquid
phases due to the absence of mixing in most of µDSC configurations. Recently,
Delroisse et al. (2018) published new enthalpy data for cyclopentane hydrate by using
a mechanically stirred calorimetric cell. The group points out a list of advantages by
using in situ agitation: lower induction time, higher surface area for mass transfer
between water and cyclopentane liquid phases and no interfacial hydrate shell usually
formed in non-stirred systems. It is also stated that the whole experimental apparatus
can work at up to 20 MPa, although the experiments were performed at atmospheric
pressure. No work is found in literature so far applying μDSC at high pressures in
presence of continuous mixing.
In recent years, nevertheless, several studies have used high-pressure μDSC to
determine hydrate phase equilibrium or other thermal properties through non-mixed
methods: Lachance et al. (2009) used this methodology to study hydrate kinetic
inhibition in water-in-oil emulsions at 15 MPa and stated some advantages of such
method, as less material required and shorter experimental time; Ohno et al. (2010)
studied methane-ethane-propane hydrates at 4 MPa to evaluate some proteins as a
new class of inhibitors by means of μDSC temperature ramping and isothermal
experiments; Later on, Daraboina et al. (2011) studied the same hydrate former system
by applying chemical and biological inhibitors at 9 MPa; At the same time, Dalmazzone
et al. (2011) patented a method for determining kinetic characteristics of gas hydrate
formation by means of high-pressure μDSC measurements; In 2012, Lafond et al.
published a work studying the methane hydrate from 7 to 20 MPa through stepwise
measurements in order to establish new hydrate phase boundaries in the presence of
NaCl and methanol. In such method, several consecutive steps are performed in which
the temperature is increased only a fraction of degree and then followed by an
isothermal period, allowing to obtain the hydrate dissociation temperature more
accurately; Daraboina et al. (2013) used the High-Pressure µDSC up to 10 MPa to
study methane hydrates and demonstrated that it can provide statistically reliable time-
dependent results using both temperature-ramping and isothermal programs; In 2015,
37
Sabil et al. investigated ionic liquids as a new class of inhibitors for hydrate formation
from 3.6 to 11.2 MPa; Chu et al. (2016) also used high-pressure microcalorimetry to
evaluate the chain length effect of ionic liquids on the methane hydrate phase
equilibrium, working at pressures from 5 to 35 MPa; Cha et al. (2016) applied both
PVT-isochoric method and HP-µDSC to investigate methane hydrate phase equilibria
in aqueous salt solutions up to 11.5 MPa and the results showed good agreement.
The microcalorimetry allows the detection of phase transitions over time by
means of isobaric, isochoric or isothermal methods. Energy transitions caused by
phase changes or structural rearrangement can be observed through endothermic or
exothermic peaks in thermograms, depending on the nature of the transition. Despite
its enormous potential, few studies approach the determination of hydrate enthalpy
and heat capacity through this equipment (DELROISSE et al., 2018; GUPTA, 2008;
MU; SOLMS, 2018). Although the experimental procedure is simple, the methodology
for determining heat capacity can be made difficult since it requires rigorous baselines
for empty cells and all analyses must be carried out under the same conditions. In
addition, the heating rate in these cases should be considerably low so that the kinetic
effect on the heat flow signal is minimized. In the case of enthalpy, the difficulty
concerns about determining the actual amount of hydrate formed, since it must be
estimated considering the theoretical stoichiometry of the reaction. In addition, hydrate
formation may occur along with ice melting during the heating process, making harder
the integration of peaks. However, a multi-cycled methodology is presented in this work
adapted from Marinhas et al. (2006) to calculate hydrates enthalpy and to expand the
experimental database available in the literature at pressures up to 100 MPa. Besides,
the cited limitations do not affect the determination of dissociation temperatures, whose
results are obtained quickly and satisfactorily. Considering this work is focused mainly
on gas hydrate characterization via high-pressure microcalorimetric measurements,
this technique will be more extensively approached in the next chapters.
Several other works gather different methods and techniques to analyze more
comprehensively the gas hydrates, considering the structural aspects. Desmedt et al.
(2015) proposed a new way of studying the effects of ionic defects in lattice on hydrate
physicochemical properties. The group performed calorimetric, X-ray diffraction and
Raman scattering measurements along with computational structure relaxation in the
38
density functional theory approximation to better describe the new mixed synthesized
hydrate. In particular, Raman spectroscopy has been used to study gas hydrate
formation through specific signatures of vibrational modes in the spectra. More
recently, Petuya et al. (2017) published a work about the guest partitioning in CO
hydrate using high-resolution Raman spectroscopy and neutron powder diffraction. By
the first time, the group unraveled Raman signatures of CO molecules trapped in both
small and large cavities of structure I. They also studied the dependency of cage
occupancy on temperature and pressure through Raman signatures and indicate that
in some cases the occupancy is higher than 1, i.e., large cavities can be multiple
occupied by CO molecules. Raman spectra are also presented in this work to
complement the methane-propane hydrates characterization.
1.4 MOTIVATION AND THESIS OBJECTIVES
Although the equilibrium properties of any system are determined by phase
diagrams, most hydrate diagrams available so far are based on simulations. The
equilibrium equations for these simulations can deviate significantly from real data,
especially as pressure increases (JAGER et al., 2005) and for inhibited systems, that
may substantially influence the results depending on the activity coefficient model used
and how its parameters are regressed (ANTUNES et al., 2018). Few experimental data
in the literature for natural gas hydrates also limit the comparison of predictions
(BALLARD; SLOAN, 2004b). Moreover, modeling may not predict metastable states
occurring under specific thermodynamic conditions that may be common in hydrate
reservoirs, as mentioned before (KLAPPROTH et al., 2019).
Phase diagrams for hydrate-forming systems based on experimental data are
very scarce in the literature due to instrumental limitations or experimental difficulties,
especially for gaseous mixtures. An exception is the work reported by Aladko et al.
(2002), in which the methane-propane-water system was investigated by means of
differential thermal analysis up to 1500 MPa. According to the group, this technique
allows obtaining the topology of phase diagrams and hydrate decomposition
temperatures based on high-pressure equipment, firstly employed by Dyadin et al.
(1997). However, most hydrate studies at high pressures were carried out using
39
complex and heavy instrumentation coupled to a PVT cell with a visual sapphire
window, that records temperature and pressure simultaneously. Moreover, variations
in experimental conditions make hard the comparison of results obtained by different
laboratories since hydrate structural properties and stability depends on several
factors, such as hydrate stabilization-time, natural gas composition, solubility and
salinity in aqueous phase (BANDYOPADHYAY; KLAUDA, 2011; SLOAN et al., 2010).
In spite of the difficulties mentioned above, it is relevant to investigate the phase
diagrams for gas hydrate-forming systems. It is essential to understand the
mechanisms of gas hydrates formation and dissociation as well as structural
characteristics and thermal properties to effectively design industrial exploitation
processes and operational conditions. In this context, the microcalorimetry appears as
a very interesting alternative to accurately determine thermodynamic equilibrium data
and other thermal properties, such as enthalpy and heat capacity of hydrates.
However, few experimental data obtained by means of microcalorimetry above 20 MPa
are found in the literature because of the analysis may be labor-intensive and require
specific experimental configuration to work under such conditions.
Considering that the formation of gas hydrates on the ocean floor occurs at
pressures much higher than previously studied by microcalorimetry, the main scope of
this thesis is to present methodologies based on HP-μDSC, providing reliable and
reproducible experimental thermodynamic data for different hydrate systems up to 100
MPa. The experimental setup has been optimized during the work and new
thermodynamic data were obtained at different pressures and gas-phase
compositions. The thermodynamic properties studied were the equilibrium temperature
(or dissociation point) and dissociation enthalpy of gas hydrates. In this way, this work
contributes not only providing experimental data but also studying new hydrate-forming
systems that collaborate to scientific interests in developing phase diagrams hereafter
and growing the scientific knowledge in this area.
1.5 OUTLINE OF WORK
This thesis is composed of nine chapters written according to the motivation
mentioned above. Following this first chapter, which deals with the scientific context
40
and the main references found in the literature related to this topic, the work is
organized as the outline below.
Chapter 2 corresponds to the description of all experimental methods applied and
developed during the work, including the preparation and characterization of samples,
and the equations applied in modeling thermodynamic properties of gas hydrates.
Chapter 3 presents preliminary studies of gaseous systems by computational
simulations. These studies were essential to determine the experimental conditions to
be applied thereafter. For instance, it was avoided to work at pressures and
compositions that could lead to gas liquefaction when working with gas mixtures.
Besides, it was important to perform previous simulations on hydrate equilibrium, both
for planning the experiments and for understanding the influence of overall and gas
phase compositions on the hydrate dissociation temperature.
Chapter 4 is the first experimental section and contains the data obtained by using
High-Pressure Differential Scanning microCalorimetry (HP-µDSC). Several new
thermodynamic data of dissociation are presented for single-guest hydrate-forming
systems up to 100 MPa (CH4, C2H6 and CO2 hydrates), along with the corresponding
predictions from commercial software (Multiflash and CSMGem). Moreover, new data
of dissociation enthalpy are presented for single hydrates, obtained by a direct method
(integrations from thermograms) and an indirect method (Clapeyron equation).
Chapter 5 is similar to the previous one, presenting new dissociation data for
double-guest hydrate-forming systems (CH4-C2H6, CH4-C3H8 and CH4-CO2 hydrates)
and comparing them to the predictions. In this case, the dissociation temperature
profiles are discussed by taking into account the likely occupancy degree of small and
large cavities. The type of structure formed in each case and the possible coexistence
of metastable phases are also addressed.
The next chapter (6) contains the results obtained through the isochoric method by
using a PVT cell available in the Phases to Flow Laboratory at the Colorado School of
Mines, in the United States of America. Chapter 7 also presents results from abroad,
concerning to structural analysis by Raman spectroscopy carried out in the Groupe
Moléculaire Spectroscopie at the Université de Bordeaux, France. These
complementary studies performed abroad, along with some calorimetric studies, were
41
very elucidating mainly with respect to CH4-C3H8 hydrates and resulted in a recently
published scientific article (MENEZES et al., 2019).
Chapter 8 presents the studies performed by using two ionic liquids and methanol
as gas hydrate inhibitors. The inhibitory character of such compounds is discussed by
addressing thermodynamic and kinetic terms. A work containing the results presented
in this chapter was also recently published in a scientific journal (MENEZES et al.,
2020).
Chapter (9) is a summary of the main conclusions of this thesis and presents
suggestions for further works. Finally, the last chapter (10) lists the scientific
production, including the works presented in scientific events.
REFERENCES
ALADKO, E.Y.; DYADIN, YU.A.; MANAKOV, A.YU.; ZHURKO, F.V.; LARIONOV, E.G. Phase Diagrams of the Ternary Gas Hydrate Forming Systems at High Pressures. Part 1. Propane–Methane–Water System. Journal of Supramolecular Chemistry, v. 2, p. 369-376, 2002. ANDERSON, B. Molecular modeling of clathrate-hydrate via ab initio, cell potential and dynamic methods, PhD Thesis, Massachussets Institute of Technology, 2005. ANDERSON, G.K. Enthalpy of dissociation and hydration number of carbon dioxide hydrate from the Clapeyron equation. The Journal of Chemical Thermodynamics, v. 35, p. 1171-1183, 2003. ANDERSON, G.K. Enthalpy of dissociation and hydration number of methane hydrate from the Clapeyron equation. The Journal of Chemical Thermodynamics, v. 36, p. 1119, 2004. ANTUNES, C.M.M.O.; KAKITANI, C.; NETO, M.A.M.; MORALES, R.E.M., SUM, A.K. An Examination of the Prediction of Hydrate Formation Conditions in the Presence of Thermodynamic Inhibitors. Brazilian Journal of Chemical Engineering. V. 35, p. 265-274, 2018. AVLONITIS, D.; VAROTSIS, N. Modelling gas hydrate thermodynamic behavior: theoretical basis and computational methods. Fluid Phase Equilibria, v. 123, p. 107-130, 1996. BAI, D.; ZHANG, D.; ZHANG, X.; CHEN, G. Origin of Self-preservation Effect for Hydrate Decomposition: Coupling of Mass and Heat Transfer Resistances. Nature: Scientific Reports, v. 5, p. 1-13, 2015.
42
BALLARD, A.L.; SLOAN, E.D. Hydrate phase diagrams for methane + ethane + propane mixtures. Chemical Engineering Science, v. 56, p. 6883-6895, 2001. BALLARD, A.L.; SLOAN, E.D. The next generation of hydrate prediction: Part III. Gibbs energy minimization formalism. Fluid Phase Equilibria, v. 218, p. 15-31, 2004a. BALLARD, A.L.; SLOAN, E.D. The next generation of hydrate prediction: an overview. Journal of Supramolecular Chemistry, v. 2, p. 385-392, 2002. BALLARD, A.L.; SLOAN, E.D. The next generation of hydrate prediction IV: A comparison of available hydrate prediction programs. Fluid Phase Equilibria, v. 216, p. 257-270, 2004b. BANDYOPADHYAY, A.A.; KLAUDA, J.B. Gas hydrate structure and pressure predictions based on an updated fugacity-based model with the PSRK equation of state. Industrial and Engineering Chemistry Research, v. 50, p. 148-157, 2011. BISHNOI, P.R.; GUPTA, A.K.; ENGLENZOS, P.; KALOGERAKIS, N. Multiphase equilibrium flash calculations for systems containing gas hydrates. Fluid Phase Equilibria, v. 53, p. 97-104, 1989. BUI, T.; SICARD, F.; MONTEIRO, D.; LAN, Q.; CEGLIO, M.; BURRESS, C.; STRIOLO, A. Antiagglomerants Affect Gas Hydrate Growth. The Journal of Physical Chemistry Letters, v. 9, p. 3491-3496, 2018.
CARDOSO, C.A.B.R.; GONÇALVES, M.A.L.; CAMARGO, R. M.T. Design Options for Avoiding Hydrates in Deep Offshore Production. Journal of Chemical & Engineering Data, v. 60, p. 330-335, 2015. CHA, M., HU, Y., SUM, A.K. Methane hydrate phase equilibrium for systems containing NaCl, KCl, and NH4Cl. Fluid Phase Equilibria, v. 413, p. 2-9, 2016. CHAKOUMAKOS, B.C.; RAWN, C.J.; RONDINONE, A.J.; STERN, L.A.; CIRCONE, S.; KIRBY, S.H.; ISHII, Y.; JONES, C.Y.; TOBY, B.H. Temperature dependence of polyhedral cage volumes in clathrate hydrates. Canadian Journal of Physics, v. 81, p. 183-189, 2003. CHOU, I-M.; SHARMA, A.; BURRUSS, R.C. SHU, J.; MAO, H.; HEMLEY, R.J.; GONCHAROV, A.F.; STERN, L.A.; KIRBY, S.H. Transformations in methane hydrates. Proceedings of the National Academy of Sciences of the United States of America, v. 97, p. 13484-13487, 2000. CHU, C.; LIN, S.; CHEN, Y.; CHEN, P.; CHEN, L. Chain length effect of ionic liquid 1-alkyl-3-methylimidazolium chloride on the phase equilibrium of methane hydrate. Fluid Phase Equilibria, v. 413, p. 57-64, 2016.
43
CHUVILIN, E.; BUKHANOV, B.; DAVLETSHINA, D.; GREBENKIN, S.; ISTOMIN, V. Dissociation and Self-Preservation of Gas Hydrates in Permafrost. Geosciences, v. 8, 431, 2018. DALMAZZONE, C.; DALMAZZONE, D.; HERZHAFT, B. Differential scanning calorimetry: a new technique to characterize hydrate formation in drilling muds. Society of Petroleum Engineers Journal, p. 196-202, 2002b. DALMAZZONE, C.; HERZHAFT, B.; ROUSSEAU, L. Method of analyzing the kinetics of gas hydrate formation in fluids. US Patent 8,038,342 B2, 2011. DALMAZZONE, D.; KHARRAT, M.; LACHET, V.; FOUCONNIER, B.; CLAUSSE, D. DSC and PVT measurements: Methane and trichlorofluoromethane hydrate dissociation equilibria, Journal of Thermal Analysis and Calorimetry, v. 70, p. 493-505, 2002b. DARABOINA, N.; MALMOS, C.; SOLMS, N. Investigation of kinetic hydrate inhibition using a high-pressure micro differential scanning calorimeter. Energy Fuels, v. 27, p. 5779– 5786, 2013. DARABOINA, N.; RIPMEESTER, J.; WALKER, V. K.; ENGLEZOS, P. Natural gas hydrate formation and decomposition in the presence of kinetic inhibitors. 1. High-pressure calorimetry. Energy Fuels, v. 25, p. 4392–4397, 2011. DELROISSE, H.; PLANTIER, F.; MARLIN, L.; DICHARRY, C.; FROUTÉ, L.; ANDRÉ, R.; TORRÉ, J.P. Determination of thermophysical properties of cyclopentane hydrate using a stirred calorimetric cell. The Journal of Chemical Thermodynamics, v. 125, p. 136-141, 2018. DESMEDT, A.; MARTIN-GONDRE, L.; NGUYEN, T.; PETUYA, C.; BARANDIARAN, L.; BABOT, O.; TOUPANCE, T.; GRIM, G.; SUM, A. K. Modifying the Flexibility of Water Cages by Co-Including Acidic Species within Clathrate Hydrate. The Journal of Physical Chemistry, v. 119, p. 8904−8911, 2015. DURHAM, W.B.; STERN, L.A.; KIRBY, S.H. Ductile flow of methane hydrate. Canadian Journal of Physics, v. 81, p. 373-380, 2003. DYADIN, YU.A.; LARIONOV, E. G.; MIRINSKIJ, D. S.; MIKINA, T. V.; ALADKO, E.YA.; STAROSTINA, L. I. Phase diagram of the Xe-H2O system up to 15 kbar. Journal of Inclusion Phenomena and Molecular Recognition in Chemistry, v. 28, 271–285, 1997. GABITTO, J.F.; TSOURIS, C. Physical Properties of Gas Hydrates: A Review. Journal of Thermodynamics, ID 271291, 12 pages, 2010. GUPTA, A.K., Steady state simulation of chemical processes, Ph.D. Thesis, University of Calgary, Alberta, 1990.
44
GUPTA, A.; LACHANCE, J.; SLOAN, E. D.; KOH, C. A. Measurements of methane hydrate heat of dissociation using high pressure differential scanning calorimetry. Chemical Engineering Science, v. 63, p. 5848-5853, 2008. HAGHIGHI, H.; CHAPOY, A.; BURGESS, R.; TOHIDI, B. Experimental and thermodynamic modelling of systems containing water and ethylene glycol: application to flow assurance and gas processing. Fluid Phase Equilibria, v. 276, p. 24–30, 2009. HANDA, Y.P. Calorimetric determinations of the compositions, enthalpies of dissociation, and heat capacities in the range 85 to 270 K for clathrate hydrates of xenon and krypton. The Journal of Chemical Thermodynamics, v. 18, Pages 891-902, 1986. HANDA, Y.P.; TSE, J.S.; Thermodynamic properties of empty lattices of structure I and structure II clathrate hydrates. Journal of Physical Chemistry, v. 90, p. 5917-5921, 1986. HIRAI, H.; KONDO, T.; HASEGAWA, M.; YAGI, T.; YAMAMOTO, Y.; KOMAI, T.; NAGASHIMA, K.; SAKASHITA, M.; FUJIHISA, H.; AOKI, K. Methane hydrate behavior under high pressure. The Journal of Physical Chemistry B, v.104, p. 1429-1433, 2000. HU, Y.; LEE, B.R.; SUM, A.K. Phase equilibrium data of methane hydrates in mixed brine solutions. Journal of Natural Gas Science and Engineering, v. 46, p. 750-755, 2017b. HU, Y.; MAKOGON, T.Y.; KARANJKAR, P.; LEE, K.; LEE, B.; SUM, A.K. Gas hydrates phase equilibria and formation from high concentration NaCl brines up to 200 MPa. Journal of Chemical & Engineering Data, v. 62, p. 1910–1918, 2017a. ISTOMIN, V.A.; KVON, V.G.; DUROV, V.A. Metastable states of gas hydrates. “Gas Industry of Russia”, v. 4, p. 13-16, 2006. JAGER, A.; VINS, V.; GERNERT, J.; SPAN, R.; HRUBY, J. Phase equilibria with hydrate formation in H2O + CO2 mixtures modeled with reference equations of state. Fluid Phase Equilibria, v. 338, p. 100−113, 2013. JAGER, M.D.; BALLARD, A.L.; SLOAN, E.D. Comparison between experimental data and aqueous-phase fugacity model for hydrate prediction. Fluid Phase Equilibria, v. 232, p. 25-36, 2005. JAGER, M.D.; BALLARD, A.L.; SLOAN, E.D. The next generation of hydrate prediction: II. Dedicated aqueous phase fugacity model for hydrate prediction. Fluid Phase Equilibria, v. 211, p. 85-107, 2003. KELLAND, M.A. History of the development of low dosages hydrate inhibitors. Energy and Fuels, v. 20, p. 825-847, 2006.
45
KLAPPROTH, A.; PILTZ, R.O.; KENNEDY, S.J.; KOZIELSKI, K.A. Kinetics of sII and Mixed sI/sII, Gas Hydrate Growth for a Methane/Propane Mixture Using Neutron Diffraction. The Journal of Physical Chemistry C, v. 123, p. 2703-2715, 2019. KLAUDA, J. B.; SANDLER, S. I. Phase Behavior of Clathrate Hydrates: A Model for Single and Multiple Gas Component Hydrates. Chemical Engineering Science., v. 58, p. 27–41, 2003. KOH, C.A.; WESTACOTT, R.E.; ZHANG, W.; HIRACHAND, K.; CREEK, J.L.; SOPER, A.K. Mechanisms of gas hydrate formation and inhibition. Fluid Phase Equilibria, v. 194–197, p. 143-151, 2002. KVENVOLDEN, K. A.; GINSBURG, G. D.; SOLOVIEV, V. A. Worldwide distribution of subaquatic gas hydrates. Geo-Marine Letters, v. 13, p. 32-40, 1993. LACHANCE, J.W.; SLOAN, E.D.; KOH, C.A. Determining gas hydrate kinetic inhibitor effectiveness using emulsions. Chemical Engineering Science, v. 64, p. 180-184, 2009. LAFOND, P. G.; OLCOTT, K. A.; SLOAN, E. D.; KOH, C. A.; SUM, A. K. Measurements of methane hydrate equilibrium in systems inhibited with NaCl and methanol. Journal of Chemical Thermodynamics, v. 48, p. 1–6, 2012. LARIONOV, E.G.; DYADIN, YU.A.; ZHURKO, F.V.; MANAKOV., A.YU. Phase Diagrams of the Ternary Gas Hydrate Forming Systems at High Pressures. Part II. Ethane–Methane–Water System. Journal of Inclusion Phenomena and Macrocyclic Chemistry, v. 56, p. 303–308, 2006. LEHMKUHLER, F. Formation of clathrate hydrates: an x-ray scattering study. 2010. 147 pages. PhD Dissertation, Technischen Universität Dortmund, Germany, March of 2010. LI, Z.; YOU, J.; JIA, W.; HE, Y. An improved Parrish-Prausnitz (P-P) model to predict the hydrate formation condition of natural gas with a high volume content of CO2, Journal of Natural Gas Science and Engineering, v. 37, p. 479-486, 2017. LINJUN, W.; XUEMIN, Z.; HONGHUI, LI.; SHAO, L.; ZHANG, D.; JIAO, L. Theory research on desalination of brackish water using gas hydrate method. Advanced Materials Research, v. 616-618, p. 1202-1207, 2013. LONG, J.P. Gas Hydrate Formation Mechanism and Kinetic Inhibition. PhD Thesis, Colorado School of Mines, 1994. MAKOGON, Y. F.; GHASSEMI, A. Effects of Self-Preservation of Natural Gas-Hydrates. American Rock Mechanics Association 10-291, 2010. MARINHAS, S.; DELAHAYEA, A.; FOURNAISONA, L.; DALMAZZONE, D.; FURST, W.; PETITET, J.P. Modelling of the available latent heat of a CO2 hydrate slurry in an
46
experimental loop applied to secondary refrigeration. Chemical Engineering and Processing, v. 45, p. 184–192, 2006. MARTÍN, A. A Simplified van der Waals-Platteeuw Model of Clathrate Hydrates with Multiple Occupancy of Cavities. The Journal of Physical Chemistry B, v. 114, p 9602–9607, 2010. MCLEOD, H.O.J.; CAMPBELL, J.M. Natural Gas Hydrates at Pressures to 10,000 psia, Journal of Petroleum Technology, v. 222, p. 590-594, 1961. MENEZES, D.E.S.; PESSÔA FILHO, P.A.; ROBUSTILLO, M.D. Use of 1-Butyl-3-methylimidazolium-based ionic liquids as methane hydrate inhibitors at high-pressure conditions. Chemical Engineering Science, v. 212, 115323, 2020. MENEZES, D.E.S.; SUM, A.K.; DESMEDT, A.; PESSÔA FILHO, P.A.; ROBUSTILLO, M.D. Coexistence of sI and sII in methane-propane hydrate former systems at high pressures. Chemical Engineering Science, v. 208, 115149, 2019. MICHEL, J.; OWENS, E.H.; ZENGEL, S.; GRAHAM, A.; NIXON, Z.; ALLARD, T.; HOLTON, W.; REIMER, P.D.; LAMARCHE, A.; WHITE M.; RUTHERFORD, N.; CHILDS, C.; MAUSETH, G.; CHALLENGER, G.; TAYLOR, E. Extent and Degree of Shoreline Oiling: Deepwater Horizon Oil Spill, Gulf of Mexico, USA. Plos One, v. 8, p. 1-9, 2013. MOHAMMADI, A.H.; RICHON, D. Phase equilibria of methane hydrates in the presence of methanol and/or ethylene glycol aqueous solutions. Industrial and Engineering Chemistry Research, v. 49, p. 925–928, 2010. MOHAMMAD-TAHERI, M.; MOGHADDAM, A.Z.; NAZARI, K.; ZANJANI, N.G. The role of thermal path on the accuracy of gas hydrate phase equilibrium data using isochoric method, Fluid Phase Equilibria, v. 338, p. 257-264, 2013. MU, L.; SOLMS, N. Hydrate thermal dissociation behavior and dissociation enthalpies in methane-carbon dioxide swapping process. The Journal of Chemical Thermodynamics, v. 117, p. 33-42, 2018. OHNO, H.; SUSILO, R.; GORDIENKO, R.; RIPMEESTER, J.; WALKER, V.K. Interaction of antifreeze proteins with hydrocarbon hydrates. Chemistry - A European Journal, v. 16, p. 10409-10417, 2010. PARLOUËR, P. L.; DALMAZZONE, C.; HERZHAFT, B.; ROUSSEAU, L.; MATHONAT, C. Characterization of gas hydrates formation using a new high-pressure micro-DSC. Journal of Thermal Analysis and Calorimetry, v. 78, p. 165–172, 2004. PARRISH, W.R.; PRAUSNITZ, J.M. Dissociation pressures of gas hydrates formed by gas mixtures. Industrial Engineering Chemistry Process Design and Development, v. 11, p. 27-35, 1972.
47
PARSONAGE, N.G.; STAVELEY, L.A.K. Thermodynamic properties of clathrates: The heat capacity and entropy of argon in the argon quinol clathrate. Molecular Physics, v. 2, p. 212-222, 1958. PARSONAGE, N.G., STAVELEY, L.A.K. Thermodynamic studies of clathrates and inclusion compounds. In Inclusion Compounds, Academic Press: London, v. 3, chapter 1, 1984. PENG, D.Y., ROBINSON, D.B., A new two-constant equation of state, Industrial and Engineering Chemistry: Fundamentals, v. 15, p. 59–64, 1976. PETUYA, C.; DAMAY, F.; TALAGA, D.; DESMEDT, A. Guest Partitioning in Carbon Monoxide Hydrate by Raman Spectroscopy. The Journal of Physical Chemistry, v. 121, p. 13798–13802, 2017. REDDY, C.M.; AREY, J.S.; SEEWALD, J.S.; SYLVA, S.P.; LEMKAU, K.L.; NELSON, R.K.; CARMICHAEL, C.A.; MCINTYRE, C.P.; FENWICK, J.; VENTURA, G.T.; VAN MOOY, B.A.S.; CAMILLI, R. Composition and fate of gas and oil released to the water column during the Deepwater Horizon oil spill. Proceedings of the National Academy of Sciences, v. 109, p. 20229-20234, 2012. SABIL, K.M.; NASHED, O.; LAL, B.; ISMAIL, L.; JAPPER-JAAFAR, A. Experimental investigation on the dissociation conditions of methane hydrate in the presence of imidazolium-based ionic liquids. The Journal of Chemical Thermodynamics, v. 84, p.7-13, 2015. SAITO, S.; MARSHALL, D.R.; KOBAYASHI, R. Hydrates at High Pressures. American Institute of Chemical Engineers, v. 10, p. 734, 1964. SAMI, N.A.; SANGWAI, J.S.; SUBRAMANIAN, B. Gas hydrate Applications and problems in Oil and Gas Industry. International Journal of Scientific & Engineering Research, v. 4, 2013. SAW, V.K.; AHMAD, I.; MANDAL, A.; UDAYABHANU, G.; LAIK, S. Methane hydrate formation and dissociation in synthetic seawater. Journal of Natural Gas Chemistry, v. 21, p. 625-632, 2012. SHIN, W.; PARK, S.; RO, H.; KOH, D.Y.; SEOL, J.; LEE, H. Spectroscopic confirmation of metastable structure formation occurring in natural gas hydrates. Chemistry – An Asian Journal, v. 7, p. 2235-2238, 2012. SLOAN, E.D.; FLEYFELB, F. Hydrate dissociation enthalpy and guest size. Fluid Phase Equilibria, v. 76, p. 123-140, 1992. SLOAN, E.D.; KOH, C.A. Clathrate hydrates of natural gases, 3rd ed. Boca Raton: CRC Press, 2008. SLOAN, E.D.; KOH, C.A.; SUM, A.K. Gas hydrate stability and sampling: the future as related to the phase diagram. Energies, v. 3, p. 1991-2000, 2010.
48
SLOAN, E.D.; KOH, C.A.; SUM, A.K. Natural Gas Hydrates in Flow Assurance. Gulf Professional Publishing (Elsevier), Oxford, U.K., 2010. SLOAN, E.D.; KOH, C.A.; SUM, A.K.; BALLARD, A.L.; SHOUP, G.J.; MCMULLEN, N.; CREEK, J.L.; PALERMO, T. Hydrates: State of the Art Inside and Outside Flowlines. Journal of Petroleum Technology, v. 61. 89-94, 2009. STERN, L.A.; KIRBY, S.H.; DURHAM, W.B.; CIRCONE, S.; WAITE, W.F. Laboratory synthesis of pure methane hydrate suitable for measurement of physical properties and decomposition behavior. Natural Gas Hydrate, in Oceanic and Permafrost Environments. M.D. Max, Ed. Kluwer Publ., chapter 25, p. 323-348, 2000. SUM, A.; WU, D.; YASUOKA, K. Energy science of clathrate hydrates: Simulation-based advances. Material Research Society Bulletin, v. 36 (3), p. 205-210, 2011. TAN, L.S.; LAU, K.K.; BUSTAM, M.A.; SHARIFF, A.M. Removal of high concentration CO2 from natural gas at elevated pressures via absorption process in packed column. Journal of Natural Gas Chemistry, v. 21, p. 7-10, 2012. TARIQ, M.; ROONEY, D.; OTHMAN, E.; APARICIO, S.; ATILHAN, M.; KHRAISHEH, M. Gas Hydrate Inhibition: A Review of the Role of Ionic Liquids. Industrial and Engineering Chemistry Research, v. 53, p. 17855−17868, 2014. THAKORE, J. L.; HOLDER, G. D. Solid vapor azeotropes in hydrate forming systems. Industrial and Engineering Chemistry Research, v. 26, p.462-469, 1987.
TSUDA, T.; OGATA, K.; HASHIMOTO, S.; SUGAHARA, T.; SATO, H.; OHGAKI, K. Storage capacity of hydrogen in gas hydrates. Journal of Physics: Conference Series 215, 012061, 2010.
VAN DER WAALS, J.H.; PLATTEEUW, J.C. Clathrate solutions. Advances in Chemical Physics, v. 2, p. 1–55, 1959.
VERMA, V.K. Gas Hydrates from Liquid Hydrocarbon−Water Systems. Ph.D. Dissertation, University of Michigan: Ann Arbor, MI, 1974.
VINS, V.; JAGER, A.; SPAN, R.; HRUBY, J. Model for gas hydrates applied to CCS Systems Part I. Parameter study of the van der Waals and Platteeuw model. Fluid Phase Equilibria, v. 427, p. 268−281, 2016.
XU, C.G.; ZHANGA, S.H.; CAI, J.; CHENA, Z.Y.; LI, X.S. CO2 (carbon dioxide) separation from CO2 e H2 (hydrogen) gas mixtures by gas hydrates in TBAB (tetra-n-butyl ammonium bromide) solution and Raman spectroscopic analysis. Energy, v. 59, p. 719-725, 2013.
WARD, Z.T.; MARRIOTT, R.A.; SUM, A.K.; SLOAN, E.D.; KOH, C.A. Equilibrium Data of Gas Hydrates containing Methane, Propane, and Hydrogen Sulfide. Journal of Chemical & Engineering, v.60, p.424-428, 2015.
49
YOON, J.H.; YAMAMOTO, Y.; KOMAI, T.; HANEDA, H. Rigorous Approach to the Prediction of the Heat of Dissociation of Gas Hydrates. Industrial & Engineering Chemistry Research, v. 42., p. 1111–1114, 2003. ZHDANOV, R.K.; GETS, K.V.; BELOSLUDOV, R.V.; SUBBOTIN, O.S.; BOZHKO, Y.Y.; BELOSLUDOV, V.R. Theoretical modeling of the thermodynamic properties and the phase diagram of binary gas hydrates of argon and hydrogen. Fluid Phase Equilibria, v. 434, p. 87-92, 2017.
50
CHAPTER 2
MATERIALS AND METHODS
2.1 HIGH PRESSURE DIFFERENTIAL SCANNING CALORIMETRY: HP-µDSC
Differential Scanning Calorimetry (DSC) is a thermal analytical technique applied
to characterize the physical and chemical properties of a wide range of materials as a
function of temperature. There are different types of differential scanning calorimeters
according to the principle that is used to detect and transduce electric signals (KODRE
et al., 2014). In the instrument used in this work (HP-μDSC7 Evo - Setaram), the heat
flow is detected by two plane flowmeters that surround each cell and generate a
proportional electrical signal for each of them (SETARAM, 2016). In this way, it is
possible to quantify the difference between the heat flow in the cell containing the
sample and the reference cell, usually kept empty. Eventual energetic transitions
occurring in the sample lead to a difference in the heats that flow through the sample
and the reference cells. For this reason, thermal events occurring in the sample can
be accurately detected through this technique due to the heat flow discrepancy
between the two flowmeters. Common interferences in both cells are eliminated by
subtracting the reference heat flow signal from the sample one.
The signal concerning the heat flow difference is plotted versus the temperature
or time in graphs, usually known as thermograms, as illustrated in Figure 2.1. The
thermal phenomena observed in thermograms are used to characterize the sample
and can be classified as first or second-order transitions. Events that present enthalpy
changes (endothermic or exothermic) are known as first-order transitions and give rise
to the appearance of peaks in thermograms. Some endothermic events are melting,
sublimation and desolvation, while the crystallization and decomposition are examples
of exothermic phenomena. Solid-solid transitions and chemical reactions may also
promote first order events. On the other hand, second-order events present heat
capacity changes, although the enthalpy does not vary. Instead of peaks, these events
are observed in thermograms as a displacement of the baseline and may be detected
during a material glass transition or relaxation of polymeric chains processes, for
instance.
51
Figure 2.1 – Main transitions observed in thermograms obtained by HP-μDSC.
2.1.1 Gas Hydrate-Forming Species
Milli-Q water was used to prepare all samples for microcalorimetric analyses in
this work. Some properties of the gases employed to form gas hydrates are given in
Table 2.1, according to the data provided by the National Institute of Standards and
Technology (NIST). Other substances used in this work are detailed in subsections
related to specific materials and methods presented in the results section, according
to the respective chapter.
Table 2.1 – Properties of gases used in microcalorimetric analyses.
Properties (Supplier) Methane
(White Martins) Ethane (Linde)
Propane (Gama)
Carbon Dioxide (Gama)
Purity (%) 99.5 99.95 99.5 99.99
T Melting (K) 90.5 101.0 85.4 216.6
T Boiling (K) 111.0 184.6 231.1 194.7
T Critical Point (K) 190.6 305.3 369.9 304.2
P Critical Point (MPa) 4.6 4.9 4.3 7.4
Source: NIST Chemistry WebBook (except purity).
2.1.2 Experimental Configuration
The main experimental configuration used in this work for studying gas hydrates
consists of a high-pressure microcalorimeter (HP-μDSC7 Evo - Setaram) equipped
with a calorimetric transducer and a Calvet three-dimensional sensor for accurate and
precise measurements. The main elements constituting the calorimetric transducer are
shown in Figure 2.2.
52
Figure 2.2 – Calorimetric transducer of µDSC7 Evo apparatus.
Source: Setaram (2016).
Basically, a calorimetric block holds the sample and the reference cells, and it is
allocated inside three concentric chambers. The cells are surrounded by high-
sensitivity Peltier elements that work in this case as heat flow detectors and as good
thermal conductors, maintaining the same temperature in the cells and in the
calorimetric block. Two other Peltier coolers constitute the external chambers for
temperature regulation throughout the calorimetric transducer. This double-stage
temperature control allows to work at temperatures from 228 K (aided by a cooler,
Julabo F32) up to 393 K (LIN; KEDZIERSKI, 2018; SETARAM, 2016).
Two cylindrical containers made of an alloy of iron, nickel and chrome (known as
Incoloy, or 1.4980, A-286) are employed as ‘sample’ and ‘reference’ high-pressure
cells, that are placed inside the calorimetric transducer before the analysis. The
reference cell was kept depressurized and empty in all the experiments performed in
this work. Polymeric elements, shown in Figure 2.3, are used to seal the system and
avoid any gas or liquid leakage. This configuration and combination of materials make
the cells capable of withstanding pressures up to 100 MPa.
53
Figure 2.3 – High-pressure cells used in microcalorimetric experiments.
Figure 2.4 shows the instruments employed during the microcalorimetric
analyses. A gas mixing panel (20 MPa, Gas Panel 2723 Top Industrie) and a high-
pressure compressor (100 MPa, PMHP 1000 Setaram-V2) were coupled to the
microcalorimeter to obtain gaseous binary mixtures of a desired composition and to
work at constant volume or pressure modes, respectively. A maximum operation
pressure of 100 MPa can be reached with an accuracy of 0.2 MPa. Before the
pressurization, the gas is injected at low pressure (~0.5MPa) from the mixing panel to
the compressor chamber, and then the system is purged, including the sample cell.
The procedure is repeated by at least three times in order to minimize the air in the
system. In case of gaseous mixtures preparation, the gas with the lowest partial
pressure in the mixture is injected first into the compressor chamber. Then, the second
gas is injected, and the mixture is subjected to a couple of pressurization and
depressurization cycles for homogenization before allowing the gas mixture to fill the
cells inside the microcalorimeter.
Although nitrogen flows to the internal regions of the microcalorimeter during the
analysis to protect the calorimetric transducer, water condensation over the DSC
components must be avoided, mainly on the surface of the circuit boards near the cold
tubes coming from the FP32 Julabo cooler. For this reason, the equipment was placed
inside an acrylic box with a constant dry airflow coming from a dehumidifier (Cool 20
Dryer CHICAGO PNEUMATIC).
Anti-extrusion ring
Elastomer seals
54
Figure 2.4 – Experimental setup employed for gas hydrates studies based on high-pressure microcalorimetry.
2.1.3 Calibration of the Experimental Apparatus
The microcalorimeter is calibrated from the factory with naphthalene (Setaram
standard, purity ≥ 99.97%) by performing a Joule effect calibration. An annual
procedure is performed by using hermetically sealed standard cells in order to verify
the instrument calibration, as recommended by the manufacturer. Table 2.2 shows the
reference substances used to check temperature and heat calibration and the
comparison between the literature data and the experimental onset values obtained in
this work through the software Calisto, provided by Setaram.
Table 2.2 – Assessment of the instrument calibration (temperature and enthalpy) considering reference substances.
0.2 353.43 147.15 -0.07 1.04 a Rowley et al. (2003) ; b Sabbah et al. (1999).
55
The maximum temperature and enthalpy deviations from the literature data were
0.74 K at low temperatures (243.55 K) for a heating rate of 1 K·min-1 and 1.5 J/g (1.04
%) at high temperatures (353.35 K) when using a heating rate of 0.2 K·min-1,
respectively. Thus, the factory-made calibration has been considered satisfactory.
As will be addressed in detail in section 2.1.4.6, isochoric method was used to
study ternary systems by applying both the traditional PVT cell and the high pressure
microcalorimeter, in order to compare and evaluate the reliability of both methods. In
this case, a pressure variation occurs inside the cell during the experiments, mainly
above 20 MPa. Thus, the dissociation pressure taken from microcalorimetric
measurements was that belonging to the onset point of the hydrate dissociation curves
obtained from thermograms according to the value recorded by the Calisto software,
because the pressure displayed on the compressor panel is not recorded throughout
the analysis. However, it was observed a discrepancy between the pressure provided
by the software Calisto and the one displayed on the compressor panel since the
pressure recorded by the software comes from an electrical signal and is not calibrated
from the factory. For this reason, it was necessary to correct this dissociation pressure
through a linear equation. The equation used in these cases is shown in Figure 2.5
and it is based on 59 experimental data, including binary and ternary systems from 10
to 100 MPa – equivalent to 100 and 1000 bar, according to the unit used by the
software and the compressor panel.
Figure 2.5 – Calibration of pressure for isochoric experiments by HP-µDSC.
56
2.1.4 Methods for Determining Thermodynamic Properties:
2.1.4.1 Dissociation Temperature: Onset, Peak and Endset Points
The experimental methodologies used in this work were adjusted according to
the sample and the property to be studied. In general, the thermal sequence employed
to determine the hydrate dissociation temperatures comprises the following steps:
I – Stabilization of the system at 293 K during 10 min;
II – Gas injection and compression of the system up to the setpoint pressure,
followed by a 10 min isotherm for stabilization;
III – Cooling the furnace down to 233 K at 1 K·min-1, followed by a 10 min
isotherm;
IV – Heating up to 353 K at 1 K·min-1, followed by a 10 min isotherm;
V – Cooling the system back to 293 K.
Considering the absence of mixing inside the cell, the gas hydrate nucleation and
crystal growth are limited by a mass transfer phenomenon. In order to favor hydrate
formation in this condition, it is necessary a high cooling degree (DARABOINA et al.,
2013), which is defined in this work as the difference between the hydrate equilibrium
temperature obtained during heating and the minimum temperature reached when
cooling the system. Therefore, the cooling zone was extended down to 233 K to
guarantee the hydrate formation.
Figure 2.6 presents the usual thermal procedure (A), also known as temperature
profile, and a typical thermogram (B) used in experiments based on differential
scanning calorimetry. The thermogram indicates the thermal transitions usually
obtained during cooling and heating processes. The heat flow in the vertical axis of
figure B represents the difference of heat between the sample and the reference cells.
57
Figure 2.6 – Methodology applied to microcalorimetric analyses: A) Temperature profile throughout the analysis; B) Thermogram indicating usual transitions occurring during the analysis. The thermogram
corresponds to a sample containing a gas mixture of CH4-C2H6 (49.3 mol% CH4) at 100 MPa.
Source: Adapted from Menezes et al. (2020).
The hydrate dissociation curves obtained by HP-μDSC were characterized by the
onset, peak and endset points provided by the Calisto software (the data processing
program provided by Setaram), as illustrated in Figure 2.7.
Figure 2.7. Determination of onset, peak and endset values for the CH4-C3H8 hydrate dissociation curve (sII, 39.3 MPa) using the data processing software Calisto (Setaram).
The so-called onset temperature is determined by the intersection between the
baseline and the tangent line to the dissociation curve at the maximum slope point. It
is widely used for estimating equilibrium points, since it represents the beginning of the
thermal event and it should not be influenced by the heating rate or sample mass
58
(SAEED et al., 2016). However, determining onset values can be a difficult task and
imprecise when there are very close or overlapped transitions caused by kinetic
effects, irregularities in the crystal lattice (different cages occupancy degrees
throughout the structure or empty cavities, in the case of hydrates), polymorphism or
even external noises. The peak temperature, in turn, may be considered as an estimate
when curves overlap or the onset is not well-defined, although it does not strictly
represent an equilibrium point (MENEZES et al., 2019). Despite this method was
chosen in this work because it is simple and provides good results, alternative methods
are also found in the literature for accurate equilibrium properties measurements,
developed specifically for non-constant temperature transitions such as hydrate
melting (LIN et al., 2013; LIN et al., 2014).
2.1.4.2 Enthalpy of Dissociation: Integration of Peaks
The thermodynamic properties of hydrates, such as dissociation enthalpy and
specific heat, are fundamental for determining the operating conditions during gas
exploitation processes and predicting the production rate from hydrate reservoirs. For
this purpose, heat must be provided to raise the temperature of the reservoir and
induce the hydrate dissociation, which makes crucial the determination of hydrate
thermal properties. These properties can be found in the literature only for specific
systems, most based on simulations studies. There are few experimental data
available due to instrumental limitations, especially under extreme pressure and
temperature conditions. With the advent of high-pressure differential scanning
calorimetry, it has been possible to obtain such properties from an indirect method by
integrating thermogram peaks, which allows estimating the enthalpy of the hydrate
during the transition.
The methodology applied in this work is similar to the one described by Gupta et
al. (2008), extended in this case to higher pressures (up to 100 MPa). Considering
Figure 2.6B, the analytical integration of the second peak (heating) provides the total
heat absorbed during the hydrate dissociation phenomenon (��, 𝑚𝑊 · 𝐾). Thus, the
hydrate enthalpy of dissociation per mol of gas (∆𝐻𝑑𝑖𝑠𝑠, 𝐽 · 𝑚𝑜𝑙−1) can be obtained
according to equation 2.1, where ∅ means the heating rate (𝐾 · 𝑚𝑖𝑛−1).
59
∆𝐻𝑑𝑖𝑠𝑠 =�� ℎ𝑦𝑑𝑟𝑎𝑡𝑒 𝑑𝑖𝑠𝑠𝑜𝑐𝑖𝑎𝑡𝑖𝑜𝑛
𝑛 𝑔𝑎𝑠 ∙ ∅
(2.1)
The main difficulty in determining the hydrate enthalpy is the estimation of the
hydrate amount since it requires the amount of ice in the system and to assume a
hydration number in order to establish the stoichiometry of the hydrate formation
reaction. A considerable fraction of liquid water forms ice during the crystallization, and
the remaining fraction forms hydrate. This effect is mainly due to the absence of mixing
in the system, in addition to the subcooling below 273 K, required to induce hydrate
formation. The first crystalline structure formed can be ice or hydrate, depending on
the pressure of the system (DAVIES et al., 2009). In any case, it is necessary to
calculate the amount of water that was not converted to hydrate by integrating the ice
melting peak (equation 2.2). The theoretical heat of ice melting applied in the following
equation was extrapolated from data found in the literature (BRIDGMAN, 1912;
DENYS et al., 2001; FUKUSAKO et al., 1990; KARINO et al., 1994;).
𝑛𝐻2𝑂 (𝑖𝑐𝑒) =�� 𝐼𝑐𝑒 𝑚𝑒𝑙𝑡𝑖𝑛𝑔
∆𝐻 𝐼𝑐𝑒 𝑚𝑒𝑙𝑡𝑖𝑛𝑔 (𝑡ℎ𝑒𝑜𝑟𝑖𝑐𝑎𝑙) ∙ ∅ (2.2)
The amount of water in the form of a hydrate, 𝑛𝐻2𝑂 ( ℎ𝑖𝑑𝑟𝑎𝑡𝑒), can be obtained by
the equation below since the total amount of water initially added in the cell is known:
𝑛𝐻2𝑂 (ℎ𝑦𝑑𝑟𝑎𝑡𝑒) = 𝑛𝐻2𝑂 (𝑡𝑜𝑡𝑎𝑙) − 𝑛𝐻2𝑂 (𝑖𝑐𝑒) (2.3)
Considering the methane hydrate, for instance, the reaction of formation is given
according to the stoichiometry below, in which (𝑛) is the hydration number:
𝐶𝐻4 + 𝑛 𝐻2𝑂 → 𝐶𝐻4 ∙ 𝑛 𝐻2𝑂 (2.4)
Estimations of the hydration number for different hydrates can be found in the
literature (SLOAN; KOH, 2008; SUM, 1997). For methane hydrate, the value for 𝑛 is
usually close to 6 (CIRCONE et al., 2006; HANDA, 1986). However, the hydration
number can vary significantly according to the pressure. For this reason, the values for
60
𝑛 used in integrations for enthalpy calculations were estimated according to two
methods described in section 2.1.4.4.
Considering the amount of water in the form of hydrate (eq. 2.3) and the
stoichiometric ratio (eq. 2.4), it is possible to estimate the amount of gas incorporated
in the hydrate (𝑛 𝑔𝑎𝑠). However, additional consideration is needed when determining
the hydrate enthalpy: there may be the arrangement of the crystalline structure during
the ice melting, leading to the recrystallization in the form of hydrate (GUPTA, 2007).
This phenomenon likely is favored by the absence of mixing inside the HP-µDSC cells
and generates an exothermic band (��2) between the ice melting and the hydrate
dissociation (��1 and ��3, respectively), as shown in Figure 2.8.
Figure 2.8 – Establishment of baseline for calculating enthalpy of hydrate dissociation.
Therefore, the heat of dissociation to be considered in equation 2.1 should be
concerned with the hydrate formed only during the cooling process. Thus, the heat
delivered during the recrystallization (��2) should be subtracted from the total heat
absorbed during the hydrate dissociation (��3). For this, a baseline is established along
the heating process, as indicated in red in the thermogram of Figure 2.8, and it is
considered that the energy above this line corresponds to the recrystallization
phenomenon (��2).
Ergo, the heat of dissociation is finally calculated according to equation 2.5,
considering that the difference between (��3) and (��2) represents the hydrate formed
during the cooling process.
��2
��3 ��1
61
∆𝐻ℎ𝑦𝑑𝑟𝑎𝑡𝑒 =��3 − ��2
𝑛𝑔𝑎𝑠 ∙ ∅ (2.5)
Nevertheless, more accurate results for hydrate dissociation enthalpies are
obtained by applying a multicycles method in order to convert most of ice to hydrate.
In these cases, the recrystallization phenomenon mentioned above is not observed
since most of the ice is converted to hydrate during consecutive cycles.
2.1.4.3 Dissociation Enthalpy: Equation of Clapeyron
The enthalpy values obtained from integrations of DSC-thermogram peaks are
also compared in this work with enthalpies calculated by using the Clapeyron equation
(2.6), often used in the literature for gas hydrate enthalpy estimation. The method
developed in this work is similar, but not strictly the same, to the one reported by
Anderson (2003, 2004), who calculated enthalpies of dissociation for carbon dioxide
hydrates (ANDERSON, 2003) and methane hydrates (ANDERSON, 2004) based on
the Clapeyron equation. In this work, enthalpies of dissociation for methane, ethane
and carbon dioxide single hydrates were determined, and the improvements from
Anderson’s method are pointed out along the description of equations below.
𝑑𝑃
𝑑𝑇=
∆𝐻
𝑇∆𝑉
(2.6)
Firstly, the experimental data (temperature (𝑇, 𝐾) and pressure (𝑃, 𝑀𝑃𝑎)) were
fitted to convenient equations for each system, as presented in the Appendix. Then,
the respective equation was derived to obtain the factor 𝑑𝑃/𝑑𝑇. The volume change,
∆𝑉 (𝑚3. 𝑚𝑜𝑙−1) is the sum of the partial molar volumes regarding the three phases
involved in the dissociation reaction: hydrocarbon or CO2 (𝑉𝐻𝐶 or 𝑉𝐶𝑂2; vapor or liquid),
water (𝑉𝐻2𝑂; ice or liquid) and hydrate (𝑉ℎ𝑦𝑑; solid). The hydration number (𝑛) was
determined by two different methods, described in section 2.1.4.4.
∆𝑉 = (1 −𝑛 ∙ 𝑥𝐻𝐶
1 − 𝑥𝐻𝐶) ∙ 𝑉𝐻𝐶 + 𝑛 ∙ (𝑉𝐻2𝑂 + (
𝑥𝐻𝐶
1 − 𝑥𝐻𝐶) ∙ 𝑉𝐻𝐶,𝐻2𝑂
∞ ) − 𝑉ℎ𝑦𝑑 (2.7)
62
𝑉𝐻𝐶 and 𝑉𝐻2𝑂 were obtained from NIST Webbook database. The equations of
state employed for methane, ethane, carbon dioxide and water were reported by
Setzmann and Wagner (1991), Friend et al. (1991), Span and Wagner (1996) and
Wagner and Pruss (2002), respectively. The volumes of the methane and ethane in
water at “infinite dilution” (𝑉𝐻𝐶,𝐻2𝑂∞ ) were calculated according to temperature-
dependent equations reported by Rettich et al. (1981). For carbon dioxide, the value
used was reported by Anderson (2002). The equation above also considers the
solubility of the hydrocarbon in water (𝑥𝐻𝐶). For methane and ethane, it was determined
through the Krichevsky-Kasarnovsky equation (1935), usually employed for vapor-
liquid solutions at high pressures:
𝑙𝑛 (𝑓
𝑥𝐻𝐶) = ln 𝐾𝐻 +
𝑉𝐻𝐶,𝐻2𝑂∞ (𝑃 − 𝑃𝑠)
𝑅𝑇
(2.8)
The fugacity (𝑓) was calculated from thermodynamic data (enthalpy and entropy)
available in NIST Webbook (http://webbook.nist.gov.). Equations for determining the
natural logarithm of Henry’s law constant (𝐾𝐻) for both CH4 and C2H6 are also reported
by Rittich et al. (1981). Finally, 𝑃 is the pressure of the system and 𝑃𝑠 is the vapor
pressure of water at the respective temperature, that can be calculate from Antoine’s
equation or derivatives (ANTOINE, 1888). The solubility of carbon dioxide in water, in
turn, was calculated by correlations from Diamond and Akinfiev (2003) throughout the
hydrate equilibrium line above the upper quadruple point (Q2), corresponding to the
region addressed in this work.
The volume of hydrate containing one mole of hydrocarbon or CO2 required by
equation. 2.7, was calculated according to the equation below, (ANDERSON, 2004):
By assuming that 𝑛(1) = 𝑛(2), one can note that the standard enthalpies of
formation are cancelled in the equation above. The enthalpy of the dissociation
reaction at any point 1 (𝛥𝐻 𝑑𝑖𝑠𝑠 (1)) was initially calculated by the Clapeyron equation,
67
considering an initial value of 𝑛. The enthalpy of the hydrate dissociation reaction at
point 2 was found for each system in the literature (ANDERSON, 2003; HANDA, 1986;
KANG et al., 2001). The enthalpies of hydrocarbons and water (𝐻𝐻𝐶 and 𝐻𝐻2𝑂) were
taken directly from NIST Webbook, according to the equations available on the site
(http://webbook.nist.gov). The difference of the hydrate enthalpies (𝐻𝐻𝑦𝑑(2)−
𝐻𝐻𝑦𝑑(1)) was calculated considering the definition by partial derivatives:
𝑑𝐻ℎ𝑦𝑑 = (𝜕𝐻ℎ𝑦𝑑
𝜕𝑇)
𝑃
∙ 𝑑𝑇 + (𝜕𝐻ℎ𝑦𝑑
𝜕𝑃)
𝑇
∙ 𝑑𝑃 (2.25)
From thermodynamic correlations, we find the extended forms below for the
partial contributions:
(𝜕𝐻ℎ𝑦𝑑
𝜕𝑃)
𝑇
= 𝑉ℎ𝑦𝑑 − 𝑇 ∙ (𝜕𝑉ℎ𝑦𝑑
𝜕𝑇)
𝑃
= 𝑉ℎ𝑦𝑑 ∙ (1 − 𝛽(𝑣) ∙ 𝑇) (2.26)
(𝜕𝐻ℎ𝑦𝑑
𝜕𝑇)
𝑃
= 𝑐𝑝ℎ𝑦𝑑(𝑇) (2.27)
The determination of the thermal expansivity parameter (𝛽(𝑉)) ant the molar
volume of the hydrate (𝑉ℎ𝑦𝑑) were described previously. The value of the specific heat
(𝑐𝑝ℎ𝑦𝑑(𝑇)) of each hydrate was extrapolated by applying equations reported by Handa
(1986), in case of methane and ethane hydrates, and Ning (2015), for carbon dioxide
hydrate. Therefore, the integration of the equations 2.26 and 2.27 allows to determine
the difference of the hydrate enthalpies between point 1 and 2:
𝐻𝐻𝑦𝑑(2)− 𝐻𝐻𝑦𝑑(1)
= ∫ 𝑉ℎ𝑦𝑑 ∙ (1 − 𝛽(𝑣)𝑇).𝑃2
𝑃1
𝑑𝑃 + ∫ 𝑐𝑝ℎ𝑦𝑑(𝑇) ∙
𝑇2
𝑇1
𝑑𝑇 (2.28)
Finally, by reorganizing the equation 2.24, the hydration number was estimated
by equation 2.29 considering the enthalpies calculated previously. The new 𝑛(1) value
68
was used to recalculate 𝛥𝐻1 and this cycle was repeated through iterations until the
output coincided with the input.
𝑛 =𝛥𝐻1 − 𝛥𝐻2 + (𝐻𝐻𝐶(2)
− 𝐻𝐻𝐶(1)) + (𝐻𝐻𝑦𝑑(1)
− 𝐻𝐻𝑦𝑑(2))
(𝐻𝐻2𝑂(1)− 𝐻𝐻2𝑂(2)
) (2.29)
2.1.4.5 Multicycles Method
Studies developed in our laboratory have demonstrated that the use of a
multicycle mode, as proposed by Marinhas et al. (2006), improves the interactions
between the compounds that are inside the sample cell of the microcalorimeter,
reduces the ice fraction by promoting the hydrate formation, and reduces the error
associated with the enthalpy calculation. Unlike the standard analysis described
above, this methodology consists of subjecting the sample to several successive
cooling-heating cycles, as shown in Figure 2.9.
Figure 2.9 – Illustration of the multicycle method for higher conversion of ice into gas hydrate.
Before the last cycle, in which the hydrate is dissociated, the sample is heated up
to a temperature between the ice melting (TENDSET) and the hydrate dissociation
(TONSET), depending on the pressure of the system. This intermediate temperature at
which the sample is heated up during the cycles is previously estimated by performing
a standard analysis before applying the multicycle method. The ice and the hydrate
69
peaks are sufficiently separated when pressure is higher than 9.8 MPa, then the
sample is heated to 5 K or more from the ice melting endset temperature in these
cases. For lower pressures, the difference between the mentioned points may be lower
than 5 K, and the peaks may overlap each other, especially for methane and carbon
dioxide hydrates, making necessary the deconvolution of them.
By using this method, the amount of non-converted ice is reduced at every cycle,
and the water conversion into hydrate is over 97% after the last cycle. The number of
cycles required for this conversion depends on several factors, ranging from 5 (carbon
dioxide hydrate at 50 MPa) to 37 cycles (ethane hydrate at 20 MPa) in this work. Once
the desired water conversion is obtained, the heating of the last cycle is extended so
that the gas hydrate is completely dissociated, and the equilibrium properties are
determined from the dissociation peak.
2.1.4.6 Isobaric vs. Isochoric Method
The HP-µDSC allows working in isobaric or isochoric modes. Experiments with a
single gas as a guest molecule were performed applying the isobaric method. In this
case, the valve of the gas panel, which connects the gas chamber and the sample cell,
was kept opened along the experiment. Thus, the constant addition or withdrawal of
gas in the system compensate the pressure variation caused by temperature change
or by hydrate formation / dissociation, allowing the pressure to be maintained
throughout the analysis. The advantage of this method consists of having constant
pressure for determining the dissociation points. This is not possible when using a
traditional PVT cell since the pressure is initially reached by a booster and then the
system is closed (isochoric system). Unlikely, hydrate-forming systems containing gas
mixtures presented in chapter 5 were analyzed by applying the isochoric method in the
microcalorimeter, in which the referred valve was kept closed in order to maintain
constant the overall composition of the system and to make feasible the comparison
of experimental data to computational predictions.
Although the amount of water itself does not affect the hydrate equilibrium
significantly, the final gas-phase composition calculated by CSMGem predictions may
be different from gas fractions entered as “input” when working with mixtures of gases,
since the proportion of gas incorporated into the hydrate is not exactly the same as in
the gas phase. The guest molecules are incorporated preferentially into small or large
70
cages according to their molecular size, then the fraction of each species taken from
gas phase also depends on the availability of each cavity in the hydrate structure being
formed. For this reason, it was initially considered important to keep the system closed
during the analysis in these cases and to calculate the predictions considering the
overall composition that there was inside the cell at the beginning of the experiment.
However, the use of an isochoric method (HP-µDSC) for such kind of samples implies
a pressure variation inside the cell, and thereby, the dissociation pressure for these
experiments was considered to be the one obtained at the onset of the hydrate
dissociation curves. Thus, the pressure data registered by Calisto software were
corrected according to a linear equation, as mentioned in section 2.1.3.
2.1.4.7 Estimation of Overall and Gas-Phase Compositions
In case of ternary systems, composed of two gaseous species and water, the gas
phase composition inside the high-pressure cell of the microcalorimeter was estimated
from the partial pressures indicated on the high-pressure panel. The ideal condition
was considered to correlate the partial pressures with the gas molar fractions (𝑥1, 𝑥2)
of the gases injected into the chamber through the gas injection panel, according to
the equation 2.30. PB is the partial pressure of the second gas, and it refers to the
difference between the total pressure (P) and the partial pressure of the first gas
injected (PA), according to Dalton´s Law.
𝑃𝐵 = 𝑃 − 𝑃𝐴 = 𝑃𝐴 ∙𝑥𝐵
𝑥𝐴 (2.30)
In order to estimate the overall composition inside the cell, the Peng-Robinson
equation of state (PR) was applied, considering the initial conditions of temperature
and pressure, and the gas volume in the system. The latter was calculated by
subtracting the volume of the water sample from the cell volume. Data regarding the
water density were obtained from NIST Chemistry Webbook. The study regarding this
topic is presented in Chapter 3.
71
2.2 ULTRA HIGH PRESSURE SYSTEM: PVT-ISOCHORIC METHOD
2.2.1 Experimental Configuration
The PVT-isochoric experiments presented in this work were performed in the
Ultra High Pressure system (UHP system) available at the Phases to Flow Laboratory
of the Colorado School of Mines (USA). The configuration allows obtaining hydrate
equilibrium data up to 200 MPa under temperature control (±0.25 K and ±0.3 MPa).
The experimental configuration is comprised of a gas booster, a manual pressurizing
pump, a magnetic stirrer (500 rpm) and a thermostatic bath where the PVT cell is
placed (temperature range depends on the cooling fluid). Inside the PVT cell, there is
a cylinder (50 mL), where deionized water sample (~15 mL) is added. A baffle is
accoupled to this cylinder to break gas-liquid interface and promote mixing. Finally, the
cell is closed using a screw-top lid and the system is pressurized with the help of the
mentioned gas booster. Pressure and temperature data are recorded during the
experimental procedure, allowing the measurement of hydrate equilibrium points.
Figures 2.10 and 2.11 show the experimental setup, including the PVT cell
allocated inside the thermal bath and the gas cylinder.
Figure 2.10 – Ultra-High-Pressure System used to analyze hydrates through the PVT- isochoric method.
Source: Photos taken at the Phases to Flow laboratory, Colorado School of Mines.
72
Figure 2.11 – Commercial gas cylinder joined to the gas booster.
Source: Photo taken at the Phases to Flow laboratory, Colorado School of Mines.
2.2.2 Preparation of Methane-Propane Mixture by Gravimetry
A high-purity commercial gas cylinder was used for single gas hydrate analyses.
However, some custom mixtures of methane and propane were gravimetrically
prepared in the laboratory from pure gases by using a Swagelok cylinder (0.475 L) and
a balance (Mettler Toledo) able to weight up to 8100 g with an accuracy of 0.1 g, shown
in Figure 2.12.
Figure 2.12. Swagelok cylinder used for homemade gas mixtures (methane + propane) (A) and high-performance balance (B).
Source: Photo taken at the Phases to Flow laboratory, Colorado School of Mines.
The preparation of the mixtures followed the steps described below and the
thermodynamic parameters are indicated in Figure 2.13:
B A
73
I – Stipulation of the molar fraction of methane (xA) and propane (xB) in the
gas phase;
II – Determination of the gas phase density (ρ2) inside the PVT cell by using
the software Aspen Hysys and the Peng-Robinson equation, considering
the established composition (xA and xB), the pressure to be applied in the
experiment (P2) and the volume of gas-phase (VG ~35 mL);
III – Calculation of total gas amount (nT2) required to reach the stipulated
pressure inside the PVT cell (P2), considering the gas density (ρ2)
determined previously and the volume of gas-phase (VG ~35 mL);
IV – Estimation of total gas amount (nT1) required in the cylinder for the gas
mixture so that enough gas could be available to be transferred from this
one (at lower pressure) to the PVT cell until to reach the stipulated
pressure. The amount of gas inside the cylinder for mixture should be
greater than the one that is injected inside the PVT cell;
V – Estimation of the partial pressures (PA1 and PB1) required in the mixture
cylinder, considering the total gas amount (nT1) estimated in the last step
and its corresponding composition (xA and xB).
By following these steps, each gas was injected inside the mixture cylinder and
the weight was taken for each one so that the real composition was calculated based
on gravimetric measurements.
Figure 2.13 – Thermodynamic parameters calculated for gas transfer from the mixing cylinder to the PVT cell.
74
2.2.3 Determination of Equilibrium Data
The experimental procedure to obtain equilibrium data via the PVT-isochoric
method includes basically three stages described below (CHA; HU; SUM, 2016; HU et
al., 2017;). Stepwise heating is required in order to make sure that the system is in
state of equilibrium and to determine accurately the final pressure at which the solid
phase is totally dissociated. Nevertheless, this stepwise procedure was not performed
in experiments focused on checking the dissociation profile (P vs T) rather than the
equilibrium points. In such cases, a fast heating stage was performed continuously at
the same rate until complete hydrate dissociation.
I – The first segment (AB) refers to a fast cooling of the system with a
consequent drop in the pressure. A’ refers to the point where hydrate
formation starts, leading to gas consumption and a more accentuated
drop in the pressure. Minimum temperature ranges between 278 K and
293 K, depending on the system, so that hydrate formation is induced,
and the ice formation is avoided;
II – The next stage (BC) is the fast heating of the system (5-10 K/h), during
which the increase in pressure is mainly concerned with gas compression
(higher molecular excitation);
III – Finally, the last segment (CD) indicates the stepwise range, where the
temperature is increased by 0.2 K every 2 hours. In this stage, the
pressure increases in each step due to the gas release from hydrate
phase until equilibrium is achieved again. The dissociation of remaining
hydrate phase occurs in the last step and the equilibrium point is
determined by the intersection of cooling and heating lines.
Figure 2.14 illustrates all the steps employed during analyses using a PVT cell
through the isochoric method.
75
Figure 2.14 – Experimental stages followed in a methane hydrate analysis through the isochoric method in the PVT cell.
Figure 2.15 exhibits temperature and pressure versus time to provide a better
view of each step established by the increase of 0.2 K every 2 hours. The arrows
indicate the dissociation point (D), that provides the thermodynamic conditions at the
point in which the last hydrate crystal dissociates.
Figure 2.15 – Temperature and pressure profiles obtained for a methane-water system through the PVT - isochoric method.
76
2.3 RAMAN SPECTROSCOPY
Raman spectroscopy is a scattering technique usually used to identify molecules
and chemical structures through vibrational, rotational and other low-frequency
transitions in the system. It is based on the Raman effect, that involves the interaction
of incident radiation (monochromatic light) with the molecules and the reemission of
photons with a different vibration. This phenomenon is known as inelastic scattering
since the frequency of incident light shifts up or down after its interaction with the
sample, as illustrated in Figure 2.16. However, most of the reemitted monochromatic
radiation (>99.99%) is scattered with the same frequency as the incident radiation,
known as the elastic Rayleigh scattering. Hence, it is required to use special
techniques and instruments to separate the Raman and Rayleigh scatterings
(BUMBRAH; SHARMA, 2016).
Figure 2.16 – Light scatterings involved in Raman spectroscopy.
Source: Adapted from PETUYA, 2017.
Gas hydrate studies based on Raman spectroscopy were conducted at the
platform SIV (“Spectroscopie et Imagerie Vibrationnelle”), in partnership with the
“Groupe Spectroscopie Molléculaire” (GSM) at Université de Bordeaux (France), which
is funded by the FEDER and the Region Aquitaine. In this work, a green laser (532 nm
wavelength) was applied as the excitation source. This monochromatic light was
focused on the sample by a confocal optical microscope, which makes it possible to
improve the lateral and axial resolutions at micrometric spatial resolution. A 50x
objective (Olympus) was used to focus the laser beam on the sample. The setup allows
to analyze the sample by choosing different areas and depths of penetration and it is
77
described in detail by PETUYA (2017). Figure 2.17 illustrates the trajectory of radiation
along the Raman spectrometer (Labram UV, Horiba Jobin Yvon, Villeneuve d’Asq,
France). The radiation initially passes through an interferential filter, which suppresses
stray lights from noisy sources, and then through a holographic notch filter that
attenuates the Rayleigh line in a narrow bandwidth allowing to collect both Stokes and
anti-Stokes Raman data (TEDESCO et al., 1993). A holographic grating of 1800
lines/mm disperses the Raman scattering providing a high spectral resolution. Finally,
a Peltier-cooled CCD detector (Andor, UK) recovers the Raman scattering,
transforming the light signal into an electrical signal. The spectra calibration was
performed using the 520.7 cm-1 vibration mode of a silicon sample.
Figure 2.17 – Trajectory of the radiation along the Raman spectrometer (Labram UV).
Source: Adapted from PETUYA (2017).
Different methodologies (ex situ and in situ) were applied in the preparation and
analysis of gas hydrates in order to evaluate the most appropriate one for structural
and compositional characterization. When working with gas mixtures, it was employed
the procedure described in section 2.3.1 for both methods. The ex situ methodology
was used to characterize methane-propane hydrates prepared at different gas phase
compositions and it is presented in section 2.3.2. Although the results in this work
indicate that the in situ methods are not the most suitable for a homogeneous
characterization of gas hydrates, they were relevant to visualize and understand the
78
mechanisms of hydrate growth in static systems (in absence of mixing). For that
reason, the in situ methodology is also described in the section 2.3.3. Results for both
ex situ and in situ analyses are shown in chapter 7 of this work.
2.3.1 Procedure for Mixing Gases
A different methodology from the previous ones (HP-µDSC and PVT-isochoric
method) was employed in the preparation of methane-propane hydrates characterized
by Raman spectroscopy. The gas mixtures were made by using a homemade setup
composed of two pumps shown in Figure 2.18.
Figure 2.18 – Pumps employed for the preparation of gas mixtures and pressurization of the hydrate-forming systems: A) Isco (260 cm3); B) Top Industrie (100 cm3).
Source: Photos taken at the GSM laboratory, Université de Bordeaux
Methane is injected in the first pump (Isco) while propane is injected in an
automatized one (Top Industrie). Such a setup allows us to measure both volume and
pressure accurately for each gas, and then both are brought into contact by transferring
the methane gas into the chamber of the second pump, as illustrated in Figure 2.19.
The mixture is kept under a sinusoidal variation of pressure (± 30 MPa from the initial
pressure) for 30 minutes in order to homogenize the gas mixture. A similar procedure
is described with details by Petuya et al. (2018).
A B
79
Figure 2.19 – Schematic illustration of methane-propane mixtures preparation.
2.3.2 Procedures for ex situ Analyses
Ex situ analyses were performed on hydrates samples prepared from ice powder.
The advantage of this method is based on the formation of a more homogeneous
hydrate sample since ice powder provides greater surface area and interstitial gaps
that favor diffusion of gas molecules and restructuring of crystalline lattice. Thus, this
method was the main one applied to prepare gas hydrate samples in order to obtain
compositional analyses by Raman spectroscopy.
For the preparation of samples, ice is crushed in a mortar until to obtain a fine
powder, and then it is transferred to stainless steel cells (Figure 2.20). This procedure
is performed at about 195K in a chamber filled with pellets of dry ice. Next, the cells
containing ice powder are pressurized with the respective gas at 8.7 MPa and kept at
253K for 3 days aided by a thermostatic bath. The temperature control in this step is
also essential to lead to the formation of hydrate structures while avoiding the
80
condensation of the gas phase. Posteriorly, the hydrate samples are depressurized
and immediately transferred to a vessel under inert atmosphere and liquid nitrogen
(~77K) so that the gas hydrates remain stable.
Figure 2.20 – High-Pressure cell used to prepare ex situ gas hydrate samples.
Source: Photos taken at the GSM laboratory, Université de Bordeaux
For Raman measurements, a fraction of the sample is inserted into a metal
surface of a modified optical cell (Linkam CAP500, Figure 2.21) with the aid of a quartz
capillary tube also cooled in liquid nitrogen. The optical cell is maintained at 140 K all
over the analysis thanks to a laboratory-modified temperature-controlled stage (based
on the Linkam THMS600 stage), which pumps nitrogen inside the cell according the
specified temperature.
Figure 2.21 – Optical cell (Linkam) used in the Raman spectroscopy of gas hydrates prepared ex situ.
Source: PETUYA, 2017.
A container stores and supplies liquid nitrogen to this device throughout the
experiment. The setup is shown in Figure 2.22.
81 Figure 2.22 – Setup for Raman spectroscopy measurements of samples prepared ex situ.
Source: PETUYA, 2017.
2.3.3 Procedures for in situ Analyses
2.3.3.1 Capillary Cell
The purpose of the analyses, according to this method, was to obtain Raman
spectra of the hydrate structures during the formation process. The first method
employed to analyze gas hydrates formation in situ is based on a modified Capillary
Pressure Stage (Linkam CAP500) designed to heat and cool high-pressure quartz
capillaries. Figure 2.23 indicates the main features of the apparatus that allows visual
monitoring of the hydrate growth and the obtaining of Raman spectra.
Figure 2.23. Capillary cell (Linkam CAP500) used for in situ analysis of gas hydrates.
Source: Photos from GSM collection, Université de Bordeaux.
82
The samples preparation procedure is the same employed by Petuya et al. (2018)
and it is described below in detail. The quartz capillary is illustrated in Figure 2.24.
I – A square-shape quartz capillary (inner diameter = 200 µm) was partially
filled with Milli-Q water via capillary suction;
II – The dry end of the tube was sealed by using a propane blowtorch, and
the capillary was subjected to centrifugation (13000 rpm for 45 minutes)
in order to push the column of water to the sealed end;
III – The quartz capillary was attached to the metal tube of the Linkam cell
(Figure 2.25) and fixed by a high-performance glue. The system was
maintained at rest overnight;
IV – Methane gas was slowly injected through the cell until it reached 20 MPa.
The valve was closed to check for leaks;
V – The green laser beam was focused on the interface of gas and liquid
phases (meniscus). Finally, the system was cooled down to 278K to
induce hydrate formation.
Figure 2.24 – Illustration of the sample settled on the capillary cell (Linkam CAP500)
2.3.3.2 Cylindrical Cell (Linkam)
The following configuration employed for studying gas hydrates in situ features a
modified cell (Linkam THMS600) that includes an optical cell inside and allows Raman
measurements thanks to a sapphire window (2 mm) resistant to high pressures, as
shown in Figure 2.25.
83 Figure 2.25 – Cylindrical cell (Linkam THMS600) used for in situ analyses of gas hydrates.
Source: Adapted from PETUYA, 2017.
The cell was placed vertically, and the microscope objective was adapted, as
showed in Figure 2.26, so that the light beam could be directed straightly to the solid
phase. Methane molecules in the gas phase have very similar vibrational modes to the
molecules in the hydrate structure. Thus, if the light beam passes through the gas
phase, the methane content trapped in the hydrate cavities is overestimated. For this
reason, it was necessary to avoid interference of the gas phase in the spectra.
Figure 2.26 – Scheme of Raman spectroscopy analyses by placing the cell (THMS600) vertically.
In this case, the sample was prepared by injecting 0.5 mL of Milli-Q water into the
cell in the vacuum. Then, the cell was pressurized slowly with methane gas up to 16.4
MPa by the Top Industrie pump shown in Figure 2.18b. The optical cell was cooled
down to 263 K at 1 K·min-1 and kept at this temperature throughout the analysis by
using the same temperature-controlled stage mentioned in the latter section, which
manages the nitrogen flow in the outer region of the optical cell.
84
REFERENCES
ANDERSON, G.K. Enthalpy of dissociation and hydration number of carbon dioxide hydrate from the Clapeyron equation. The Journal of Chemical Thermodynamics, v. 35, p. 1171-1183, 2003. ANDERSON, G.K. Enthalpy of dissociation and hydration number of methane hydrate from the Clapeyron equation. Journal of Chemical Thermodynamics, v. 36, p. 1119-1127, 2004. ANDERSON, G.K. Solubility of Carbon Dioxide in Water under Incipient Clathrate Formation Conditions. Journal of Chemical and Engineering Data, v. 47, p. 219-222, 2002. ANTOINE, C. Tensions des vapeurs: nouvelle relation entre les tensions et les températures. Comptes Rendus de l’Académie de Sciences, v. 107, p. 681-684, 1888. BALLARD, A.L. A non-ideal hydrate solid solution model for a multi-phase equilibria program. Ph.D. Thesis, Colorado School of Mines, 2001. BRIDGMAN, P.W. Water, in the liquid and five solid forms, under pressure. Proceedings of the American Academy of Arts and Sciences XLVII, v. 13, p. 439-558, 1912. BUMBRAH, G.S.; SHARMA, R.M. Raman spectroscopy – Basic principle, instrumentation and selected applications for the characterization of drugs of abuse. Egyptian Journal of Forensic Sciences, v. 6, p. 209-215, 2016. CHA, M., HU, Y., SUM, A.K. Methane hydrate phase equilibrium for systems containing NaCl, KCl, and NH4Cl. Fluid Phase Equilibria, v. 413, p. 2-9, 2016. CIRCONE, S., S. H. KIRBY, AND L. A. STERN. Thermodynamic calculations in the system CH4-H2O and methane hydrate phase equilibria. The Journal of Physical Chemistry B, v. 110, p. 8232–8239, 2006. DARABOINA, N.; MALMOS, C.; SOLMS, N. Investigation of kinetic hydrate inhibition using a high pressure micro differential scanning calorimeter. Energy Fuels, v. 27:10, p. 5779– 5786, 2013. DAVIES, S.R.; HESTER, K.C.; LACHANCE, J.W.; KOH, C.A.; SLOAN, E.D. Studies of hydrate nucleation with high pressure differential scanning calorimetry. Chemical Engineering Science, v. 64, p. 370-375, 2009. DE FORCRAND, R. Comptes Rendus, v. 135, p. 959–961, 1902. DENYS, S.; SCHLÜTER, O.; HENDRICKX, M.E.G.; KNORR, D. Effects of High Pressure on Water-Ice Transitions in Foods. In: Hendrickx M.E.G., Knorr D., Ludikhuyze L., Van Loey A., Heinz V. (eds) Ultra High Pressure Treatments of Foods, chapter 8, p. 242. Food Engineering Series. Springer, Boston, MA, 2001.
85
DIAMOND, L.W.; AKINFIEV, N.N. Solubility of CO2 in water from −1.5 to 100 ◦C and from 0.1 to 100 MPa: evaluation of literature data and thermodynamic modelling. Fluid Phase Equilibria, v. 208, p. 265-290, 2003. FRIEND, D.G.; INGHAM, H.; ELY, J.F. Thermophysical properties of ethane. Journal of Physical and Chemical Reference Data, v. 20, p. 275-347, 1991. FUKUSAKO, S. Thermophysical properties of ice, snow, and sea ice. International Journal of Thermophysics, v. 11, p. 353-372, 1990. GUPTA, A. Methane Hydrate Dissociation Measurements and Modeling: The Role of Heat Transfer and Reaction Kinetic, Ph.D. thesis, Colorado School of Mines, Golden, Colorado, USA, 2007. GUPTA, A.; LACHANCE, J.; SLOAN, E. D.; KOH, C. A. Measurements of methane hydrate heat of dissociation using high pressure differential scanning calorimetry. Chemical Engineering Science, v. 63, p. 5848-5853, 2008. GUTT, C.; ASMUSSEN, B.; PRESS, W; JOHNSON, M.R.; HANDA, Y.P.; TSE, J.S. The structure of deuterated methane-hydrate. Journal of Chemical Physics, v. 113, p. 4713-4721, 2000. HANDA, Y.P. Compositions, enthalpies of dissociation, and heat capacities in the range 85 to 270 K for clathrate hydrates of methane, ethane, and propane, and enthalpy of dissociation of isobutane hydrate, as determined by a heat-flow calorimeter. Journal of Chemical Thermodynamics, v. 18, p. 915- 921, 1986. HESTER, K.C.; HUO, Z.; BALLARD, A.L.; KOH, C.A.; MILLER, K.T.; SLOAN, E.D. Thermal Expansivity for sI and sII Clathrate Hydrates. Journal of Physical Chemistry B, v. 111, p. 8830-8835, 2007. HU, Y.; LEE, B.R.; SUM, A.K. Phase equilibrium data of methane hydrates in mixed brine solutions. Journal of Natural Gas Science and Engineering, v. 46, p. 750-755, 2017. HUO, Z. Hydrate Phase Equilibria Measurements by X-ray Diffraction and Raman Spectroscopy. Ph.D. Thesis, Colorado School of Mines, 2002. IKEDA, T.; YAMAMURO, O.; MATSUO, T.; MORI, K.; TORII, S.; KAMIYAMA, T.; IZUMI, F.; IKEDA, S.; MAE, S. Neutron diffraction study of carbon dioxide clathrate hydrate. Journal of Physics and Chemistry of Solids, v. 60, p. 1527-1529, 1999. KANG, S.-P.; LEE, H.; RYU, B.-J. Enthalpies of dissociation of clathrate hydrates of carbon dioxide, nitrogen, (carbon dioxide + nitrogen), and (carbon dioxide + nitrogen + tetrahydrofuran). Journal of Chemical Thermodynamics, v. 33, p. 513-521, 2001. KARINO, S.; HANE, H.; MAKITA, I. Behavior of water and ice at low temperature and high pressure. In R. Hayashi, S. Kunugi, S. Shimada, & A. Suzuki (Eds.), High Pressure Bioscience (p. 2-9). Kyoto: San-Ei Suppan. 1994.
86
KLAPPROTH, A.; GORESHNIK, E.; STAYKOVA, D.; KLEIN, H.; KUHS, W. Structural studies of gas hydrates. Canadian Journal of Physics, v. 81, p. 503–518, 2003. KODRE, K.V.; ATTARDE, S.R.; YENDHE, P.R.; PATIL, R.Y.; BARGE, V.U. Differential scanning calorimetry: a review. Research and Reviews: Journal of Pharmaceutical Analysis, v. 3, p. 11-22, 2014. KRICHEVSKY, I.R.; KASARNOVSKY, J.S. Thermodynamical Calculations of Solubilities of Nitrogen and Hydrogen in Water at High Pressures. Journal of the American Chemical Society, v.57, p. 2168-2171, 1935. LIN, L.; KEDZIERSKI, M.A. Specific heat of aluminum-oxide nanolubricants. International Journal of Heat and Mass Transfer, v. 126, p. 1168-1176, 2018. LIN, W.; DALMAZZONE, D.; FÜRST, W.; DELAHAYE, A.; FOURNAISON, L.; CLAIN, P. Accurate DSC measurement of the phase transition temperature in the TBPB–water system. The Journal of Chemical Thermodynamics, v. 61, p. 132-137, 2013. LIN, W.; DALMAZZONE, D.; FÜRST, W.; DELAHAYE, A.; FOURNAISON, L.; CLAIN, P. Thermodynamic properties of semiclathrate hydrates formed from the TBAB+TBPB+water and CO2+TBAB+TBPB+water systems. Fluid Phase Equilibria, v. 372, p. 63-38, 2014. LINSTROM, P.J.; MALLARD, W.G. (Eds.). NIST Chemistry WebBook, NIST Standard Reference Database Number 69, July 2001, National Institute of Standards and Technology, Gaithersburg MD, 20899 (http://webbook.nist.gov). MARINHAS, S.; DELAHAYEA, A.; FOURNAISONA, L.; DALMAZZONE, D.; FURST, W.; PETITET, J.P. Modelling of the available latent heat of a CO2 hydrate slurry in an experimental loop applied to secondary refrigeration. Chemical Engineering and Processing, v. 45, p. 184–192, 2006. MENEZES, D.E.S.; SUM, A. K.; DESMEDT, A.; PESSOA FILHO, P. A.; ROBUSTILLO, M.D. Coexistence of sI and sII in methane-propane hydrate former systems at high pressures. Chemical Engineering Science, v. 208, 115149, 2019. MENEZES, D.E.S.; PESSÔA FILHO, P.A.; ROBUSTILLO, M.D. Use of 1-Butyl-3-methylimidazolium-based ionic liquids as methane hydrate inhibitors at high-pressure conditions. Chemical Engineering Science, v. 212, 115323, 2020. NING, F.L.; GLAVATSKIY, K.; JI, Z.; KJELSTRUP, S.; VLUGTE, T.J.H. Compressibility, thermal expansion coefficient and heat capacity of CH4 and CO2 hydrate mixtures using molecular dynamics simulations. Physical Chemistry Chemical Physics, v. 17, p. 2869, 2015. PETUYA, C. Étude de la stabilité, de l’occupation des cages et de la sélectivité moléculaire des hydrates de gaz par spectroscopie Raman. PhD Thesis, Université de Bordeaux, Bordeaux, France, 2017.
87
PETUYA, C.; DAMAY, F.; CHAZALLON, B.; BRUNEEL, J.-L.; DESMEDT, A. Guest Partitioning and Metastability of the Nitrogen Gas Hydrate. The Journal of Physical Chemistry C, v. 122, p. 566-573, 2018. RETTICH, T.R.; HANDA, Y.P.; BATTINO, R.; WILHELM E. Solubility of gases in liquids. 13. High-precision determination of Henry's constants for methane and ethane in liquid water at 275 to 328 K. The Journal of Physical Chemistry, v. 85, p. 3230-3237, 1981. ROWLEY, R.L.; WILDING, W.V.; OSCARSON, J.L.; YANG, Y.; ZUNDEL N.A.; DAUBERT, T.E.; DANNER, R.P. “DIPPR Data Compilation of Pure Compound Properties,” Design Institute for Physical Properties. American Institute of Chemical Engineers, New York, 2003. SABBAH, R.; XU-WU, A.; CHICKOS, J.S.; PLANAS LEITÃO, M.L.; ROUX, M.V.; TORRES, L.A. Reference materials for calorimetry and differential thermal analysis. Thermodynamic Acta, v. 331, p. 93-204, 1999. SAEED, R.M.; SCHLEGEL, J.P.; CASTANO, C.; SAWAFTA, R. Uncertainty of thermal characterization of phase change material by differential scanning calorimetry analysis. International Journal of Engineering Research and Technology, v. 5, p. 105-412, 2013. SETARAM Instrumentation, Brochure of micro DSC 7 evo, Caluire, France, 2016. SETZMANN, U.; WAGNER, W. A new equation of state and tables of thermodynamic properties for methane covering the range from the melting line to 625 K at pressures up to 1000 MPa. Journal of Physical and Chemical Reference Data, v. 20, p. 1061-1151, 1991. SLOAN E.D.; KOH, C. Clathrate hydrates of natural gases, 3rd ed. Boca Raton: CRC Press, 2008. SPAN, R.; WAGNER, W. A new equation of state for carbon dioxide covering the fluid region from the triple-point temperature to 1100 K at pressures up to 800 MPa. Journal of Physical and Chemical Reference Data, v. 25, p. 1509-1596, 1996. SUM, A.K.; BURRUSS, R.C.; SLOAN, E.D. Measurement of clathrate hydrates via Raman spectroscopy. The Journal of Physical Chemistry B, v. 101 (38), p. 7371-7377, 1997. TEDESCO, J.M.; OWEN, H.; PALLISTER, D.M.; MORRIS, M.D. Principles and spectroscopic applications of volume holographic optics. Analytical Chemistry, v. 65, p. 441A-449A, 1993. UDACHIN, K.A.; RATCLIFFE, C.I.; RIPMEESTER, J.A. Structure, composition and thermal expansion of CO2 hydrate from single crystal x-ray diffraction measurements. Journal of Physics Chemistry B, v. 105, p. 4200-4204, 2001. WAGNER, W.; PRUSS, A. The IAPWS formulation 1995 for the thermodynamic properties of ordinary water substance for general and scientific use, Journal of Physical and Chemical Reference Data, v. 31, p. 387-535, 2002.
88
CHAPTER 3
PRELIMINARY STUDIES
ABSTRACT
This chapter introduces preliminary topics evaluated before studying gas hydrate
phases by high-pressure microcalorimetry. The thermodynamic study of the gases
used in this work and the influence of water fraction on hydrate dissociation
temperatures were studied by commercial simulation software. The Peng-Robinson
equation was also validated in order to estimate the overall composition of
microcalorimetric analyses. Finally, unexpected transitions concerned to Teflon, the
material of which anti-extrusion rings for high-pressure cells are made of, were found
within the temperature range applied for gas hydrate studies. The considerations below
were important to a better understanding of each system and for planning experiments.
3.1 THERMODYNAMIC STUDY OF GASES
Methane, ethane, propane and carbon dioxide were used as guest species in
different hydrate-forming systems. Prior to the study of hydrates itself, it is important to
predict the thermodynamic behavior of these substances during injection into the high-
pressure panel and throughout the analyses. Such knowledge is necessary because
the pressure and temperature ranges applied could lead to heterogeneous systems
containing hydrocarbon (or carbon dioxide) in a gaseous-liquid equilibrium, apart from
the aqueous phase. Consequently, transitions corresponding to vapor-liquid changes
could be observed. The possibility of two-phases coexistence is even greater in case
of double guest systems. Therefore, simulations were performed by using the software
ASPEN to obtain equilibrium curves that indicate the phases present in different
thermodynamic conditions and compositions. Predictive computational results for
single and binary mixtures, containing the hydrocarbons cited above and / or carbon
dioxide, are presented in sections 3.1.1. and 3.1.2, respectively.
89
3.1.1 Single Gases
Figure 3.1 shows the respective liquid-vapor equilibrium lines for different gases
studied in this work and their critical points, above which the phase obtained, known
as “plasma”, is homogeneous and presents a density similar to that of liquid but with
other gas characteristics (HITCHEN; DEAN, 1993). Considering that the gas is injected
at 273.15 K, greater attention needs to be given to substances which may have two
phases at this temperature and relatively low pressures (below 4 MPa), such as carbon
dioxide, ethane and propane. It is assumed that in these cases the vapor-liquid
transition and even their coexistence during injection and pressurization are very
probable. The same behavior should be observed in thermograms from analyses
performed below the critical pressure. Nevertheless, a homogeneous supercritical
phase condition is assumed to be reached for analyses above the critical point. This
makes essential the stabilization period before cooling the oven and starting the
analysis.
Figure 3.1 – Vapor-liquid equilibrium lines (Aspen) of single gases and their respective critical points.
In the next chapter, single methane, ethane and carbon dioxide hydrates are
particularly evaluated. With regard to methane, a single supercritical phase must be
present throughout the temperature range of the analysis, whatever the pressure. On
the other hand, ethane and carbon dioxide at pressures below critical pressure should
present transitions related to vapor-liquid phases along the cooling and heating
90
process, as illustrated by sequence A in Figure 3.2. This figure indicates the
thermodynamic steps used in calorimetric analysis. Line 1-2 represents the
hydrocarbon (s) / carbon dioxide injection and pressurization, and it is followed by a
cooling step (2-3) for the hydrate formation, a heating (3-4) for the hydrate dissociation,
a second cooling down to the initial temperature (4-5) and, finally, the depressurization
(5-6). Otherwise, analyses at pressures above the critical pressure should not present
any thermal transitions with respect to compressed liquid and supercritical fluid
(sequence B). The physical-chemical features from this phase do not change suddenly
and, in practice, only the terminology is different.
Figure 3.2 – Schematic illustration of possible phases during injection, pressurization and analysis performed by HP-µDSC.
3.1.2 Binary Gaseous Mixtures
Unlike singles gases, where the conditions for two-phase coexistence are defined
by an equilibrium line, the presence of liquid-vapor phases in gaseous mixtures is
delimited by an area known as equilibrium envelope. This means that the
heterogeneous region covers a temperature range for each pressure rather than just
one point, and therefore, the possibility of two-phase coexistence is greater. Thus, the
envelopes for each binary mixture studied in this work (methane-ethane, methane-
propane and methane-carbon dioxide) were sketched from the equilibrium data
obtained by the software Aspen. The figures below show the envelopes obtained for
each mixture, considering molar fractions of methane from 0.1 to 0.99. It is noteworthy
91
that the fraction of methane in hydrate-forming systems is usually higher than other
substances.
Figure 3.3 – Thermodynamic envelopes for CH4-C2H6 gaseous mixtures. Solid lines refer to saturated liquid, while dashed lines refer to saturated vapor.
Figure 3.4 – Thermodynamic envelopes for CH4-C3H8 gaseous mixtures. Solid lines refer to saturated liquid, while dashed lines refer to saturated vapor.
92
Figure 3.5 – Thermodynamic envelopes for CH4-CO2 gaseous mixtures. Solid lines refer to saturated liquid, while dashed lines refer to saturated vapor.
According to the simulations results presented in Figures 3.3, 3.4 and 3.5,
compositions of mixtures that imply the liquid-vapor coexistence were avoided when
studying gas hydrates since the composition of the hydrocarbon phase (or CO2) in
contact with the aqueous phase influences hydrate composition, and this variable
cannot be measured by the experimental apparatus. Although the pressure applied for
the analyses was higher than found in the envelopes above, a heterogeneous gaseous
phase likely forms during the injection and pressurization inside the high-pressure
panel, making necessary a time for stabilizing the system at the final pressure before
the analysis.
3.2 INFLUENCE OF WATER FRACTION ON HYDRATE DISSOCIATION TEMPERATURE
Unlike the gas mixture ratio, the influence of water content on the hydrate
dissociation temperature is usually neglected by most works in literature. This factor
was studied in this work by evaluating the temperature profiles obtained by CSMGem
predictions, according to the pressure and water fraction in different systems. This was
done to estimate the proper size of water sample to be placed inside the HP-µDSC
cell. Indeed, the water fraction may have some influence on hydrate properties when
there is a shortage of gas molecules, in which just traces of hydrate are formed.
93
The profiles presented in Figure 3.6, at 20, 60 and 100 MPa, indicate that the
dissociation temperatures of single hydrates composed of methane and ethane are
affected only at extremely high fraction of water (above 99 mol% H2O). In such
conditions, the hydrate dissociation temperatures drop significantly since most of the
cavities in the hydrate structure are likely empty. Propane hydrates, in turn, do not
present any temperature variation in the composition range studied.
Figure 3.6 – Influence of water content on dissociation temperature of single hydrates composed of CH4 (A), C2H6 (B), C3H8 (C) and CO2 (D).
The most affected system in the figure above is the one forming carbon dioxide
hydrate, in which the dissociation temperature decreases when the water content is
above 95 mol%. For this system, the presence of small content of water (below 0.2
mol% H2O) also leads to lower dissociation temperatures. All cases have
demonstrated that the most significant changes are observed at higher pressures.
94
One could note in Figure 3.6 that the hydrate dissociation temperatures at gas
shortage conditions tend to decrease to values approaching ice melting temperature
for single guest systems. The same can be observed for double guest systems at low
fractions of methane, shown in Figure 3.7, in which the systems contain 10 mol% CH4.
However, the profiles for methane-CO2 hydrates, at this gas phase composition, are
unexpectedly different since the temperature initially increases reaching the higher
value at 0.97 molar fraction of water and suddenly decreases.
Figure 3.7 – Influence of water content on dissociation temperature of double hydrates (10 mol% CH4): CH4-C2H6 (A), CH4-C3H8 (B) and CH4-CO2 (C)
The dissociation temperature profiles obtained for double guest systems at high
methane fraction in gas phase (90 mol% CH4) were also unexpected. For any system
in Figure 3.8, except CH4-CO2 at 20 MPa, the dissociation temperature increases,
mainly at gas shortage conditions, i.e, when water fraction is higher than 0.95.
95
Figure 3.8 – Influence of water content on dissociation temperature of double hydrates (90 mol% CH4): CH4-C2H6 (A), CH4-C3H8 (B) and CH4-CO2 (C)
The results for all systems above reveal a slight influence of water content on
equilibrium temperatures (< 0.5 K) for fractions of water lower than 0.9. In practice,
higher fractions of water can be considered irrelevant for studies considering the main
applications of hydrates. The system must contain enough gas molecules to form a
considerable amount of hydrate and, indeed, to become a risk to the exploitation of
gas and oil or promoting commercial interest. Unlike water fraction, the gas phase
composition substantially affects the hydrate equilibrium temperatures along all the
composition range due to the influence of guest-cavity fitting on the structure stability
(NIXDORF; OELLRICH, 1997). Therefore, 0.5 molar fraction of water was chosen to
design temperature-gas composition diagrams in order to evaluate the effect of gas
composition on the hydrate equilibrium for all systems addressed in this work.
96
3.3 VALIDATION OF PENG-ROBINSON EOS AT HIGH PRESSURES
The composition of the system is a factor of significant influence on the properties
of the gas hydrate formed, as discussed along this work. Although the water content
does not affect the hydrate dissociation temperature when a reasonable amount of gas
is present, the overall compositions of isochoric experiments (by HP-µDSC) with binary
gaseous mixtures were calculated in order to be used as “input” in calculations of
equilibrium by the software (Multiflash and CSMGem). In fact, it is not possible to
determine gravimetrically the exact amount of gas inside the sample cell in order to
obtain the overall composition. Therefore, the total amount of gas was estimated using
the Peng-Robinson equation of state (PR), considering the initial conditions of
temperature and pressure and the volume occupied by the gas phase in the system
(MENEZES et al., 2018). The reliability of this equation at different pressures was
studied by comparing the calculated density with data reported in the literature (NIST
Chemistry Webbook; SAGE et al., 1934). The van der Waals rule was applied for the
binary gas mixtures, and the numerical resolution method proposed by Hoyos (2000)
was used to solve the PR equation. The critical temperature, critical pressure, critical
density, compressibility factor and molar mass of each gas are required for this
numerical resolution, and they were obtained from the NIST database. For methane
densities in Figure 3.9, the Peng-Robinson equation showed better results for higher
temperatures and relatively low pressures. Considering that the gas is injected at
293.15 K, the deviation of the methane gas density can reach 12%, when comparing
to the values calculated by Peng-Robinson and those from NIST at 101 MPa.
Figure 3.9 – (A) Methane densities by Peng-Robinson equation (■) and from NIST (□); (B) Relative deviations of methane densities.
97
The Peng-Robinson equation also provided slightly higher density values than
those obtained experimentally for the binary mixture (methane and propane) at 293.15
K. However, the deviations tend to be lower at 20 MPa than at 5 MPa, as shown in
Figure 3.10B.
Figure 3.10 – (A) Methane-propane densities by Peng-Robinson equation (■) and reported by Sage et al. (1934) (□); (B) Relative deviations of methane-propane densities.
Considering that the hydrate dissociation temperature remains practically
unchangeable by density deviations in the order of magnitude presented in the figures,
the Peng-Robinson equation is proved to be adequate to estimate the amount of gas
inside the cells. However, the estimation of the overall composition may be affected by
some intrinsic limitations: the volume of the cells is not perfectly known (0.19 ml
according to the supplier, however, dead volumes are included and temperature
variations may affect the size of polymeric materials used for sealing during the
analysis); although the tubes connecting the high-pressure panel and the
microcalorimeter have been coated with insulation material, there may still be heat loss
and a temperature gradient between both instruments.
3.4 TRANSITIONS CONCERNING THE TEFLON RING
Some of the thermograms shown in this work, especially in chapter 6, present
specific transitions of the anti-extrusion ring, a polymeric component of the
microcalorimetric high-pressure cell (100 MPa), shown in Figure 2.3. This component
is made of Teflon, which presents different structures in the ranges of pressure and
temperature applied in this work (RAE; DATTELBAUM, 2004; RIGBY; BUNN, 1949).
98
This difference in the molecular arrangement and crystalline symmetry leads to
transitions detected by microcalorimetry.
The resultant heat flow signal shown in thermograms is the difference between
the heat flows through the sample and the reference cells, as illustrated in Figure 3.11.
One could expect that the transitions occurring in both cells would be canceled in the
resultant heat flow signal. However, the latter is kept empty during the experiments
and thereby there is a difference in pressure between the cells, which leads the Teflon
transitions to happen at different temperatures for each cell. Both transitions are
endothermic, but the one from the reference cell appears as an exothermic event
because it is subtracted from sample heat flow signal.
Figure 3.11 – Resultant heat flow on the calorimetric thermograms.
Figure 3.12 indicates the transitions observed in thermograms of heating, in the
absence of water. The one related to the reference cell is always at the same position
(peak at 294 K), considering this cell is kept at atmospheric pressure in all experiments.
On the other hand, the Teflon peak in the sample cell is shifted to higher temperatures
as the pressure of the experiments is incremented. Although the magnitude of these
Teflon transitions is generally negligible in hydrate dissociation thermograms, high
concentrations of inhibitors may lead to the formation of small fractions of hydrate,
whose signal could be of the same magnitude of Teflon transitions, making it essential
to distinguish each one to avoid misinterpretation of results.
99
Figure 3.12 – Teflon transitions during heating in microcalorimetric analyses: peak related to the transition in the sample cell moves according to the pressure.
Source: Menezes et al. (2020).
3.5 CONCLUSIONS
The topics addressed in this chapter are important to introduce the gas hydrates
studies presented onward. The factors summarized below were considered by
planning the experiments and analyzing the thermograms:
• Equilibrium lines were drawn by computational predictions for single gases and
binary mixtures used in this work. Transitions concerned to phase-change of
hydrocarbon and carbon dioxide should be observed in thermograms for
experiments containing C2H6 or CO2 below their respective critical pressures. The
coexistence of heterogeneous phases in double guest systems would make
difficult the estimation of the phase composition in contact with water. Therefore,
pressures above the maximum one found in the envelopes were applied in order
to avoid the coexistence of vapor-liquid phases composed of hydrocarbons /
carbon dioxide;
• Considering that hydrocarbons or carbon dioxide should present phase change
during injection and pressurization, a stabilization time is required to assure a
homogeneous system before the analysis using the µDSC apparatus;
• Equilibrium temperatures were obtained by computational predictions for
hydrate-forming systems with different water contents. Although the water
fraction does play a role in the hydrate dissociation temperature when there is a
100
shortage of gas, a negligible effect is observed (< 0.5 K) for water fractions
varying below 0.9. The most affected systems are the ones containing carbon
dioxide. However, a considerable amount of gas is required for practical studies
on gas hydrates, thereby, the amount of water placed in the high-pressure cell
should be irrelevant;
• The use of Peng-Robinson EoS was evaluated to estimate the overall
composition in closed systems (applied for systems containing gas mixtures).
The density of methane and methane-propane mixtures were calculated
according to the pressure and compositions. The deviations obtained from the
literature data represent negligible changes in the gas hydrate dissociation
temperature. Thus, the PR equation was considered applicable;
• Transitions corresponding to Teflon structural changes are expected to be
observed in thermograms from HP-µDSC, especially when inhibitors are added
to the system. These thermal events must be considered to avoid
misinterpretation of the results.
REFERENCES
HITCHEN S.M., DEAN J.R. Properties of supercritical fluids. In: Dean J.R. (eds) Applications of Supercritical Fluids in Industrial Analysis. Springer, Dordrech, 1993. HOYOS, B. Cálculo del Volumen Específico de Líquidos Puros con Ecuaciones de Estado Cúbicas. Dyna., v. 129, p. 85-92, 2000. LINSTROM, P.J.; MALLARD, W.G. (Eds.). NIST Chemistry WebBook, NIST Standard Reference Database Number 69, July 2001, National Institute of Standards and Technology, Gaithersburg MD, 20899 (http://webbook.nist.gov). MENEZES, D.E.S.; PESSÔA FILHO, P.A.; ROBUSTILLO, M.D. Use of 1-Butyl-3-methylimidazolium-based ionic liquids as methane hydrate inhibitors at high-pressure conditions. Chemical Engineering Science, v. 212, 115323, 2020. MENEZES, D.E.S.; RALHA, T.W.; FRANCO, L.F.M., PESSÔA FILHO, P.A.; ROBUSTILLO, M.D. Simulation and experimental study of methane-propane hydrate dissociation by high-pressure differential scanning calorimetry. Brazilian Journal of Chemical Engineering, v. 35, p. 403-414, 2018. NIXDORF, J.; OELLRICH, L.R. Experimental determination of hydrate equilibrium conditions for pure gases, binary and ternary mixtures and natural gases. Fluid Phase Equilibria, v. 139, p. 325-333, 1997.
101
RAE, P.J.; DATTELBAUM, D.M. The properties of poly(tetrafluoroethylene) (PTFE) in compression. Polymer, v. 45, p. 7615-7625, 2004. RIGBY, H.A.; BUNN, C.W. A room-temperature transition in polytetrafluoroethylene. Nature, v. 164, p. 583, 1949. SAGE, B. H., LACEY, W.N., SCHAAFSMA, J. G., Phase Equilibria in Hydrocarbon Systems II. Methane – Propane System. Industrial and Engineering Chemistry, v. 26, 214-217, 1934.
102
CHAPTER 4
THERMODYNAMIC STUDY OF SINGLE-GUEST GAS HYDRATES
ABSTRACT
Binary systems formed by a single gas and water, that are susceptible to form
hydrate, are studied in this chapter by HP-µDSC and modeling. Experimental
dissociation data for CH4, C2H6, and CO2 hydrates are compared to predictions from
CSMGem and Multiflash software packages up to 100 MPa. Deviations of onset, peak,
and endset temperatures from predictions and their representativeness as equilibrium
data are evaluated. Onset temperatures have provided good reproducibility and the
most accurate results for these systems, when compared to predictions. Dynamic
effects on gas hydrates formation are also evaluated by varying experimental factors,
such as water-sample size, cooling-heating rate, and running multicycles. Enthalpies
of dissociation were determined by applying the Clapeyron Equation and by the
integration of hydrate dissociation curves on thermograms and both show good
agreement. New approaches were applied for the calculation of hydrate volume
variation and hydration number estimation, and improvements are presented with
respect to equations used in the literature. The experimental method based on
multicycles was found to make the integrations easier and more accurate than the
standard method since most of ice is converted to hydrate.
4.1 INTRODUCTION
Methane is the major hydrate-forming hydrocarbon because it is the most
abundant in natural gas reservoirs. In addition, the methane molecular size is small
enough to fit into all cages of well-known hydrate structures already identified in
literature (structure I, structure II and structure H). Thereby, this hydrocarbon is the first
one studied in this work up to 100 MPa, and it was used to develop most of the
methodologies employed. In addition, single hydrates of ethane and carbon dioxide
were also studied up to 80 and 90 MPa, respectively. Propane was not included in this
chapter because it was not possible to reach pressures higher than 0.8 MPa during
the gas injection into the cell. In fact, propane likely liquefies during injection into the
compression chamber, as seen in section 3.1.1. For ethane and carbon dioxide
103
hydrate-forming systems, transitions regarding phase changes are observed for
pressures below their critical points, as expected: vapor-liquid transition during the
cooling and liquid-vapor during the heating. Transitions related to compressed liquid
and supercritical fluid are not observed for pressures above the critical point, even
occurring within the temperature range of the analysis. This is due to the absence of a
sudden change in density or in other structural properties that could produce a heat
flow variation in the microcalorimeter.
Computational simulation on gas hydrates is a powerful tool used to predict the
amount of exploitable energy in reservoirs and, nowadays, mainly to define operational
conditions based on hydrate thermodynamic properties for flow assurance
applications. Also, simulations can be useful to an intrinsic understanding of
thermodynamic behavior for specific systems. In this chapter, reliability and accuracy
of two commercial software packages, CSMGem and Multiflash, are evaluated against
experimental data obtained by high-pressure microcalorimetry, which has been widely
used in studies of gas hydrates. As mentioned before, this technique allows to obtain
the temperature and enthalpy of gas hydrate formation and dissociation or any process
involving a transition with energy transfer.
Dissociation enthalpy of single hydrates was determined by the integration of the
thermograms and the Clapeyron equation, according to the methods described in
section 2.1.4.2. The first method, based on the works from Gupta et al. (2007, 2008),
consists of estimating the hydrate enthalpy by integrating the heat absorbed during ice
melting and hydrate dissociation. The amount of water consumed by the ice formation
is subtracted from the total volume of water added to the sample cell in order to find
the amount of water consumed by the hydrate formation. Then, the enthalpy per mol
of CH4 is given by the stoichiometric balance of the hydrate reaction. On the other side,
an alternative method was applied in this work for estimating the enthalpy of hydrate
dissociation using the Clapeyron equation. Sloan and Fleyfel (1992, 1994) suggest that
the heat of dissociation depends mainly on the type and proportion of cavities occupied
in the hydrate structure and is practically independent of the gas species and
composition. This relation is demonstrated based on the Clausius-Clapeyron equation
(1.7). The slope of the hydrate dissociation line (ln P vs 1 / T) is similar for different
hydrates whose guest molecules occupy the same cavity type (SLOAN; KOH, 2008).
From this equation, therefore, it is possible to determine the relation between the type
of cavity occupied with the calculated dissociation heat, regardless of the species of
104
the guest molecule. However, this simplified equation does not provide accurate
results due to restrictions cited in section 1.3.1: the composition of guest molecules in
each cavity does not vary significantly; the volume variation between the condensed
and gaseous phases is negligible; the gas phase composition remains constant.
Thereby, the method applied here is based on the work reported by Anderson (2004)
and accounts for the finite volumes of all phases, the non-ideality of the vapor phase,
and the solubility of hydrocarbons in water. Some mathematical improvements are
presented mainly concerning to the hydrate volume estimation so that the method
could also be appropriately used for carbon dioxide and ethane hydrates. The
equations used to describe the dissociation data, the fit parameters, and volume
changes are shown in the Appendix. In this work, the gas species shows somehow
affect the enthalpy of dissociation of gas hydrates.
Lastly, some experimental factors are evaluated in order to verify their possible
effects on the hydrate properties. Considering the Gibbs phase rule, a binary system
in a three-phase equilibrium state presents only one degree of freedom. Therefore,
only one independent coordinate (pressure, temperature, or composition) is required
to define the thermodynamic state of the system. Ergo given a specified pressure, the
temperature at which the three phases coexist is also determined, regardless of the
water/gas ratio. Nevertheless, considering a non-equilibrium state of the system and
the absence of mixing, dynamics effects may interfere in the equilibrium and
homogeneity of the structure, affecting the hydrate properties, including the
dissociation temperature. Thus, three experimental factors, which may affect the mass
transfer and the hydrate homogeneity, are addressed in this work: i) amount of H2O;
ii) cooling-heating rates; iii) multicycles.
4.2 SPECIFIC EXPERIMENTAL CONDITIONS
Computational Analysis: Two software packages were used to calculate
equilibrium state of gas hydrates: the CSMGem code Version 1.10 (January 1, 2007),
that uses the SRK equation of state, and the Multiflash 6.0, that applies the cubic plus
association (CPA) equation of state for liquid and vapor phases. Both use the van der
Waals and Platteeuw model for the hydrate phase, described in equation 1.3.1.
Experimental Configuration: Milli-Q water was used in all experiments
performed by high-pressure microcalorimetry. The gases applied in the analysis were
105
methane (99.5%), ethane (99.95%), and carbon dioxide (99.99%). The reference cell
was kept empty, whereas water was added into the sample cell. The experimental
procedures used in this chapter are based on methodologies described in section 2.1.4
of this work. Some of the experiments were performed at different heating rates in
order to verify the possible influence of kinetic factors on the dissociation data.
4.3 METHANE-WATER SYSTEM
4.3.1 Equilibrium Data for CH4 Hydrates by High Pressure Microcalorimetry
Figure 4.1 shows the thermograms of the analyses performed at 1 K·min-1 at
different pressures by using the standard method. Regarding the ice melting, one can
note that the curve shifts to the left at higher pressures (Figure 4.1B). This
phenomenon is explained by a crystalline rearrangement while the hexagonal ice
approaches to the region of ice III, as can be checked in water phase diagrams (SAHLE
et al., 2013; SANZ et al., 2004). The hydrate dissociation, in turn, shifts to higher
temperatures as the pressure increases, which agrees to the literature results (SLOAN;
KOH, 2008). The break of hydrogen bonds and the delivery of gas from the hydrate
phase become harder under higher pressures, requiring higher temperatures for the
structure to be dissociated.
Considering that the heat flow measured by the microcalorimeter is an extensive
property, Figure 4.1 suggests that an increase in pressure favors hydrate rather than
ice formation since the diffusivity of the gas molecules in water is enhanced as the
pressure of the system increases. In other words, higher pressure leads to more gas
molecules available in the aqueous phase, favoring hydrate formation and,
consequently, decreasing the ice fraction. However, the amount of hydrate formed
above 70 MPa surprisingly lessens in the figure. One possible reason for this is that
there may have been a gas leak through the sealing elastomer, which may not have
been noticeable because methane was continuously supplied. This may have implied
that a fraction of the water was also dragged out of the cell during pressurization. On
the other hand, the decrease in the area corresponding to the ice melting may be
related to the lower enthalpy of ice dissociation at pressures relatively close to the
change in the crystal structure (DENYS et al, 2001). Nevertheless, the dissociation
temperatures from these analyses agree to others made by using different water
106
samples. Finally, one can clearly observe in Figure 4.1C the exothermic transition from
the Teflon ring, as discussed in Chapter 3.4.
Figure 4.1 – Heating thermograms of the CH4-H2O system at 1 K·min-1 and at different pressures (A). Ice melting and hydrate dissociation are expanded in B and C figures, respectively.
Essays for equilibrium determination were performed in triplicate (except to 30
and 70 MPa), and the data for ice melting and methane hydrate dissociation from 5.5
to 100 MPa are presented in Table 4.1 and 4.2, respectively. Figure 4.2 represents the
average values for onset, peak and endset points of the dissociation curves. The
predictions obtained for methane hydrates from the CSMGem and Multiflash software
are also indicated in Figure 4.2. The onset temperature obtained from thermograms
not only marks the beginning of the dissociation process but, in absence of
polymorphism or overlapped transitions, it is usually the point that approaches to the
equilibrium more accurately than peak and endset temperatures, mainly because it is
less susceptible to the heating rate and sample mass. Sample size and crystalline
107
heterogeneity caused by a non-uniform distribution of nuclei and different growth rates
lead to the obtention of broader curves, which affect peak and endset values. These
factors explain the lower absolute deviations obtained from CSMGem predictions for
onset temperatures.
Figure 4.2 – Dissociation data of CH4 hydrates obtained by HP-µDSC at 1 K·min-1: (▲) onset temperatures; (●) peak temperatures; (♦) endset temperatures. Black lines refer to CSMGem
predictions and red lines, to Multiflash.
Experimental data and absolute deviations from computational predictions are
shown in Tables 4.1 and 4.2 for ice melting and hydrate dissociation, respectively.
Standard deviations from ice melting data tend to be slightly lower than hydrate
dissociation data. This may be due to impurities in the gas phase and/or heterogeneity
of the hydrate structure. The hydrate onset temperatures are slightly lower than
predictions likely due to a more significant presence of empty cavities throughout the
structure, considering that the absence of mixture limits the mass transfer into the liquid
phase. Nevertheless, all standard and average absolute deviations of onset
temperatures are within the experimental uncertainty, thus proving the efficiency of this
methodology in providing equilibrium data for gas hydrates. On the other hand,
Multiflash predictions seem to deviate from CSMGem predictions as pressure
increases and approach to peak temperatures.
The determination of methane hydrate dissociation points by HP-µDSC at lower
pressures than 5.5 MPa has shown to be inaccurate, mainly at 1 K·min-1. As can be
verified in Figure 4.3, the hydrate dissociation curve overlaps the ice melting curve
108
Table 4.1 – Dissociation data of ice melting preceding the CH4 hydrate dissociation by HP-µDSC and the respective absolute deviations (AD) from computational predictions
Figure 4.3 – Overlapping of ice melting and CH4 hydrate dissociation curves at low pressures.
4.3.2 Effect of H2O Sample Size
The onset temperatures from Table 4.2 were obtained using different amounts of
water and still present low standard deviation values and excellent agreement to
predictions. H2O content seems not to affect the hydrate thermodynamic properties of
binary systems, but the results below indicate that this factor plays a role in the kinetics
and the proportion of ice/hydrate formed. Figure 4.4 compares the thermograms of
formation (A) and dissociation (B) of two hydrates containing different amounts of water
inside the cell. Davies et al. (2009) reported a tendency for hydrate nucleation prior to
ice formation at pressures above 15 MPa and suggested a higher activation energy
112
barrier between ice and hydrate compared to water and hydrate under certain
conditions.
Figure 4.4 – Thermograms of cooling (A) and heating (B) indicating the effect of water sample size on the ice / CH4 hydrate formation and dissociation, respectively.
The distance between hydrate and ice formation peaks, for any case of Figure
4.4A, is noticeably longer in the sample containing the largest amount of water (blue
thermograms). The smaller blue peaks (56.4 mg H2O), related to the hydrate formation,
tend to precede the corresponding red peaks (39.0 mg H2O), from right to left. At the
same time, the larger blue peaks, related to the ice formation, appear after the red
peaks. Therefore, larger sample of water (blue lines) seems to favor the hydrate
formation kinetics and retard the formation of ice.
The heating plots (Figure 4.4B) unquestionably indicate that the sample
containing the largest amount of water (56.5 mg) led to higher fractions of hydrates
than the one containing 39 mg H2O. Despite this, ice fractions were expected to be
even larger than hydrate fractions when water content is higher, assuming that hydrate
formation is limited to the interface area between the gas and aqueous phases (initially
assuming the same area in this case) due to the low methane solubility and no mixing
113
within the cell. A possible reason for the opposite effect observed is that the gas
injection and pressurization may cause the liquid phase to spread into smaller droplets
over the cell walls so that the total interfacial area (water – gas molecules) is enhanced
due to droplets disposal and size. Thus, the hydrate fraction may be favored by the
more numerous droplets available in the system as larger the sample of water. On the
other hand, if the aqueous phase covers the entire base of the cell, the area of the
concave water meniscus may be related to the amount of water, i.e., the meniscus
may be higher if the volume of water is larger, thus increasing the interfacial area. In
this case, the hydrate fraction also may be favored as larger the water content due to
the greater contact between gas and water molecules. Anyway, the onset points of
dissociation curves in Figure 4.4B are very similar, although the hydrate and ice
fractions depend on the H2O sample size. As mentioned above, the water content
should not be relevant to the thermodynamic properties of single hydrates, except in
cases of gas shortage, as seen in section 3.2.
4.3.3 Effect of Cooling and Heating Rates
Dissociation points related to methane hydrates obtained at different
cooling/heating rates by HP-µDSC are shown in Table 4.3, as well as their deviations
from CSMGem predictions. It is worth to mention that, although onset temperature of
melting generally is not affected by the heating rate, it could be slightly changed in
cases of chemical reactions, impurities or structural heterogeneity. Interestingly, the
onset temperatures tend to decrease as faster the heating (Figure 4.5A). It is believed
that this phenomenon is not related to the heating process itself, but to the cooling. As
it is known, smaller crystals are formed when higher cooling rates are applied
(CONLEY et al., 2000). Thus, it is reasonable to suppose that structural irregularities,
such as empty cavities and intergranular defects, are also magnified at higher cooling
rates. In other words, the structure may become more heterogenous when the driving
force induces the crystals to grow more rapidly. This assumption is consistent since
the gas hydrate is formed from distinct phases in absence of mixing. Several works in
the literature point out that the cooling / heating rate interferes on the formation of
several materials, including hydrates and inclusion compounds (CHROSTEK, 2016;
KE; SVARTAAS, 2011; ZHANG et al., 2019; WELLEN et al., 2015). Therefore, a higher
heterogeneity of the hydrate lattice could explain the slightly lower dissociation
114
temperature by cooling / heating the system faster. Nevertheless, this difference
between the onset points is negligible in practice.
Table 4.3 – Dissociation data of CH4 hydrates at different heating rates and their respective absolute deviations (AD) from computational predictions.
P (MPa)
Ø (K·min-1)
HP-µDSC – CH4 Hydrate – TDISSOCIATION (K)
Onset AD Peak AD Endset AD
10
0.2 286.28 0.22 286.46 0.4 287.2 1.14
0.5 286.15 0.09 287.24 1.18 288.66 2.60
1 285.93 0.13 287.40 1.34 290.46 4.40
20
0.2 291.74 0.02 292.92 1.16 293.91 2.15
0.5 291.66 0.10 293.00 1.24 294.29 2.53
1 291.49 0.27
292.97 1.21 294.97 3.21
40
0.2 296.98 0.25 298.39 1.16 299.31 2.08
0.5 296.96 0.27 298.40 1.17 299.38 2.15
1 297.01 0.22 298.15 0.92 299.68 2.45
60
0.2 300.50 0.19 301.03 0.34 301.64 0.95
0.5 300.44 0.25 301.44 0.75 302.35 1.66
1 300.24 0.45 302.55 1.86 304.94 4.25
80
0.2 303.21 0.13 303.73 0.39 304.38 1.04
0.5 303.14 0.20 304.07 0.73 305.18 1.84
1 303.01 0.33 304.02 0.68 305.48 2.14
100
0.2 305.48 0.05 305.91 0.38 306.57 1.04
0.5 305.40 0.13 306.17 0.64 307.34 1.81
1 305.25 0.28 306.60 1.07 308.55 3.02
All the onset temperature deviations are within the experimental uncertainty,
and they are lower at 0.2 K·min-1, except at 10 and 40 MPa (Figure 4.5B). This
indicates that this heating rate provides more accurate results than higher ones.
However, while these analyses last about 13 hours, those performed at 1 K·min-1 last
less than 5 hours, and the onset results are still satisfactory. In contrast, the peak and
endset temperatures are noticeably influenced by the heating rate, and their absolute
deviations from the predictions are relevant. Figures 4.6 and 4.7 show that both the
peak and endset temperatures and their respective AD tend to increase as higher the
heating rate, due to its effect on the width of the curves.
115
Figure 4.5 – Effect of the heating rate on the onset temperatures corresponding to CH4 hydrate dissociation curves (A) and their respective absolute deviations (B).
Figure 4.6 – Effect of the heating rate on the peak temperatures corresponding to CH4 hydrate dissociation curves (A) and their respective absolute deviations (B).
Figure 4.7 – Effect of the heating rate on the endset temperatures corresponding to CH4 hydrate dissociation curves (A) and their respective absolute deviations (B).
116
Taking into account all the considerations above, the onset point of the
dissociation curve by running analyses at 1 K·min-1 was chosen as the primary method
for determining hydrate equilibrium in this work, based on the evaluation of the time of
analysis required and the absolute deviations obtained. However, the determination of
the onset temperature may be hampered by overlapping curves, polymorphism, or
heterogeneity of the structure in some cases that will be discussed forward, especially
for ternary diagrams in Chapter 5.
4.3.4 Effect of Multicycles
In Table 4.4, dissociation data obtained after multicycles are compared to the
ones by the standard method, in which only one cycle is run.
Table 4.4 – Dissociation data of CH4 hydrates by standard and multicycles methods, and their respective absolute deviations (AD) from computational predictions.
Multicycles method was applied at several pressures in order to maximize the ice
fraction conversion to methane hydrate. The onset points from both methods agree
even when the standard experiments were carried out at different heating rates. The
deviations of onset temperatures with respect to predictions are similar for both
standard and multicycles methods, as shown in Figure 4.8, and they are within the
experimental uncertainty.
Figure 4.8 – Absolute deviations of onset temperatures with respect to predictions for CH4 hydrates: (■) standard method (●) multicycles method.
The standard analyses present slightly lower onset temperatures than multicycles
analyses when heating rates differ (31.5, 50, 70 and 90 MPa in Table 4.4.). It may be
related to the cooling/heating effect mentioned in the previous section, in which higher
cooling rates led to lower onset temperatures. In contrast, the onset temperatures from
multicycles experiments are slightly lower when both methods were performed at the
same heating rate (20, 40 and 80 MPa at 0.2 K·min-1; 59.4 MPa at 1 K·min-1).
Considering this evidence, multicycles method seems to induce a little more
heterogeneous structure due to the difficulty of gas molecules diffusion implied by the
hydrate layer initially formed above the aqueous phase, which hampers the contact
between gas and free water molecules during the subsequent cycles. Therefore,
118
hydrate fractions formed in deeper sections of the droplets may contain more empty
cavities, so that the dissociation temperatures of these fractions are lower. This
phenomenon is resumed in section 4.5.2, in which all the standard and multicycle
analyses for CO2 hydrates were performed at the same heating rate (1 K·min-1), and
this behavior is also observed.
The heterogeneity of methane hydrates by the multicycles method can also be
observed in the thermograms of Figure 4.9. Nevertheless, the onset temperatures from
multicycles experiments are still reliable and present very good accuracy. Besides, this
method has provided much better results for calculations of dissociation enthalpy than
the standard method, as discussed below in section 4.3.5.
Figure 4.9 – Thermograms of CH4 hydrates dissociation by the multicycles method.
Figure 4.10 reveals the effect of the water content placed inside the cell on the
width of the hydrate dissociation curve. However, the onset temperatures are very
similar for both experiments (as shown in Table 4.4), again in agreement with the
results of section 4.3.2. Water content may also affect the ice-to-hydrate conversion
profile according to Figure 4.11, where two samples at the same pressure are
compared. The percentage of water converted to hydrate in the first run is notably
higher for the sample containing 56.5 mg of water (24.8%). Besides, this sample took
12 cycles for 95% ice conversion, while 41.6 mg took 15 cycles. This evidence supports
again that samples containing a higher amount of water favor hydrate rather than ice
formation, as discussed in section 4.3.2.
119
Figure 4.10 – Effect of H2O sample size on the dissociation of CH4 hydrates by multicycles at 20 MPa.
Figure 4.11 – Effect of H2O sample size on the conversion of ice to CH4 hydrate throughout 22 cycles at 20 MPa.
The effect of pressure on the conversion rate of ice to hydrate was evaluated by
gathering experiments containing the same water content so that the initial amount of
ice can be comparable. Figures 4.12 refers to samples initially containing 56.6 and
64.6 mg of liquid water. Higher pressures tend to lessen the formation of ice in this
system and to result in a faster conversion to hydrate. The value of 𝑚𝐼𝑐𝑒 indicates the
mass of ice melted in the first run, thus corresponding to the amount of ice initially
formed. One can note that the conversion profiles constitute two distinct stages: a
faster conversion up about 90% is followed by a slower one. The lower 𝑚𝐼𝑐𝑒, the faster
the ice conversion in the first stage i.e., a lower number of cycles is required to reach
the second stage. Therefore, both the amount of ice initially formed and the conversion
120
rate appear to depend on pressure. This was also found in Figure 4.1B and may be
related to higher methane diffusivity in water at higher pressures, favoring hydrate over
ice formation, as discussed in section 4.3.1.
Figure 4.12 – Effect of pressure on the ice conversion to CH4 hydrate: A) 56.6 mg of water and B) 64.6 mg of water.
4.3.5 Enthalpy of Dissociation and Hydration Number
At first, it is worth to mention that 𝑛 is close to 5.75 in the hypothetical case of all
cages are filled with guest molecules. However, the estimation of a more realistic
hydration number at each temperature / pressure condition is essential for determining
the enthalpy. The hydration number is related to the hydrate volume, consequently,
both temperature and pressure indirectly affect the occupancy of hydrate cages. The
thermal expansion counteracts the compressibility effect caused by increasing the
pressure. In other words, the temperature favors the hydration number, while the
pressure decreases it. Thereby, the balance between these two factors play a role in
the size of cavities and, consequently, in the occupancy degree of the structure.
Therefore, the hydration number at each point was estimated by two ways: i) according
to predictions of fractional cage occupancy provided by CSMGem, ii) an iterative
method adapted from the one proposed by de Forcrand in 1902, currently used by
many researchers (SLOAN; KOH, 2008).
121
Tables 4.5 and 4.6 present the results based on experiments run by the standard
and multicycles methods, respectively. Different equations were used to fit each set of
data, and thereby, it is expected to observe a small difference between standard and
multicycles methods. In both cases, the enthalpy was estimated considering the
hydration number (𝑛) calculated by CSMGem predictions and by the iterative method,
as mentioned above.
Table 4.5 – Enthalpies of CH4 hydrates based on experimental data obtained by the standard method. The hydration number (n) was estimated based on the fractional occupancy degree provided by
Table 4.6 – Enthalpies of CH4 hydrates based on experimental data obtained by the multicycles method. The hydration number (n) was estimated based on the fractional occupancy degree provided
Figure 4.13 shows that 𝑛 based on CSMGem predictions are slightly lower than
by the iterative method. The latter method accounts for experimental data, and thereby,
it is reasonable that the cages occupancy is lower for real hydrates than that based on
simulations, even because of the mass transfer limitations on HP-µDSC. On the other
hand, choosing the equation to fit the experimental data may imply decimal variations
in the calculation of the number of hydration and enthalpies (Appendix). One can also
see a trend of slightly higher 𝑛 as pressure increases, a phenomenon not observed for
ethane and carbon dioxide hydrates, addressed forward. This is likely because the
compressibility factor (ĸ𝑇) is found to be higher for methane hydrates so that it
overcomes the lattice thermal expansion effect (BALLARD, 2001). It is not observed
for 𝑛 obtained from CSMGem predictions.
Figure 4.13 – Hydration number (n) for CH4 hydrates calculated through the iterative method (standard and multicycles methods) and by using CSMGem predictions.
Figures 4.14 shows the enthalpies of dissociation obtained by the Clapeyron
equation. The enthalpies calculated using 𝑛 from CSMGem predictions present
notable changes as the pressure increases, for both standard and multicycles
methods. Such variation is not expected, and no similar results are found in the
literature for dissociation enthalpy of methane hydrate. In fact, the results obtained
from iterations are more consistent and comparable to the data reported by Anderson
(2004).
123
Figure 4.14 – Enthalpies of CH4 hydrates dissociation determined by the Clapeyron equation based on experimental data: A) standard method; B) multicycles method. The black line regards to the calculus
of hydrate dissociation using 𝑛 calculated from the cages occupancy obtained by CSMGem predictions.
Figure 4.15 presents the enthalpies obtained by the integration of the dissociation
curves from thermograms. The only enthalpies found in literature for methane hydrates
at high pressures by the integration of thermograms were reported by Gupta (2007).
Nevertheless, these data were obtained at lower pressures than in this work and
present relatively high deviations, since the standard method was used.
Figure 4.15 – Enthalpies of CH4 hydrates dissociation determined by the integration of curves from calorimetric thermograms: A) standard method; B) multicycles method. (*) 𝑛 by the iterative method.
The multicycles method was used to determine the enthalpies by integration
throughout this work. However, methane hydrate thermograms obtained by standard
method at 0.2 K·min-1 were also used for comparison. The great advantage of
multicycles method is that integrations are much more accurate since the final amount
of ice is too low (or inexistent) and no recrystallization process is observed. In contrast,
124
the results from the standard method are not accurate. Moreover, one can note that
enthalpies obtained through integrations from thermograms are slightly higher than
those obtained by the Clapeyron equation, considering the multicycles method. The
uncertainty of enthalpies calculated from Clapeyron method relies mainly on the
determination of 𝑑𝑃/𝑑𝑇 and the hydrate volume. Therefore, the equation chosen to fit
the experimental data and the extrapolation of the lattice parameter (a) may partially
explain this deviation. On the other hand, the integration also can be affected by minor
errors caused when determining the baseline.
Accuracies of standard and multicycles methods are compared by estimating the
absolute deviations between enthalpies calculated by the Clapeyron equation and from
DSC thermograms, as shown in Figure 4.16. The average deviations and the
respective confidence intervals (95%) indicate that the multicycles method and the use
of 𝑛 from iterations provide the most reliable results. This is more remarkable at higher
pressures, confirming that the trend of the hydration number obtained from CSMGem
prediction does not agree to the experimental trend. The same result was observed for
ethane and carbon dioxide hydrates, as discussed forward.
Figure 4.16 – Absolute deviations between enthalpies of CH4 hydrate dissociation by the Clapeyron equation and through the integration of the hydrate dissociation curve: A) standard method; B)
multicycles method.
In sum, the results of methane hydrate enthalpy of dissociation are validated by
comparing both Clapeyron and integration methods. The average of enthalpies
obtained in this work and the respective confidence interval (95%) are shown in Table
4.7. Besides the good agreement found between them, the results are also consistent
with enthalpies found in the literature.
125
Table 4.7 – Enthalpies of CH4 hydrates obtained in this work and found in the literature.
Reference Method T (K) P (MPa) ΔH (kJ/mol CH4)
This work HP-µDSC 291.74 - 303.13 20 - 80 55.70 ±0.18
Clapeyron 291.74 - 304.33 20 - 90 55.10 ±0.24
Sun et al. (2018) Clausius-Clapeyron 284.4 - 289.5 9.2 - 16 59.1
Nasir et al. (2014) Clausius-Clapeyron Q1* 55.26
Kerkar et al. (2013) Clausius-Clapeyron - 10.44 54.5 - 57.79
Nakagawa et al. (2008) Calorimeter 279 - 282 5.0 55.3
Figure 4.19 - Dissociation data of C2H6 hydrates obtained by HP-µDSC at 1 K·min-1: (▲) onset temperatures; (●) peak temperatures; (♦) endset temperatures. Black lines refer to CSMGem
predictions and red lines, to Multiflash.
128
4.4.2 Effect of Multicycles
Multiple cycles were also performed for ethane hydrate systems at 5, 9.8, 20 and
50 MPa. The results are shown in Table 4.9 and the absolute deviations are compared
to those of the standard method in Figure 4.20.
Table 4.9 – Dissociation data of C2H6 hydrates by standard and multicycles methods, and their respective absolute deviations (AD) from computational predictions.
Figure 4.20 – Absolute deviations of onset temperatures with respect to predictions for C2H6 hydrates: (■) standard method (●) multicycles method.
129
The onset temperatures from multicycles method tend to be lower than those
from the standard method. However, this should not be related to the multicycles
method itself, but to the lower cooling / heating rate employed in these experiments,
that leads to lower dissociation temperatures as resumed below. On the other hand,
deviations of peak and endset temperatures from CSMGem predictions are verified to
be higher for multicycles data. The main reason for this is the amount of hydrate
formed, which is considerably larger than in the standard analyses.
Figure 4.21 shows that the hydrate dissociation curves obtained through the
multicycles method present distinct peaks, indicating heterogeneous structures. As
previously mentioned, the hydrate formation is limited by the gas diffusion into the solid
phase. Therefore, it is reasonable to say that the occupancy degree varies throughout
the hydrate structure when multiple cycles are run, hence affecting the shape of the
dissociation curve. In fact, even the onset temperature slightly changes according to
the occupancy degree. The reason for this is that deeper regions could present more
empty cavities than interfacial areas, leading to slightly lower dissociation
temperatures, as observed for methane hydrates. However, the multicycles method
does not give lower onset temperatures in this case likely because standard analyses
were performed at a higher heating rate (1 K·min-1), which may have led to lower
dissociation temperatures than multicycles analyses (0.2 K·min-1). It means that the
same effect of heating rate on methane hydrates, observed in Figure 4.5 of section
4.3.3, may have occurred for ethane hydrates. The trend of lower onset temperatures
for multicycles experiments is resumed in section 4.5.2, in which both methods were
performed at the same heating rate for CO2 hydrates.
Figure 4.21 – Thermograms of C2H6 hydrates dissociation by the multicycles method.
130
Another distinct point from the methane hydrate results is about the ice
conversion rate. Methane hydrates took less than 16 cycles for 90% of ice conversion,
whereas Figure 4.22 shows that at least 21 cycles were required for ethane hydrates
in order to reach the same conversion rate. It has not to do with the difference of gas
solubilities in water since ethane is more soluble than methane, and it should favor the
hydrate formation (SCHARLIN et al., 1998). The reason indeed may be the same one
why lower onset temperatures than predictions are obtained, as mentioned in the
previous section. The size of ethane molecules is larger than methane, and it makes
harder the diffusion and incorporation of such molecules into the cavities so that the
hydrate structure takes longer to be finally formed. This phenomenon could contribute
to the heterogeneity of structures observed in multicycles thermograms, mentioned
above. However, despite the ethane molecules be geometrically more challenging to
fill most of cages from structure I, mainly the small ones, ethane hydrate (sI) is still
more thermodynamically stable than methane hydrate (sI) as guest molecules keep
closer to the water lattice and chemical interactions are stronger.
Figure 4.22 – Ice conversion to C2H6 hydrate throughout multicycles. The analyses were influenced by both effects of pressure and H2O sample size.
At last, one could suggest a trend of slower ice conversion as the pressure
increases, unlike observed in methane hydrates. However, the sizes of water samples
are different in these experiments and, thereby, the effect of pressure on ice conversion
cannot be analyzed singularly and are not conclusive in this case.
131
4.4.3 Enthalpy of Dissociation and Hydration Number
The enthalpies of dissociation were also calculated for ethane hydrates by both
Clapeyron and integration methods. Tables 4.10 and 4.11 present the enthalpies
obtained by the standard and multicycles methods. The standard method was used to
calculate the enthalpy changes only through the Clapeyron equation, since this method
does not provide accurate results, as discussed for methane hydrates.
Table 4.10 – Enthalpies of C2H6 hydrates dissociation based on experimental data obtained by the standard method. The hydration number (n) was estimated based on the fractional occupancy degree
provided by CSMGem software and by the iterative method.
P (MPa) T (K) Ø (K·min-1)
CSMGem Iterative Method
n ΔH Clapeyron
n ΔH Clapeyron
(kJ/mol C2H6) (kJ/mol C2H6)
5 287.96 1 7.74 69.75 8.22 65.74
9.8 288.76 1 7.72 65.72 7.79 65.06
20 290.27 1 7.68 63.44 7.56 64.78
30 291.55 1 7.65 62.38 7.45 64.76
40 292.8 1 7.62 61.87 7.40 64.85
50 293.93 1 7.59 61.15 7.33 64.91
60 294.98 1 7.56 60.35 7.26 64.95
70 296.00 1 7.51 59.61 7.19 65.00
Table 4.11 – Enthalpies of C2H6 hydrates dissociation based on experimental data obtained by the multicycles method. The hydration number (n) was estimated based on the fractional occupancy
degree provided by CSMGem software and by the iterative method.
The experimental enthalpy change used as a reference for iterations in this case
was 71.8 kJ/ mol C2H6, as reported by Handa (1986) at standard condition of
temperature and pressure. Figure 4.23 presents the hydration number according to the
pressure. A higher deviation is observed for the multicycles method likely due to the
few points available to find a more suitable equation describing the experimental data.
Although the equation chosen to fit data affects the hydration number, the enthalpy
changes found through the Clapeyron equation are very close for both standard and
multicycles methods, as shown in Figure 4.24 (A and B).
Figure 4.23 – Hydration number (n) for C2H6 hydrates calculated through the iterative method (standard and multicycles methods) and by applying CSMGem predictions.
Figure 4.24 – Enthalpies of C2H6 hydrates dissociation determined by the Clapeyron equation based on experimental data: A) standard method; B) multicycles method. The black line regards to the
calculus of hydrate dissociation using 𝑛 calculated from the cages occupancy obtained by CSMGem predictions.
133
Although the dissociation temperature from CSMGem predictions can slightly
deviate from the experimental one, the variation of the hydration number based on
fractional cages occupancy (from CSMGem) is negligible for such small deviations.
However, Figure 4.24 shows that using the hydration number based on CSMGem
predictions again does not provide consistent results when applying the Clapeyron
equation. The same is observed in the results of integrations in Figure 4.25. At last, a
better convergence of enthalpies from Clapeyron equation and integration is obtained
by using 𝑛 from iterations than based on CSMGem predictions, as shown in Figure
4.26. The average deviations and the respective confidence intervals (95%) indicate
that using the iterative method provides the most reliable results.
Figure 4.25 – Enthalpies of C2H6 hydrates dissociation determined by the integration of curves from calorimetric thermograms (multicycles method): A) 𝑛 from CSMGem predictions; B) 𝑛 from the
iterative method.
Figure 4.26 – Absolute deviations between enthalpies of C2H6 hydrate dissociation calculated by the Clapeyron equation and through the integration of the hydrate dissociation curve (multicycles method).
134
No values of enthalpies were found in the literature at similar conditions to this
work. It is worth to mention that the analyses presented herein were performed above
the upper quadruple point (Q2), which connects LW-H-LHC and LW-H-VHC equilibrium
lines. Therefore, it is reasonable that the enthalpies' changes obtained in this work are
slightly lower than from the literature (below Q2) since the hydrate dissociation delivers
ethane in form of compressed liquid instead of vapor. The latent heat of ethane
vaporization is about 5 kJ/mol (NIST Webbook), and this value agrees to the difference
of enthalpies obtained in this work (above Q2) and from the literature (below Q2), shown
in Table 4.12
Table 4.12 – Enthalpies of C2H6 hydrates obtained in this work and found in the literature.
Reference Method T (K) ΔH (kJ/mol C2H6)
This work HP-µDSC 288.35 – 294.49 64.92 ±1.45
Clapeyron 287.96 - 296.00 65.23 ±0.85
Nakagawa et al. (2008) Calorimeter 283.00 - 286.00 71.10
Yoon et al. (2003) Clausius-Clapeyron 273.15
71.34
Handa (1986) Calorimeter 273.15 71.80
4.5 CARBON DIOXIDE-WATER SYSTEM
4.5.1 Equilibrium Data for CO2 Hydrates by High Pressure Microcalorimetry
The last single guest hydrate-forming system studied was composed of water and
carbon dioxide. Table 4.13 and Figure 4.27 show the data obtained by HP-µDSC
(standard method) and the respective absolute deviations. Multiflash predictions
deviate noticeably from CSMGem predictions (up to 0.9 K in the range covered by
Figure 4.27). The onset temperatures result in the lowest deviations from CSMGem
predictions, and their lower values again may be related to the greater presence of
empty cavities in the synthesized hydrates. The high discrepancy of peak and endset
temperatures can be attributed to the amount of hydrate formed, significantly larger in
this system even when applying the standard method. Considering there is no mixing
inside the system, the hydrate formation is mainly limited by mass transfer, as already
mentioned. In this context, the CO2 solubility and diffusivity in water play a crucial role
in the kinetics of hydrate formation and explains the large amount of hydrate formed
(POKHAREL et al., 2018; SCHARLIN et al., 1998; TAMIMI et al., 1994;).
135
Table 4.13 – Dissociation data of CO2 hydrates by HP-µDSC and the respective absolute deviations (AD) from computational predictions.
Figure 4.27 - Dissociation data of CO2 hydrates obtained by HP-µDSC: (▲) onset temperatures; (●) peak temperatures; (♦) endset temperatures. Black lines refer to CSMGem predictions and Red lines,
to Multiflash.
Figure 4.28 shows the thermograms obtained for carbon dioxide hydrates at
different pressures by the standard method. Increasing pressure tends to form large
amounts of hydrate, as observed for methane hydrates.
136
Figure 4.28 – Heating thermograms of the CO2-H2O system at 1 K·min-1 and at different pressures.
4.5.2 Effect of Multicycles
Table 4.14 shows the dissociation data for carbon dioxide hydrates by standard
and multicycles methods. Although the last run of multicycles analyses in the previous
systems was performed at 0.2 K·min-1 for better enthalpy estimations, in this case was
used 1 K·min-1. This was because carbon dioxide at critical conditions showed to affect
the elastomer seal inside the pressure gauge so that shorter analyses were required.
Table 4.14 – Dissociation data of CO2 hydrates by standard and multicycles methods, and their respective absolute deviations (AD) from computational predictions.
On the other hand, the effect of multiple cycles on broadening the width of
dissociation curves and the influence of the methodology on the dissociation
137
temperatures can be discussed more convincingly in this system, considering that the
heating rate was the same for both methods. The onset temperatures for multicycle
analyses tend to be slightly lower than for standard experiments. This supports that
the heterogeneity degree is slightly higher when applying multiple cycles. As discussed
for methane and ethane hydrates, deeper hydrate layers may contain more empty
cavities than layers close to the interface. Such difference in cage-occupancy degrees
may lead to lower onset temperatures. It is worth to remember, however, that this
phenomenon does not restrict the use of multicycles method, since the results are very
similar, and the onset deviations are within the experimental uncertainty. Figure 4.29
shows the absolute deviations of dissociation temperatures with respect to CSMGem
predictions. Higher deviations are found for peak and endset temperatures, as
expected. However, the deviations from multicycle analyses are higher than for
previous systems because the experiments, in this case, were run at 1 K·min-1.
Besides, the amount of hydrate formed is higher than in the standard analysis, leading
to a wider dissociation curve.
Figure 4.29 – Absolute deviations of dissociation temperatures with respect to predictions for CO2 hydrates: (■) standard method (●) multicycles method.
138
Thermograms of CO2 hydrates dissociation obtained by the multicycles method
are shown in Figure 4.30 and seem to be smoother than methane and ethane
thermograms (Figures 4.9 and 4.21, respectively). This could be explained by two
factors: i) Multicycles analyses of CO2 hydrate were run at higher heating rate than
multicycles performed for methane and ethane hydrates, which enlarge the
dissociation curves and reduce the resolution for small transitions; ii) The CO2 hydrates
may be more homogeneous. The high solubility and diffusivity of CO2 contribute to a
higher occupancy of the hydrate cavities in deeper layers. Thereby, such distinct peaks
are not as evident as they are for methane and ethane hydrates, although some
discontinuities and asymmetry still can be observed in the dissociation curves.
Figure 4.30 – Thermograms of CO2 hydrate dissociation by the multicycles method.
Finally, the ice conversion evolution over multiple cycles is shown in Figure 4.31
for samples initially containing 48.9 and 53.4 mg. Similar to methane hydrates, higher
pressures led to higher conversion rates in both cases. On the other hand, it was
expected faster conversion rates in this system than for methane and ethane hydrates,
considering the chemical features of CO2 mentioned above. In fact, this can be
observed at 20 and 50 MPa, once only 11 and 6 cycles were enough to reach 90% of
conversion. However, the same behavior is not observed for 9.8 and 40 MPa, whose
ice conversion took longer than methane hydrate samples. Although pressure and H2O
sample size are factors that seem to affect the ice conversion rate to hydrate, this
process may also depend on stochastic factors.
139
Figure 4.31 – Effect of pressure on the ice conversion to CO2 hydrate: A) 48.9 mg of water and B) 53.4 mg of water.
4.5.3 Enthalpy of Dissociation and Hydration Number
Enthalpies of dissociation were calculated for CO2 hydrates, similarly to the
previous systems. The results from standard and multicycles methods are presented
in Table 4.15 and 4.16, respectively. In this case, two reference states were used to
calculate the hydration number through the iterative method: i) calorimetric data at
273.65 K from Kang et al. (2001); ii) data from the Clapeyron equation calculated by
Anderson (2003) at the upper quadruple point (283.1 K and 4.45 MPa).
Table 4.15 – Enthalpies of CO2 hydrates based on experimental data obtained by the standard method. The hydration number (n) was estimated based on the fractional occupancy degree provided
by CSMGem software and by the iterative method.
P (MPa)
T (K)
CSMGem Iterative method
(ΔH*Kang)
Iterative method (ΔH*And.)
n ΔH Clapeyron
n ΔH Clapeyron n
ΔH Clapeyron
(kJ/mol CO2) (kJ/mol CO2)
(kJ/mol CO2)
9.8 283.70 6.29 48.12 5.80 53.94 6.30 47.97
20 284.87 6.20 54.37 6.23 54.03 6.62 47.75
30 285.45 6.14 54.60 6.18 53.83 6.52 47.59
40 286.15 6.08 56.21 6.20 53.76 6.50 47.52
50 286.74 6.03 56.74 6.17 53.37 6.44 47.45
60 287.37 5.99 57.45 6.15 53.61 6.39 47.41
70 287.94 5.96 57.46 6.10 53.54 6.33 47.37
80 288.45 5.93 56.91 6.05 53.45 6.25 47.32
140
Table 4.16 – Enthalpies of CO2 hydrates based on experimental data obtained by the multicycles method. The hydration number (n) was estimated based on the fractional occupancy degree provided
The hydration numbers are presented in Figure 4.32, and it is observed that 𝑛
tends to decrease as the pressure increases. The volumetric ĸ𝑇 is found to be 3E-4,
3E-7 and 3E-5 for methane, ethane and carbon dioxide, respectively (BALLARD,
2001). Therefore, the effect of the compressibility factor on the lattice parameter is
lower for ethane and carbon dioxide hydrates, and the effect of thermal expansivity
probably prevails and favors the cages occupancy, decreasing the hydration number.
The lower value of 𝑛 observed at 9.8 MPa in Figure 4.32A could be related to the
uncertainty of 𝑑𝑃/𝑑𝑇 at this point, since it is very close to Q2.
Figure 4.32 – Hydration number (n) for CO2 hydrates calculated through the iterative method: A) standard method; B) multicycles method. The black line regards to the hydration number (𝑛)
calculated from the cages occupancy obtained by CSMGem predictions.
Figure 4.33 shows enthalpies of dissociation calculated by the Clapeyron
equation. A notable difference is observed by using the reference enthalpies reported
by Kang et al. (2001) and Anderson (2003). The latter author also found a difference
141
of about 5 kJ·mol-1 for the enthalpies calculated on the LW-H-VHC equilibrium lines and
indicates that a systematic error could have occurred in the calorimetric measurement
from Kang et al. (2001). It was suggested because the calorimetric result for methane
hydrate reported by Kang et al. also presents a significant deviation from enthalpies
obtained by Handa (1986) using a direct method.
Figure 4.33 – Enthalpies of CO2 hydrates dissociation by the Clapeyron equation based on experimental data: A) standard method; B) multicycles method. The black line regards to the calculus
of hydrate dissociation using 𝑛 calculated from the cages occupancy obtained by CSMGem predictions.
The enthalpies of dissociation obtained by the integration of thermograms are
shown in Figure 4.34. Regardless the hydration number method applied, the results
approach to the ones obtained by Clapeyron equation in which the Anderson enthalpy
was used as the reference. In this case, the results from integrations and Clapeyron
equation (∆𝐻𝐴𝑛𝑑.∗ ) provides very good agreement. Figure 4.35 shows the absolute
deviations from results obtained by Clapeyron equation and integration method. The
average deviations and the respective confidence intervals (95%) indicate that using
𝑛 from the iterative method (∆𝐻𝐴𝑛𝑑.∗ ) provides the most reliable results.
As for ethane hydrates, no data were found in the literature for CO2 hydrate
dissociation above Q2. Moreover, the previous reported results vary in a broad
temperature range, as shown in Table 4.17. However, considering that the latent heat
of CO2 vaporization is around 9 kJ/mol (NIST Webbook), it is reasonable that the
enthalpy changes found in this work are lower than in the literature.
142
Figure 4.34 – Enthalpies of CO2 hydrates dissociation determined by the integration of curves from calorimetric thermograms obtained by the multicycles method. (*) 𝑛 by the iterative method.
Figure 4.35 – Absolute deviations of CO2 dissociation enthalpies calculated by the Clapeyron equation and integration of curves from thermograms.
Table 4.17 – Enthalpies of CO2 hydrates obtained in this work and found in the literature.
Bozzo et al. (1975) Clausius-Clapeyron 273.15 58.99
Vlahakis et al. (1972) Clausius-Clapeyron 273.20 59.90
* Corresponding to Q1 (1.256 MPa) and Q2 (4.499 MPa)
143
4.6 CONCLUSIONS
This chapter presents new thermodynamic data based on high-pressure
microcalorimetry for single hydrates of methane, ethane and carbon dioxide.
Predictions from CSMGem and Multiflash software were evaluated according to the
experimental results. Onset temperatures are the most reliable for estimating hydrate
equilibrium by HP-µDSC and tend to be closer to CSMGem predictions. In fact,
multiflash predictions are far from CSMGem ones, especially for ethane and carbon
dioxide hydrates, and the discrepancy is greater as pressure increases. As expected,
the increase in pressure led to higher hydrate dissociation temperatures. On the other
hand, the ice melting temperatures are diminished with an increase in pressure, in
agreement with the phase diagram of water. The influence of some experimental
factors on hydrates dissociation by HP-µDSC was also studied. The main results are
summarized below for each system addressed:
• Results from methane hydrates showed reproducible and accurate onset
temperatures, within the experimental uncertainty. Standard deviations of the
onset temperatures corresponding to the ice melting are slightly lower than those
of the hydrate dissociation due to the probable structural irregularities and cages
occupancy on the latter;
• The onset temperatures in binary systems (one gas and water) seem not to be
substantially affected by the amount of water added into the cell. On the other
hand, dynamic effects play a role in the kinetics of hydrate formation, and hence
the water-sample size affects the proportion of ice and hydrate formed. A higher
amount of water favored the methane hydrate formation likely by increasing the
interfacial areas between gas and aqueous phase;
• Unlike pure substances, the cooling/heating rate slightly affects the onset
temperature of the hydrate dissociation. A higher cooling rate implies the
formation of a more heterogeneous structure by inducing more empty cavities
and intergranular defects, thus leading to lower dissociation temperatures. Onset
temperatures of methane hydrates obtained at 1 K·min-1 resulted in higher
deviations from predictions than at 0.5 and 0.2 K·min-1. Moreover, methane and
ethane hydrates analyzed at 1 K·min-1 by the standard method presented slightly
lower onset temperatures than analyses based on the multicycles method
performed at 0.2 K·min-1. Despite all this evidence, the analysis time by running
144
at 0.2 K·min-1 can be significantly longer, and the results at 1 K·min-1 are still
accurate with deviations within the experimental accuracy;
• A method of multicycles was applied in order to increase the ice conversion to
hydrate. Lower onset temperatures were observed for methane and carbon
dioxide hydrates after multiple cycles when the same cooling / heating rate was
applied in both methods. This may be related to a slightly higher degree of
heterogeneity when performing the multicycles method. The relatively low cage
occupancy degree of inner hydrate layers formed during subsequent cycles
should reduce the onset dissociation temperature. The heterogeneity of hydrates
obtained by the multicycles method is evident in thermograms of dissociation.
Nevertheless, the results of onset temperatures are still accurate and
satisfactory;
• High pressures and a large amount of water seem to contribute to a faster ice
conversion to methane hydrate over subsequent cycles;
• Ethane systems noticeably required more cycles to reach 90% of ice conversion
to hydrate than methane and carbon dioxide systems. The larger size of ethane
molecules makes geometrically harder the diffusion and incorporation of these
molecules into hydrate structures. This phenomenon also contributes to a more
heterogeneous structure;
• The fractions of carbon dioxide hydrate formed in the first cycle are much higher
than hydrate fractions in methane and ethane systems. The high solubility and
diffusivity of CO2 contribute to the hydrate formation. These factors may also
promote more homogeneous hydrate structures;
• Although the multicycles method may imply a slightly higher heterogeneity on
hydrate structures, it has shown to be much more accurate to estimate
enthalpies, by integrating the dissociation curves, than the standard method. The
determination of baselines is much easier when no recrystallization process is
observed and most of the ice is converted to hydrate. The deviations between
enthalpies of CH4 dissociation calculated by integrations and the Clapeyron
equation are considerably lower by applying the multicycles method than the
standard method;
• An iterative method is presented in this work to calculate the enthalpy of hydrate
dissociation using the Clapeyron equation. This method accounts for the finite
145
volumes of all phases, the non-ideality of the vapor phase and the solubility of
hydrocarbons in water. In addition, the hydrate volume was estimated by
considering the effect of isobaric thermal expansivity and isothermal
compressibility factors on the lattice parameter. These factors affect the hydration
number and hence the enthalpy of dissociation. Although the equation chosen to
describe the equilibrium data may slightly affect the term 𝑑𝑃/𝑑𝑇 from the
Clapeyron equation, the results for both 𝑛 and ∆𝐻𝑑𝑖𝑠𝑠 obtained through iterations
are consistent for all single hydrates studied;
• Although ∆𝐻𝑑𝑖𝑠𝑠 is almost constant along the same equilibrium line, this property
varies depending on the phases involved. No data was found in literature for
dissociation enthalpy of single ethane and carbon dioxide hydrates at the same
thermodynamic equilibrium conditions addressed in this work (above the upper
quadruple point);
• Dissociation enthalpy of singles hydrates determined by the Clapeyron equation
(𝑛 from iterations) based on standard and multicycles data present excellent
agreement. On the other hand, the use of hydration numbers based on CSMGem
predictions of fractional cages occupancy does not provide consistent results.
The enthalpies of dissociation from the Clapeyron equation are compared to the
ones determined by integrations, and the average deviations, along with their
respective confidence intervals (95%), indicate that the multicycles method and
the use of 𝑛 from the iterative method provide the most reliable results.
REFERENCES
ANDERSON, G.K. Enthalpy of dissociation and hydration number of carbon dioxide hydrate from the Clapeyron equation. Journal of Chemical Thermodynamics, v. 35, p. 1171-1183, 2003. ANDERSON, G.K. Enthalpy of dissociation and hydration number of methane hydrate from the Clapeyron equation. Journal of Chemical Thermodynamics, v. 36, p. 1119-1127, 2004. BALLARD, A.L. A non-ideal hydrate solid solution model for a multi-phase equilibria program. Ph.D. Thesis, Colorado School of Mines, Golden, Colorado, USA, 2001. BOZZO, A.T.; CHEN, H.-S.; KASS, J.R.; BARDUHN, A.J. The proprieties of Hydrate of chlorine and carbon dioxide. Desalination, v. 16, p. 303-320., 1975.
146
CONLEY, J.G.; HUANG, J.; ASADA, J.; AKIBA, K. Modeling the effects of cooling rate, hydrogen content, grainrefiner and modifier on microporosity formation in Al A356 alloys. Materials Science and Engineering A, v. 285, p. 49 – 55, 2000. CHROSTEK, T. The influence of the heating and cooling rates on the temperature of the phase transitions. Oficyna Wydawnicza Stowarzyszenia Menedżerów Jakości i Produkcji (SMJiP), Chapter 6, p.87-98, 2016. DAVIES, S.R.; HESTER, K.C.; LACHANCE, J.W.; KOH, C.A.; SLOAN, E.D. Studies of hydrate nucleation with high pressure differential scanning calorimetry. Chemical Engineering Science, v. 64, p. 370-375, 2009. DENYS S., SCHLÜTER O., HENDRICKX M.E.G., KNORR D. Effects of High Pressure on Water-Ice Transitions in Foods. In: Hendrickx M.E.G., Knorr D., Ludikhuyze L., Van Loey A., Heinz V. (eds) Ultra High Pressure Treatments of Foods, chapter 8, p. 242. Food Engineering Series. Springer, Boston, MA, 2001. GUPTA, A. Methane Hydrate Dissociation Measurements and Modeling: The Role of Heat Transfer and Reaction Kinetic, Ph.D. thesis, Colorado School of Mines, Golden, Colorado, USA, 2007. GUPTA, A.; LACHANCE, J.; SLOAN, E. D.; KOH, C. A. Measurements of methane hydrate heat of dissociation using high pressure differential scanning calorimetry. Chemical Engineering Science, v. 63, p. 5848-5853, 2008. HANDA, Y.P. Compositions, enthalpies of dissociation, and heat capacities in the range 85 to 270 K for clathrate hydrates of methane, ethane, and propane, and enthalpy of dissociation of isobutane hydrate, as determined by a heat-flow calorimeter. Journal of Chemical Thermodynamics, v. 18, p. 915- 921, 1986. KANG, S.P.; LEE, H.; RYU, B.J. Enthalpies of dissociation of clathrate hydrates of carbon dioxide, nitrogen, (carbon dioxide + nitrogen), and (carbon dioxide + nitrogen + tetrahydrofuran). Journal of Chemical Thermodynamics, v. 33, p. 513–521, 2001. KE, W.; SVARTAAS, T.M. Effects of stirring and cooling on methane hydrate formation in a high pressure isochoric cell. Proceedings of the 7th International Conference on Gas Hydrates (ICGH), Edinburgh, Scotland, United Kingdom, July 17-21, 2011. KERKAR, P.B.; HORVAT, K.; MAHAJAN, D.; JONES. K.W. Formation and dissociation of methane hydrates from seawater in consolidated sand: mimicking methane hydrate dynamics beneath the seafloor. Energies, v. 6, p. 6225-6241, 2013. NAKAGAWA, R.; HACHIKUBO, A.; SHOJI, H. Dissociation and specific heats of gas hydrate under submarine and sublacustrine environments. Proceedings of the 6th International Conference on Gas Hydrates (ICGH), Vancouver, British Columbia, Canada, July 6-10, 2008. NASIR, Q.; LAU, K.K.; LAL, B. Enthalpies of dissociation of pure methane and carbon dioxide gas hydrate. International Journal of Chemical and Molecular Engineering, v. 8, p. 840-843, 2014.
147
LINSTROM, P.J.; MALLARD, W.G. (Eds.). NIST Chemistry WebBook, NIST Standard Reference Database Number 69, July 2001, National Institute of Standards and Technology, Gaithersburg MD, 20899 (http://webbook.nist.gov). POKHAREL, S. ARYAL, N.; NIRAULA, B.R.; SUBEDI, A.; ADHIKARI, N.P. Transport properties of methane, ethane, propane, and n-butane in water. Journal of Physics Communication, v. 2, 065003, 2018. SABIL, K.M.; WITKAMP, G-J.; PETERS, C.J. Estimations of enthalpies of dissociation of simple and mixed carbon dioxide hydrates from phase equilibrium data. Fluid Phase Equilibria, v. 290, p. 109-114, 2010. SAHLE, C.J.; STERNEMANN, C.; SCHMIDT, C.; LEHTOLA, S.; JAHN, S.; SIMONELLI, L.; HUOTARI, S.; HAKALA, M.; PYLKKÄNEN, T.; NYROW, A.; MENDE, K.; TOLAN, M.; HÄMÄLÄINEN, K.; WILKE, M. Microscopic structure of water at elevated p, T. Proceedings of the National Academy of Sciences, v. 110, p. 6301-6306, 2013. SANZ, E.; VEGA, C.; ABASCAL, J.L.F.; MACDOWELL, L.G. Phase Diagram of Water from Computer Simulation. Physical Review Letters, v. 92, 255701, 2004. SCHARLIN, P.; BATTINO, R.; SILLA, E.; TUÑÓN, I.; PASCUAL-AHUIR, J.L. Solubility of gases in water: correlation between solubility and the number of water molecules in the first solvation shell. Pure and Applied Chemistry, v. 70, p. 1895-1904, 1998. SLOAN E.D.; KOH, C. Clathrate hydrates of natural gases, 3rd ed. Boca Raton: CRC Press, 2008. SLOAN, E.D.; FLEYFEL, F. Hydrate dissociation enthalpy and guest size. Fluid Phase Equilibria, v. 76, p. 123-140, 1992. SLOAN, E.D.; FLEYFEL, F. Reply to “comments on: hydrate dissociation enthalpy and guest size”, Fluid Phase Equilibria, v. 96, p. 233-235, 1994. SUN, S.; HAO, Y.; ZHAO, J. Analysis of gas source for the replacement of CH4 with CO2 in gas hydrate production from the perspective of dissociation enthalpy. Journal of Chemical and Engineering Data, v. 63, p. 684-690, 2018. TAMIMI, A.; RINKER, E.B.; SANDALL, O.C. Diffusion coefficients for hydrogen sulfide, carbon dioxide, and nitrous oxide in water over the temperature range 293-368 K. Journal of Chemical & Engineering Data, v. 39, p. 330-332, 1994. VLAHAKIS, J.G.; CHEN, H.-S.; SUWANDI, M.S.; BARDUHN, A.J. The growth rate of ice crystals: Properties of carbon dioxide hydrate, a review of properties of 51 gas hydrates, Syracuse University. Research and development report 830 prepared for US Department of Interior, 1972.
ZHANG, X.; YANG, W.; XU, H.; ZHANG, L. Effect of cooling rate on the formation of nonmetallic inclusions in X80 pipeline steel. Metals, v. 9, 392, 2019.
148
WELLEN, R.M.R; RABELLO, M.S.; ARAUJO JUNIOR, I.C.; FECHINE, G.J.M; CANEDO, E.L. Melting and crystallization of poly(3-hydroxybutyrate): effect of heating/cooling rates on phase transformation. Polímeros, v. 25, p. 296-304, 2015.
149
CHAPTER 5
THERMODYNAMIC STUDY OF DOUBLE-GUEST GAS HYDRATES
ABSTRACT
Dissociation data of double-guest gas hydrates are presented in this chapter for
systems composed of CH4-C2H6-H2O, CH4-C3H8-H2O, and CH4-CO2-H2O. The results
obtained by HP-µDSC are compared to CSMGem and Multiflash predictions up to 100
MPa. Ternary phase diagrams were also designed for these gas hydrate-forming
systems based on computational simulations to study the influence of overall and gas-
phase compositions on gas hydrate dissociation temperatures. The suitability of
structures I and II to host different types of molecules and the occupancy degree of the
cages are addressed in order to explain the dissociation temperature profiles according
to the composition. The quaternary system composed of CH4-C2H6-C3H8-H2O was also
studied through computational simulations.
5.1 INTRODUCTION
The influence of different experimental factors on mass transfer inside the
microcalorimeter cell was evaluated in the last chapter. For multiple-guest systems,
the dynamic effects on hydrates properties have to be considered much more carefully
in this case. Considering that the diffusion of molecules in water varies with gas
species, inner regions of the hydrate layer may be more filled with gas that has a higher
diffusion coefficient. On the other hand, the structure should be more ideally occupied
at layers close to the surface since the interface facilitates the incorporation of any gas-
phase molecules into the hydrate structure. Gas solubility is another factor that should
also affect the concentration of gas molecules in the liquid phase. Therefore, a
heterogeneous structure can be formed in unstirred systems containing gas mixtures
due to the gas concentration gradient throughout the aqueous phase, and this should
influence hydrate properties, including dissociation temperature.
The type of the crystalline structure to be formed also depends on the size and
composition of the guest molecules involved (NIXDORG; OELLRICH, 1997). The main
types of structures formed during crystallization are sI, sII, and sH. These structures
150
present different equilibrium properties, such as formation and dissociation
temperature, enthalpy, and heat capacity, as mentioned in previous chapters. All these
data are essential for applying gas hydrates technology for the transportation of natural
gas, to develop inhibition strategies, or even using hydrates in other applications.
Subramanian et al. (2000) studied methane-ethane-water system by Raman
spectroscopy at different gas compositions and pressures not higher than 1.6 MPa.
The group verified a sudden change from the structure I to structure II as the amount
of methane increased. The structure I prevailed in the samples containing up to 72.2
mol% of methane, whereas structure II was predominant in samples with larger
fractions of methane. They suggested that the proximity between the host molecules
size and the cavity diameter may explain the higher stability of structure II in a broad
range of gas composition. For the system methane-propane-water, it has also been
evidenced the coexistence structures I and II, although the formation of sI is not
predicted by all commercial software programs. Klapproth et al. (2019) and other
groups have also reported the formation of methane hydrate along with methane-
propane hydrate in such systems. The discussion about this system is extended to
Chapter 6, where a complementary technique based on a PVT cell is used to determine
equilibrium properties.
This chapter presents enlightening results obtained exclusively by high-pressure
microcalorimetry and computational simulations for different hydrate-forming systems
composed of methane-ethane-water, methane-propane-water, methane-carbon
dioxide-water, and methane-ethane-propane-water (the latter only by computational
analysis). Ternary diagrams and dissociation temperature profiles as a function of gas-
phase composition were built based on simulations using the CSMGem software. The
purpose of modeling was to study the effect of both overall and gas-phase
compositions on the type of hydrate structure formed and its dissociation temperature.
Then, experimental data obtained at specific conditions were used to evaluate the
reliability of predictions. In addition to the guest-molecules species, this chapter also
discusses the effect of the cage occupancy degree on the hydrate properties, and how
this may contribute to a structural transition in some cases.
151
5.2 SPECIFIC EXPERIMENTAL CONDITIONS
Experimental Configuration: Systems containing gas mixtures were studied by
HP-µDSC. Two operational modes are possible: constant pressure or isochoric mode.
During the isochoric mode the system is kept closed so that the volume and overall
composition was kept constant throughout the experiment. This method was selected
herein in order to make feasible the comparison between experimental results to
computational predictions. However, the experimental pressure is not strictly constant
during the analysis when using the isochoric mode due to temperature variation, unlike
the constant pressure mode applied for single hydrates presented previously. For this
reason, the dissociation pressure was determined from the onset point of the hydrate
dissociation curve to increase accuracy of results. However, it is worth to mention that
the pressure variation concerned to the hydrate dissociation is relatively low due to the
small amount of sample in the cell. In addition, the temperature range covered during
the dissociation process is also short. Thus, pressure can be considered approximately
constant during this reaction.
Computational Analysis: In this chapter, the microcalorimetric results are
compared to CSMGem and Multiflash predictions. The overall composition used as
input in simulations was established according to the results obtained from estimations
by using the Peng-Robinson EoS, as studied in Chapter 3. The compositions indicated
in any figure or table in this chapter refer to water-free compositions.
Ternary diagrams were built based on 116 equilibrium points obtained at different
compositions for the hydrate-forming systems: CH4-C2H6-H2O, CH4-C3H8-H2O, CH4-
CO2-H2O, and CH4-C2H6-C3H8-H2O. Temperature-gas composition plots, 𝑇 (𝑃, 𝑥𝐶𝐻4),
have also been analyzed at constant water fraction (0.5) for these systems. In fact, the
temperature profiles look very similar for any water fraction illustrated in Figure 5.1.
Although only the diagrams using CSMGem predictions are presented in this chapter,
profiles obtained using Multiflash predictions were very similar.
152
Figure 5.1 – Cross-sections of ternary phase diagrams at constant water fractions. The temperature profiles are similar, following either trajectory.
5.3 INFLUENCE OF CAGE OCCUPANCY ON STRUCTURAL STABILITY OF HYDRATES
The dissociation temperature of a specific system is related to its structural
stability, and it can be explained by the cavities occupancy. Table 5.1 shows the ratios
of guest molecule size by cavities diameter for structures I and II, reported by Sloan
and Koh (2008). It is assumed that the structure stability depends on the ratio between
guest molecule size and the cavity diameter. The typical values for this ratio vary
between 0.76 and 1, and the structure becomes more stable as this ratio approaches
to the unit. A proportion greater than 1 means that the host molecule is larger than the
cavity and therefore such configuration is unlike to form. For pure methane, for
example, although the molecules are more stable in cavity 512 of sII than sI (ƟsII-SC =
0.868; ƟsI-SC = 0.855), the latter prevails due to their better fit in the large cavities of
structure I than in large cavities of structure II (ƟsI-LC = 0.744; ƟsII-LC = 0.655). In fact,
large cavity is more predominant in sI (3 LC : 1 SC) than small cavity in sII (2 SC : 1
LC). On the other hand, ethane tends to form structure I due to higher stability in larger
cavities (ƟsI-LC = 0.939) when compared to sII (ƟsII-LC = 0.826), considering that ethane
molecules are not preferentially hosted in smaller cavities since the ratio is higher than
1 in both structures. This approach based on molecules fit inside cages added to the
occupancy degree (considering the probable presence of empty cavities), are factors
addressed in this work to explain the diagrams obtained by simulations for the following
systems: CH4-C2H6-H2O, CH4-C3H8-H2O, CH4-CO2-H2O, and CH4-C2H6-C3H8-H2O.
153
Table 5.1 – Ratio of guest and cavities diameters for structures sI and sII.
Guest Molecules
guest molecule diameter / cavity diameter (Ɵ)
sI sII
small cage (SC) 512
large cage (LC) 51262
small cage (SC) 512
large cage (LC) 51264
CH4 0.855 0.744 0.868 0.655
C2H6 1.080 0.939 1.100 0.826
C3H8 1.230 1.070 1.250 0.943
CO2 1.000 0.834 1.020 0.769
Source: Adapted from Sloan and Koh (2008)
5.4 METHANE-ETHANE-WATER SYSTEM
5.4.1 Equilibrium Data for CH4-C2H6 Hydrates by Microcalorimetry
Table 5.2 presents experimental data for hydrates obtained from methane-
ethane-water system. The first column refers to the methane content of the gas mixture
injected into the cell (water-free composition). The onset and peak temperatures are
compared to predictions performed by CSMGem and Multiflash software programs, as
in the previous chapter. Onset temperatures approach to CSMGem predictions,
whereas peak temperatures to Multiflash ones.
Table 5.2 – Dissociation data of CH4-C2H6 hydrates obtained by HP-µDSC and the respective absolute deviations (AD) from computational predictions.
Figure 5.2 shows the data from Table 5.2 according to the initial composition
(water free) of the gas phase inside the cell. Interestingly, onset temperatures tend to
come after the CSMGem predictions at plots A, B, and C, but they precede the
equilibrium line at plots D and E. In fact, this system has a particularity of forming sI or
sII depending on the gas composition. In general, sII forms when the methane content
is higher than 50 mol%, the case of plots D and E. Thereby, one reason for higher
onset temperatures in A, B and C, and lower onset temperatures in D and E is the
coexistence of both structures I and II during the hydrate formation. Thus, a fraction of
sII in the systems A, B and C may lead to higher onset temperatures than predictions,
while a fraction of sI in the systems D and E may imply a lower onset temperatures.
Another hypothesis is related to the difference of solubility and diffusion coefficients of
methane and ethane (POKHAREL et al., 2018). These properties may affect the
homogeneity and occupancy degree of the hydrate. Both hypothesis are also
mentioned by Hachikubo et al. (2008), who found that the dissociation process of
methane-ethane hydrates occurred in two stages, indicating the coexistence of both sI
and sII and/or a presence of a ethane-rich fraction in the hydrate structure.
155
Figure 5.2 – Dissociation data of CH4-C2H6 hydrates obtained by HP-µDSC at different methane concentrations: (▲) onset temperatures; (●) peak temperatures. Black lines refer to CSMGem
predictions and red lines, to Multiflash.
The issue of heterogeneity caused by different cage occupancy degrees will be
resumed later, as this phenomenon was also observed for methane-propane and
methane-carbon dioxide hydrates. Another observation from Figure 5.2 is that
156
Multiflash predictions are farther from CSMGem in the plots of A, B, and C, mainly as
pressure increases. Since these data correspond to sI and the data of D and E to sII,
one can assume that the predictions concerning to structure I implies the most
significant discrepancies between both software.
As mentioned above, the hydrate structure type to be formed in methane-ethane-
water systems depends on the gas phase composition. In fact, both structures I and II
are predicted to be formed at compositions higher than 50 mol% CH4, as will be
discussed in the next section. These structures have similar dissociation temperatures,
and thereby it is not possible to clearly distinguish each dissociation curve in the
thermograms. Nevertheless, overlapped transitions can be observed during the
dissociation of some methane-ethane hydrates, as shown in Figure 5.3.
Figure 5.3 – Ovelapping transitions in thermograms, evidencing the heterogeneity of CH4-C2H6 hydrate structures.
It is also believed that sII may coexist with sI at lower methane concentrations as
a metastable phase. Two hypotheses are assumed herein: I) Both structures I and II
may be formed during the process of nucleation and crystal growth; II) the metastable
structure (sII) should transit to the stable one after a while, which perhaps takes longer
than the time used in the analyses of this work. These hypotheses are supported by
Ohno et al. (2009), who studied the transition between metastable and stable
structures in methane-ethane hydrate through Raman spectroscopy. The hydrates
were synthesized from gas mixtures containing 65 and 93 mol% CH4 at 5.3 and 8.4
157
MPa, respectively. The group found that sI and sII initially formed in all the experiments
and transitions from metastable to stable configuration occurred over time. It was also
observed that the conversion rate from metastable to stable structure was significantly
higher for the sample with 65% CH4, since the complete transition from sII to sI took
about 1 week and the transition from sI to sII in the sample with 93 mol% took only 3
hours. This fact was addressed considering two main factors: a) the driving force that
induces phase transition; b) kinetics of transition. The driving force was considered to
be the difference in water chemical-potential between sI and sII. For the sample with
65 mol% CH4, such difference calculated using CSMGem was 36 J/mol, while it was
66 J/mol for the sample with 93% CH4, indicating that the driving force plays a role in
the conversion rate between the two structures. Regarding kinetics, the group also
estimated that sI of the 65 mol% CH4 sample was composed of 40 mol% methane, and
sII of 66 mol% methane. In the 93 mol% CH4 sample, sI was composed of 78 mol%
methane, and sII of 76 mol%. Thus, it was concluded that in the first case there were
many more molecules to be rearranged during the structural transition than in the latter,
indicating that kinetics also contributed to a lower conversion rate for the sample with
65 mol% CH4. Although the conversion rate was not addressed in this thesis (referring
to hypothesis II), the results from this work and the ones reported by Ohno et al. (2009)
strongly support that both sI and sII form simultaneously at the initial stage of hydrate
formation, regardless of gas composition (referring to hypothesis I).
5.4.2 Thermodynamic and Structural Analysis of CH4-C2H6 Hydrates by
Simulations
Ternary diagrams of dissociation temperatures for methane-ethane hydrates are
shown in Figure 5.4 at three different pressures. All cross-sections with constant water
content have very similar temperature profiles, which mainly depend on the gas phase
composition. The profiles vary slightly according to the pressure, as illustrated in the
plots shown in Figure 5.5 for several pressures. As expected, higher pressures lead to
higher dissociation temperatures, which are represented by warmer colors in the
diagrams.
158
Figure 5.4 – Ternary diagrams of dissociation temperatures for CH4-C2H6 hydrates.
159
Figure 5.5 – Dissociation temperature profiles of CH4-C2H6 hydrates according to the gas phase composition: (♦) onset temperatures from thermograms; (□) CSMGem predictions. Dashed lines refer
to the secondary structure (sI) predicted by simulations. Roman numerals refer to the regions established according to the supposed configuration of cages occupancy.
The predictions from CSMGem shown above confirm that the excess of methane
leads to a secondary structure (sI) formed only by methane molecules. It means that
there is a composition range in which two different structures coexist, but the software
determines the dissociation temperature of the system by considering the more stable
structure. Therefore, the onset temperatures above 50% molar of methane (Figure 5.5)
are between the values of predictions for sI and sII likely due to the the coexistence of
these both structures, which have relatively close dissociation temperatures. Similarly,
the onset temperatures below 50 mol% CH4 tend to be slightly higher than predictions
probably due to the presence of a metastable fraction of sII. In any case, the
experimental data show good agreement with the computational simulations.
Regarding the structural stability for this hydrate system, structure II is formed at
high methane concentrations due to the proximity of CH4 molecules and small-cage
sizes (ƟsII-SC = 0.868), which results in stronger interactions than structure I, added to
the abundance of small cavities in sII. Besides, considering that ethane molecules can
be hosted in large cavities of both structures, it is convenient to form a structure in
which the number of large cavities is proportional to the ethane content. Thus, structure
II provides a proper condition for hosting both methane and ethane molecules, avoiding
the 'competition' to large-cage occupancy occurring in sI.
160
According to predctions, the dissociation temperature still changes according to
the gas composition, even when only one structure should be present. As methane
concentration increases in Figure 5.5, the equilibrium temperature profile is probably
governed by the occupancy degree of the cavities in the respective structure. When
the methane amount is sufficient to occupy most of the smaller cavities (either sI or
sII), the maximum occupation of the structure is reached, i.e., most of larger cavities
by ethane and most of smaller ones by methane molecules. Such configuration leads
to the maximum dissociation temperature due to the high stability implied by guest-
lattice interactions. Therefore, one can imagine two peaks related to maximum
dissociation temperatures regarding the greatest occupancy degree for sI and sII. By
following the temperature profile, it is possible to distinguish seven different regions,
indicated by roman numerals in Figure 5.5. Figures 5.6 and 5.7 illustrate possible
occupancy configurations of these regions as methane concentration increases in
structures I and II, respectively.
Figure 5.6 – Evolution of the cages occupancy for sI hosting CH4 (blue) and C2H6 molecules (yellow) as methane fraction increases.
Figure 5.7 – Evolution of the cages occupancy for sII hosting CH4 (blue) and C2H6 (yellow) molecules as methane fraction increases.
The illustrations do not represent real arrangement in the hydrate crystalline
structure but do indicate the proportion between small and large cavities in a unit cell
161
for each structure. Blue and yellow balls represent methane and ethane molecules,
respectively. Red cages point out empty or less stable cavities occupied by a smaller
molecule, thus facilitating the dissociation of the structure. In the first region (I), low
methane concentration increases the likelihood of small cavities (512) are empty or
occupied by ethane, leading to less energy required to dissociate the hydrate. When
methane content is sufficient to fill most of these small cavities (II), the maximum
occupation of this structure is reached, requiring the highest temperature to dissociate
this type of structure, depicted by the first peak observed in Figure 5.5. Thus, the
temperature decreases slightly due to the occupation of large cavities (51262) by
methane instead of ethane molecules (III). Subsequently, higher methane
concentrations lead to the formation of sII instead of sI (IV), and by going on, a new
maximum dissociation temperature is achieved when most of the cavities are occupied
(V). Thereby, the temperature profile in Figure 5.5 describes two overlapping curves
referring to sI and sII, in which the peaks represent the maximum occupation for each
one, as mentioned before and similarly described by Larionov et al. (2006). After the
second peak, the temperature decreases again (VI), because the increase in methane
concentration implies the occupation of large cavities (51264) by methane instead of
ethane molecules. This leads to a less stable configuration since guest and cavity
diameters ratio (Ɵ) is just 0.665, ergo guest-lattice interaction is weaker, and the
hydrate dissociation easier. Finally, sI turns back as the most favorable since ethane
is scarce (about 90 mol% of CH4) and methane molecules fill both cavities of this
structure (VII).
5.5 METHANE-PROPANE-WATER SYSTEM
5.5.1 Coexistence of Structures I and II on CH4-C3H8 Hydrates
Before presenting the dissociation data for methane-propane hydrates, it is
convenient to elucidate a phenomenon observed during these analyses and reported
by Menezes et al. (2019). The system composed of methane-propane-water is known
to form structure II since the propane molecules fit the large cavities of this structure.
CSMGem allows estimating the hydrate cage occupancy, and one could verify through
calculations that methane molecules are hosted by both small and large cavities of sII.
162
However, the formation of different structures for this system is not predicted for any
gas-phase composition range. In contrast, the results in this work reveal the formation
of two different hydrate structures, both by microcalorimetry and by using a PVT-cell,
discussed in the next chapter. Structures I and II are formed simultaneously during the
cooling process, and probably sI is a pure methane hydrate, considering the similarity
between calorimetric and predicted data.
Figure 5.8 shows the heating thermograms obtained by HP-µDSC at different gas
phase compositions. The first peak on the left corresponds to the ice melting. The
structure I is observed only from 83.3 mol% CH4 onwards, which suggests that the gas
phase composition affects the type of structures initially formed in this hydrate-forming
system. The proportion between sI and sII, in turn, seems not to differ significantly at
different methane concentrations (20 MPa). However, this fact is detailed in Chapter 6
(section 6.4.3.4), where several experiments performed at different fractions of
methane and propane at higher pressures by using a PVT cell will be presented.
Figure 5.8 – Thermograms of CH4-C3H8 hydrates (20 MPa) at different gas phase compositions.
Source: Adapted from Menezes et al. (2019)
A series of thermograms are presented in Figure 5.9 at different pressures. There
is no evidence for sI formation at 10 MPa, which agrees with the results from Uchida
et al. (2004). At higher pressure, however, a new dissociation is verified just right on
the methane hydrate (sI) dissociation range. The integration of the curves revealed
similar areas for the supposed sI structure, but the areas for structure II are intensified
163
by increasing the pressure. Pressure does play a role in hydrate formation kinetics: the
rate of diffusion of a gas depends on its partial pressure, as already stated. Thereby
higher pressures lead to higher crystal growth rates.
Figure 5.9 – Thermograms of CH4-C3H8 hydrates (87.5 mol% CH4) at different pressures.
Source: Adapted from Menezes et al. (2019)
5.5.2 Equilibrium Data for CH4-C3H8 Hydrates by Microcalorimetry
The onset and peak dissociation temperatures for CH4-C3H8 hydrates (sII)
previously shown in Figures 5.8 and 5.9 are presented in Table 5.3, as well as the
deviations from predictions. Table 5.4, in turn, presents the data regarding the
supposed methane hydrate (sI) formed along with sII at different pressures and
methane fractions. In this case, the data are compared with simulations performed for
single methane hydrates, since simulations for methane-propane system do not predict
the formation of structure I. In all the systems studied in this work so far, the onset
temperatures generally presented the lowest deviations when compared to CSMGem
predictions. However, the deviations do not follow this tendency for this system and
have to be studied separately to each hydrate dissociation curve. For structure II (Table
5.3), deviations from peak temperatures are lower than from onset temperatures, even
when just sII was formed. For structure I (Table 5.4), in turn, the lowest deviation
alternates between onset and peak temperatures. This may be because the amount of
hydrate formed is too small so that peak temperatures approach predictions.
164
Table 5.3 – Dissociation data of CH4-C3H8 hydrates (sII) obtained by HP-µDSC and the respective absolute deviations (AD) from computational predictions. Bold data refer to analyses that presented a
secondary structure non-predicted by computational simulations.
Table 5.4 – Dissociation data of likely CH4 hydrates (sI) formed in CH4-C3H8-H2O systems by HP-µDSC and the respective absolute deviations (AD) from computational predictions. In this case,
simulations in CMSGem were performed for single methane hydrates.
Surprisingly, Multiflash predictions are lower than CSMGem ones for CH4-C3H8
hydrates, unlike the other systems. For this reason, the experimental data seem to fit
better to Multiflash predictions according to Figure 5.10. However, it does not guarantee
Figure 5.10 – Dissociation data of CH4-C3H8 hydrates obtained by HP-µDSC at different methane concentrations: (▲) onset temperatures of sII; (●) peak temperatures of sII; (Δ) onset temperatures of sI; (○) peak temperatures of sI. Black lines refer to CSMGem predictions and red lines, to Multiflash.
Solid lines refer to sII, and dashed lines to sI obtained for single methane hydrates.
166
that Multiflash provides the most reliable results in this case. In fact, the noticeably
lower onset temperatures deviations from predictions, may be related to molecular
dynamic issues. Although the solubility of propane is slightly higher than methane in
water (SCHARLIN et al., 1998), the diffusion coefficient of methane in water is higher
than propane (OELKERS, 1991; POKHAREL et al., 2018).
Figure 5.11 shows the tendency of higher deviations of onset temperatures (sII)
from CSMGem predictions as the methane content increases. The higher mobility of
methane molecules may lead to the formation of CH4 rich fractions in deeper layers of
the hydrate. This contributes to the structural heterogeneity and implies lower
temperatures dissociation, as observed in Figure 5.14 addressed in the next section.
The deviations are still higher when sI coexist to sII. In such cases, methane
consumption by sI formation should imply a structure II rich in C3H8, also leading to
lower dissociation temperatures.
Figure 5.11 – Evolution of absolute deviations (AD) of onset temperatures corresponding to structure II (CH4-C3H8).
Finally, Figure 5.12 shows the evolution of these heats as the pressure increases
in the system composed of 87.5 mol% CH4. The heats involved during ice melting and
hydrates dissociation were obtained by integrating the respective curves. The heat
absorbed during ice melting decreases while the total heat concerned to sI and sII
dissociations increases. This confirms that the increase in pressure favored the
hydrate formation rather than ice, since the gas diffusion in water depends on the
applied pressure.
167
Figure 5.12 – Heat absorbed during ice melting and CH4-C3H8 hydrate dissociation according to the pressure.
5.5.3 Thermodynamic and Structural Analysis of CH4-C3H8 Hydrates by
Simulations
The equilibrium temperature profiles for CH4-C3H8 hydrates at 20, 60 and 100
MPa are presented in Figure 5.13. Analogous to the methane-ethane hydrates, all
cross-sections at fixed water fractions obtained from ternary diagrams, shown in Figure
5.14, give temperature contours similar to those in the figure below.
Figure 5.13 – Dissociation temperature profiles of CH4-C3H8 hydrates according to the gas phase composition: (♦) onset temperatures from thermograms; (□) CSMGem predictions. Roman numerals
refer to the regions established according to the supposed configuration of cages occupation.
168
Figure 5.14 – Ternary diagrams of dissociation temperatures of CH4-C3H8 hydrates.
169
The experimental data are in agreement with the predictions and the lower values
of onset temperatures can be explained by the existence of more empty cavities
throughout the hydrate structure than considered by predictions. Still in Figure 5.13,
there is no evidence of overlapping curves in the temperature profiles, as observed in
the ones regarding methane-ethane hydrates (Figure 5.5). This must be because just
structure II can be formed in this case, since the propane molecules do not fit into any
cavity of structure I. Similar dissociation temperature profiles were found for methane-
propane hydrates at 100, 300 and 800 MPa (ALADKO et al. 2002).
In this case, the maximum temperature is achieved when the proportion of
methane in the gas phase is about two thirds (67% mol CH4). This fact also may be
due to the occupation in cavities of structure II. The propane molecules occupy only
the larger cavities of this structure (51264) while the methane molecules tend to be
allocated into the smaller ones (512). Therefore, the maximum dissociation temperature
is obtained when most of the cavities are filled (II), which corresponds to the most
thermodynamically stable configuration. It happens when the methane / propane
proportion is about 2:1, and coincides with the proportion of large and small cavities in
the unit cell of sII (51264 : 512 = 2:1). If the methane fraction in the gas phase is lower
than two thirds (I), part of the small cavities (512) are empty, considering they do not fit
propane molecules, and thereby the dissociation of the hydrate is facilitated. On the
other hand, if the methane fraction is larger than 2/3, both species compete to occupy
the large cages (51264). This means that some of these cavities should host methane
instead of propane molecules, forming a structure that again requires less energy to
dissociate (III). In the illustration of Figure 5.15, blue balls represent methane while the
green ones the propane molecules.
Figure 5.15 – Evolution of the cages occupancy for sII hosting CH4 (blue) and C3H8 molecules (green) as methane fraction increases.
170
Although the onset temperatures are lower than predictions by the reasons
already discussed, the experimental data plotted in Figure 5.14 follow the trend traced
by predictions as the methane content increases. Finally, the non-predicted structure
observed in the experiments reinforces the importance of obtaining experimental data
in the most varied conditions in order to validate and improve mathematical models.
Unfortunately, it was not possible to perform experiments at lower methane
concentrations and at higher pressures due to experimental limitations.
5.6 METHANE-CARBON DIOXIDE-WATER SYSTEM
5.6.1 Equilibrium Data for CH4-CO2 Hydrates by Microcalorimetry
The third and last ternary system used to study double-guest hydrates is
composed of methane, carbon dioxide, and water. The dissociation temperatures are
indicated in Table 5.5 and plotted in Figure 5.16. In this case, similar gas phase
compositions and different water content were used.
A peculiar phenomenon is observed for this system: the onset temperatures are
noticeably lower than predictions when a small amount of water was added to the cell.
Two factors are believed to have contributed to the lower onset temperatures mainly
for 3 and 11.7 mg of water: i) the solubility and diffusivity of carbon dioxide in water; ii)
the effect of H2O sample size on the hydrate heterogeneity. The first factor may have
led to a heterogenous hydrate with a significant fraction rich in CO2. Considering the
high solubility of CO2 in water (SCHARLIN et al., 1998) and its higher diffusivity than
methane (TAMIMI et al., 1994; POKHAREL et al., 2018), deeper layers of the hydrate
likely present a high content of carbon dioxide. Next section shows in detail that low
contents of CH4 lead to lower dissociation temperatures, similarly to the methane-
propane system.
On the other hand, this occurred mainly for samples with low amount of water. It
was mentioned in Chapter 4 that large water sample sizes might increase the interfacial
area between aqueous and gas phases. This effect should contribute to both guest-
molecules incorporations in CH4-CO2 hydrate structure. In other words, the sample
initially containing 39.8 mg H2O may have favored a more homogeneous hydrate
formation, thus leading to more reliable dissociation temperatures. In contrast, lower
171
Ta
ble
5.5
– D
isso
cia
tion
da
ta o
f C
H4-C
O2 h
ydra
tes o
bta
ine
d b
y H
P-µ
DS
C a
nd
th
e r
esp
ective
ab
so
lute
de
via
tion
s (
AD
) f
rom
co
mp
uta
tiona
l
pre
dic
tion
s.
T P
EA
K 2 (
K)
AD
M
ultifla
sh
0.1
5
0.0
0
0.0
3
0.0
6
0.9
9
0.4
5
0.1
5
0.1
9
1.5
1
2.7
9
1.2
3
1.7
3
1.2
0
AD
C
SM
Gem
0.2
1
0.2
0
0.3
4
0.5
2
1.0
5
0.6
5
0.5
2
0.7
7
1.5
7
3.0
0
1.6
1
2.3
0
1.9
5
HP
-µD
SC
29
1.9
3
29
5.9
3
29
8.7
3
30
1.0
4
29
2.6
6
29
6.3
4
29
8.9
3
30
1.3
4
29
3.2
4
29
8.7
4
30
0.1
6
30
3.0
5
30
4.4
5
T O
NS
ET
– P
EA
K 2 (
K) A
D
Multifla
sh
0.4
3
0.7
1
0.7
7
0.7
9
0.7
9
1.3
1
1.4
0
1.6
9
0.7
1
0.1
5
1.4
4
0.1
0
0.5
9
AD
C
SM
Gem
0.3
7
0.5
0
0.3
9
0.2
1
0.7
4
1.1
1
1.0
2
1.1
0
0.6
5
0.3
6
1.0
6
0.4
7
0.1
6
HP
-µD
SC
29
1.3
5
29
5.2
2
29
7.9
9
30
0.3
1
29
0.8
7
29
4.5
8
29
7.3
8
29
9.4
7
29
1.0
2
29
6.1
0
29
7.4
9
30
1.2
2
30
2.6
6
T O
NS
ET
– P
EA
K 1 (
K) A
D
Multifla
sh
1.9
3
1.9
3
2.6
2
3.2
8
1.2
7
1.6
5
1.8
2
2.4
1
-
0.8
5
2.1
5
- -
AD
C
SM
Gem
1.8
7
1.7
2
2.2
4
2.7
0
1.2
2
1.4
5
1.4
4
1.8
2
-
0.6
4
1.7
7
- -
HP
-µD
SC
28
9.8
5
29
4.0
0
29
6.1
4
29
7.8
2
29
0.3
9
29
4.2
4
29
6.9
6
29
8.7
5
-
29
5.1
0
29
6.7
8
- -
T M
ultifla
sh
(K)
29
1.7
8
29
5.9
3
29
8.7
6
30
1.1
0
29
1.6
6
29
5.8
9
29
8.7
8
30
1.1
6
29
1.7
3
29
5.9
5
29
8.9
3
30
1.3
2
30
3.2
5
T C
SM
Gem
(K)
29
1.7
2
29
5.7
2
29
8.3
8
30
0.5
2
29
1.6
1
29
5.6
9
29
8.4
1
30
0.5
7
29
1.6
7
29
5.7
4
29
8.5
5
30
0.7
5
30
2.5
0
P O
nset
(MP
a)
20
.2
40
.1
60
.1
80
.2
19
.8
39
.7
59
.9
80
.5
19
.8
39
.5
59
.8
80
.2
10
0.2
CH
4 (
g)
(mol%
)
55
.5
55
.7
57
.6
H2O
(liq
) (m
g)
3.0
11
.7
39
.8
172
amounts of water (3 and 11.7 mg) may have implied a smaller interfacial area. In these
cases, a substantial fraction of hydrate rich in CO2 (indicated in Figure 5.17) may have
formed in the regions below the interface due to the higher disposal of CO2 than CH4
molecules dissolved in water. Therefore, low water content and high diffusivity of CO2
in water could explain the lower dissociation temperatures shown in Figures 5.16A and
5.16B.
Figure 5.16 – Dissociation data of CH4-CO2 dioxide hydrates obtained by HP-µDSC at different methane concentrations: (Δ) onset temperatures of peak 1; (▲) onset temperatures of peak 2; (●)
peak temperatures. Black lines refer to CSMGem predictions and Red lines, to Multiflash.
In fact, it can be distinguished at least two overlapped peaks in the wide
dissociation curves obtained, shown in Figure 5.17. The intersection of the
extrapolated baseline and the inflectional tangent at the most energetic peak
(correspondinfg to peak 2) provides a dissociation temperature closer to the prediction.
173
Figure 5.17 – Overlapping transitions in HP-µDSC thermograms, evidencing the heterogeneity of CH4-CO2 hydrate structures (3 mg H2O).
Figure 5.18 shows that the H2O sample size added in the cell is directly related
to the fractions of ice and hydrate formed during the cooling. As observed for methane
hydrates in section 4.3.2, samples containing different amounts of water (39 and 56.4
mg, in that case) presented changes in the kinetic and growth of both ice and hydrate.
Figure 5.18 – Influence of H2O sample size on the hydrate fraction: (▬) 3 mg H2O (▬) 11.7 mg H2O (▬) 39.8 mg H2O. The larger the H2O sample size, higher the hydrate homogeneity, slower the
crystals growth and hence lower the hydrate fraction.
In this system – methane, carbon dioxide, and water – the predominance of ice
or hydrate seems to depend on the size of the water sample. As discussed before, the
174
hydrate becomes more homogeneous as larger the water sample size. Therefore, it is
reasonable to suppose that the hydrate growth rate also changes according to the
sample size, i.e., a more homogeneous structure should form slower than a more
heterogeneous one. In other words, hydrate rich in CO2, favored by smaller samples,
may present higher growth rate than ice, and on the other hand, the opposite should
occur for hydrate rich in CH4, favored by larger samples. This could explain the
decrease of hydrate fraction in Figure 5.18.
5.6.2 Thermodynamic and Structural Analysis of CH4-CO2 Hydrates by
Simulations
Dissociation temperature profiles of CH4-CO2 hydrates are shown in Figure 5.19,
and the ternary diagrams at 20, 60 and 100 MPa are presented in Figure 5.20.
Figure 5.19 – Dissociation temperature profiles of CH4-CO2 hydrates according to the gas phase composition: (♦) onset temperatures of peak 2 from thermograms; (□) CSMGem predictions. Roman
numerals refer to the regions established according to the supposed configuration of cages occupation.
The experimental data are in relative accordance with the predictions, and the
discrepancies between onset temperatures should be related to the heterogeneity of the
hydrate structures. Moreover, the formation of real hydrates with higher CO2 fraction
than in the gas phase is reasonable, considering the higher diffusivity of these molecules
in water than methane. This also could explain the lower dissociation temperatures.
175
Figure 5.20 – Ternary diagrams of dissociation temperatures of CH4-CO2 hydrates.
176
Unlike previous systems, the CH4-CO2 hydrate dissociation temperature
continuously increases according to higher methane concentrations, except to the
slightly cooler temperatures at 20 MPa with 90 and 100 mol% CH4. Both methane and
carbon dioxide form structure I and can be hosted by any cavities of this structure,
unlike the first system in which ethane just fills properly in the largest cavity of sI.
Therefore, the dissociation temperature may not be significantly affected by the
presence of empty cavities, as in previous cases, but mainly by the proportion of guest
molecules trapped in the structure.
According to Table 5.1, CO2 molecules fit better on cavities of structure I than
CH4 molecules. However, the hydrate rich in CH4 is more stable because methane
molecules tend to withstand dissolution in the aqueous phase during dissociation,
considering that the CH4 has different chemical nature and it is less soluble in water
than CO2. It means that the second configuration illustrated in Figure 5.21, containing
higher methane content, should present higher dissociation temperature. It is worth to
mention that the difference in solubility between methane and carbon dioxide is higher
as the pressure increases and, thereby, the hydrate composition has a stronger effect
on dissociation temperature at higher pressures, as can be observed in Figure 5.19.
No more experimental data were obtained for this system due to technical issues.
Figure 5.21 – Evolution of the cages occupancy for sI hosting CH4 (blue) and CO2 molecules (purple) as methane fraction increases.
5.6.3 Methane-Ethane-Propane-Water System
The last system studied, only through simulations, was composed of methane-
ethane-propane-water. Ternary diagrams in Figure 5.22 point out that the most
thermodynamically stable regions are formed by hydrates rich in methane and propane
(sII).
177
Figure 5.22 – Ternary diagrams of dissociation temperatures of CH4-C2H6-C3H8 hydrates.
178
In order to verify the effect of ethane-propane ratio, T(P,x) diagrams are shown
at three different methane fractions in Figure 5.23. The concentrations used in the
figure below are indicated by A, B and C in the ternary diagrams shown in Figure 5.22.
The predictions indicate that both sI and sII coexist, depending on the gas composition.
The system tends to form structure I preferentially at high ethane contents (0% and
20% CH4), but structure II should also be formed due to the presence of propane,
considering again that these molecules just fit on large cavities of sII. Structure I, in
turn, requires higher temperatures to dissociate, and it is probably occupied by both
methane and ethane.
Figure 5.23 – Dissociation temperature profiles of CH4-C2H6-C3H8 hydrates according to the ethane-propane ratio. Each plot presents a constant fraction of methane.
179
In all cases addressed by now, one can note higher dissociation temperatures as
the pressure increases, as expected. Nevertheless, the opposite effect is observed for
structure II in Figure 5.22A, in which the methane concentration is null. The same
reverse phenomenon happens to the single propane hydrate, as shown in Figure 5.24.
Figure 5.24 – Equilibrium lines for CH4, C2H6 and C3H8 single hydrates.
Unlike single methane and ethane hydrates, dissociation temperature of propane
hydrate starts to decrease after 17 MPa as the pressure increases. This may be
because most of the small cavities of sII should be empty in single propane and
propane-ethane hydrates, since ethane and propane molecules fit preferentially in
large cavities of this structure (ƟsII-SC > 1). Although the hydrate stability is known to
be higher according to increasing the pressure, the opposite effect is observed when
small cavities are empty likely because they are tightened by large cavities occupied
by propane or ethane/propane molecules. This could lead to a structural deformation
according to the pressure, as illustrated by red cages in Figure 5.25, and hence a less
stable configuration is obtained. Another reason is that the compressibility factor (ĸ𝑇)
may overcome the effect of the thermal expansivity coefficient (𝛽) on the lattice
parameter, decreasing the hydrate volume and the filling of the large cavities by
ethane/propane molecules. Thus, low cages occupancy can also lead to higher
hydration numbers and lower dissociation temperatures.
180
Figure 5.25 – Structural deformation of small cavities from sII due to the absence of methane molecules. Green balls represent propane molecules.
Finally, a second opposite behavior can be observed between sI and sII for all
cases of Figure 5.23: the dissociation temperature increases for sI and decreases for
sII as ethane concentration increases. It is because sII becomes less stable when large
cavities are occupied by ethane instead of propane, as illustrated in Figure 5.26. Once
ethane molecules are smaller, the intermolecular interactions become weaker. This
does not happen with structure I because it becomes more stable as the large cavities
are occupied by the ethane molecules. Although Figure 5.27 only represents empty or
ethane-occupied large cages, some of them could be filled by methane molecules as
well.
Figure 5.26 – Evolution of the cages occupancy for sII hosting CH4 (blue), C2H6 (yellow) and C3H8 molecules (green) as ethane fraction increases.
Figure 5.27 – Evolution of the cages occupancy for sI hosting CH4 (blue) and C2H6 molecules (yellow) as ethane fraction increases.
181
5.7 CONCLUSIONS
This chapter presents new dissociation data for double-guest gas hydrates
obtained by HP-µDSC. In general, the experimental onset temperatures of dissociation
curves from thermograms usually show a good agreement to predictions, especially
from CSMGem. However, they deviated noticeably in some cases indicating the
formation of a heterogeneous hydrate phase. It is suggested that dynamic effects
significantly influence the filling of cages in the cases of systems containing a gas
mixture. Differences in solubility and diffusivity in water between gas species are
factors that likely imply gradients of gas concentrations through the solid phase so that
the hydrate phase should consist of different occupancy degrees. Ternary diagrams
and temperature profiles based on computational predictions were also built to
elucidate the influence of gas composition on the type of structure (s) formed and on
the cavities occupancy.
• Two approaches were used in this work to explain the preferential type of
structure in different gas mixtures and the dissociation temperature profiles
according to the gas phase composition: i) the influence of the ratio between
guest molecules size and cages diameter on the hydrate stability; ii) the cages
occupancy degree, including the existence of empty cavities throughout the
hydrate lattice. These factors play a role in the hydrate thermodynamic properties
and should contribute to structural transitions. The dissociation temperature, for
example, is said to be affected according to the stability provided by these factors;
• Equilibrium data obtained by predictions for methane-ethane hydrates revealed
the coexistence of two different structures at methane concentrations higher than
50 mol%. Although thermograms did not evidence a distinct curve regarding the
secondary structure, some overlapped transitions were observed during the
hydrate dissociation, supporting the probable coexistence of sI and sII with similar
dissociation temperatures. It is believed that a secondary structure (sII) is also
formed as a metastable phase at low methane concentrations. The onset
temperatures presented lower absolute deviations with respect to CSMGem
predictions than peak and endset temperatures;
• Experiments for methane-propane systems showed evidence of two structures,
sI and sII, at high methane contents. The first dissociates at lower temperatures
182
and is likely occupied only by methane molecules, since the dissociation
temperatures approach to that of methane hydrates (sI). The other structure, sII,
is the only predicted by computational simulations through all the methane-
propane composition range. According to predictions, the most stable
configuration occurs close to 67 mol% CH4, and either lower or higher
concentrations lead to lower dissociation temperatures.
• Methane-carbon dioxide hydrates were experimentally studied at similar gas
phase compositions and varying the H2O sample size. In cases of a small amount
of water added into the cell, the onset temperatures deviate significantly from
predictions. It is believed that low content of water do not favor the interfacial area
between gas molecules and the aqueous phase. In addition, the high solubility
and diffusion coefficient of CO2 in water could also imply hydrate fractions rich in
CO2. These factors should contribute to a more heterogeneous phase and
explain the lower dissociation temperatures, mainly for smaller H2O samples.
Unlike single guest systems, therefore, the amount of water in ‘static’ systems
(no mixing) containing gas mixtures could have a moderate effect on the hydrate
equilibrium due to different chemical properties in water of the gas species
involved.
• Although carbon dioxide molecules fit better in cavities of sI, the increase of
methane fraction provides more stable structures according to predictions. It
could be explained by the hardest dissolution of methane molecules into aqueous
phase during hydrate dissociation due to the low solubility of methane in water.
• A quaternary system composed of methane-ethane-propane-water was studied
by computational simulations. For hydrates in absence of methane (single
propane or ethane/propane hydrates), structure II likely presents a structural
deformation since most of the small cavities are empty. In addition, the increase
in the pressure may reduce the hydrate volume if the compressibility factor
overcomes the thermal expansivity, leading to a lower occupancy degree. These
factors are believed to decrease the hydrate stability and the dissociation
temperature as the pressure increases. Structure II also seems to be less stable
when ethane content increases and propane decreases, probably because
molecular interactions between ethane and the lattice are weaker.
183
• In general, CSMGem showed a better approach to experimental results, except
for methane-propane hydrates. As, observed for singles hydrates, Multiflash
predictions become distant from CSMGem as pressure increases, especially for
methane-ethane hydrates with low methane fractions.
REFERENCES
ALADKO, E. Y.; DYADIN, Y. A.; MANAKOV, A. Y.; ZHURKO, F. V.; LARIONOV, E. G. Phase diagrams of the ternary gas hydrate forming systems at high pressures. Part 1. Propane–Methane–Water System. Journal of Supramolecular Chemistry, v. 2, p. 369–376, 2002. HACHIKUBO, A.; NAKAGAWA, R.; KUBOTA, D.; SAGAKAMI, H.; TAKAHASHI, N.; SHOJI, H. Dissociation heat of mixed-gas hydrate composed of methane and ethane. Proceedings of the 6th International Conference n Gas Hydrates (ICGH 2008), Vancouver, British Columbia, Canada July 6-10, 2008. KLAPPROTH, A.; PILTZ, R.O.; KENNEDY, S.J.; KOZIELSKI, K.A. Kinetics of sII and Mixed sI/sII, Gas Hydrate Growth for a Methane/Propane Mixture Using Neutron Diffraction. The Journal of Physical Chemistry C, v. 123 (5), p. 2703-2715, 2019. LARIONOV, E.G.; DYADIN, YU.A.; ZHURKO, F.V.; MANAKOV., A.YU. Phase Diagrams of the Ternary Gas Hydrate Forming Systems at High Pressures. Part II. Ethane–Methane–Water System. Journal of Inclusion Phenomena and Macrocyclic Chemistry, v. 56, p. 303–308, 2006. MENEZES, D.E.S.; SUM, A. K.; DESMEDT, A.; PESSOA FILHO, P. A.; ROBUSTILLO, M. D. Coexistence of sI and sII in methane-propane hydrate former systems at high pressures. Chemical Engineering Science, v. 208, article 115149, 2019. NIXDORF, J.; OELLRICH, L.R. Experimental determination of hydrate equilibrium conditions for pure gases, binary and ternary mixtures and natural gases. Fluid Phase Equilibria, v. 139 (1), p. 325-333, 1997. OELKERS, E.H. Calculation of diffusion coefficients for aqueous organic species at temperatures from 0 to 350°C. Geochimica et Cosmochimica Acta, v. 55, p. 3515-3529, 1991. OHNO, H.; STROBEL, T.A.; DEC, S.F.; SLOAN, E.D.; KOH, C.A. Raman Studies of Methane−Ethane Hydrate Metastability, The Journal of Physical Chemistry A, v. 113 (9), p. 1711–1716, 2009. POKHAREL, S.; ARYAL, N.; NIRAULA, B.R.; SUBEDI, A.; ADHIKARI, N.P. Transport properties of methane, ethane, propane, and n-butane in water. Journal of Physics Communications, v. 2, 065003, 2018.
184
SCHARLIN, P.; BATTINO, R.; SILLA, E.; TUÑÓN, I.; PASCUAL-AHUIRC, J.L. Solubility of gases in water: Correlation between solubility and the number of water molecules in the first solvation shell. Pure and Applied Chemistry, v. 70, p. 1895-1904, 1998. SLOAN E.D.; KOH, C. Clathrate hydrates of natural gases, 3rd ed. Boca Raton: CRC Press, 2008. SUBRAMANIAN, S.; BALLARD, A.L.; KINI, R.A.; DEC, S.F; SLOAN, E.D. Structural transitions in methane+ethane gas hydrates — Part I: upper transition point and applications. Chemical Engineering Science, v. 55, p. 5763-5771, 2000. TAMIMI, A.; RINKER, E.B.; SANDALL, O.C. Diffusion Coefficients for Hydrogen Sulfide, Carbon Dioxide, and Nitrous Oxide in Water over the Temperature Range 293-368 K. Journal of Chemical Engineering Data, v. 39, p. 330-332, 1994. UCHIDA, T.; MOORIWAKI, M.; TAKEYA, S.; IKEDA, I.Y.; OHMURA, R.; NAGAO, J.; MINAGAWA, H.; EBINUMA, T.; NARITA, H.; GOHARA, K.; MAE, S. Two-step formation of methane-propane mixed gas hydrates in a batched-type reactor. American Institute of Chemical Engineers, v. 50, p. 518-523, 2004.
185
CHAPTER 6
GAS HYDRATES STUDIES BY ISOCHORIC METHOD IN A PVT CELL
ABSTRACT
Hydrate-forming systems composed of methane-water and methane-propane-
water are studied in this chapter through isochoric measurements using a PVT cell.
The experiments were reproduced by HP-µDSC at constant pressure in order to
compare both techniques. New equilibrium data at high-pressure conditions (up to
100MPa) were obtained considering the experimental features and limitations of both
methods. Results reveal evidence of the simultaneous formation of structures I and II
for systems containing CH4 and C3H8, although only sII was expected at such
conditions at equilibrium. Although most of sI is formed as a metastable structure, a
small fraction of it seems to provide a more stable system, mainly in conditions of
excess methane. The effects of heating rate, mixing, multiple cycles and initial gas
phase composition on the hydrates formation were evaluated by both experimental
methods. These factors affect the kinetics of formation, the type and the proportion of
each hydrate structure and hence the thermodynamic profile during dissociation.
6.1 INTRODUCTION
Apart from microcalorimetry, the isochoric method applied on PVT cells is a usual
method to study hydrate phase equilibria (CHA, et al., 2016; DALMAZZONE et al.,
2002; HU et al. 2017a,b; MASOUDI et al., 2004; MOHAMMADI et al., 2005;
MOHHAMAD-TAHERI et al., 2013; WARD et al., 2015). Both microcalorimetry and the
isochoric method in the PVT cell feature advantages and drawbacks. The latter
configuration allows bulk phases mixing, resulting in faster equilibration and more
homogeneous sampling. The hydrate growth inside the high-pressure cells of the
microcalorimeter is limited by mass transfer, since the hydrate is formed in the
interfacial area between the gas and liquid phases. Nevertheless, microcalorimetry is
relevant not only for determining equilibrium points but also for different
thermodynamic properties of hydrates such as enthalpy and heat capacity (GUPTA et
al., 2008; KANG et al., 2001; ZHANG et al., 2004). This method has other advantages
such as shorter analysis time, simpler experimental procedures, and smaller samples.
186
In addition, the apparatus is allowed to operate in the isochoric or the isobaric modes,
unlike most of PVT cells, in which the hydrate formation and dissociation are detected
from pressure changes. This chapter presents analogous studies on the formation and
dissociation of methane and methane-propane hydrates performed by both methods.
The formation and dissociation of methane-propane hydrates are particularly
approached in this chapter, since the coexistence of sI and sII structures was observed
by both microcalorimetry and PVT-isochoric method for such hydrates. In fact,
metastable states may occur under specific thermodynamic conditions in various gas
hydrates such as carbon monoxide (PETUYA et al., 2017; ZHU et al., 2014), nitrogen
(PETUYA et al., 2018a,b), or methane-based hydrates (ALADKO et al., 2002;
KLAPPROTH et al., 2019; KUMAR et al., 2008; SHIN et al., 2012). Shin et al. (2012)
confirmed the formation of a metastable structure (sII) during methane-
hexamethyleneimine hydrate formation. The group assessed the kinetic and
thermodynamic competition and phase transition during the process of hydrate growth,
indicating that all sI, sII and sH coexist in this case. For systems composed by
methane, propane and water, a simultaneous formation of hydrate types sI (methane
hydrate) and sII (methane-propane hydrate) has been observed. Klapproth et al.
(2019) studied the kinetics of hydrate formation for methane-propane mixtures through
neutron diffraction. They reported the coexistence of both structures I and II and
affirmed that the kinetic of sI can be faster even when the driving force for sII is higher.
Aladko et al. (2002) also reported data evidencing single methane hydrate coexisting
with double methane-propane hydrate above 75 mol% CH4 at 100, 300 and 800 MPa.
Even though thermodynamic models should be able to calculate metastable
equilibrium states, commercial packages usually search the global minimum of the
Gibbs energy and do not predict these states. Thus, the study of the coexistence of sI
and sII in methane-propane hydrates is important as it likely occurs in real conditions,
such as in hydrate reservoirs and hydrocarbon flowlines.
In short, this chapter includes the results previously reported by Menezes et al.
(2019) and presents new equilibrium data for CH4 and CH4-C3H8 hydrates based on
microcalorimetry at constant pressure mode and the isochoric method in a PVT cell.
Evidence of sI and sII formation in methane-propane-water systems is also discussed.
Moreover, the solid phase in a hydrate forming system may present different properties
depending on the experimental protocol (SLOAN et al., 2010). In fact, the results
obtained from microcalorimetry at constant pressure mode and by performing isochoric
187
measurements in a PVT cell are not strictly identical, which evidences the influence of
the methodology on the hydrate formation, especially concerning the mixing. Thus,
some relevant experimental factors that affect hydrate structural properties are
discussed. These factors should be considered when comparing literature data or
planning experimental procedures.
6.2 SPECIFIC EXPERIMENTAL CONDITIONS
Microcalorimetry: The experimental configuration based on HP-µDSC is
described in section 2.1 and the procedures applied in this chapter vary according to
the topic concerned (standard or multicycles methods). In each of the experiments
presented below, about 30 mg of Milli-Q water was placed in the sample cell so that
the bottom surface was totally covered. Then the sample was pressurized with either
pure gas (methane or propane, both 99.5 mol%) or a mixture, while the reference cell
was kept empty. As previously mentioned, two operational modes can be used:
isobaric and isochoric. In the experiments presented in this chapter, the isobaric mode
was chosen for comparison with PVT results, as will be explained in section 6.4.1.
PVT- Isochoric method: The setup used for isochoric analysis by using a PVT
cell was made available by the Phases to Flow Laboratory at the Colorado School of
Mines (USA) and it is described in detail in section 2.3 of this work. Methane (99.99%
purity, General Air), propane (98% purity, General Air) and a commercial mixture of
92:8 mol% methane and propane (99% purity, General Air) were used to form double-
guest hydrates. Other two mixtures of methane-propane (85:15 and 95:5 mol%) were
prepared in the lab by gravimetry using a balance shown in figure 2.12.
Modeling: Equilibrium phase data were obtained through calculations by using
the software CSMGem code Version 1.10, which implements the van der Waals and
Platteeuw model with the SRK equation of state.
6.3 METHANE HYDRATE
6.3.1 Equilibrium Data for CH4 Hydrates: PVT-Isochoric Method vs Microcalorimetry
Figure 6.1 shows experimental points for methane hydrate dissociation obtained
by the PVT-isochoric method and in the microcalorimeter at constant pressure.
188
Although the experiments were not performed at exactly the same pressure, it is
possible to verify by extrapolation that the PVT measurements coincide with the onset
values obtained by HP-µDSC.
Figure 6.1 – Dissociation data of CH4 hydrates by PVT-isochoric method and microcalorimetry: (■) PVT-isochoric search; (▲) onset points, (●) peak points, and (♦) endset points by HP-uDSC; black line
corresponds to the predictions from CSMGem.
The equilibrium point determined from the PVT-isochoric method represents the
complete dissociation of the solid phase (hydrate crystals). In this way, one could
expect similar values for PVT measurements and endset points obtained by HP-μDSC,
since both represent the ending of the dissociation process. However, as mentioned
before, the pressure changes along the experiments performed through the PVT-
isochoric method, whereas it is constant along the microcalorimetric measurements.
Hence, the quality, size, shape and structure of formed crystals vary accordingly to the
changes in the thermodynamic conditions of the system. Thereby, the last crystal
dissolved during the PVT- isochoric method is considered to be equivalent to the first
crystal dissolved through HP-μDSC method, since it is subjected to the same pressure
and supposed to present similar properties.
Table 6.1 shows the numeric values for the dissociation data plotted in the figure
above. Each point was obtained in a distinct experiment and both PVT-isochoric data
and onset points present good agreement with the prediction.
189
Slightly lower temperatures are observed for such experimental data likely due to
the presence of empty cavities in real hydrate structures, leading to less stable
configuration with lower dissociation temperatures. The onset temperature is expected
to present more accurate results than peak and endset temperatures for the same
reasons mentioned in section 4.3.1.
Table 6.1 – Dissociation data of CH4 hydrates by HP-µDSC at constant pressure and the PVT-isochoric method. AD corresponds to the average absolute deviation.
HP-µDSC UHP system
(PVT-Isochoric method)
P (MPa) CSMGem (K) T ONSET (K) T PEAK (K) T ENDSET (K) P (MPa) CSMGem (K)
T (K)
(AD) (AD) (AD) (AD)
59.4 300.60 300.10 301.25 303.00 64.26 301.30
300.45 (0.5) (0.65) (2.4) (0.85)
62.1 300.99 300.62 301.68 303.28 64.15 301.29
300.95 (0.02) (1.08) (2.68) (0.35)
65.7 301.50 301.16 302.12 303.76 63.95 301.26
300.75
(0.56) (1.52) (3.16) (0.55)
6.3.1.1 Effect of the Cooling Degree
Three runs were carried out in the PVT cell using the same sample in order to
verify possible effects of applying different cooling degrees (CD) – the difference
between the dissociation temperature and the minimum temperature reached during
the cooling process. The analyses are shown in Figure 6.2 and a very good
reproducibility is observed through this method. Higher cooling degrees seem to
slightly increase the equilibrium pressure. Although this change is not very significant,
higher cooling degrees increase the driving force of the hydrate formation and this may
favor the gas molecules filling the cavities, reducing the empty cages on the lattice and
thus approaching the hydrate equilibrium point to the one predicted by modeling.
Moreover, the cooling does affect the amount of the solid phase, as one can see
by checking the pressure drop during the cooling, since the residence time of the
sample in the hydrate zone is longer.
Finally, it is noted that the crystallization temperatures are similar for all three
experiments, although it is a stochastic phenomenon.
190
Figure 6.2 – Effect of cooling degree (CD) on the equilibrium point and the amount of methane hydrate formed.
6.3.1.2 Effect of Mixing
The influence of mixing the system is a substantial factor considered in this work.
Considering there is no mixing inside the high-pressure cell coupled to the
microcalorimeter, it is important to gather evidence about how much the equilibrium
point may be affected by stirring. Figure 6.3 shows two PVT-isochoric experiments
performed in the presence and absence of mixing. The equilibrium points given by
these analyses were: 300.95K and 64.15 MPa for the first case, without mixing, and
300.75K and 63.95 MPa with magnetic stirring inside the PVT cell. The difference
seems to be not relevant since both temperature and pressure decreased slightly by
mixing the system. The experimental observation throughout the analyses shows that
mixing the system leads to a decrease in pressure, probably due to the higher transfer
of gas molecules to the liquid phase. So, the decrease in dissociation temperature may
be a result of the lower pressure in the system and not because mixing would lead to
a hydrate with different properties. In contrast, the crystallization temperature is
significantly different in absence or presence of stirring. Mixing the bulk contributes to
191
the crystallization process as it favors the gas dissolution in the aqueous phase and
increases the number of molecular collisions and their energy intensity, facilitating the
overcoming of the activation energy barrier required for the hydrate formation.
Figure 6.3 – Effect of mixing on the single methane hydrate-forming system.
Even though the effect of mixing could be negligible in a single gas system, the
phenomenon still needs to be studied by checking the structure of the hydrate formed.
Such study becomes more relevant when a gas mixture is applied. It is possible to
obtain different hydrate compositions by working at different dynamic conditions. Thus,
the equilibrium point may be affected in such cases, as indicated in Chapter 5.
6.4 METHANE-PROPANE HYDRATE
6.4.1 Equilibrium Data for CH4-C3H8 Hydrates: PVT - Isochoric Method vs
Microcalorimetry
New equilibrium data for methane-propane hydrates were obtained by both
microcalorimetry (at constant pressure) and isochoric search in a PVT cell. The hydrate
equilibrium conditions in the PVT-isochoric method change throughout the experiment,
as mentioned before. Consequently, it is not possible to accurately predict the pressure
at which the hydrate dissociation will end. For this reason, the calorimetric analyses in
this case were subsequently performed at the same equilibrium pressures obtained by
the PVT-isochoric method, in order to compare similar data from both methods. On the
other hand, the use of the isochoric method in the HP-µDSC also implies a pressure
variation (although much smaller than in PVT cell) due to the thermodynamic issue
192
(temperature ramping) and the hydrate formation/dissociation. In this case, the
equilibrium pressure from the onset point does not exactly match the PVT
measurements. Thus, the use of isobaric mode in HP-µDSC was preferred to perform
the experiments described in this section, as it allows one to fix a specific pressure and
compare results with the thermodynamic properties obtained by the PVT method. It
worth mentioning herein that the experiments carried out throughout the work showed
that the variation of the gas phase composition in the isobaric method is not relevant
to change the hydrate equilibrium as initially thought, considering the low amount of
hydrate formed.
Figure 6.4 presents the experimental data obtained from PVT measurements and
microcalorimetric method, and the predictions from CSMGem modeling.
Figure 6.4 – Dissociation data of CH4-C3H8 hydrates (92 mol% CH4) by the PVT-isochoric method and microcalorimetry: (■) isochoric search; (▲) onset points, (●) peak points and (♦) endset points by HP-
uDSC; black line corresponds to the prediction from CSMGem (92 mol% CH4).
Source: Menezes et al. (2019)
As observed in the results previously discussed for methane hydrates, the
isochoric data again approach to the onset values, as observed in Chapter 4 and
section 5.3.1. The figure above also shows the effect of pressure on hydrate
dissociation temperature and indicates that predictions deviate more significantly from
experimental data at higher pressures. Isochoric data obtained in this study are shown
in Figure 6.5 along with data from the literature with approximate compositions. The
193
results obtained in this study at 92 mol% CH4 follow the trend of the curves obtained
by the data published in the literature.
Figure 6.5 – Equilibrium data obtained by the PVT-isochoric method at different compositions: ( ) 96.5 mol% CH4 (MCLEOD; CAMPBELL,1961); ( ) 94.5 mol% CH4 (MCLEOD; CAMPBELL,1961); (■)
92 mol% CH4 (this work,); black line corresponds to the prediction from CSMGem (92 mol% CH4).
Source: Menezes et al. (2019)
Tables 6.2 and 6.3 show the dissociation data obtained by microcalorimetry and
PVT-isochoric method, respectively. The PVT measurements also indicate the
dissociation of two different structures concerned to a single methane hydrate and a
double methane-propane hydrate, as will be discussed in detail in the next section
(6.4.2). Although Table 6.2 shows good agreement for prediction and onset values of
sI, a higher discrepancy is observed for some onset values of sII, in agreement to the
results previously presented in section 5.5.2. The onset determination for structure II
can be more difficult when occurs a small exothermic peak right before the dissociation
curve, likely related to a rearrangement in the crystalline structure or a recrystallization
process, as indicated in Figure 6.6. On the other hand, Table 6.3 also indicates higher
deviation of equilibrium data obtained through the PVT-isochoric method as the
pressure increases. Although the amount of empty cavities in real hydrates may also
lead to lower dissociation temperatures, such deviations should also be related to the
effect of sI formation on the gas phase composition change.
194
Table 6.2 – Dissociation data of CH4-C3H8 hydrates obtained by HP-µDSC. AD corresponds to the average absolute deviation from prediction (CSMGem).
CH4 (mol%)
P (MPa)
Temperature (K) – sI (CH4) Temperature (K) – sII (CH4 + C3H8)
CSMGem Onset Peak Endset
CSMGem Onset Peak Endset
(AD) (AD) (AD) (AD) (AD) (AD)
92
13.6 288.55 288.39 289.14 290.36
297.22
295.75 297.61 300.16
(0.16) (0.59) (1.81) (1.47) (0.39) (2.94)
39.3 297.05 296.94 297.55 298.60
303.14
302.65 304.05 305.33
(0.11) (0.50) (1.55) (0.49) (0.91) (2.19)
67.7 301.75 301.10 301.64 302.66
307.71 306.37 307.42 309.91
(0.65) (0.11) (0.91) (1.34) (0.29) (2.20)
Source: Adapted from Menezes et al. (2019)
Table 6.3 – Dissociation data of CH4-C3H8 hydrates obtained by the PVT-isochoric method. AD corresponds to the average absolute deviation from prediction (CSMGem).
CH4 (mol%) P (MPa) CSMGem (K) T (K) AD
92
13.6 297.29 296.85 0.44
39.3 303.18 302.35 0.83
67.7 307.71 306.55 1.16
100.5 312.045 310.45 1.6
Source: Adapted from Menezes et al. (2019)
Figure 6.6 – Phenomenon of recrystallization just before the dissociation of sII in the CH4-C3H8 system at 67.7 MPa (92 mol% CH4).
Source: Menezes et al. (2019)
6.4.2 Coexistence of Structures I and II on CH4-C3H8 Hydrates Obtained by the
PVT-Isochoric Method
A pressure-temperature plot obtained through the PVT-isochoric method is
shown in Figure 6.7. It reveals the formation of both structures I and II at higher
195
pressures, in agreement with the results by HP-µDSC previously shown in Chapter 5,
section 5.1. One can clearly identify two regions in which the increase in pressure is
accentuated. This occurs due to the release of gas from different hydrate phases
leading to an increase of pressure caused by gas phase compression. Moreover, the
first slope indicated in the figure takes place much earlier than sII equilibrium line
predicted by CSMGem, indicated by the black solid line. In fact, it appears just before
methane hydrate equilibrium (grey solid line), indicating that the first slope concerns to
structure I dissociation, formed along with sII during cooling. This phenomenon is
discussed below by considering different factors that may influence the formation of
structures I and II.
Figure 6.7 – Diagram P vs T for the system CH4-C3H8-H2O (92 mol% CH4) by the PVT-isochoric method: black and gray solid lines correspond to the predicted results through CSMGem for sII and sI,
respectively. Dashed lines refer to the slopes related to the dissociation of such structures.
Source: Adapted from Menezes et al. (2019)
6.4.3 Impact of Experimental Factors on the Formation of sI and sII
6.4.3.1 Effect of Heating Rate
A set of experiments at different heating rates was performed to verify the effect
of heating rate in the methane + propane hydrate thermodynamic profile. Figure 6.8
shows PVT-isochoric diagrams at four different heating rates at 15 MPa. Even during
the heating, the hydrate formation still may occur before the system reaches the
equilibrium line. If the heating rate is low, the pressure drop effect caused by hydrate
196
formation prevails over the pressure rise effect caused by temperature ramping. In this
case, a profile similar to that observed in Figure 6.8A is obtained, where the pressure
initially falls during heating due to the high rate of hydrate formation. On the other hand,
if the heating rate is so fast, the slopes are not sufficiently separated from each other,
as in Figure 6.8D. Therefore, better-defined profile was obtained at 5 K per hour (Figure
6.8C), since two slopes referring sI and sII can be clearly distinguished, indicating that
each structure dissociates close to their respective equilibrium lines.
Figure 6.8 – Dissociation profiles for CH4-C3H8 hydrate-forming systems (92 mol% CH4) at different heating rates by the PVT-isochoric method. Black and gray solid lines correspond to the predicted results through CSMGem for sII and sI structures, respectively. Dashed lines refer to the slopes
related to the dissociation of such structures.
Source: Adapted from Menezes et al. (2019)
Although the PVT-isochoric method allows observing both dissociation stages,
this is not appropriate to estimate the proportion between structures I and II. In fact,
the microcalorimetric method is more appropriate for estimating the fractions of sI and
sII. In this case, the pressure is kept constant and thereby the hydrate equilibrium does
not move as in the PVT-isochoric method, making it possible the integration of area for
197
each dissociation curve separately. Figure 6.9 presents thermograms at two cooling-
heating rates.
Figure 6.9 – Thermograms of CH4-C3H8 hydrates (92.1 mol% CH4, 67 MPa) at different heating rates.
Source: Menezes et al. (2019)
The area for the first curve (sI) does not seem to be affected by the heating rate.
On the other hand, the fraction of structure II is higher at lower heating rates (0.92 at
0.5 K·min-1, and 0.78 at 1 K·min-1). The residence time in the hydrate zone is higher at
0.5 K·min-1 and hence more ice is converted to the preferential hydrate structure during
the experiment.
6.4.3.2 Effect of Mixing
Heterogeneous hydrate structures can be obtained by working at static
conditions, especially when gas mixtures are involved. Hence, the dissociation point
may also be affected, as previously mentioned in the section 6.3.1.2. Figure 6.10
shows diagrams obtained via the PVT-isochoric method to verify the mixing effect.
Although stepwise stages were not applied in these runs, the dissociation points for sII
taken in these plots are 308.25 K and 68.27 MPa with no mixing and 307.15 K and
68.12 MPa with mixing. These data are very similar, and the lower values obtained for
the experiment with mixing are mainly related to the higher gas dissolution in the liquid
phase, which leads to lower pressure and hence a lower dissociation temperature.
198
Figure 6.10 – Effect of stirring on the dissociation profiles of CH4-C3H8 hydrates (92 mol% CH4) by the PVT-isochoric method, initially at 70 MPa. Black and gray lines correspond to the predicted results
through CSMGem for sII and sI structures, respectively.
Source: Menezes et al. (2019)
Although no definitive conclusion can be drawn about the effect of the dynamic
condition inside the cell on hydrate structures, two observations should be highlighted:
the amount of hydrate formed is very small in the experiment performed without stirring
and the formation of sI is not even observed, whereas a large amount of sI seems to
have been formed in the presence of stirring. These phenomena are related to mass
transfer issues, considering that no mixing implies in lower availability of gas molecules
in the proper sites for interactions with water in order to form the hydrate crystals. On
the other hand, the presence of mixing favors even the formation of the supposedly
metastable structure I. The mechanical stirring provides enough energy so that such
molecular interactions overcome the activation barrier, allowing the nucleation and
crystals growth. Even though sII is the thermodynamically stable structure for this
system, its kinetics of formation may be significantly slower than for sI, which may
explain the large amount of sI when mixing the system (KLAPPROTH et al., 2019).
The mixing effect was also studied at a higher pressure to favor the hydrate
formation so that the profiles could be easily compared. Figure 6.11 presents three
consecutive runs using the same sample, where only the second run was carried out
with mixing. The dissociation profiles obtained in the first and third runs are similar,
which suggests that the fractions of sI and sII are similar. The arrow indicates the
moment in which sII dissociation changes significantly the compression line. On the
other hand, the second run presents a different profile, which indicates a different
proportion between sI and sII. Structure I was favored in the presence of mixing since
a higher increase in pressure is observed right after the sI equilibrium line. This finding
199
agrees with the previous results regarding the addition of mechanical energy.
Nonetheless, the higher pressure, in this case, was enough to induce the formation of
a notable fraction of sI even in the absence of mixing. Better solubility and diffusivity of
methane into water than propane may have contributed to sI formation.
Figure 6.11 – Effect of stirring on the dissociation profile of CH4-C3H8 hydrate (92 mol% CH4) by the PVT-isochoric method, initially at 105 MPa. Black and gray lines correspond to the prediction from
CSMGem software for methane-propane (sII) and single methane (sI) hydrates, respectively.
Source: Adapted from Menezes et al. (2019)
6.4.3.3 Effect of Multicycles
The fact that the hydrate kinetics contributes to sI formation does not imply that
this structure is thermodynamically stable when coexisting with sII. Thereby, some
experiments were performed to verify possible changes in structural fractions by
subjecting the sample to multicycles. The conversion rate for synthetic hydrates
depends on experimental conditions, and the final product usually presents a small
fraction of free water or ice due to incomplete conversion. In the first method studied
through microcalorimetry, shown in Figure 6.12, the subsequent cycles were heated
up to 283.15 K in order to melt the ice repeatedly and increase its conversion to
hydrate, either sI or sII.
According to the integration of the dissociation areas in the figure below, 98.5%
of the ice initially formed in the first cycle was converted to hydrate after 22 cycles, and
the final hydrate was composed of 81.35% of sII. The percentage of sII obtained for
the single cycle run by using the same sample at the same pressure was 78.6%,
200
revealing that sII structure is indeed preferentially formed throughout the multiple
cycles. This indicates that although sI presents better kinetics of formation, part of it
should be converted to sII, the most thermodynamically stable structure.
Figure 6.12 – Effect of multicycles heated up to ice melting, on CH4-C3H8 system at 67.7 MPa (92.3 mol% CH4). Dotted and dashed lines refer to CSMGem predictions for methane and methane-propane
hydrates, respectively
The dissociation process in the single cycle presents a recrystallization peak,
similar to the one illustrated in Figure 6.6, and the sII dissociation curve after 22 cycles
reveals the presence of two overlapped peaks. As discussed throughout chapter 4, the
multicycles method may induce greater heterogeneity in the hydrate structure. This
phenomenon is believed to occur due to the limitations of mass transfer implied by the
hydrate layer formed in the early cycles, that may increase the amount of empty
cavities in deeper regions of aqueous phase. Considering that the system herein is
composed of CH4 and C3H8, the difference in diffusivity of these molecules through the
initial hydrate layer may further affect the heterogeneity of the final structure.
A second method was applied for studying these structures by applying
multicycles, presented in Figure 6.13. In this case, the system was heated up to a
temperature above the dissociation point for sI, but below that for sII, in order to check
whether sI continues to form even if sII is already present in the system. Due to
experimental issues, it was not possible to keep running cycles until the maximum
conversion of water. According to the thermograms presented in the figure below,
31.29% of the ice formed in the first run was converted to hydrate after 6 cycles, and
97.41% of the final hydrate was constituted of structure sII, which may indicate the
201
metastability of structure I. The first method resulted in a smaller amount of sII (81.35%)
even after 22 cycles because sI was not dissociated throughout the multiple cycles.
Figure 6.13 – Effect of multicycles heated up to sI dissociation on CH4-C3H8 system at 68 MPa (92.1 mol% CH4) by microcalorimetry. Dotted and dashed lines refer to CSMGem predictions for methane
and methane-propane hydrates, respectively.
Source: Adapted from Menezes et al. (2019)
Although the fraction of sII increases in subsequent cycles, it is possible to
observe that sI continues to be formed but surely not at the same proportion as sII. On
the one hand, the formation of sI may be due to mass transfer issues due to the
absence of mixing inside the cell, limiting the availability of propane molecules required
to form sII in deeper regions of the aqueous phase. On the other hand, the formation
of a small fraction of methane hydrate (sI) could lead to a more stable system, as
resumed below in this section, even though sII is the preferential structure.
One can also observe that Figure 6.13 (method II) presents a discrepancy
between onset temperatures (~1.2 K) for sII concerning single run and after multiple
cycles. Two factors should contribute to this phenomenon: i) greater heterogeneity
degree implied by the multicycles method, as mentioned above; ii) changes in gas
phase composition due to sI dissociation. With regards to the greater heterogeneity
caused by the multicycle method, one should note that although the onset
temperatures in single guest systems were slightly lower than the ones obtained by
the standard method, the difference between both methods were not as higher as in
this case. The difference in diffusivity of methane and propane through the hydrate
layer formed during earlier cycles also may contribute to a more heterogeneous final
202
structure. Therefore, it seems that the multicycle method in the absence of mixing may
affect more significantly the homogeneity and the thermodynamic properties of
hydrates formed in the presence of different guest species. On the other hand, the
second factor that may have affected the onset temperature after 6 cycles in Figure
6.13 is a possible change in gas composition, since the dissociation of sI during the
heating in method II increases the fraction of methane available to form hydrate in the
subsequent cycle. As explained in chapter 5.5.3, the increase in the methane fraction
(for methane-propane systems whose methane content is higher than 67 mol%) leads
to hydrates with lower dissociation temperatures as methane molecules occupy large
cavities of sII due to propane scarcity. Methane molecules do not fit into large cavities
as well as propane molecules and the interaction between guest molecules and the
water lattice is weaker in this case, favoring structure dissociation.
Table 6.4 shows the onset and peak temperatures for each experiment shown
above and the absolute deviation from prediction calculated by CSMGem.
Table 6.4 – Dissociation data for CH4-C3H8 hydrates obtained by single runs and after multiple cycles by HP-µDSC. AD corresponds to the average absolute deviation from prediction (CSMGem).
Method mol% CH4
P (MPa)
n° of cycles
sI (CH4)
Temperature (K)
sII (CH4 + C3H8) Temperature (K)
CSMGem
Onset Peak
CSMGem Onset Peak
(area%) (AD) (AD) (AD) (AD)
I a 92.3 67.7
Single
301.78
301.09 301.84
307.62
306.1 307.39 78.55 (0.69) (0.06)
(1.52) (0.23)
After 22
301.11 302.06 305.66 308.15 81.35 (0.67) (0.28)
(1.96) (0.53)
II b 92.1 68
Single
301.82
301.49 301.88
307.74
308.19 309.27 94.60
(0.33) (0.06)
(0.45) (1.53)
After 6
301.11 301.61 306.98 308.70
97.41 (0.71) (0.21) (0.76) (0.96)
Cycles before the last one: a Heating up to complete ice melting; b Heating up to complete sI dissociation.
In most cases, equilibrium points obtained after multiple cycles tend to present
lower dissociation temperatures and greater deviations from predictions than those
obtained in single runs, in agreement to the results found throughout chapter 4. It is
believed that the main reason for this is the absence of mixing and hence the limitation
of gas diffusion through the liquid phase as an initial hydrate layer is formed on the
gas-liquid interface, acting as a hindrance of mass transfer. The scarcity of gas
molecules in deeper regions of the sample may lead to an increase of empty cavities
203
during hydrate crystal growth over multiple cycles, thus affecting structural stability.
Such difference is more evident for sII when applying method II, for the reason
explained previously.
Better agreement between peak temperatures and predictions can also be noted
in most cases of Table 6.4.1. The presence of empty cavities in real hydrates and the
fact that sI formation is not evidenced by predictions could justify such deviation of
onset temperatures. Finally, it is worth to remember that the overlapping of dissociation
curves (sI and sII) and structural rearrangement make less accurate the determination
of the onset points for sII.
Figure 6.14 shows an experiment in the PVT cell similar to the second method of
multicycles performed by HP-µDSC. The first cycle was interrupted before the
equilibrium line regarding structure II, and then a new cycle was run.
Figure 6.14 – Effect of multicycles on the dissociation profile for CH4-C3H8 hydrate (92 mol% CH4) by the PVT-isochoric method. Black and gray lines correspond to the predicted results through CSMGem
for sII and sI, respectively.
Source: Adapted from Menezes et al. (2019)
The first cycle (red) presents hydrate formation during cooling (slight slope
change at 294.0 K) and at the isotherm at 292.85 K, as verified by the drop in pressure
over 6.8 h. A notable inflection point due to the a hydrate dissociation close to sI
equilibrium line is observed during heating. A new isotherm was carried out for 33 h
204
preceding the second cooling so that most of sI could be dissociated. In this period,
hydrate (sII) was still formed at a similar rate as in the first isotherm over the first 5
hours, then the formation was slowed down and the pressure remained almost
constant. This behavior indicates that there was still propane to induce the formation
of sII during the first cooling, but nevertheless, sI was formed simultaneously. During
the second cycle (green), one can verify hydrate formation in the last isotherm at
292.85 K by over 22.2 h at a slower rate. Even after such a long time kept at this
temperature, the pressure dropped about 1 MPa less than during the first cycle, which
lasted 6.8 h. This suggests that more gas was consumed during the first cycle probably
due to the high amount of sI formed along with sII, thereby reinforcing the faster kinetics
for sI formation. Indeed, the subsequent cycle presents a smaller slope change close
to sI equilibrium line, evidencing that the amount of sI formed was significantly lower
in this case. Although the kinetics of formation of sI is faster, sII is likely the most stable
structure for this system, as mentioned before, and it may be favored in the latter cycle
due to the presence of crystals formed in the previous one.
According to the results above obtained by both methods, sI does not totally
disappear from the systems. It is not ruled out that stable CH4-C3H8 systems at high
methane content present a small fraction of sI due to the better structural conformation
of methane molecules in both cages of sI than in large cages of sII. As shown in Table
5.1, methane molecules fit better in small cavities of sII (ratio of guest molecule
diameter to cavity diameter equal to 0.868), but the diameter ratio is substantially lower
for the large cage of sII (0.655) than for any cage of sI (0.855 and 0.744). It means that
a system containing a single structure II, hosting methane molecules in large cages
due to the shortage of propane, could be less stable than a system composed by both
sI and sII.
6.4.3.4 Effect of Gas phase composition
Gas composition plays an important role in the type of structures formed and their
proportion (NIXDORF; OELLRICH, 1997). The first experiment shown in Figure 6.15,
carried out by the PVT-isochoric method, presented the highest propane content (85
mol% of CH4). The plot suggests no sI was formed at this gas phase composition,
since hydrate dissociation appears 4 K far from sI equilibrium line predicted by the
model. This result differs from the previous one showed on the thermograms presented
205
in Figure 5.8 from chapter 5, in which sI is observed at 83.3 mol% CH4 at 20 MPa. This
is attributed to the higher subcooling applied on HP-µDSC, that favor sI formation by
increasing the driving force. The second plot in Figure 6.15 (92 mol% of CH4) shows
that dissociation started immediately before sI equilibrium line, evidencing the
presence of sI besides sII. The last experiment (95 mol% of CH4) resulted in a different
profile, in which the dissociation looks like a continuous process. This profile is
consistent with the fact that most of the hydrate formed in this case likely constitutes
structure sI.
Figure 6.15 – Effect of gas phase composition on dissociation profile of CH4-C3H8 hydrates. Black and gray lines correspond to the predicted results through CSMGem for sII and sI, respectively.
Source: Menezes et al. (2019)
Figure 6.16 shows three thermograms obtained by the calorimetric method using
gas phase compositions similar to the ones used in the PVT-isochoric method. Even
though these experiments were conducted with no mixing, sI is still observed for all the
three compositions, in agreement to that observed in Figure 5.8 (chapter 5). As
mentioned before, this is likely a result of the greater subcooling degree in those
experiments compared to PVT measurements: the system was cooled down further
from the equilibrium point in the calorimetric experiments. The thermograms also
206
indicate that the initial proportion between sI and sII changes significantly according to
the methane content in the gas phase. However, structure II seems to be favored by
increasing methane content in the calorimetric analysis, which apparently contradicts
the results obtained by the PVT-isochoric method. The ratios between the areas
corresponding to the dissociation curves (sII/sI) are 3.0 (85.3 mol% CH4), 16.1
(92.1mol% CH4) and 25.5 (95.0 mol% CH4). Hydrate formation depends on the
availability of molecules for hydrate crystal growth. Considering that, a higher
concentration of methane implies better gas dissolution on liquid phase, contributing
to the fulfillment of sII small cavities, which firstly form according to Schicks and Luzi-
Helbing (2013). Thereby, the kinetics of formation for sII is improved, even though part
of large cavities probably hosts methane instead of propane molecules. This may
explain the larger hydrate amount by increasing the methane content in the gas phase.
Recrystallization processes are observed right after ice melting and sI dissociation at
95 mol% CH4, confirming that hydrate formation is facilitated at such higher
composition.
Figure 6.16 – Effect of gas phase composition on CH4-C3H8 hydrate at 67.5 MPa by microcalorimetry.
Source: Menezes et al. (2019)
Structure I is poorly favored by increasing methane fraction in the gas phase in
this case: the higher methane dissolution in aqueous phase seems to favor sII but not
sI. The results obtained through the PVT-isochoric method are different due to the
presence of mixing, that contributes not just to the formation of sI, by improving
methane solubility and providing enough mechanical energy to form this secondary
207
structure, but also to the arrangement of molecules that allows the growth of both sI
and sII hydrate crystals. Therefore, even though the greater subcooling degree in the
microcalorimetric method contributes to sI formation as mentioned, it does not have
the same effect as stirring the system.
6.5 CONCLUSIONS
Hydrate-forming systems composed of methane-water and methane-propane-
water were investigated through microcalorimetric analysis and PVT-isochoric method
search. This chapter brings together evidence of the simultaneous formation of sI and
sII at high pressures and high methane contents, considering that computational
predictions do not reveal this phenomenon. The effects of experimental factors on
these structures were evaluated according to the methodology applied since the
results were not strictly the same when using the PVT Cell and the microcalorimeter.
Thereby, the results are discussed according to the experimental limitations of each
technique and considering their specific features.
• Dissociation data were obtained for methane and methane-propane hydrates.
Equilibrium points obtained by the PVT-isochoric method approach to the onset
temperatures of dissociation curves from thermograms in both systems. In some
cases, the peak temperatures are closer to predictions, although the onset point
should approach to the equilibrium more accurately since it represents the
beginning of the hydrate dissociation process. However, empty cavities and
higher heterogeneity degree may occur in real hydrates mainly in absence of
mixture, affecting structural stability and implying in lower dissociation
temperatures. Besides, results from predictions do not reveal the formation of sI
in CH4-C3H8 systems, thus disregarding methane molecules trapped in structure
I, which may change the gas composition. Finally, the overlapping of dissociation
curves (sI and sII) and structural rearrangement, such as recrystallization
process, make less accurate the determination of the onset points of sII;
• High cooling degrees affect mainly the amount of hydrate formed and may lead
to slightly higher dissociation temperatures as the increased driving force and
higher residence time in the hydrate stable zone should favor the filling of the
hydrate structure;
208
• The absence of mixing in the PVT-isochoric method does not seem to affect the
equilibrium point but has a major influence on crystallization temperature and
crystal growth. It indicates that no mixing in the µDSC cells indeed does not
invalidate the equilibrium data by HP- µDSC. According to the results, sI was
favored in CH4-C3H8 systems when mixing likely due to the addition of the
mechanical energy and the better diffusivity of methane in water compared to
propane;
• Lower heating rate contributed mainly to sII hydrate formation, considering the
residence time in the hydrate stable zone is longer;
• PVT-Isochoric results indicate that sI and sII form simultaneously in the methane-
propane system, with a higher kinetic of formation for sI, although sII is the most
thermodynamically stable. Applying multiple cycles in the PVT-isochoric method
reveals sI mainly as a metastable structure since most of it is converted to sII in
subsequent cycles. However, both microcalorimetric and PVT-isochoric methods
indicate that a small fraction of sI remains a stable configuration even after
multicycles, suggesting that a single structure II could be less stable than a
system composed by both sI and sII;
• Dissociation data deviate from prediction mainly after subsequent cycles likely
due to the scarcity of gas molecules in deeper regions of the sample, that lead to
an increase of empty cavities (CH4 systems) or most methane-occupied (CH4-
C3H8 systems) during the hydrate crystals growth, thus affecting the structural
stability. Although the multicycles method did not imply significant deviations in
the case of single guest systems by HP-µDSC, it is believed that larger deviations
were obtained for methane-propane systems due to the difference in diffusivity
of these molecules through the hydrate layer formed in the first cycles.
• While sI was favored in CH4-C3H8 systems by mixing in the PVT- isochoric
method, this structure was also favored by using microcalorimetry due to the
greater subcooling degree required to induce hydrate crystallization in this case;
• Increasing the methane fraction in CH4-C3H8 systems revealed the opposite
effect on the results obtained by the two experimental methods. A larger amount
of sI was obtained in the PVT cell whereas sII structure formation was favored by
using the microcalorimeter, probably because of mixing effect in the PVT cell.
209
REFERENCES
ALADKO, E.Y.; DYADIN, YU.A.; MANAKOV, A.YU.; ZHURKO, F.V.; LARIONOV, E.G. Phase Diagrams of the Ternary Gas Hydrate Forming Systems at High Pressures. Part 1. Propane–Methane–Water System. Journal of Supramolecular Chemistry, v. 2, p. 369-376, 2002. CHA, M., HU, Y., SUM, A.K. Methane hydrate phase equilibrium for systems containing NaCl, KCl, and NH4Cl. Fluid Phase Equilibria, v. 413, p. 2-9, 2016. DALMAZZONE, D.; KHARRAT, M.; LACHET, V.; FOUCONNIER, B.; CLAUSSE, D. DSC and PVT measurements, Journal of Thermal Analysis and Calorimetry, v. 70 (2), p. 493-505, 2002. GUPTA, A.; LACHANCE, J.; SLOAN, E.D.; KOH, C.A. Measurements of methane hydrate heat of dissociation using high pressure differential scanning calorimetry. Chemical Engineering Science, v. 63 (24), p. 5848-5853, 2008. HU, Y.; LEE, B.R.; SUM, A.K. Insight into increased stability of methane hydrates at high pressure from phase equilibrium data and molecular structure. Fluid Phase Equilibria, v. 450, p. 24-29, 2017a. HU, Y.; LEE, B.R.; SUM, A.K. Phase equilibrium data of methane hydrates in mixed brine solutions. Journal of Natural Gas Science and Engineering, v. 46, p. 750-755, 2017b. KANG, S.P.; LEE, H.; RYU, B.J. Enthalpies of dissociation of clathrate hydrates of carbon dioxide, nitrogen, (carbon dioxide + nitrogen), and (carbon dioxide + nitrogen + tetrahydrofuran). Journal of Chemical Thermodynamics, v. 33, p. 513-521, 2001. KLAPPROTH, A.; PILTZ, R.O.; KENNEDY, S.J.; KOZIELSKI, K.A. Kinetics of sII and Mixed sI/sII, Gas Hydrate Growth for a Methane/Propane Mixture Using Neutron Diffraction. The Journal of Physical Chemistry C, v. 123 (5), p. 2703-2715, 2019. KUMAR, R.; LINGA, P.; MOUDRAKOVSKI, I.; RIPMEESTER, J. A.; ENGLEZOS, P. Structure and kinetics of gas hydrates from methane/ethane/propane mixtures relevant to the design of natural gas hydrate storage and transport facilities. American Institute of Chemical Engineers Journal, v. 54 (8), p. 2132-2144, 2008. MASOUDI, R.; TOHIDI, B.; ANDERSON, R.; BURGASS, R.W.; YANG, J. Experimental measurement and thermodynamic modelling of clathrate hydrate equilibria and salt solubility in aqueous ethylene glycol and electrolyte solutions, Fluid Phase Equilibria, v. 219 (2), p. 157-163, 2004. MCLEOD, H. O. J. AND CAMPBELL, J. M. Natural Gas Hydrates at Pressures to 10,000 psia. Journal of Petroleum Technology, v. 13, p. 590-594, 1961.
210
MENEZES, D.E.S.; SUM, A. K.; DESMEDT, A.; PESSOA FILHO, P. A.; ROBUSTILLO, M. D. Coexistence of sI and sII in methane-propane hydrate former systems at high pressures. Chemical Engineering Science, v. 208, article 115149, 2019. MOHAMMADI, A.H.; ANDERSON, R.; TOHIDI, B. Carbon monoxide clathrate hydrates: equilibrium data and thermodynamic modeling, American Institute of Chemical Engineers, v. 51 (10), p. 2825-2833, 2005. MOHAMMAD-TAHERI, M.; MOGHADDAM, A.Z.; NAZARI, K.; ZANJANI, N.G. The role of thermal path on the accuracy of gas hydrate phase equilibrium data using isochoric method, Fluid Phase Equilibria, v. 338, p. 257-264, 2013. NIXDORF, J.; OELLRICH, L.R. Experimental determination of hydrate equilibrium conditions for pure gases, binary and ternary mixtures and natural gases. Fluid Phase Equilibria, v. 139 (1), p. 325-333, 1997. PETUYA, C.; DAMAY, F.; DESPLANCHE, S.; AUPETIT, C.; DESMEDT, A. Ageing and Langmuir Behavior of the Cage Occupancy in the Nitrogen Gas Hydrate. Crystals, v. 8 (4), p. 145-158, 2018b. PETUYA, C.; DAMAY, F.; DESPLANCHE, S.; TALAGA, D.; DESMEDT, A. Selective trapping of CO2 gas and cage occupancy in CO2–N2 and CO2–CO mixed gas hydrates. Chemical Communications, v. 54, p. 4290-4293, 2018a. PETUYA, C.; DAMAY, F.; TALAGA, D.; DESMEDT, A. Guest Partitioning in Carbon Monoxide by Raman Spectroscopy. The Journal of Physical Chemistry C, v. 121, p. 13798-13802, 2017. SCHICKS, J.M.; LUZI-HELBING, M. Cage occupancy and structural changes during hydrate formation from initial stages to resulting hydrate phase. Spectrochimica Acta Part A: Molecular and Biomolecular Spectroscopy, v. 115, p. 528-536, 2013. SHIN, W.; PARK, S.; RO, H.; KOH, D.Y.; SEOL, J.; LEE, H. Spectroscopic confirmation of metastable structure formation occurring in natural gas hydrates. Chemistry – An Asian Journal, v. 7, p. 2235-2238, 2012. SLOAN, E.D. Gas hydrates: review of physical/chemical properties. Energy & Fuels, v. 12, p. 191-196, 1998. SLOAN, E.D.; KOH, C.A.; SUM, A.K. Gas hydrate stability and sampling: the future as related to the phase diagram. Energies, v. 3, p. 1991-2000, 2010. UCHIDA, T.; MOORIWAKI, M.; TAKEYA, S.; IKEDA, I.Y.; OHMURA, R.; NAGAO, J.; MINAGAWA, H.; EBINUMA, T.; NARITA, H.; GOHARA, K.; MAE, S. Two-step formation of methane-propane mixed gas hydrates in a batched-type reactor. American Institute of Chemical Engineers, v. 50, p. 518-523, 2004. WARD, Z.T.; MARRIOTT, R.A.; SUM, A.K.; SLOAN, E.D.; KOH, C.A. Equilibrium Data of Gas Hydrates containing Methane, Propane, and Hydrogen Sulfide. Journal of Chemical & Engineering, v.60 (2), p.424-428, 2015.
211
ZHANG, Y.; DEBENEDETTI, P.G.; PRUD'HOMME, R.K.; PETHICA, B.A. Differential Scanning Calorimetry Studies of Clathrate Hydrate Formation. The Journal of Physical Chemistry B, v. 108 (43), p. 16717-16722, 2004. ZHU, J.; DU, S.; YU, X.; ZHANG, J.; XU, H.; VOGEL, S. C.; GERMANN, T. C.; FRANCISCO, J. S.; IZUMI, F.; MOMMA, K.; KAWAMURA, Y.; JIN, C.; ZHAO, Y. Encapsulation kinetics and dynamics of carbon monoxide in clathrate hydrate. Nature Communications, v. 5, 4128, 2014.
212
CHAPTER 7
STUDIES OF GAS HYDRATES BY RAMAN SPECTROSCOPY
ABSTRACT
Although the techniques applied in the previous chapters are useful to determine
thermodynamic properties and equilibrium data, they do not provide intrinsic
information about the gas hydrate structure formed. In this chapter, Raman
spectroscopy is one of the most used techniques for structural analyses at real-time or
time-independent measurements. The main method used was based on ex situ
analyses in order to evaluate the composition of stable structures. Besides, two
different methods based on in situ analyses were applied to visualize and evaluate the
gas hydrate formation and growth processes. The results present Raman signatures
for single methane and propane hydrates and for methane-propane hydrates. The
predominance of structure II is observed for such double hydrates and the increase of
methane content in the gas phase led to a higher occupation of large cavities by
methane molecules. The real-time measurements indicate the prior formation of the
small cavities and the progression of the cages occupancy according to the location in
the aqueous phase and the time elapsed from the hydrate nucleation.
7.1 INTRODUCTION
Raman spectroscopy is a usual technique applied for hydrate characterization,
that generates useful information on the structure, composition and cage occupancy
(SCHICKS et al., 2005). The analyses can provide time-dependent or time-
independent spectra depending on the methodology employed. Long (1994) firstly
studied tetrahydrofuran (THF) clathrates through real-time Raman measurements.
Sum et al. (1997) published time-independent Raman signatures for three structures
(sI, sII and sH) of different gas hydrates by analyzing samples prepared ex situ.
Subramanian and Sloan (1999) report methane hydrate spectra applying both time-
independent and real-time measurements. Uchida et al. (1999) studied the hydration
number for methane hydrates prepared ex situ by using Raman spectroscopy.
Thenceforth, several groups have applied this technique to study the formation and
dissociation of distinct phases of gas hydrates through in situ measurements (HESTER
213
et al., 2006; TANG et al., 2018; ZHONG et al., 2016), as well as to investigate time-
independent signatures for several gas molecules trapped in hydrate cavities, the
hydration number and the cages occupancy (BOURRY et al., 2009; CHAZALLON et
al., 2017; KUMAR et al., 2019; QIN; KUHS, 2013; UCHIDA et al., 2007). Other groups
have studied the effect of the equilibrium conditions, such as pressure and
temperature, on hydrates structural features (MAGNOTTI et al., 2015; PETUYA et al.,
2017; PETUYA et al, 2018). Thereby, this chapter presents three methods for the
preparation of gas hydrates samples in order to analyze them by means of Raman
measurements and includes results recently published (MENEZES et al., 2019).
7.2 SPECIFIC EXPERIMENTAL CONDITIONS
Details about Raman spectroscopy features applied in this work are described in
section 2.4. Raman spectra were obtained through a HR Evo micro-spectrometer
(Horiba Jobin Yvon, France), coupled to a confocal microscope allowing to reach
micrometric spatial resolution. Ex situ analyses were performed on previously prepared
methane and methane-propane samples for studying their structural composition. On
the other hand, in situ measurements were performed on samples of methane hydrate
in order to study the structural changes throughout the formation process.
7.3 EX SITU ANALYSES
Among the methods employed in this work, the analysis of the hydrate prepared
ex situ is the most indicated for the preparation of gas hydrates when it is desired to
obtain the Raman spectra of stable structures. This is because the samples are
prepared from ice powder, which favors the ice conversion to hydrate due to higher
diffusivity of gas molecules through the ice crystalline lattice. In addition, different
samples can be prepared previously by this method and analyzed one at a time
according to the availability of the spectrometer, considering that the complete
conversion to a stable structure may last for a few days. Therefore, Raman spectra for
methane and methane-propane hydrates prepared ex situ are presented in this
section.
214
7.3.1 Methane Hydrate
Figure 7.1 presents the deconvolution of the peaks concerning to the methane
hydrate sample prepared ex situ at 10 MPa. The vibrational band for methane hydrate
is composed of two peaks related to the incorporation of CH4 in large cavities (MA,
2903.5 cm-1) and small cavities (MB, 2914.8 cm-1) of sI. Sum et al. (1997) reported
similar wavenumbers for large and small cages of methane hydrate: 2905 and 2915
cm-1, respectively. The group also mentioned that the intensities of these bands agree
to the density of cavities per unit cell of sI (two small and six large cavities). Thereby,
the larger band at lower frequency was assigned to methane molecules inserted in
large cavities (MA (SC)), while the smaller band was related to the same molecules
trapped in small cavities (MB (LC)). In this work, the ratio between large and small bands
is also very similar to the proportion between large and small cavities in the unit cel of
sl (~3.5).
Figure 7.1 - Deconvolution of the peaks related to the CH4 molecules hosted in large and small cavities of structure I.
7.3.2 Methane-propane Hydrates
As mentioned throughout this work, gas composition plays an important role on
the structural properties of gas hydrates. In the previous chapter, CH4-C3H8 hydrates
were studied at three different compositions by both PVT-isochoric method and
215
microcalorimetry. The results obtained by the first indicate that sI is favored by
increasing the methane content in the gas phase, while the calorimetric thermograms,
in turn, indicate that sII is favored. It is important to remind that the system in the first
method is maintained under mixing conditions, unlikely in the microcalorimetric cells.
It has shown in earlier chapters that lack of mixing can increase the hydrate phase
heterogeneity, especially in the case of double guest systems. Thus, in order to
complement the results obtained by microcalorimetry and PVT-isochoric method, a
similar study was carried out by Raman spectroscopy analyses, in which methane-
propane hydrates were prepared ex situ by applying three gas mixtures with different
compositions. The characteristic peaks from Raman spectroscopy for the single-guest
gas hydrates are indicated in Figure 7.2. They were used as Raman signatures for
single hydrates to further compare the structures of the double-hydrate samples.
Figure 7.2 – Raman spectra of single CH4 and C3H8 hydrates: assigned peaks for characterization of double hydrates.
Source: Menezes et al. (2019)
Among the various CH3 and CH2 stretching and bending modes of the propane
molecules trapped in the sII cavities, the ones observed at 2899.4 cm-1 (PA) and 2918.3
cm-1 (PB) are remarkable bands for investigating the mixed gas hydrate. Raman
spectra were then obtained for the three methane-propane hydrates prepared at 68.7,
79.8 and 95 mol% CH4 in the gas phase. The spectra for methane-propane hydrates
are shown in Figure 7.3. The bands for methane and propane molecules indicated in
Figure 7.2 can be obtained separately by decomposing the spectra, thanks to the high
216
spectral resolution (of the order of 1 cm-1). For this, four pseudo-Voigt peaks were fitted
to the experimental spectra in order to obtain the partial contributions and to measure
the peak intensities. Figure 7.4 shows the deconvolution of the peaks concerning to
the hydrate prepared with 79.8 mol% CH4, indicating an excellent agreement between
the fitted spectra and the experimental one.
Figure 7.3 – Raman spectra of CH4-C3H8 hydrate samples prepared under different gas compositions.
Figure 7.4 – Deconvolution of the peaks from the CH4-C3H8 hydrate (79.8 mol% CH4 in gas phase) formed at 8.7 MPa.
Source: Menezes et al. (2019)
217
Figure 7.5 shows some intensity ratios (PB / PA, MB / MA and PB / MA) for the three
samples of CH4-C3H8 hydrates so that sI and sII can be studied according to the gas
composition. The intensity ratios PB / PA are similar for all compositions, including for
the single propane hydrate (~2.1), which is expected since both peaks concern to the
propane encapsulated in large cavities of sII. Although it is not possible to conclude
that sI coexists with sII only by analyzing these bands, since the signatures for methane
encaged in sI and sII are very similar (SUM et al., 1997), the hydrate is inferred to be
constituted mostly by sII. This assumption is supported by the considerable high
methane content in small cages indicated by MB / MA, considering that the proportion
LC : SC for the single methane hydrate (sI) is about 0.3. Therefore, much more large
cavities are hosting methane molecules than allowed by sI. The predominance of sII,
which presents a higher density of small cavities per unit cell, may explain the elevated
ratios MB/MA obtained in these double-guest hydrates. However, MB / MA and PB / MA
decrease substantially by increasing the methane fraction in the gas phase, indicating
that a greater part of methane molecules ends up to be hosted in large cavities (either
from sI or sII). This can be observed visually in Figure 7.3, in which MA becomes
evident as methane content increases. This could be due to either an increase in the
fraction of structure I, which contains two small and six large cavities per unit cell, or
because methane partially occupied large cavities of sII in place of propane molecules.
Figure 7.5 – Ratios between intensities of Raman bands corresponding to propane (PA and PB) and methane (MA and MB) in CH4-C3H8 hydrates with different gas compositions.
Source: Menezes et al. (2019)
218
7.4 IN SITU ANALYSES
In situ analyses performed by using capillary or cylindrical cells were performed
by Raman spectroscopy in order to evaluate the compositional evolution of the
structures according to the gas hydrate formation. Considering that the complete
hydrate conversion can last for a couple of days, these techniques are not the most
suitable for the characterization of stable structures. Such analyses depend on the
availability of the spectrometer and demand a larger amount of liquid nitrogen for
maintaining the system at low temperature. Besides, the hydrate may not be as
homogeneous as the ones prepared from ice powders (ex situ) due to the diffusivity
limitations. Therefore, only the initial stages of methane hydrate formation and growth
are presented in this section.
7.4.1 Capillary Cell
The capillary cell allows monitoring the hydrate growth in an axial perspective.
The hydrate crystals grow from the meniscus towards the aqueous phase, as shown
in Figure 7.6. On the side of the gas phase, some crystals can be noted along the inner
walls due to moisture in the cell.
Figure 7.6 – Gas hydrate growth towards the aqueous phase in capillary cell visualized through the microscope coupled to the Raman spectrometer. Time elapsed after the first visually observed hydrate
crystals: A) 2 min; B) 2min 17s; C) 3min 5s.
219
Figure 7.7 presents the Raman spectra for the solid phase at different axial
positions. One can verify both peaks corresponding to methane molecules in large and
small cages of sI. However, the intensity corresponding to small cages increases as
the green laser of the Raman spectrometer is moved towards the aqueous phase. This
is an evidence that, in fact, small cavities occupied by methane present a higher kinetic
of formation than the large ones (SCHICKS; LUZI-HELBING, 2013; SUBRAMANIAN;
SLOAN, 1999). It is reasonable to say that the hydrate crystals close to the meniscus
present a more stable configuration since both large and small cages in this region are
firstly formed and occupied by methane molecules. Thereby, the proportion between
the cavities at the point established as 0 µm is close to 3 and agree to the density of
cavities per unit cell of sI, as mentioned before. On the other hand, the growth of
crystals at upper positions depends on the methane molecules diffusion on the
aqueous phase and thus still do not present a stable configuration at the time of the
Raman analysis.
Figure 7.7 – Raman spectra of CH4 hydrate (20 MPa) at different axial positions in the capillary cell.
7.4.2 Cylindrical Cell
The second method applied for hydrate analysis in situ is based on a cylindrical
cell equipped with an optical visor. In this case, since the volume of the sample is
considerably larger than in the capillary cell, the temperature is decreased below the
220
melting point of ice in order to favor the nucleation and crystals growth. It makes
possible the formation of ice along with the gas hydrate, implying a more
heterogeneous solid phase. Images that compose Figure 7.8 show the evolution of the
solid phase over time. The first visible clue to the crystallization process can be seen
in the second image (19 min), in which droplets of water crystallize on the walls of the
cell. From 35 min onwards, one can note that the aqueous phase becomes turbid,
indicating the formation of small crystals. Hydrate growth within the aqueous phase is
observed only in the last image since the process is limited by the diffusion of the
methane molecules and can take several hours to complete the hydrate crystallization
process.
Figure 7.8 – Visual inspection of CH4 hydrate formation and growth in the cylindrical cell.
Figure 7.9 shows the peaks concerned to CH4 molecules trapped inside large
(2903.9 cm-1) and small cavities (2913.3 cm-1) of sI, obtained by applying this method.
The peak at 2903.9 cm-1 increases slowly over time and it is again evidence for the
prior formation of small cavities, confirming the results observed in the capillary cell.
221
Figure 7.9 – Raman spectra of CH4 hydrate in the cylindrical cell at 16.4 MPa.
Nevertheless, it is worth to mention that Schicks and Ripmeester (2004) reported
a similar behavior for methane hydrates monitored in situ by Raman spectroscopy and
assumed that this phenomenon is related to a prior formation of a metastable structure
(sII). According to the authors, the change in peak intensities indicates the transition
from sII to sI, a thermodynamically more stable configuration, thereby, the ratio of large
to small cages shown in their spectra changes from about 1:2 to 3:1. However, the
spectra showed in Figures 7.7 and 7.9 do not indicate an initial rate even close to 1:2.
Therefore, it is supported in this work that the phenomena observed in both cases
above have to do with the cages occupancy, considering that the occupation of large
cavities is the rate-limiting factor for the formation of sI, as reassessed by Shicks and
Luzi-Helbing (2013) in a more recent work.
Finally, the peak observed at 2915.2 cm-1 in Figure 7.9 refers to the methane in
the gas phase. Methane molecules hosted in small cavities are reported at slightly
lower frequencies than free methane molecules in gas phase (SUM et al., 1997).
Therefore, checking this peak is important to ensure that the peak at 2913.3 cm-1
indeed is related to methane in the hydrate phase and not in the gas phase.
222
7.5 CONCLUSIONS
This chapter presents some Raman spectra for gas hydrates based on the main
methods used for structural studies of these compounds. The most remarkable points
are presented below:
• Ex situ analyses are more suitable for characterization of hydrate stable
structures than in situ analyses. Once samples are based on ice powder, the
diffusivity of gas molecules through the water-bonded lattice is favored, implying
in a faster conversion to hydrate and a more homogeneous solid phase. Methane
hydrate and methane-propane hydrates were characterized through this method;
• The results for methane hydrate agree to the literature data whereas the ones for
methane-propane hydrates reveals the complexity of determining their structural
composition and the cages occupancy;
• Despite the difficulties faced due to overlapping peaks, it is stated that sII is
predominant in the three methane-propane hydrates evaluated, prepared from
different gas phase compositions;
• The increase of the methane content in CH4-C3H8 systems led to a higher
occupation of large cavities by methane molecules, either due to the formation of
a larger fraction of structure I or because methane molecules were hosted on
large cavities of sII;
• In situ analyses are interesting for studying the hydrate formation and crystal
growth process. The initial stage of methane hydrate formation was studied by
two different methods based on a capillary and a cylindrical cell. The results
evidence the prior formation of the small cavities and the progression of the cages
occupancy towards the aqueous phase;
• Finally, this chapter is of relevant importance not only for the new perspectives
provided by the results but also for describing in detail the most applied methods
in the study of gas hydrates through Raman spectroscopy.
REFERENCES
BOURRY, C.; CHAZALLON, B.; CHARLOU, J.L.; DONVAL, J.P.; RUFFINE, L.; HENRY, P.; GELI, L.; ÇAGATAY, M.N.; İNAN, S.; MOREAU, M. Free gas and gas
223
hydrates from the Sea of Marmara, Turkey: Chemical and structural characterization. Chemical Geology, v. 264, p. 197-206, 2009. CHAZALLON, B.; NOBLE, J.; DESMEDT, A. Spectroscopy of Gas Hydrates: From Fundamental Aspects to Chemical Engineering, Geophysical and Astrophysical Applications. In Gas Hydrates 1: Fundamentals, Characterization and Modeling, Wiley−ISTE: London, p. 63-112, 2017. HESTER, K.C.; WHITE, S.N.; PELTZER, E.T.; BREWER, P.G.; SLOAN, E.D. Raman spectroscopic measurements of synthetic gas hydrates in the ocean. Marine Chemistry, v. 98, p. 304-314, 2006. KUMAR, A.; KUMAR, R.; LINGA, P. Sodium Dodecyl Sulfate Preferentially Promotes Enclathration of Methane in Mixed Methane-Tetrahydrofuran Hydrates. iScience, v. 14, p.136-146, 2019. LONG, X.P. Master Thesis T-4458, Colorado School of Mines, 1994. MAGNOTTI, G.; KC, U.; VARGHESE, P.L.; BARLOW, R.S. Raman spectra of methane, ethylene, ethane, dimethyl ether, formaldehyde and propane for combustion applications. Journal of Quantitative Spectroscopy and Radiative Transfer, v. 163, p. 80-101, 2015. MENEZES, D.E.S.; SUM, A. K.; DESMEDT, A.; PESSOA FILHO, P. A.; ROBUSTILLO FUENTES, M. D. Coexistence of sI and sII in methane-propane hydrate former systems at high pressures. Chemical Engineering Science, v. 208, article 115149, 2019. PETUYA, C.; DAMAY, F.; CHAZALLON, B.; BRUNEEL, J.-L.; DESMEDT, A. Guest Partitioning and Metastability of the Nitrogen Gas Hydrate. The Journal of Physical Chemistry C, v. 122, p. 566-573, 2018. PETUYA, C.; DAMAY, F.; TALAGA, D.; DESMEDT, A. Guest Partitioning in Carbon Monoxide by Raman Spectroscopy. The Journal of Physical Chemistry C, v. 121, p. 13798-13802, 2017. QIN, J.; KUHS, W.F. Quantitative analysis of gas hydrates using raman spectroscopy. American Institute of Chemical Engineers Journal, v. 59, p. 2155-2167, 2013. SCHICKS, J.M.; LUZI-HELBING, M. Cage occupancy and structural changes during hydrate formation from initial stages to resulting hydrate phase. Spectrochimica Acta Part A: Molecular and Biomolecular Spectroscopy, v. 115, p. 528-536, 2013. SCHICKS, J.M.; RIPMEESTER, J.A. The Coexistence of Two Different Methane Hydrate Phases under Moderate Pressure and Temperature Conditions: Kinetic versus Thermodynamic Products. Angewandte Chemie International Edition, v. 43, p. 3310-3313, 2004.
224
SCHICKSA, J.M.; ERZINGERA, J.; ZIEMANN, M.A. Raman spectra of gas hydrates-differences and analogies to ice 1h and (gas saturated) water. Spectrochimica Acta Part A, v. 61, p. 2399–2403, 2005. SUBRAMANIAN, S.; SLOAN, E.D. Molecular measurements of methane hydrate formation. Fluid Phase Equilibria, v. 158–160, p. 813–820, 1999. SUM, A.K.; BURRUSS, R.C.; SLOAN, E.D. Measurement of Clathrate Hydrates via Raman Spectroscopy. The Journal of Physical Chemistry B, v. 101 (38), p. 7371-7377, 1997. TANG, C.; ZHOU, X.; LI, D.; ZHAO, X.; LIANG, D. In situ Raman investigation on mixed CH4-C3H8 hydrate dissociation in the presence of polyvinylpyrrolidone. Fuel, v. 214, p. 505-511, 2018. UCHIDA, T.; HIRANO, T.; EBINUMA, T.; NARITA, H.; GOHARA, K.; MAE, S.; MATSUMOTO, R. Raman Spectroscopic Determination of Hydration Number of Methane Hydrates. American Institute of Chemical Engineers Journal, v. 45, p. 2641-2645, 1999. UCHIDA, T.; TAKEYA, S.; KAMATA, Y.; OHMURA, R.; NARITA, H. Spectroscopic Measurements on Binary, Ternary, and Quaternary Mixed-Gas Molecules in Clathrate Structures. Industrial and Engineering Chemistry Research, v. 47, p. 5080-5087, 2007. ZHONG, J.-R.; ZENG, X.-Y.; ZHOU, F.-H.; RAN, Q.-D.; SUN, C.-Y.; ZHONG, R.-Q.; YANG, L.-Y.; CHEN, G.-J.; KOH, C.A. Self-preservation and structural transition of gas hydrates during dissociation below the ice point: an in situ study using Raman spectroscopy. Scientific Reports, v. 6, 38855, 2016.
225
CHAPTER 8
USE OF 1-BUTYL-3-METHYLIMIDAZOLIUM-BASED IONIC LIQUIDS AS HYDRATE
INHIBITORS AT HIGH PRESSURE CONDITIONS
ABSTRACT
Ionic liquids (ILs) are fluids constituted by ions that present peculiar features as
solvents. Among many other applications, these materials have been studied as
innovative and promising compounds for the prevention of hydrate formation in oil and
gas flowlines. The performance of 1-Butyl-3-methylimidazolium chloride ([BMIM][Cl])
and 1-Butyl-3-methylimidazolium bromide ([BMIM][Br]) as methane hydrate inhibitors
is evaluated in this chapter at pressures from 9.8 to 100 MPa by high-pressure
microcalorimetry. New hydrate dissociation data were obtained for aqueous systems
containing 1, 5, 10 and 15 % molar fractions of inhibitors. The inhibitory effect is clearly
better as the concentration of the IL in aqueous solution increases and tends to be
slightly enhanced at higher pressures. Previous studies in literature indicate that these
ionic liquids act simultaneously as thermodynamic and kinetic inhibitors (dual function
inhibitors) for pressures up to 20 MPa and concentrations of 10 wt% (approximately
1% molar). In this chapter, it is shown that [BMIM][Cl] and [BMIM][Br] also work as
thermodynamic inhibitors even at higher pressures, but they surprisingly act as hydrate
growth promoters at concentrations of 1% and 5% molar. Phase equilibrium curves are
also presented to evaluate the effectiveness of these ionic liquids as thermodynamic
inhibitors at high pressures and to compare experimentally their efficiency to methanol,
a commercial inhibitor commonly applied in oil and gas exploitations. [BMIM][Cl]
showed to be a more efficient inhibitor than [BMIM][Br] and methanol, considering
equimolar aqueous solutions, even though methanol is more effective for solutions with
the same mass fraction. The results are also compared to predictions from Multiflash
software by applying NaCl and NaBr as gas hydrate inhibitors.
8.1 INTRODUCTION
As mentioned throughout this work, gas hydrates form at high pressure and low
temperature, which are typical conditions of the subsea surface. In this context,
thermodynamic and kinetic studies related to the formation and dissociation of gas
226
hydrates play an important role in determining proper conditions to extract oil in
offshore walls, since hydrates can obstruct oil and gas flowlines during these
operations (SLOAN; KOH, 2008). Different techniques are used to avoid blocking
flowlines in these regions (KINNARI et al. 2015). The most effective ones involve the
addition of substances that act as hydrate inhibitors. These additives are usually
classified as thermodynamic and kinetic inhibitors. Thermodynamic inhibitors, such as
salts, methanol or ethylene glycol, are substances that move the hydrate-liquid-vapor
equilibrium (HLVE) curve to lower temperatures and higher pressures. Large amounts
of these inhibitors may be required when working in deeper water conditions,
sometimes making this choice uneconomical (HAGHIGHI et al., 2009; HU et al, 2017;
MOHAMMADI; RICHON, 2010). Thus, the oil and gas industry has started developing
low-dosage hydrate inhibitors (LDHIs), such as kinetic inhibitors (KHIs) and anti-
agglomerants (AAs). Kinetic hydrate inhibitors (KHIs) retard hydrate formation: if the
residence time of the fluid is shorter than that required for the hydrate nucleation and
growth, the blockage is avoided (KELLAND, 2006; KOH et al., 2002; TARIQ et al.,
2014). Anti-agglomerants (AAs) allow hydrate formation but prevent particle
agglomeration (KIM et al., 2011).
Ionic Liquids (ILs) are salt-like substances with melting temperatures below 373
K. These substances present properties such as good stability and low volatility and
are used as green solvents (ANGELL et al., 2007). They have recently been
considered as promising hydrate inhibitors. The great advantage of using ILs as gas
hydrates inhibitors is that they may act as both thermodynamic and kinetic inhibitors,
therefore being more efficient than inhibitors currently used in oil industry (QURESHI
et al., 2016; RICHARD; ADIDHARMA, 2013; TARIQ et al.; 2016). Xiao and Adidharma
(2009) proposed that this dual function is related to the strong electrostatic charge and
to the hydrogen bond interactions with water. These properties affect the equilibrium
curve (HLV), shrinking the risk zone for hydrate formation and slowing hydrate
nucleation/growth rates. Some imidazolium-based ILs were studied by Sabil et al.
(2015) as methane hydrate inhibitors, for pressures from 3.6 to 11.2 MPa. These
results showed the effectiveness of nine ILs at 10 wt% in shifting the equilibrium curve
toward low dissociation temperatures and highlight the promising role that ionic liquids
may play as hydrate inhibitors.
This chapter is based on a recent work published by Menezes et al. (2020) and
presents new equilibrium data for methane hydrates at pressures up to 100 MPa using
227
two ionic liquids as inhibitors: 1-butyl-3-metylimidazolium chloride [BMIM][Cl] and 1-
butyl-3-metylimidazolium bromide [BMIM][Br]. Inhibitors performance at high
pressures and different concentrations is also evaluated. These compounds were
previously studied by Xiao et al. (2010) at pressures up to 20 MPa. They showed a
good performance as both thermodynamic and kinetic inhibitors for a composition of
10 wt.%. In this work, thermograms of the methane-water system are compared to
those containing either an ionic liquid or methanol, a commonly used hydrate
thermodynamic inhibitor. Most of the works found in literature regarding hydrate
inhibitors present the results in weight concentration (wt%). This is important to
evaluate the proper amount of inhibitor, since large amounts cause storage, handling
and separation problems in offshore environments. However, this work also considers
molar concentrations to indicate the chemical efficiency of both ILs studied.
Experimental results are also compared with literature data (at lower pressures) and
thermodynamic models.
8.2 SPECIFIC EXPERIMENTAL CONDITIONS
Methane gas (99.5%) was provided by White Martins and employed for
pressurization and hydrate formation in all experiments. The ionic liquids chosen to be
studied as promising hydrate inhibitors were 1-butyl-3-methylimidazolium bromide
(97%) and 1-butyl-3-methylimidazolium chloride (99%). Both ionic liquids and
methanol (99.8%) were provided by Sigma Aldrich. Milli-Q water was used in all
experiments.
The thermal procedure applied on the microcalorimeter oven is the same as that
mentioned on chapter 2 of this work (see Figure 2.6). In all cases, the reference cell
was kept empty and the sample cell was pressurized with methane, after addition of
the aqueous solution (~35 mg). The experiments were planned to evaluate and
compare ionic liquid efficiency by determining hydrate dissociation temperatures at
constant pressure. Data were obtained for samples with water (no inhibitor) and those
containing ILs ([BMIM][Br], [BMIM][Cl]), or methanol (CH3OH). The efficiency of each
ionic liquid was studied considering different molar fractions (5.0%, 10.0%, and
15.0%). Although chemical efficiency is based on molar amounts, the inhibition
effectiveness should also be assessed in terms of mass fractions, since the volume of
inhibitor to be stored is a severe restriction in offshore platforms. Thereby, three further
228
experiments were performed considering the same mass fraction (~10 wt%) of each
inhibitor.
8.3 EFFECT OF PRESSURE ON THE FORMATION AND DISSOCIATION OF SOLID PHASES
Crystallization and dissociation peaks are pointed out in Figure 8.1 for systems
containing 5.0 mol% of [BMIM][Br], for both cooling (A) and heating (B) processes.
Figure 8.1 – Cooling (A) and heating (B) thermograms of hydrate-forming systems composed of 5 mol% [BMIM][Br] at different pressures. The indicated transitions correspond to hydrate crystallization
As observed for non-inhibited systems, the increase in pressure shifts the hydrate
thermodynamic equilibrium to higher crystallization and dissociation temperatures. The
ice melting point presents an anomalous behavior due to a crystalline rearrangement,
as discussed in section 4.3.1. Because of that, the crystallization and melting points of
ice in this region decrease as the pressure increases.
8.4 EFFECT OF IONIC LIQUID CONTENT IN GAS HYDRATES FORMATION
Thermodynamic inhibitors act by reducing the amount of water molecules
available to form the hydrate structures by binding to them through hydrogen bonds.
Thus, large amounts are required for hydrate inhibition. On the other hand, kinetic
inhibitors prevent hydrate nucleation and are needed in smaller amounts. In this work,
relatively high molar concentrations are also studied for the ionic liquids based on
229
[BMIM][Br] and [BMIM][Cl] to evaluate the behavior of these compounds in a more
comprehensive concentration range. In the thermograms shown in Figure 8.2, all the
IL concentrations shifted the hydrate dissociation curve to lower temperatures,
confirming their efficiency as thermodynamic inhibitors (TARIQ et al., 2014). The figure
also shows that the ice formation and melting peaks either diminished or are not
observed at higher concentrations of ionic liquid for the temperature range analyzed.
Figure 8.2 – Effect of ionic liquid concentration on CH4 hydrate formation and dissociation (20 MPa): A) Ionic liquid based on [BMIM][Br] B) Ionic liquid based on [BMIM][Cl]. The indicated transitions
concern to hydrate dissociation (⁎), ice melting (×), and Teflon transitions (○).
Source: Menezes et al. (2020)
Xiao et al. (2010) studied the kinetic inhibition induced by the same ILs up to 20
MPa. According to their results, the induction time for methane hydrate nucleation at
261 K and 11.4 MPa was about 1.5 and 2.1 hours later when adding 1 mol% [BMIM][Cl]
and [BMIM][Br], respectively. However, the integration of the areas corresponding to
dissociation curves in Figure 8.2 reveals that the amount of hydrate formed is
significantly greater at 1.0 mol% and 5.0 mol% for both ILs. This fact suggests that
these compounds promote hydrate growth at low fractions, even though they act as
thermodynamic inhibitors simultaneously.
In fact, the same compound may act as both hydrate kinetic promoter and
thermodynamic inhibitor at low concentrations, as discussed in previous works
involving the following inhibitors: methanol for carbon dioxide and methane hydrates
(BOBEV; TAIT, 2004; KE et al., 2013); monoethylene glycol for natural gas hydrate
(CHA et al., 2013); salt solutions for methane-propane and tetrahydrofuran hydrates
(SOWA et al., 2014; SOWA et al., 2015); and ionic liquid 1-hydroxyethyl-1-
methylmorpholinium for methane hydrate (LEE et al., 2016). According to Amtawong
230
et al. (2016), low dosages of methanol enhance propane hydrate formation
substantially, increasing the maximum uptake and conversion rates and decreasing
the initial pressure required to initiate the reaction. McLaurin et al. (2014) observed the
acceleration of methane uptake to form hydrate from powdered frozen solutions at 253
K (initially at 12.5 MPa), containing methanol at concentrations within 0.6 to 10 wt%.
On the other hand, the area of hydrate dissociation curves decreases as the IL
concentration further increases. These curves are barely observed at 15.0 mol%, and
the intensities are as low as those of the Teflon transition phenomenon. Indeed, the
performance of ionic liquids as dual function inhibitors (kinetic and thermodynamic) is
observable at high concentrations of IL. The hydrate equilibrium is shifted to lower
temperatures, diminishing substantially the amount of hydrate formed. Sowa et al.
(2014) suggest that the thermodynamic inhibition effect is likely to be dominant and
masks the kinetic promotion effect when the inhibitor is present at high concentrations.
These results highlight the complexity of the action of ionic liquids: it depends on the
design of the molecules (the type of cation and anion) and the concentration of IL in
aqueous solution.
Although ionic liquids have been studied as hydrate inhibitors by many
researchers, their kinetic promotion effect and the mechanisms involved in nucleation
and growth of hydrates are barely addressed. Zare et al. (2015) evaluated the use of
some imidazolium-based ionic liquids and indicated some of them as hydrate
promoters since they decrease the induction time and accelerate gas-consumption
during hydrate growth. They explained the phenomenon considering the similarity
between imidazolium based ILs and cationic surfactants, both capable of forming
micelles in aqueous solutions (BLESIC et al., 2007; DUPONT, 2004). The presence of
surfactants reduces the surface tension, thus favoring the gas solubilization and
providing better conditions for hydrate nucleation and growth (CHEN et al., 2008; DI
PROFIO et al., 2005; SHEN et al., 2016). Kumar et al. (2015) conducted a
comprehensive literature review of the role of surfactants in the formation and
dissociation studies of clathrate hydrates. The anionic surfactant sodium dodecyl
sulfate (SDS) is the most efficient hydrate promoter. Zhong et al. (2000) stated that the
use of SDS to form ethane and natural gas hydrates reduces the induction time,
resulting in a high rate of formation without the need for agitation. These authors also
verified the reproducibility of the induction time in the presence of surfactant, which
contrasts with the non-surfactant randomness. According to them, it may be due to the
231
spatial uniformity of micellar nuclei, which may act as carriers of ethane molecules to
the bulk of the aqueous phase, favoring the formation of the hydrate. However, some
works pointed out that the presence of micelles is not restrictive for gas hydrate
promotion since many surfactants cannot form micelles at normal hydrate formation
temperatures, i.e., below 283 K, and different mechanisms of formation may be
effective in the presence of surfactants (OKUTANI et al., 2008; ZHANG, 2007;
WATANABE et al., 2005). Watanabe et al. (2005) reported the promoting effect of SDS
in hydrofluorocarbon hydrate formation, even though no micelles were formed in
aqueous solutions. Zhang et al. (2007) suggested that SDS promotes hydrate
nucleation at temperatures below the normal Krafft point because it adsorbs on hydrate
crystals and reduces the energy barrier. However, Watanabe et al (2005) also
recognized that micelles might influence the formation of hydrates since Krafft
temperature has always been obtained under atmospheric pressure and not under
hydrate conditions. Bhattacharjee et al. (2017) developed a new surfactant (based on
the combination of SDS and a zwitterionic surfactant) that micellizes at the temperature
of clathrate hydrate formation in a methane-pressurized system. This study confirms
that the presence of surfactant micelles increases the kinetics of methane hydrate
formation.
According to Sun et al. (2003, 2004), the concentration of surfactant in a solution
that gives the highest methane storage capacity in hydrates is the critical micellar
concentration (CMC) – above such concentration, gas solubility is reduced. Thus,
although the mechanisms by which ionic liquids promote the formation of gas hydrates
are yet to be better understood, the amount of hydrate observed in Figure 8.2 may be
significantly higher at 1 mol % for both ILs because the CMC has not been reached.
8.4.1 Distance between onset and peak temperatures
The onset temperature of the dissociation peak is less influenced by the heating
rate and the sample mass (MENEZES et al., 2019). However, some authors (SABIL et
al., 2015; XIAO et al., 2010) use the endset of hydrate dissociation to define the
equilibrium temperature at a certain pressure to study gas hydrate formation and
dissociation in the presence of inhibitors. In those cases, a slower heating rate (0.01
K·min-1) is required to ensure that the equilibrium condition can always be
approximated during the process. The concentration of inhibitor in the liquid phase is
232
known only at the endpoint of the dissociation peak, which is equivalent to the initial
concentration of the inhibitor loaded in the cell at the beginning of the experiment.
However, if the amount of hydrate formed is small and the mutual solubility of hydrate
formers and inhibitor is low, it is frequently considered that the concentration of inhibitor
in the liquid phase at the onset of the dissociation peak would be approximately the
same as that at the beginning of the experiment.
In this work, a sample of methane hydrate-forming system in the presence of
[BMIM][Cl] at 9.6 MPa was analyzed at 1 K·min-1 and 0.01 K·min-1 for comparison.
Figure 8.3 shows the hydrate dissociation peak obtained in both cases.
Figure 8.3 – Dissociation peak of CH4 hydrate in the presence of [BMIM][Cl] at 10% wt. and 9.6 MPa: A) Comparison of both thermograms obtained at 0.01 and 1 K·min-1; B) Comparison of original
thermogram obtained at 0.01 K·min-1 and the treated one to reduce noise.
Source: Menezes et al. (2020)
As observed in the figure above, the use of a lower heating rate improves the
instrument resolution, which leads to narrower dissociation peaks. Transitions and
thermal events become shorter, but the lower rate also reduces sensitivity and
increases noise. Consequently, the thermogram must be treated to eliminate noise.
The heating rate affects peak and endset temperatures. The onset temperature is not
significantly affected by the heating rate. However, the determination of onset and
endset temperatures is not evident when overlapped transitions are observed during
the dissociation. In Figure 8.3A, two possible onset temperatures are observed for
overlapped peaks named as 1 and 2 (onset 1, 280.2 K, and onset 2, 283.6 K). The
onset of methane hydrate dissociation peak might be considered as that belonging to
the most energetic transition (i.e., onset 2, 283.6 K). Nevertheless, when results
233
presented in Figure 8.3B for 0.01 K·min-1 are compared (onset 279.9 K), the real onset
value at 1 K·min-1 from Figure 8.3A would be that obtained from the small peak (i.e.,
onset 1, 280.2 K). The small difference (~0.3 K) in onset values is within experimental
uncertainty.
A similar analysis can be applied to endset temperatures. In Figure 8.3A only one
endset is observed for the peak named as 3, but in Figure 8.3B two endset values are
observed for overlapped peaks, named as 2 and 3 (endset 1, 284.90 K, and endset 2,
285.70 K, respectively). Xiao et al. (2010) determined an endset value of 284.92 K,
which agrees with our results for endset 1, which corresponds to the most energetic
transition. Although an overlapped peak close to the end of the curve is also observed
in the thermogram presented by Xiao et al. (2010), those authors do not provide any
information about it, neither the onset nor the peak or endset temperatures, which
makes difficult to compare results. Thermograms obtained for methane hydrate in the
presence of 10 wt.% of [BMIM][Br] at 9.6 MPa and different rates are shown in Figure
8.4. In Figure 8.4B, it is also evidenced that different endset values can be considered.
Figure 8.4 – Dissociation peak of CH4 hydrate in the presence of [BMIM][Br] at 10% wt. and 9.6 MPa: A) Comparison of both thermograms obtained at 0.01 and 1 K·min-1; B) Comparison of original
thermogram obtained at 0.01 K·min-1 and the treated one to reduce noise.
Source: Menezes et al. (2020)
The peak temperature may be considered as an estimate when curves overlap
or the onset or endset are not well-defined, although it does not strictly represent an
equilibrium point (MENEZES et al., 2019). In this work, peak temperatures
representing the dissociation of the methane hydrate are those corresponding to the
minimum heat flow (transition 2 in both Figure 8.3A and 8.3B). Overlapped peaks
observed in Figure 8.3 and numbered by 1 and 3 might be due to crystalline
234
heterogeneity caused by a non-uniform distribution of nuclei and different growth rates.
Those peaks did not appear in the thermograms at 20 MPa. Further analysis based on
X-Ray diffraction or polarized light optical microscopy would be necessary to determine
the origin of those transitions, but they do not affect the interpretation of high-pressure
thermograms concerning the inhibition effect, and hence are out of the scope of this
work.
Table 8.1 shows a comparison between our experimental data obtained up to 20
MPa and literature values by using high-pressure microcalorimetry. For higher
pressures, experimental data corresponding to our work conditions were not found in
literature. The onset temperatures for systems containing inhibitors obtained in this
work at 1.0 K·min-1 and 0.01 K·min-1 are very similar (experiments 6 and 7 for
[BMIM][Cl], 13 and 14 for [BMIM][Br]). Likewise, a very good agreement was also
observed for peak temperatures obtained in this work at 1 K·min-1 and endset
temperatures obtained at 0.01 K·min-1 in the literature for ~20 MPa (experiments 11
and 12 for [BMIM][Cl], 18 and 19 for [BMIM][Br]). Differences between these
temperatures are slightly higher (~1 K) at 9.6 MPa (experiments 6 and 8 for [BMIM][Cl],
13 and 15 for [BMIM][Br]). However, at this pressure several possible endset
temperatures were found, due to the existence of overlapped transitions (experiments
7 and 14 for [BMIM][Cl] and [BMIM][Br], respectively), which would match perfectly with
peak temperatures obtained at 1 K·min-1 in experiments 6 and 13 for both ionic liquids,
but were not considered in literature.
A good agreement was also observed between experimental dissociation
temperatures of methane hydrate in the absence of inhibitor and literature data
obtained from PVT measurements and model predictions. Thus, considering a) the
ambiguity of determining onset and endset temperatures previously described, which
can lead to misinterpreted results, b) the necessity of using a smoothing function to
treat data at 0.01 K·min-1 to reduce noise, c) the necessary compromise between the
time of analysis and quality of the results, and d) the need to minimize the wear of the
high-pressure cells at extreme conditions, the peak temperatures obtained at 1.0
K·min-1 are considered to represent conveniently the equilibrium temperature of
methane hydrate dissociation in the presence of inhibitors. A standard deviation of ~0.3
K for peak temperatures by HP-µDSC at 1.0 K·min-1 in the determination of methane
hydrate dissociation temperature at 21 MPa was presented in a previous work
235
(MENEZES et al., 2018). Xiao and Adidharma (2009) used a dissociation rate of 0.3
K·min-1 and admitted that no improvement of accuracy is observed at lower rates.
Table 8.1 – Comparison between experimental data of CH4 hydrates dissociation in the absence and in the presence of ionic liquids obtained in this work and found in the literature.
1 This work 0 9.6 1 281.47 285.12 286.08 290.43 - -
2 Literature a 0 9.58 - - 285.7* - - - -
3 Literature b 0 9.54 - - 285.7* - - - -
4 Literature c 0 9.55 - - 285.8* - - - -
5 Multiflash 0 9.6 - - 285.77# - - - -
[BMIM][Cl]
6 This work 10 9.6 1 280.2 283.6 285.9 289.7 - -
7 This work 10 9.6 0.01 279.9 - 282.2 284.9 285.7 -
8 Literature d 10 9.6 0.01 - - - 284.92 - -
9 Literature e 10 10.7 0.01 - - - 285.98 - -
10 Literature e 10 14.7 0.01 - - - 289.01 - -
11 This work 10 20 1 288.73 - 291.37 - 293.7 -
12 Literature e 10 20.7 0.01 - - - 291.25 - -
[BMIM][Br]
13 Literature d 9.7 9.6 1 284.29 - 286.08 288.2 - -
14 This work 9.7 9.6 0.01 283.96 - 284.54 285.36 286.18 286.9
15 Literature d 10 9.6 0.01 - - - 285.13 - -
16 Literature e 10 10.6 0.01 - - - 285.87 - -
17 Literature e 10 14.5 0.01 - - - 288.79 - -
18 This work 9.7 20 1 289.87 - 291.67 - 293.58 -
19 Literature e 10 20.4 0.01 - - - 291.59 - -
a Mohammadi et al. (2005); b Nakamura et al. (2003); c Yang (2000); d Sabil et al. (2015); e Xiao et al. (2010); * These data were obtained in a PVT cell by isochoric method; # Model prediction.
Source: Menezes et al. (2020)
Tables 8.2 and 8.3 present the equilibrium data obtained for ice and methane
hydrate, respectively, formed in the absence and in the presence of each inhibitor at
different concentrations and pressures. For the sake of completeness, both onset and
peak temperatures are presented. Model predictions without inhibitor show slightly
higher equilibrium temperatures than those represented by onset points. As previously
mentioned in this work, this may be due to a more significant presence of empty
cavities in real hydrate structures, leading to a less stable configuration with lower
dissociation temperatures (MENEZES et al., 2019). Likewise, since literature data in
the absence of inhibitor were obtained by an isochoric method in a PVT cell, they are
also slightly higher than onset temperatures obtained by HP-µDSC, where no mixing
is possible, and consequently mass transfer is less favored to fill cavities.
236
The difference between onset and peak dissociation temperatures is notable for
inhibited systems and increases when pressure increases. Such difference is not so
significant for non-inhibited hydrates, since the dissociation curves are narrower in
these cases. Ionic liquids can compose hydrate structures by both hosting cationic
chains as “guest” inside cages and incorporating anionic molecules in the hydrate
framework, instead of water molecules (DESCHAMPS; DALMAZZONE, 2010;
DYADIN; UDACHIN, 1987; JEFFREY, 1984; KOBORI et al., 2015; LI et al., 2010). A
similar phenomenon may happen by using methanol as a hydrate inhibitor
(MCLAURIN et al., 2014; SHIN et al., 2013; WALLQVIST, 1992). Therefore, the
incorporation of the inhibitor molecules either in the hydrate lattice or trapped in cavities
could affect the structural heterogeneity and hence the characteristic properties of the
hydrate, shifting the equilibrium point and extending the dissociation process or leading
to overlapped transitions that difficult onset determination, as observed in samples
containing about 10 and 15 mol% of [BMIM][Br], for instance, in which two onset points
can be established in most thermograms.
Table 8.2 – Ice melting temperatures (onset and peak) in the absence and presence of different inhibitors.
a Jager and Sloan (2001); b Jager (2001); c Dyadin and Aladko (1996); d Nakano et al. (1999).
Source: Menezes et al. (2020)
8.4.2 Thermodynamic inhibition efficiency of [BMIM][Br] and [BMIM][Cl]
Figure 8.3 compares the dissociation temperature reduction resulting from the
addition of both ionic liquids, considering the non-inhibited methane hydrate as
reference. [BMIM][Cl] presents a better inhibitory effect, considering both the onset and
peak temperatures. Hydrates formed in the presence of this chloride-based IL present
lower dissociation temperatures. The inhibition efficiency is even better as the IL
content increases, i.e., the inhibitory effect of [BMIM][Cl] is more significant than
[BMIM][Br] at higher IL fractions. Similar results are found in previous studies with Cl-
and Br- as IL anions (RICHARD; ADIDHARMA, 2013; XIAO et al., 2010). Some works
238
indicate that the electrical conductivity of [BMIM][Cl] in aqueous solutions is higher than
for [BMIM][Br], which may be correlated to the thermodynamic effectivity of the IL as
gas hydrate inhibitor (SABIL et al., 2015; XIAO et al., 2010). Xiao et al. (2010) report
that chloride ionic liquids form stronger hydrogen bonds with water molecules,
according to infrared spectra results. Therefore, both phenomena may be related to
the better performance of [BMIM][Cl] as a gas hydrate inhibitor.
The difference between onset and peak temperatures also increases for higher
contents of IL, which was expected since the presence of ILs leads to broader hydrate
dissociation curves, as previously mentioned. Considering onset temperatures, a slight
trend of greater inhibition efficiency is observed at higher pressures for the same
composition, as shown in Figure 8.5. This phenomenon was also observed by Richard
and Adidharma (2013) for 1-ethyl-3-methylimidazolium chloride [EMIM][Cl] and 1-
ethyl-3-methylimidazolium bromide [EMIM][Br].
Figure 8.5 – Inhibitor efficiency in reducing the hydrate dissociation temperatures.
Source: Menezes et al. (2020)
8.4.3 Comparison with methanol
Considering that methanol is the most applied commercial inhibitor of hydrates,
thermograms of methane hydrate dissociation are compared in Figure 8.6 by using
both ionic liquids and methanol at the same molar fraction (5 mol%). The non-inhibited
systems present smaller fractions of hydrate at 5 mol% than using both ILs and
methanol. As previously mentioned, the acceleration of hydrate formation by
employing usual thermodynamic inhibitors and ionic liquids has been reported in the
literature (AMTAWONG et al., 2016; BOBEV; TAIT, 2004; CHA et al., 2013; KE et al.,
2013; LEE et al., 2016; MCLAURIN et al., 2014; SOWA et al., 2014; SOWA et al.,
2015;). Therefore, the inhibitors investigated in this work seem to contribute to hydrate
239
formation and growth at low concentrations. Nevertheless, both [BMIM][Br] and
[BMIM][Cl] are more efficient thermodynamic inhibitors than methanol in terms of molar
concentrations. The [BMIM][Cl] is the most effective one, shifting the hydrate
dissociation curve about 7.0 K in all cases (5 mol%). Moreover, it presents the lowest
promoting effect on hydrate formation, since its hydrate dissociation curves at 20, 60,
and 100 MPa are smaller than the [BMIM][Br] and methanol ones, considering that the
amounts of aqueous solutions inside the cell were similar. The lower amounts of
hydrate formed in the presence of [BMIM][Cl] indicate a slower hydrate growth. Thus,
this IL seems to be the least effective kinetic promoter, and therefore the most
interesting hydrate inhibitor in terms of molar concentrations.
Figure 8.6 – Comparison of CH4 hydrate dissociation (⁎) by using different inhibition solutions (5 mol% inhibitor) at 20, 60 and 100 MPa.
Source: Menezes et al. (2020)
240
Figure 8.7 indicates the equilibrium curves by using inhibitors at 10 wt%
(corresponding about 1 mol% IL) and 5 mol%. The curves were drawn from
experimental data by considering the peak temperatures, since the onset points for
methanol-inhibited systems are difficult to determine due to the existence of
overlapped transitions, as previously mentioned. Predictions for methane hydrate
forming systems in the presence of NaCl and NaBr were also included to compare the
performance of these common salts with the one provided by the studied ILs.
Figure 8.7 – Comparison of CH4 hydrate equilibrium lines by using different inhibitors (experimental data and predictions using Multiflash): A) Constant molar fraction: Experimental (No inhibitor);
Despite the good performance of [BMIM][Cl] and [BMIM][Br] as hydrate inhibitors
compared to methanol at the same molar fraction, the amount of 5 mol% represents a
high content of inhibitor in terms of mass fraction (30-40 wt%) when compared to the
usually employed concentrations, either using methanol or ethylene glycol. Although
in some cases up to 50 wt% of inhibitors are required to avoid hydrate formation, about
10 wt% is the fraction of thermodynamic inhibitors typically used in industrial
applications and scientific studies (SLOAN; KOH, 2008; TARIQ et al., 2014; ZARE et
al., 2013). This mass fraction corresponds to about 1 mol% of ILs studied in this work.
For this concentration, the equilibrium curve is shifted by about 2.0 K, according to
Table 8.3, while methanol shifts the curve in 4.0-5.0 K, according to the literature
(SLOAN; KOH, 2008), and to the results presented in this work. Comparing mass
241
fractions, NaCl presents similar performance to methanol, and NaBr is slightly better
than the studied ILs. However, NaCl is not recommended for oil and gas pipelines as
it increases corrosion rate (RUSTANDY et al., 2012), and some oilfield tubular
materials are susceptible to pitting and localized corrosion in the presence of NaBr (KE
et al., 2004).
To sum up, considering the mass fraction, methanol could be still selected as the
best option for hydrate thermodynamic inhibition. Moreover, the expensive processes
of ILs synthesis still make them economically unfeasible compared to methanol,
although new perspectives have arisen for cheaper IL-based inhibitors (ALTAMASH et
al., 2018). Methanol acts as a stronger catalyst for hydrate formation reactions but, as
previously mentioned, the cost-benefit ratio must be assessed when choosing a gas
hydrate inhibitor and the feasibility of IL-methanol mixtures as inhibition solutions.
8.5 CONCLUSION
New experimental hydrate dissociation data are presented in this chapter by
using inhibition additives at pressures from 9.6 to 100 MPa via microcalorimetric
measurements. Two ionic liquids, [BMIM][Cl] and [BMIM][Br], were evaluated as
methane hydrate inhibitors. Their performance was compared to methanol in terms of
molar and mass fractions and to predictions made for other salts (NaCl and NaBr).
• A rigorous analysis of thermograms interpretation has been carried out to
compare experimental hydrate dissociation temperatures obtained herein with
literature data. Although the results indicate that these additives promote the
hydrate growth when at low concentrations, all of them act as thermodynamic
inhibitors for methane hydrates, shifting the phase equilibrium curves to lower
temperatures.
• The increase in the content of these ILs improves the thermodynamic inhibition
effect considerably, mainly for [BMIM][Cl], but methanol presents better results in
terms of mass fractions. However, one must consider the dual inhibition effect
observed at high concentrations (~ 15 mol%), characteristic of the studied ionic
liquids, which allows not only to shift the hydrate equilibrium curve to lower
temperatures but also to retard nucleation and reduce hydrate growth rate. This
effect is especially relevant for the production, processing, and transportation of
242
oil and gas in offshore platforms, where extreme pressure conditions and low
temperatures are favorable for hydrate formation.
REFERENCES
ALTAMASH, T.; KHRAISHEH, M.; QURESHI, M.F.; SAAD, M.A.; APARICIO, S.; ATILHAN, M.; Cost-effective alkylammonium formate-based protic ionic liquids for methane hydrate inhibition. Journal of Natural Gas Science and Engineering, v. 58, p. 59-68, 2018. AMTAWONG, J.; GUO, J.; HALE, J.S.; SENGUPTA, S.; FLEISCHER, E.B.; MARTIN, R.W.; JANDA, K.C. Propane Clathrate Hydrate Formation Accelerated by Methanol. Journal of Physical Chemistry Letters, v. 7, p. 2346−2349, 2016. ANGELL, C.A.; BYRNE, N.; BELIERES, J.-P. Parallel developments in aprotic and protic ionic liquids: physical chemistry and applications. Accounts of Chemical Research, v. 40 (11), p. 1228–1236, 2007. BHATTACHARJEE, G.; KUSHWAHA, O. S.; KUMAR, A.; KHAN, M. Y.; PATEL, J. N.; KUMAR, R. Effects of micellization on growth kinetics of methane hydrate. Industrial and Engineering Chemistry Research, v. 56 (13), p. 3687-3698, 2017. BLESIC, M.; MARQUES, M.H.; PLECHKOVA, N.V.; SEDDON, K.R.; REBELO, L.P.N.; LOPES, A. Self-aggregation of ionic liquids: micelle formation in aqueous solution. Green Chemistry, v. 9, p. 481-490, 2007. BOBEV, S.; TAIT, K.T. Methanol - inhibitor or promoter of the formation of gas hydrates from deuterated ice? American Mineralogist, 89 (8−9), p. 1208−1214, 2004. CHA, M., HU, Y., SUM, A.K. Methane hydrate phase equilibrium for systems containing NaCl, KCl, and NH4Cl. Fluid Phase Equilibria, v. 413, p. 2-9, 2016. CHA, M.; SHIN, K.; KIM, J.; CHANG, D.; SEO, Y.; LEE, H.; KANG, S. P. Thermodynamic and kinetic hydrate inhibition performance of aqueous ethylene glycol solutions for natural gas. Chemical Engineering Science, v. 99, p. 184−190, 2013. CHEN, Q.; YU, Y.; ZENG, P.; YANG, W.; LIANG, Q.; PENG, X.; LIU, Y.; HU, Y. Effect of 1-butyl-3-methylimidazolium tetrafluoroborate on the formation rate of CO2 hydrate. Journal of Natural Gas Chemistry, v.17 (3), p. 264-267, 2008. CHONG, Z. R.; YANG, S.H.B.; BABU, P.; LINGA, P.; LI, X.S. Review of natural gas hydrates as an energy resource: Prospects and challenges. Applied Energy, v. 162, p. 1633-1652, 2016. DALMAZZONE, D.; HAMED, N.; DALMAZZONE, C. DSC measurements and modelling of the kinetics of methane hydrate formation in water-in-oil emulsion. Chemical Engineering Science, v. 64, p. 2020-2026, 2009.
243
DALMAZZONE, D.; SALES SILVA, L. P.; DELAHAYE, A.; FOURNAISON, L. Calorimetric Characterization of Clathrate and Semiclathrate Hydrates. Chapter 4 in book “Gas Hydrates: Fundamentals, Characterization and Modeling”, First Edition. Edited by Daniel Broseta, Livio Ruffine and Arnaud Desmedt. ISTE Ltd 2017. Published by ISTE Ltd and John Wiley & Sons, Inc. DARABOINA, N.; MALMOS, C.; SOLMS, N. Investigation of kinetic hydrate inhibition using a high pressure micro differential scanning calorimeter. Energy and Fuels, v. 27 (10), p. 5779– 5786, 2013. DESCHAMPS, J.; DALMAZZONE, D. Hydrogen storage in semi clathrate hydrates of tetrabutyl ammonium chloride and tetrabutylphosphonium bromide. Journal of Chemical and Engineering Data, v. 55, p. 3395−3399, 2010. DI PROFIO, P.; ARCA, S.; GERMANI, R.; SAVELLI, G. Surfactant promoting effects on clathrate hydrate formation: are micelles really involved?. Chemical Engineering Science, v. 60 (15), p. 4141-4145, 2005. DUNAEVA, A. N.; ANTSYSHKIN, D. V.; KUSKOV, O. L. Phase diagram of H2O: thermodynamic functions of the phase transitions of high-pressure ices. Solar System Research, v. 44 (3), p. 202–222, 2010. DUPONT, J. On the solid, liquid and solution structural organization of imidazolium ionic liquids. Journal of the Brazilian Chemical Society, v. 15 (3), p. 341-350, 2004. DYADIN, Y. A.; ALADKO, E. Y. Decomposition of the methane Hydrate up to 10 kbar. International Conference on Natural Gas Hydrates (1996) Toulouse, France, June 2-6, p. 67-70, 1996. DYADIN, Y.A.; UDACHIN, K.A. Clathrate polyhydrates of peral kylonium salts and their analogs. Journal of Structural Chemistry, v. 28, 394-432, 1987. FARHADIAN, A.; KUDBANOV, A.; VARFOLOMEEV, M. A.; DALMAZZONE, D. Waterborne Polyurethanes as a New and Promising Class of Kinetic Inhibitors for Methane Hydrate Formation. Nature Scientific Reports, v. 9, 9797, 2019. GUPTA, A.; LACHANCE, J.; SLOAN, E.D.; KOH, C.A. Measurements of methane hydrate heat of dissociation using high pressure differential scanning calorimetry. Chemical Engineering Science, v. 63 (24), p. 5848-5853, 2008. HAGHIGHI, H.; CHAPOY, A.; BURGESS, R.; TOHIDI, B. Experimental and thermodynamic modelling of systems containing water and ethylene glycol: application to flow assurance and gas processing. Fluid Phase Equilibria, v. 276 (1), p. 24–30, 2009. HU, Y.; MAKOGON, T.Y.; KARANJKAR, P.; LEE, K.; LEE, B.; SUM, A.K. Gas hydrates phase equilibria and formation from high concentration NaCl brines up to 200 MPa. Journal of Chemical & Engineering Data, v. 62 (6), p. 1910–1918, 2017.
244
JAGER, M. D. High pressure studies of hydrate phase inhibition using raman spectroscopy. Ph.D. Thesis, Colorado School of Mines, Golden, Colorado, USA, 2001. JAGER, M. D., SLOAN, E. D. The effect of pressure on methane hydration in pure water and sodium chloride solutions. Fluid Phase Equilibria v. 185, p. 89-99, 2001. JEFFREY, G.A. Hydrate inclusion compounds. Journal of Inclusion Phenomena, v. 1 (3), p. 211-222, 1984. KE, M.; JAVORA, P. H.; QU, Q. Application of pH buffer as corrosion inhibitor in nabr brine packer fluids at high temperatures. Society of Petroleum Engineers, 87563-MS, 2004. KE, W.; SVARTAAS, T. M.; ABAY, H.K. Effects of Low Concentration Methanol, PVP and PVCap on Structure-I Methane Hydrate Formation. Journal Energy and Power Engineering, v. 7, p. 432−439, 2013. KELLAND, M.A. History of the development of low dosages hydrate inhibitors. Energy and Fuels, v. 20 (3), p. 825-847, 2006. KIM, K. S.; KANG, J. W.; KANG, S. P. Tuning ionic liquids for hydrate inhibition. Chemical Communications, v. 47 (2011) 6341–6343. KINNARI, K.; HUNDSEID, J.; LI, X.; ASKVIK, K.M. Hydrate Management in Practice. Journal of Chemical & Engineering Data, v. 60 (2), p. 437-446, 2015. KOBORI, T.; MUROMACHI, S.; YAMASAKI, T.; TAKEYA, S.; YAMAMOTO, Y.; ALAVI, S.; OHMURA, R. Phase Behavior and Structural Characterization of Ionic Clathrate Hydrate Formed with Tetra-n-butylphosphonium Hydroxide: Discovery of Primitive Crystal Structure. Crystal Growth and Design, v. 15 (8), p. 3862-3867, 2015. KOH, C.A.; SLOAN, E.D.; SUM, A.K.; WU, D.T. Fundamentals and applications of gas hydrates. Annual Review of Chemical and Biomolecular Engineering, v. 2, p. 237-257, 2011. KOH, C.A.; WESTACOTT, R.E.; ZHANG, W.; HIRACHAND, K.; CREEK, J.L.; SOPER, A.K. Mechanisms of gas hydrate formation and inhibition. Fluid Phase Equilibria, v. 194–197, p. 143-151, 2002. KOUAKOU, A.C.; MAPIHAN, K.L.; PAULY, J. Solid–liquid equilibria under high pressure of pure fatty acid methyl esters. Fuel, v. 109, p. 297-302, 2013. KUMAR, A.; BHATTACHARJEE, G.; KULKARNI, B. D.; KUMAR, R. Role of surfactants in promoting gas hydrate formation. Industrial and Engineering Chemistry Research, v. 54, p. 12217−12232, 2015. LE PARLOUËR, P.; DALMAZZONE, C.; HERZHAFT, B.; ROUSSEAU, L.; MATHONAT, C. Characterization of gas hydrates formation using a new high pressure micro-DSC. Journal of Thermal Analysis and Calorimetry, v. 78, p. 165–172, 2004.
245
LEE, W.; SHIN, J.Y.; KIM, K.S.; KANG, S.P. Kinetic Promotion and Inhibition of Methane Hydrate Formation by Morpholinium Ionic Liquids with Chloride and Tetrafluoroborate Anions. Energy and Fuels, v. 30 (5), p. 3879-3885, 2016. LI, S.; FAN, S.; WANG, J.; LANG, X.; WANG, Y. Semicathrate hydrate phase equilibrium for CO2 in the presence of tetra-n-butyl ammonium halide (bromide, chloride, or fluoride). Journal of Chemical Engineering Data, v. 55, 3212−3215, 2010. LINJUN, W.; XUEMIN, Z.; HONGHUI, LI.; SHAO, L.; ZHANG, D.; JIAO, L. Theory research on desalination of brackish water using gas hydrate method. Advanced Materials Research, v. 616-618, p. 1202-1207, 2013. MCLAURIN, G.; SHIN, K.; ALAVI, S.; RIPMEESTER, J.A. Antifreezes act as catalysts for methane hydrate formation from ice. Angewandte Chemie International Edition, v. 53 (39), p. 10429-10433, 2014. MENEZES, D.E.S.; RALHA, T.W.; FRANCO, L.F.M., PESSÔA FILHO, P.A.; ROBUSTILLO, M.D. Simulation and experimental study of methane-propane hydrate dissociation by high pressure differential scanning calorimetry. Brazilian Journal of Chemical Engineering, v. 35, p. 403-414, 2018. MENEZES, D.E.S.; SUM, A. K.; DESMEDT, A.; PESSOA FILHO, P. A.; ROBUSTILLO, M.D. Coexistence of sI and sII in methane-propane hydrate former systems at high pressures. Chemical Engineering Science, v. 208, article 115149, 2019. MENEZES, D.E.S.; PESSÔA FILHO, P.A.; ROBUSTILLO, M.D. Use of 1-Butyl-3-methylimidazolium-based ionic liquids as methane hydrate inhibitors at high-pressure conditions. Chemical Engineering Science, v. 212, 115323, 2020. MISKOLCZY, Z.; SEBOK-NAGY, K.; BICZOK, L.; GOKTURK, S. Aggregation and micelle formation of ionic liquids in aqueous solution. Chemical Physics Letters, v. 400 (4-6), p. 296-300, 2004. MOHAMMADI, A. H.; ANDERSON, R.; TOHIDI, B. Carbon monoxide clathrate hydrates: experimental equilibrium data and thermodynamic modeling. American Institute of Chemical Engineers, v. 51, p. 2825 – 2833, 2005. MOHAMMADI, A.H., RICHON, D. Phase equilibria of methane hydrates in the presence of methanol and/or ethylene glycol aqueous solutions. Industrial and Engineering Chemistry Research, v. 49 (2), p. 925–928, 2010. NAKAMURA, T.; MAKINO, T.; SUGAHARA, T.; OHGAKI, K. Stability boundaries of gas hydrates helped by methane - structure-H hydrates of methylcyclohexane and cis-1,2-dimethylcyclohexane. Chemical Engineering Science, v. 58, p. 269–273, 2003. NAKANO, S.; MORITOKI, M.; OHGAKI, K. High-Pressure Phase Equilibrium and Raman Microprobe Spectroscopic Studies on the Methane Hydrate System. Journal of Chemical and Engineering Data, v. 44, p. 254-257, 1999.
246
NISHIKAWA, K.; WANG, S.; KATAYANAGI, H.; HAYASHI, S.; HAMAGUCHI, H.O.; KOGA, Y.; TOZAKI, K. Melting and Freezing Behaviors of Prototype Ionic Liquids, 1-Butyl-3-methylimidazolium Bromide and Its Chloride, Studied by Using a Nano-Watt Differential Scanning Calorimeter. Journal of Physical Chemistry B, v. 111 (18), p. 4894-4900, 2007. OKUTANI, K.; KUWABARA, Y.; MORI, Y.H. Surfactant effects on hydrate formation in an unstirred gas/liquid system: An experimental study using methane and sodium alkyl sulfates. Chemical Engineering Science, v. 63 (1), p. 183−194, 2008. QURESHI, M.F.; ATILHAN, M.; ALTAMASH, T.; TARIQ, M.; KHRAISHEH, M.; APARICIO, S.; TOHIDI, B. Gas hydrate prevention and flow assurance by using mixtures of ionic liquids and synergent compounds: combined kinetics and thermodynamic approach. Energy and Fuels 30 (4), 3541–3548, 2016. RAE, P.J.; DATTELBAUM, D.M. The properties of poly(tetrafluoroethylene) (PTFE) in compression. Polymer, v. 45, p. 7615-7625 (2004). RICHARD, A. R.; ADIDHARMA, H. The performance of ionic liquids and their mixtures in inhibiting methane hydrate formation. Chemical Engineering Science, v. 87, p. 270−276, 2013. RIGBY, H.A.; BUNN, C.W. A room-temperature transition in polytetrafluoroethylene. Nature, v. 164, p. 583, 1949. RUSTANDY A.; ADYUTATAMA, M.; FADLY, E.; SUBEKTI, N. Corrosion rate of carbon steel for flowline and pipeline as transmission pipe in natural gas production with CO2 content. Makara Journal of Technology, v. 16:1, p. 57-62, 2012. SABIL, K.M.; NASHED, O.; LAL, B.; ISMAIL, L.; JAPPER-JAAFAR, A. Experimental investigation on the dissociation conditions of methane hydrate in the presence of imidazolium-based ionic liquids. The Journal of Chemical Thermodynamics, v. 84, p.7-13, 2015. SAHLE, C.J.; STERNEMANN, C.; SCHMIDT, C.; LEHTOLA, S.; JAHN, S.; SIMONELLI, L.; HUOTARI, S.; HAKALA, M.; PYLKKÄNEN,T.; NYROW, A.; MENDE, K.; TOLAN, M.; HÄMÄLÄINEN, K.; WILKE, M. Microscopic structure of water at elevated pressures and temperature. Proceedings of the National Academy of Sciences, v. 110 (16), p. 6301-6306, 2013. SAMI, N.A.; SANGWAI, J.S.; SUBRAMANIAN, B. Gas hydrate Applications and problems in Oil and Gas Industry. International Journal of Scientific & Engineering Research, v. 4 (8), 2013. SANTOS, L.C., ABUNAHMAN, S.S., TAVARES, F.W., AHÓN, V.R.R., KONTOGEORGIS, G.M. Cubic Plus Association Equation of State for Flow Assurance Projects. Industrial & Engineering Chemistry Research, v. 54, p. 6812-6824, 2015. SANZ, E.; VEJA, C.; ABASCAL, J.L.; MACDOWELL, L.G. Phase diagram of water from computer simulation. Physical Review Letters, v. 92 (25): 255701, 2004.
247
SHEN, X.; SHI, L.; LONG, Z.; ZHOU, X.; LIANG, D. Experimental study on the kinetic effect of N-butyl-N-methylpyrrolidinium bromide on CO2 hydrate. Journal of Molecular Liquids, v. 223, p. 672–677, 2016. SHIN K.; UDACHIN, K.A.; MOUDRAKOVSKI, I.L.; LEEK, D.M.; ALAVI, S.; RATCLIFFE, C.I.; RIPMEESTER, J.A. Methanol incorporation in clathrate hydrates and the implications for oil and gas pipeline flow assurance and icy planetary bodies. Proceedings of the National Academy of Sciences, v. 110 (21), p. 8437–8442, 2013. SLOAN E.D.; KOH, C. Clathrate hydrates of natural gases, 3rd ed. Boca Raton: CRC Press, 2008. SLOAN, E.D.; KOH, C.A.; SUM, A.K. Natural Gas Hydrates in Flow Assurance. Gulf Professional Publishing (Elsevier), Oxford, U.K., 2010. SOWA, B.; ZHANG, X.H.; HARTLEY, P.G.; DUNSTAN, D.E.; KOZIELSKI, K.A.; MAEDA, N. Formation of Ice, Tetrahydrofuran Hydrate, and Methane/Propane Mixed Gas Hydrates in Strong Monovalent Salt Solutions. Energy and Fuels, v. 28 (11), p. 6877−6888, 2014. SOWA, B.; ZHANG, X.H.; KOZIELSKI, K.A.; HARTLEY, P.G.; DUNSTAN, D.E.; MAEDA, N. Nucleation Probability Distributions of Methane− Propane Mixed Gas Hydrates in Salt Solutions and Urea. Energy and Fuels, v. 29 (10), p. 6259−6270, 2015. SUN Z., MA R., FAN S., GUO K., WANG R. Investigation on gas storage in methane hydrate. Journal of Natural Gas Chemistry, v. 13, p. 107–112, 2004. SUN, Z.; WANG, R.; MA, R.; GUO, K.; FAN, S. Natural gas storage in hydrates with the presence of promoters. Energy Conversion and Management, v. 44, p. 2732-2742, 2003. TARIQ, M.; CONNOR, E.; THOMPSON, J.; KHRAISHEH, M.; ATILHAN, M.; ROONEY, D. Doubly dual nature of ammonium-based ionic liquids for methane hydrates probed by rocking-rig assembly. Royal Society of Chemistry Advances, v.6 (28), p. 23827–23836, 2016. TARIQ, M.; ROONEY, D.; OTHMAN, E.; APARICIO, S.; ATILHAN, M.; KHRAISHEH, M. Gas Hydrate Inhibition: A Review of the Role of Ionic Liquids. Industrial and Engineering Chemistry Research, v. 53, p. 17855−17868, 2014. VAN DER WAALS, J. H., PLATTEEUW, J.C. Clathrate solutions, Advances in Chemical Physics, v. 2, p. 1-57, 1959. VOROTYNTSEV, V.M.; MALYSHEV, V.M. Gas hydrates: nanosized phases in the separation and purification of substances by crystallization. Russian Chemical Reviews, v. 80 (10), p. 971-991, 2011.
248
WALLQVIST, A. On the stability of type I gas hydrates in the presence of methanol. The Journal of Chemical Physics, v. 96 (7), 1992. WATANABE, K.; IMAI, S.; MORI, Y.H. Surfactant effects on hydrate formation in an unstirred gas/liquid system: An experimental study using HFC-32 and sodium dodecyl sulfate. Chemical Engineering Science, v. 60 (17), p. 4846−4857, 2005. XIAO, C.; ADIDHARMA, H. Dual function inhibitors for methane hydrate. Chemical Engineering Science, v. 64, p. 1522−1527, 2009. XIAO, C.; WIBISONO, N.; ADIDHARMA, H. Dialkylimidazolium halide ionic liquids as dual function inhibitors for methane hydrate. Chemical Engineering Science, v. 65, p. 3080−3087, 2010. XU, C.G.; ZHANGA, S.H.; CAI, J.; CHENA, Z.Y.; LI, X.S. CO2 (carbon dioxide) separation from CO2 e H2 (hydrogen) gas mixtures by gas hydrates in TBAB (tetra-n-butyl ammonium bromide) solution and Raman spectroscopic analysis. Energy, v. 59, p. 719-725, 2013. YANG, S. O. Measurements and predictions of phase equilibria for water + natural gas components in hydrate-forming conditions. PhD Thesis, Korea University, Seoul, 2000. ZARE, M.; HAGHTALAB, A.; AHMADI, A.N.; NAZARI, K. Experiment and thermodynamic modeling of methane hydrate equilibria in the presence of aqueous imidazolium-based ionic liquid solutions using electrolyte cubic square well equation of state. Fluid Phase Equilibria, v. 341, p. 61−69, 2013. ZARE, M.; HAGHTALAB, A.; AHMADI, A.N.; NAZARI, K.; MEHDIZADEH, A. Effect of imidazolium based ionic liquids and ethylene glycol monoethyl ether solutions on the kinetic of methane hydrate formation. Journal of Molecular Liquids, v. 204, p. 236-242, 2015. ZHANG, J.S.; LEE, S.; LEE, J.W. Does SDS micellize under methane hydrate-forming conditions below the normal Krafft point?. Journal of Colloid and Interface Science, v. 315 (1), p. 313−318, 2007. ZHONG, Y.; ROGERS, R.E. Surfactant effects on gas hydrate formation. Chemical Engineering Science, v. 55, p. 4175-4187, 2000.
249
CHAPTER 9
CONCLUSIONS AND RECOMMENDATIONS
9.1 SUMMARY OF CONCLUSIONS
The main conclusions obtained throughout this work are summarized below. The
full descriptions can be verified at the end of each chapter.
Chapter 3 presents preliminary studies related to relevant factors to be
considered on planning the experiments and analyzing the thermograms. The study
on phase diagrams of hydrate-forming species indicated that phase change-related
transitions should occur in experiments containing C2H6 or CO2 when below their
respective critical pressures, which was confirmed in thermograms presented in
Chapter 4. The previous study of gas mixtures diagrams allowed to avoid the
coexistence of heterogeneous phases inside the cell (HP-µDSC), by working at higher
pressures than found in the liquid-vapor envelopes. Moreover, the computational
predictions presented in this chapter indicate that the water fraction has a negligible
effect on the hydrate dissociation temperature, considering the conditions required for
practical applications of the gas hydrates. The Peng-Robinson was considered
adequate to estimate the overall composition in isochoric measurements using the HP-
µDSC. Finally, this chapter introduces to the reader an unexpected transition observed
in several analyzes throughout the work, related to the structural change of Teflon,
especially when using hydrate inhibiting additives.
Chapter 4 presents new thermodynamic data based on microcalorimetry for
single hydrates of CH4, C2H6 and CO2 up to 100 MPa. Onset temperatures were found
to be the most reliable for estimating hydrate equilibrium when in absence of
overlapped transitions and approaches to CSMGem predictions. Multiflash predictions
move away from CSMGem ones as pressure increases, especially for ethane and
carbon dioxide hydrates. The increase in pressure led to higher hydrate dissociation
temperatures, while the ice melting temperatures decreased, in agreement with the
literature and the anomalous behavior of water. The influence of some experimental
factors by using HP-µDSC on the hydrate dissociation are also discussed in chapter
4. Dynamic effects play a significant role in the kinetics of hydrate formation, and hence
the water-sample size affects the proportion of ice and hydrate in single-guest hydrate-
250
forming systems, although the thermodynamic properties are not affected. The
cooling/heating rate slightly affects the onset temperatures since the structural
heterogeneity may change. However, the analyses at 1 K·min-1 can be significantly
shorter and are still accurate. A method based on multicycles analysis was also studied
in order to maximize the ice conversion to hydrate. Ethane systems noticeably required
more cycles to reach 90% of ice conversion to hydrate than methane and carbon
dioxide systems, likely due to the harder diffusion of these larger molecules through
the hydrate structure. On the other hand, the fraction of carbon dioxide hydrate formed
in the first cycle is much higher than hydrate fraction in methane and ethane systems,
due to the favored mass transfer by this molecule species. Applying the multicycles
method on HP-µDSC has shown to be much more accurate to estimate the enthalpy
of hydrate dissociation than the standard method. However, a slightly higher
heterogeneity seems to occur when performing multiple cycles. The hydrate layer
initially formed during the first cooling may hamper the gas molecules diffusion through
deeper regions of the droplet, affecting the filling of the cavities. Nevertheless, the
results obtained are still accurate and satisfactory for determining the dissociation
properties of single-gas hydrates.
The same chapter also shows the results of an alternative indirect method used
to calculate the enthalpy of hydrate dissociation using the Clapeyron Equation. The
hydrate volume was estimated by considering the effect of isobaric thermal expansivity
and isothermal compressibility factors on the lattice parameter. The results of hydration
number and enthalpy of dissociation obtained by the iterative method are consistent
for all single hydrates studied. Unpublished data for dissociation enthalpies of single
ethane and carbon dioxide hydrates, above the upper quadruple point, are also
presented in this chapter. The dissociation enthalpy calculated by the Clapeyron
equation is compared to the one determined by integrating the hydrate dissociation
curve from thermograms. The average deviations, along with their respective
confidence intervals (95%), indicate that the multicycles method and the hydration
number from the iterative method provide the most reliable results.
Chapter 5 presents new dissociation data for double-guest gas hydrates obtained
by HP-µDSC up to 100 MPa. Dynamic effects play an important role in filling the cages
for systems containing a gas mixture. Different solubilities and diffusivity in water
between gas species are factors that likely imply gradients of gas concentrations
251
through the aqueous phase. Then, the cavities of the hydrate structure should have
different occupancy degrees, leading to a heterogeneous phase. This phenomenon,
among others, should explain the lower onset temperatures when compared to
predictions. Ternary diagrams and pressure vs. temperature profiles based on
computational predictions were also built to elucidate the influence of gas composition
on the hydrate properties. The influence of the ratio between guest molecules size and
cages diameter on the hydrate stability and the cages occupancy degree are factors
addressed to explain the type (s) of structure formed and the hydrate dissociation
temperature profiles according to the gas phase composition. In case of CH4-C2H6
hydrate-forming systems, both sI and sII coexist at high methane concentrations, and
a secondary structure (sII) may also be formed as a metastable phase at low methane
concentrations. Experiments containing CH4 and C3H8, in turn, unexpectedly
presented the simultaneous formation of two structures, sI and sII, at high methane
contents. CH4-CO2 hydrates were experimentally studied at similar gas phase
compositions and varying the content of water. Differently from single-guest systems,
the amount of water added into the cell seems to affect more considerably the onset
temperatures of double-guest hydrates. Low content of water and high solubility and
diffusion coefficient of CO2 are factors that should contribute to a more heterogeneous
phase and explain the lower experimental dissociation temperatures than predictions.
Other factors are also referred to affect the hydrate stability and the dissociation
temperature as the pressure increases, such as the absence of methane in small
cavities and the reduction of the unit cell volume when the compressibility factor
overcomes the thermal expansivity, leading to a lower occupancy degree.
In the next chapter (6), hydrate-forming systems composed of methane-water
and methane-propane-water were investigated through the isochoric method, and
compared to microcalorimetric results. Equilibrium points obtained from the PVT-
isochoric method approach to onset temperatures of the hydrate dissociation curves
from HP-µDSC thermograms for both systems. Evidence are shown of the
simultaneous formation of sI and sII for CH4-C3H8-H2O systems at high pressures and
high methane contents. A higher kinetic of formation is found for sI, although sII is the
most thermodynamically stable structure. The effects of experimental factors on these
structures were also evaluated according to the methodology applied and the results
are discussed according to the characteristics of each experimental technique. High
252
cooling degrees affect mainly the amount of hydrate formed and may lead to slightly
higher dissociation temperatures as the increased driving force should favor the filling
of the hydrate structure. According to PVT-isochoric measurements, sI was favored by
mixing the system likely due to the addition of the mechanical energy and the better
solubility of methane in water compared to propane. Lower heating rate contributed
mainly to sII hydrate formation, considering the residence time in the hydrate zone is
higher. Although the use of multiycle procedures reveals most of sI as a metastable
structure, both experimental methods indicate that a small fraction of sI remains as a
stable configuration even after multiple cycles. Finally, increasing the methane fraction
in the gas phase showed the opposite effect on the results obtained by HP-µDSC and
the PVT-isochoric method.
Chapter 7 shows the main techniques used for structural analysis of gas hydrates
based on Raman spectroscopy. Ex situ analyses are more suitable than in situ ones
for characterization of stable structures, considering the faster conversion from ice to
hydrate and a more homogeneous solid phase. The results obtained for the CH4
hydrate agree to the literature data whereas the ones for CH4-C3H8 hydrates reveals
the complexity of determining their structural composition and the cages occupancy.
In the latter system, it is oserved that sII is predominant in all the three hydrates
samples evaluated. The increase in methane content led to a higher occupation of
large cavities by methane molecules, either due to the formation of a larger fraction of
structure I or because of methane molecules were hosted in large cavities of sII. On
the other hand, in situ analyses are interesting for studying the hydrate formation and
crystals growth process. The initial stage of CH4 hydrate formation was studied by two
different methods based on a capillary and a cylindrical cell. The results evidence the
prior formation of the small cavities and the progression of the cages occupancy
towards the aqueous phase.
Finally, chapter 8 presents new experimental hydrate dissociation data in the
presence of additives for hydrate inhibition, at pressures from 9.6 to 100 MPa via
microcalorimetric measurements. Two ionic liquids, [BMIM][Cl] and [BMIM][Br], were
evaluated as methane hydrate inhibitors, and their performance was compared to
methanol and predictions made for other salts (NaCl and NaBr). The experimental
hydrate dissociation temperatures obtained herein were also compared to literature
data. Although the results indicate that the additives employed promote the hydrate
253
growth when at low concentrations, all of them act as thermodynamic inhibitors for CH4
hydrates, shifting the phase equilibrium curves to lower temperatures. The increase in
the content of the ionic liquids improves the thermodynamic inhibition effect
considerably, mainly for [BMIM][Cl], but methanol presents better results in terms of
mass fractions. However, one should consider the dual inhibition effect of ILs observed
above certain concentrations, i.e., the shifting of the hydrate equilibrium curve to lower
temperatures, and decreasing the kinetic of crystals nucleation and growth.
9.2 RECOMMENDATIONS
As discussed above, the experimental configuration based on HP-µDSC, used in
this work, has shown to be a very promising and convenient tool to obtain hydrate
equilibrium and dissociation data. By considering the great advantages and limitations
indicated herein for each method applied, several topics can be studied further, as
suggested below:
• Determination of specific heat of gas hydrates: this thermodynamic property is also
important for predicting gas production from hydrate reservoirs and to managing
the operating conditions during explotation. Improvements in the thermal insulation
of the system and the recent relocation of pressure gauge in the experimental setup
should allow to determine accurately the specific heats based on information
provided by thermograms. Both isochoric and isobaric methods can be applied to
determine 𝐶𝑣 and 𝐶𝑝, respectively.
• Extending equilibrium data for double-guest hydrates: It is still necessary to study
different systems composed of gas mixtures. The study of CH4-CO2-H2O system is
of particular interest for the capture and storage of carbon dioxide in hydrate
reservoirs. The proper amount of water found in this work for studying CH4-CO2
hydrates can be used to investigate this system at different gas phase
compositions, since only mixtures containing about 55 mol% of CH4 were
investigated herein.
• Kinetic studies of gas hydrates formation: Several studies can be performed with
respect to the kinetics of gas hydrate formation. For instance, the induction time
required to form hydrate at isothermal conditions should elucidate the kinetic of
formation of different structures present in double-guest systems. The multicycles
254
method, coupled with isothermal studies, is another interesting tool for investigating
secondary or metastable structures.
• Structural analysis of double-guest hydrates: Raman spectroscopy is also a
powerful tool for understanding the coexistence of different hydrate structures in
systems composed by a gas mixture. Although the determination of occupancy
degree for CH4-C3H8 hydrates was not managed in this work, the structural
analyses by Raman spectroscopy were relevant for the conclusions obtained.
Thus, similar studies for CH4-C2H6 and CH4-CO2 hydrates, including attempting to
determine cages occupancy, are encouraged.
255
CHAPTER 10
SCIENTIFIC PRODUCTION
10.1 ARTICLES PUBLISHED IN SCIENTIFIC JOUNALS
• MENEZES, D. E. S.; PESSÔA FILHO, P.A.; ROBUSTILLO, M. D. Use of 1-Butyl-
3-methylimidazolium-based ionic liquids as methane hydrate inhibitors at high-
pressure conditions. Chemical Engineering Science, v. 212, 115323, 2020.
• MENEZES, D. E. S.; SUM, A. K.; DESMEDT, A.; PESSOA FILHO, P. A.;
ROBUSTILLO, M. D. Coexistence of sI and sII in methane-propane hydrate former
systems at high pressures. Chemical Engineering Science, v. 208, 115149, 2019.
• MENEZES, D. E. S.; RALHA, T.W.; FRANCO, L.F.M., PESSÔA FILHO, P.A.;
ROBUSTILLO, M. D. Simulation and experimental study of methane-propane
hydrate dissociation by high-pressure differential scanning calorimetry. Brazilian
Journal of Chemical Engineering, v. 35, p. 403-414, 2018.
10.2 ARTICLE ACCEPTED FOR PUBLICATION IN SCIENTIFIC JOURNAL
• MENEZES, D. E. S.; PESSÔA FILHO, P.A.; ROBUSTILLO, M. D. Phase
equilibrium for methane, ethane and carbon dioxide hydrates at pressures up to
100 MPa through high-pressure microcalorimetry: experimental data, analysis and
Table A.28 – Hydration number of CO2 hydrate by the multicycles method.
T (K) 283.52 284.42 286.15 286.61
P (MPa) 9.8 20 40 50
ΔH1 (kJ/mol CH4) 47.97 47.72 47.57 47.48
ΔH2 (kJ/mol CH4)* 57.6 57.6 57.6 57.6
ΔH CH4 (1-2) (kJ/mol) -9.84 -10.06 -10.01 -9.11
ΔH HYD (2-1) (kJ/mol CH4) -1.53 -3.18 -6.42 -7.78
H H2O (1) (kJ/mol) 1.24 1.37 1.66 2.44
H H2O (2) (kJ/mol) x103 1.9E-03 1.9E-03 1.9E-03 1.9E-03
n1 6.64 6.45 6.38 6.26
*Anderson (2003).
REFERENCES
ANDERSON, G.K. Enthalpy of dissociation and hydration number of methane hydrate from the Clapeyron equation. Journal of Chemical Thermodynamics, v. 36, p. 1119-1127, 2004. GUTT, C.; ASMUSSEN, B.; PRESS, W; JOHNSON, M.R.; HANDA, Y.P.; TSE, J.S. The structure of deuterated methane-hydrate. Journal of Chemical Physics, v. 113, p. 4713-4721, 2000. HESTER, K.C.; HUO, Z.; BALLARD, A.L.; KOH, C.A.; MILLER, K.T.; SLOAN, E.D. Thermal Expansivity for sI and sII Clathrate Hydrates. Journal of Physical Chemistry B, v. 111, p. 8830-8835, 2007. IKEDA, T.; YAMAMURO, O.; MATSUO, T.; MORI, K.; TORII, S.; KAMIYAMA, T.; IZUMI, F.; IKEDA, S.; MAE, S. Neutron diffraction study of carbon dioxide clathrate hydrate. Journal of Physics and Chemistry of Solids, v. 60, p. 1527-1529, 1999. KLAPPROTH, A.; GORESHNIK, E.; STAYKOVA, D.; KLEIN, H.; KUHS, W. Structural studies of gas hydrates. Canadian Journal of Physics, v. 81, p. 503–518, 2003. SHPAKOV, V.P.; TSE, J.S.; TULK, C.A.; KVAMME, B.; BELOSLUDOV, V.R. Elastic moduli calculation and instability in structure I methane clathrate hydrate. Chemical Physics Letters, v. 282, p. 107-114, 1998. UDACHIN, K.A.; RATCLIFFE, C.I.; RIPMEESTER, J.A. Structure, composition and thermal expansion of CO2 hydrate from single crystal x-ray diffraction measurements. Journal of Physics Chemistry B, v. 105, p. 4200-4204, 2001.


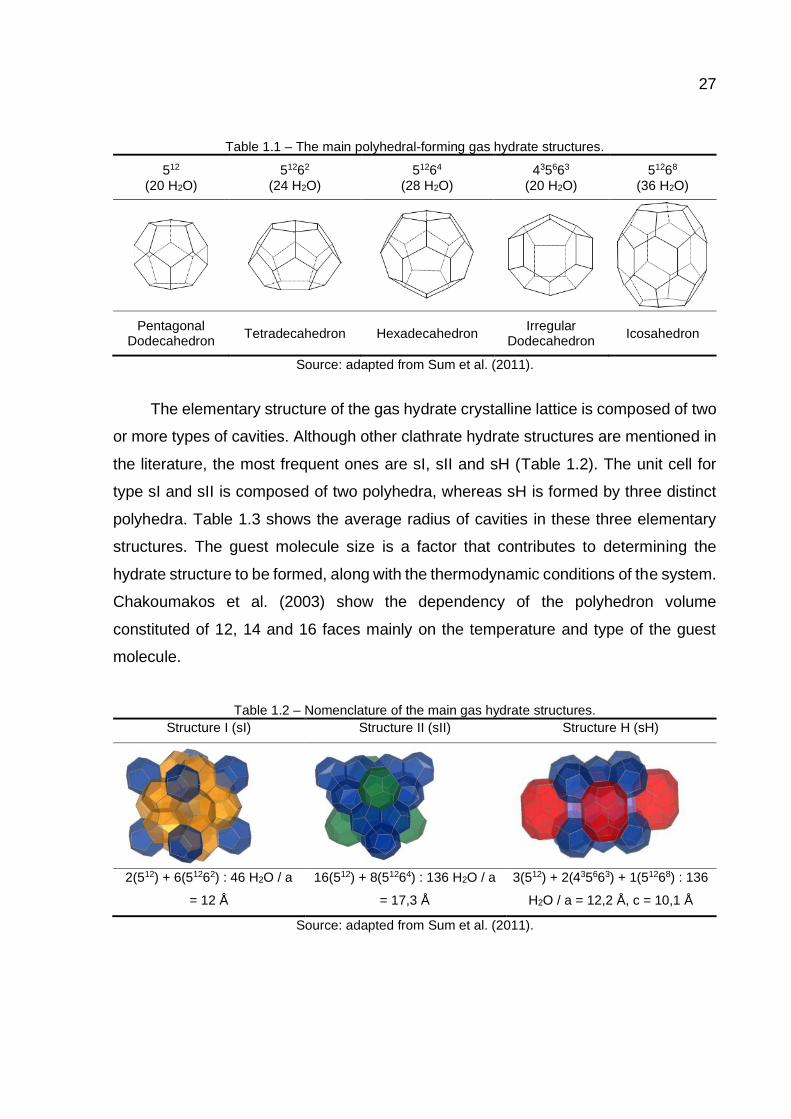
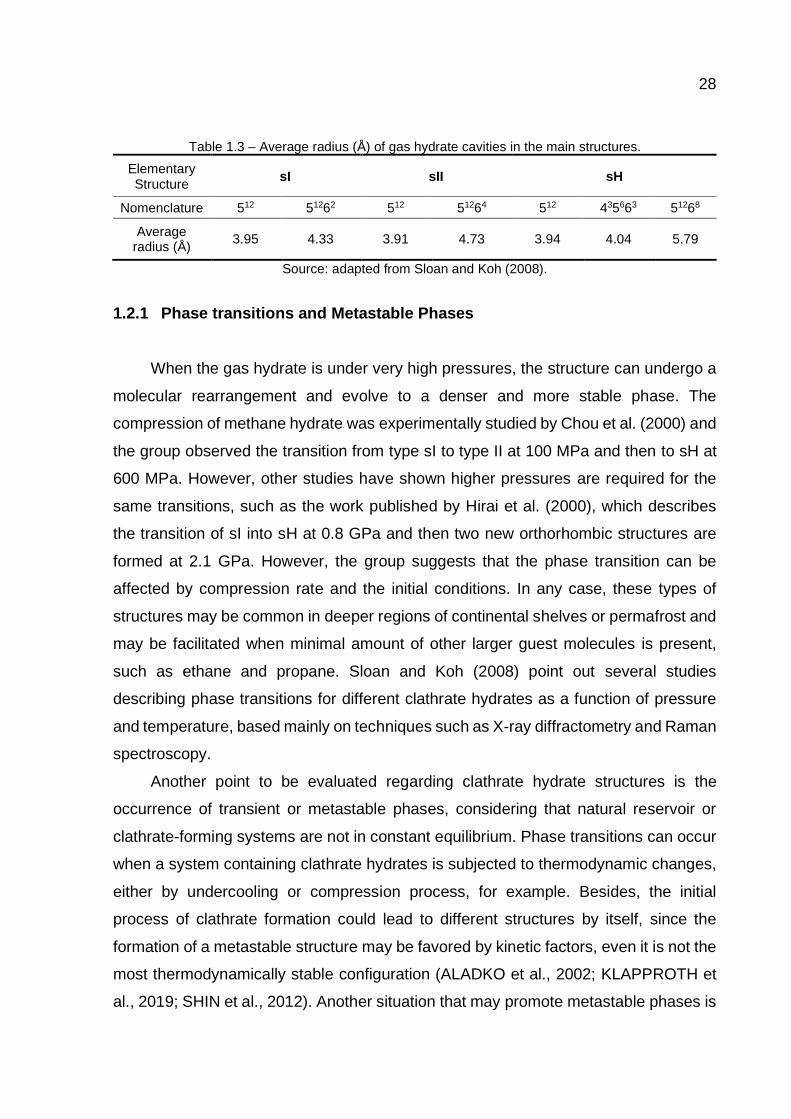


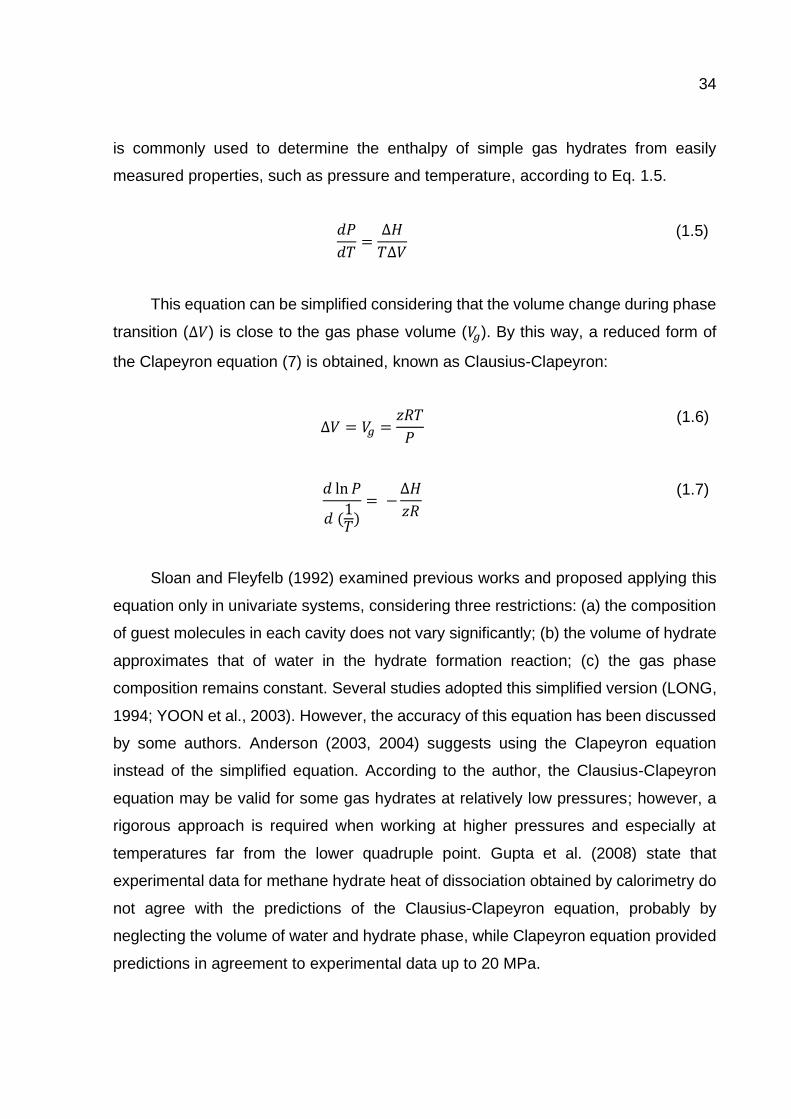
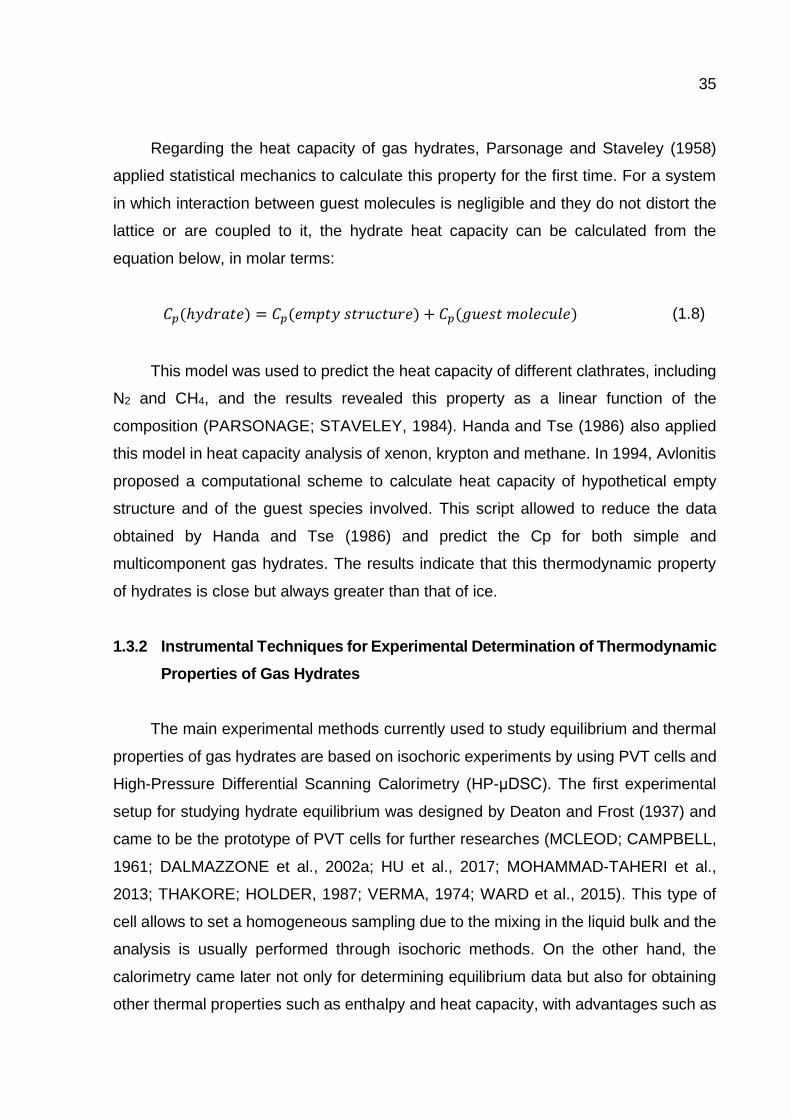


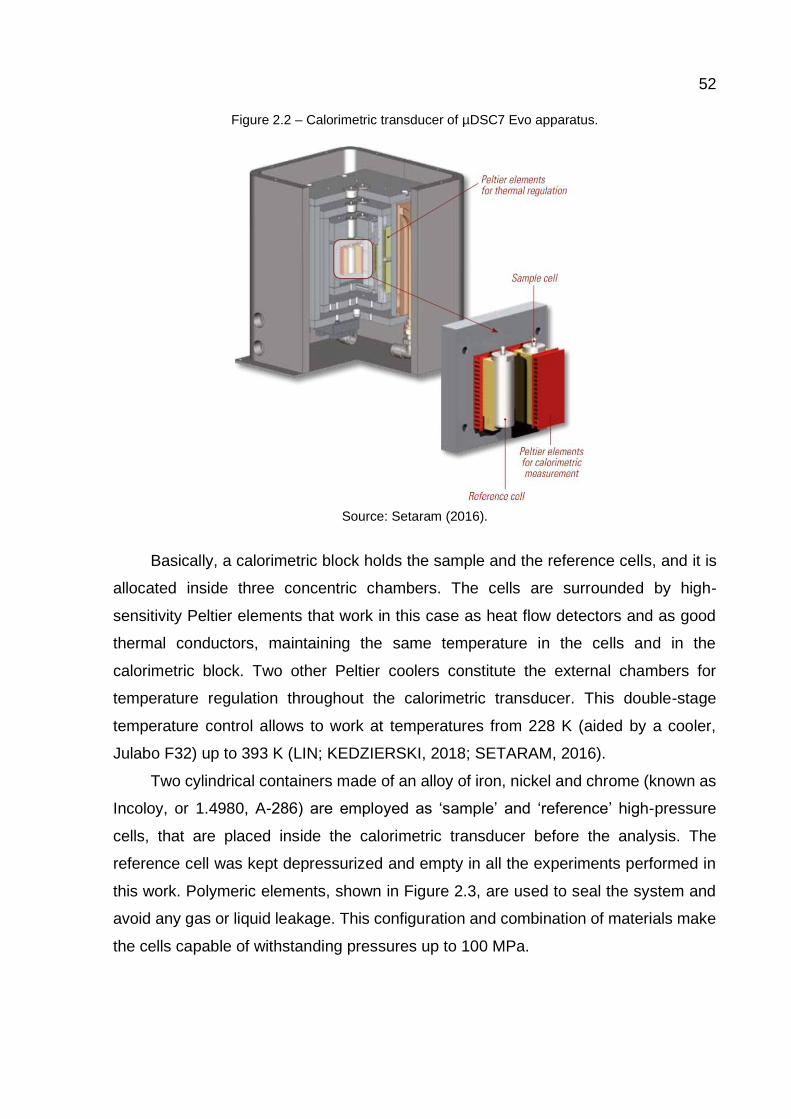
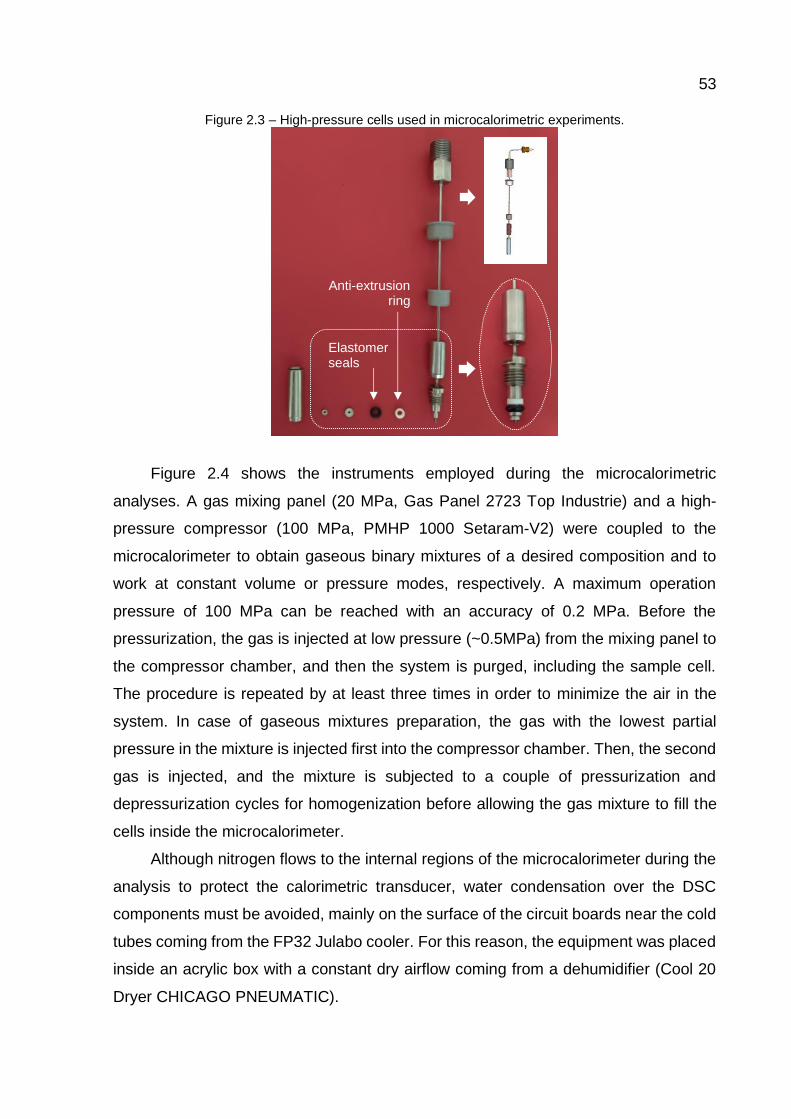
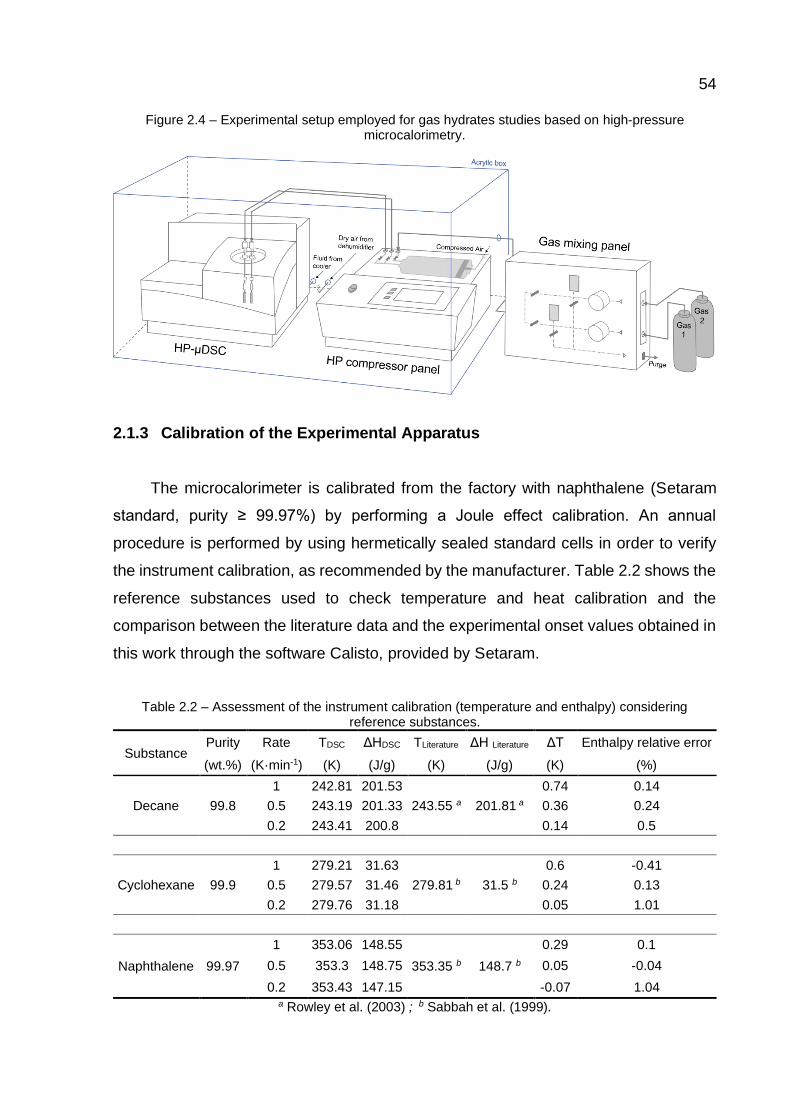


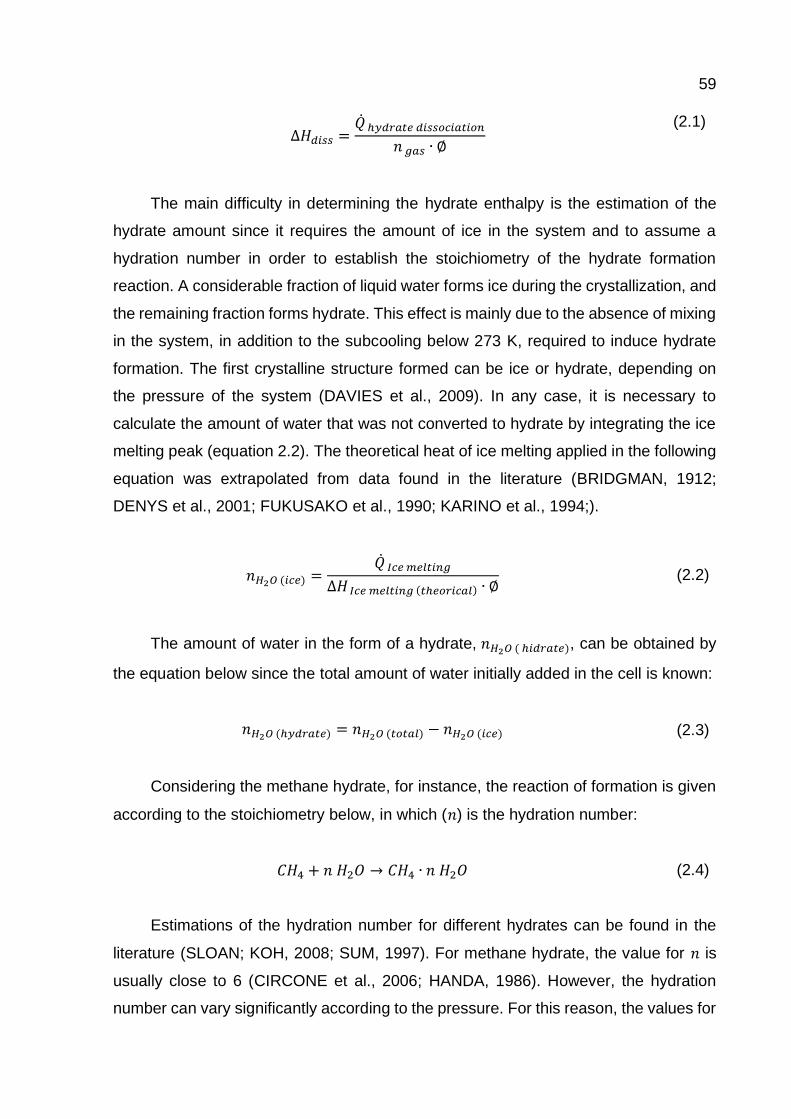


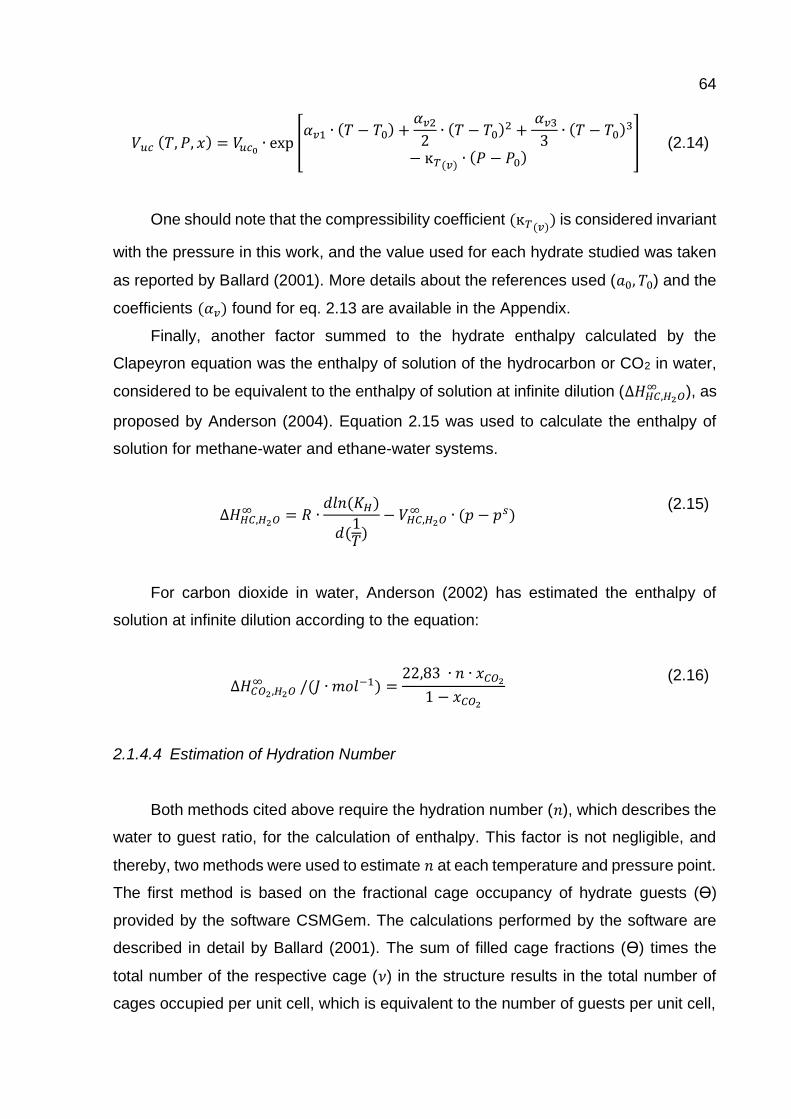
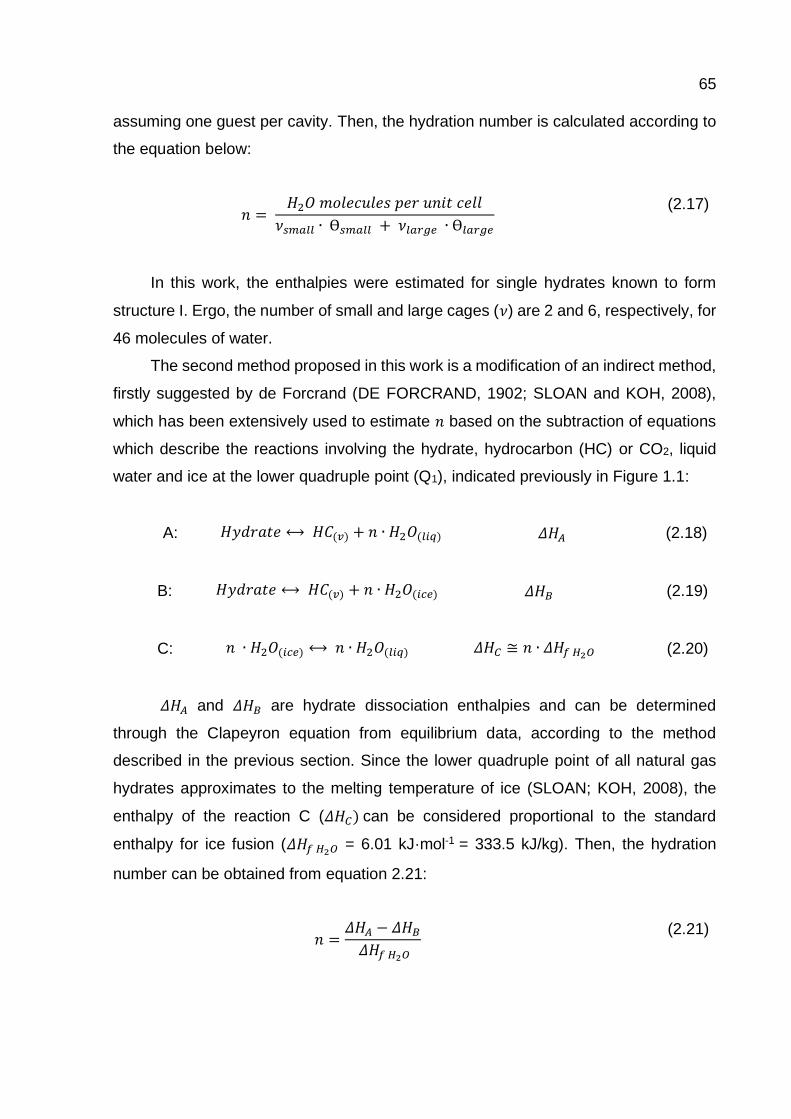


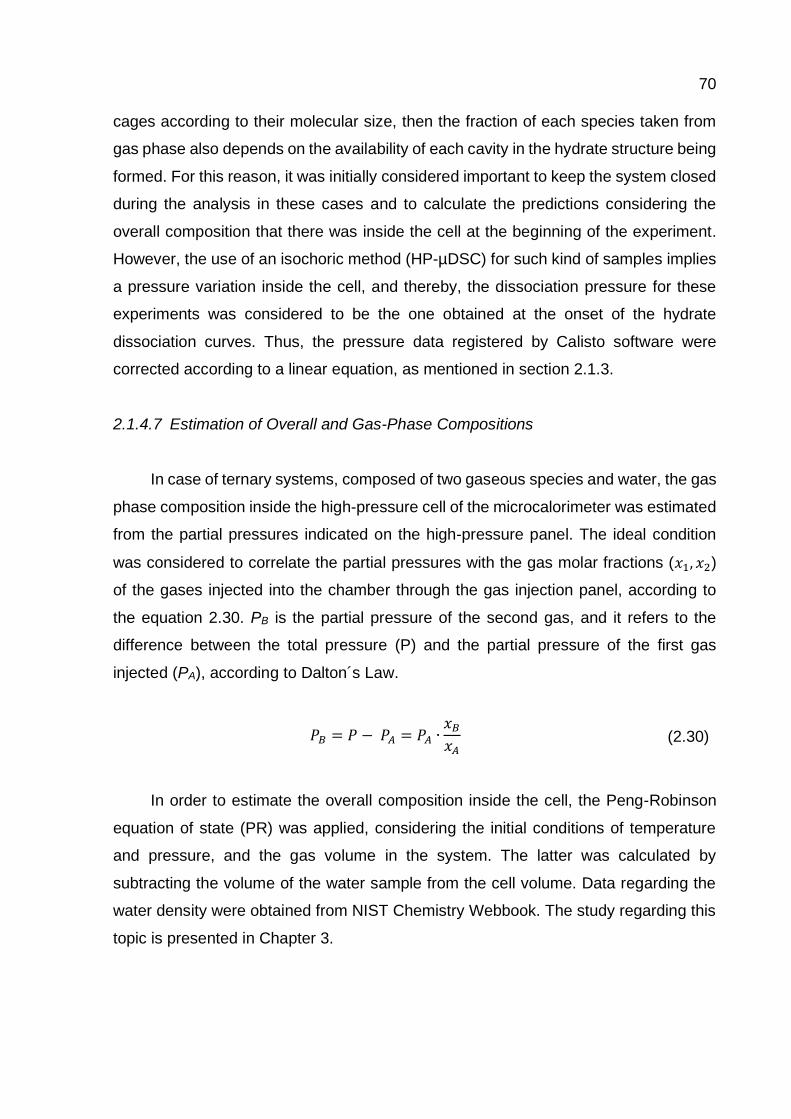
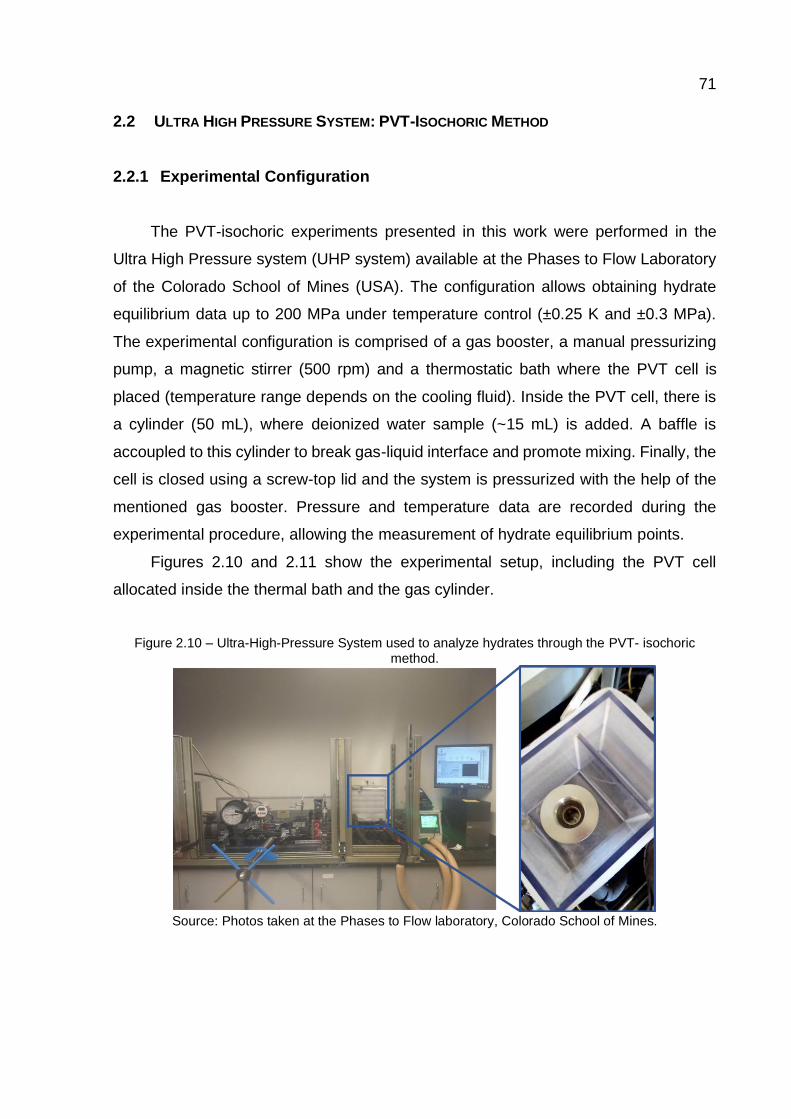

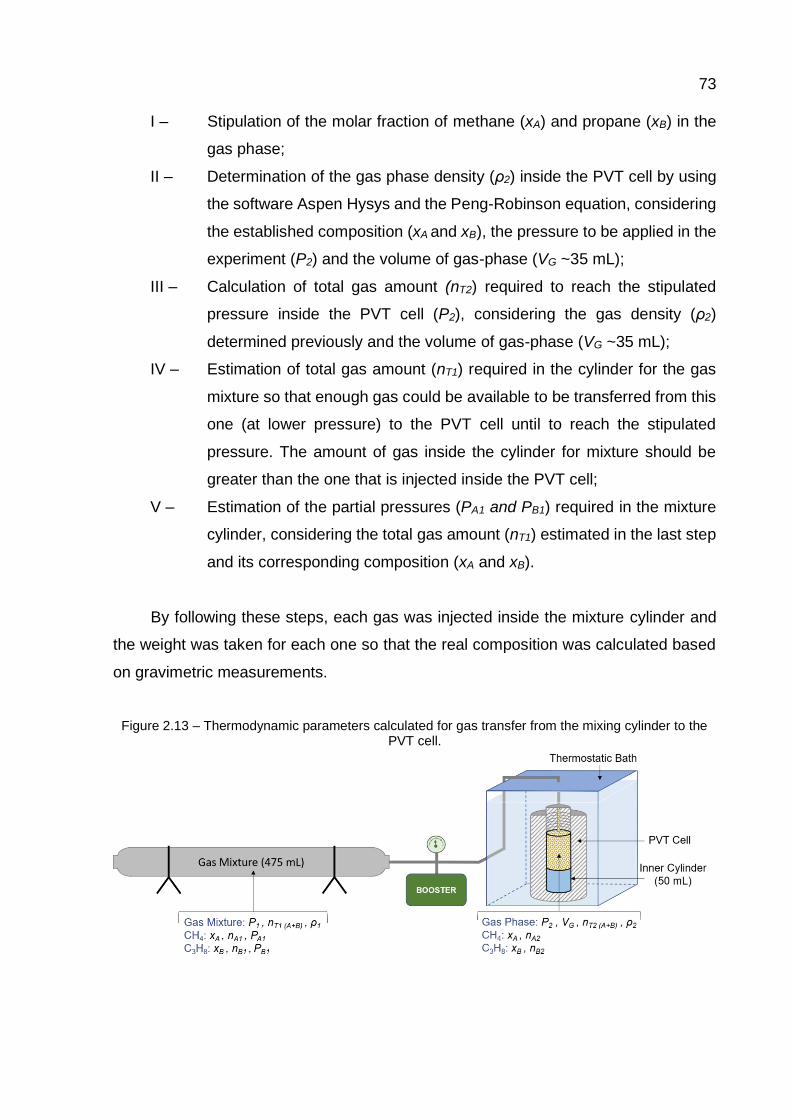
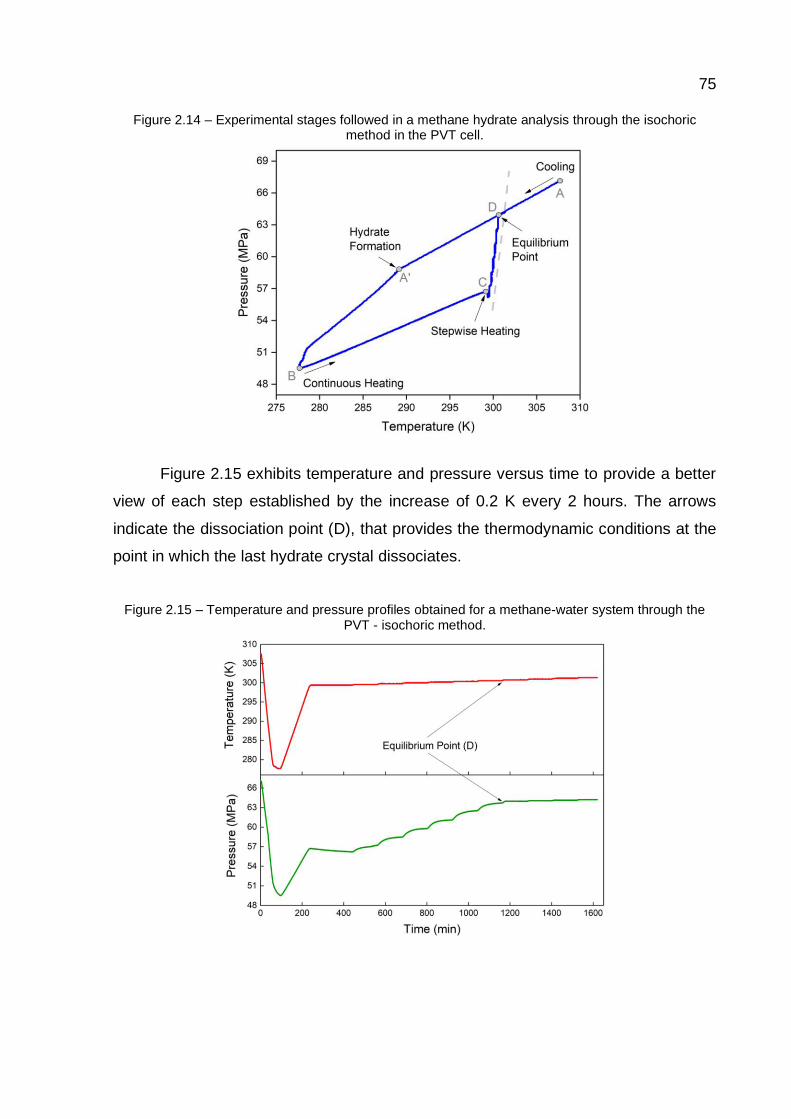
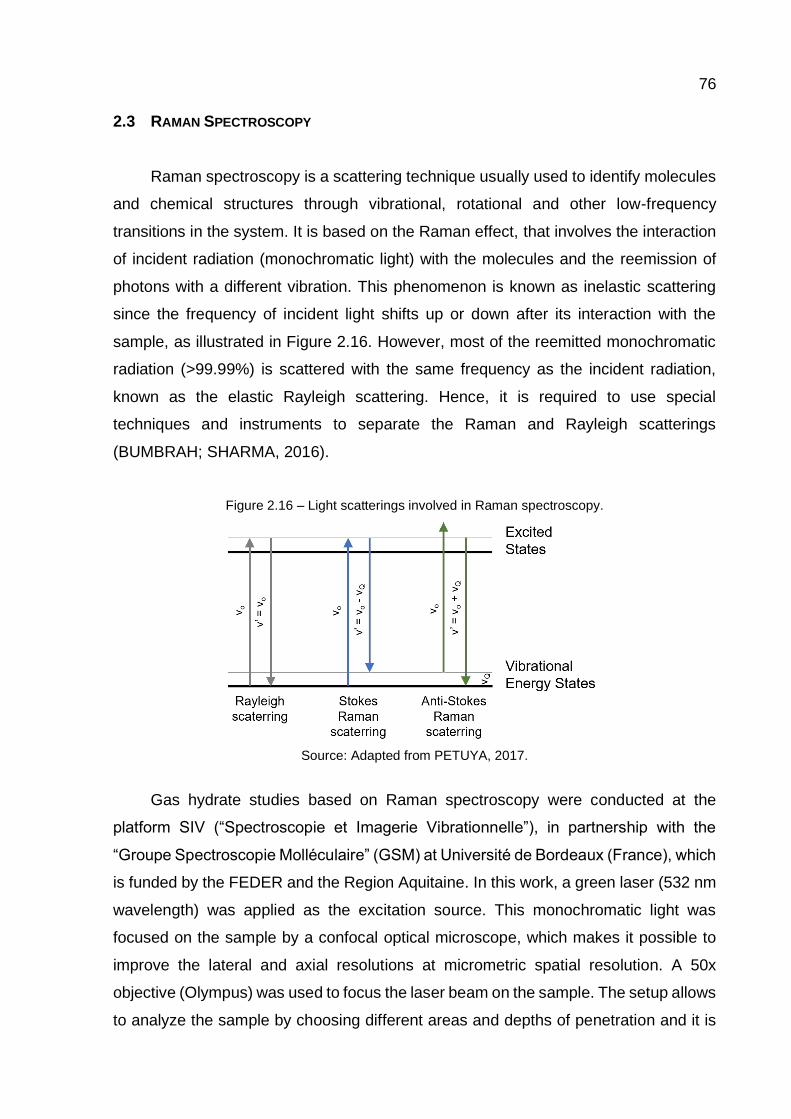

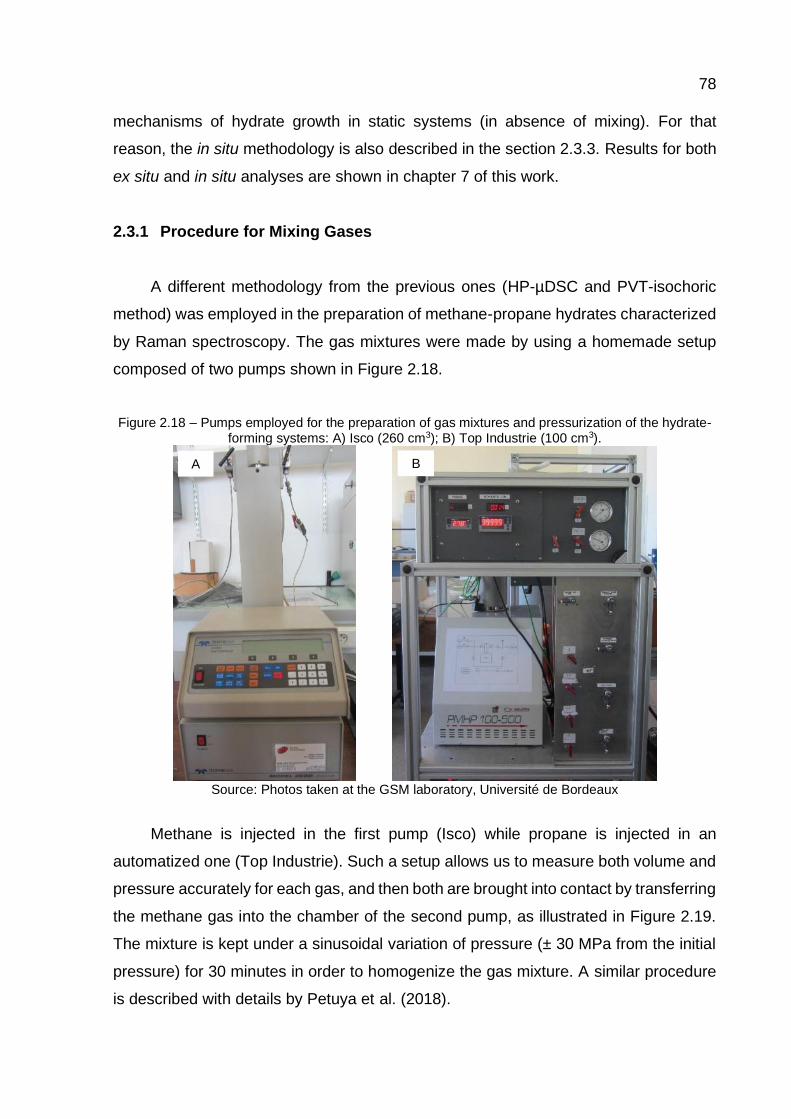
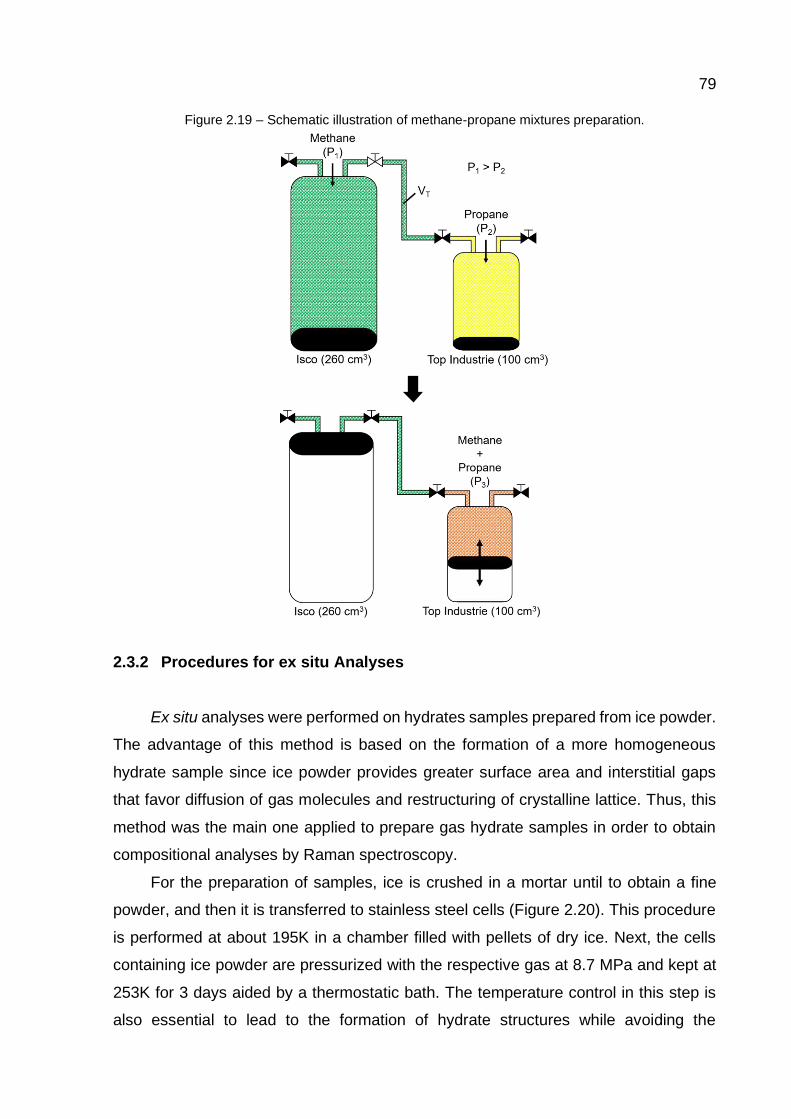
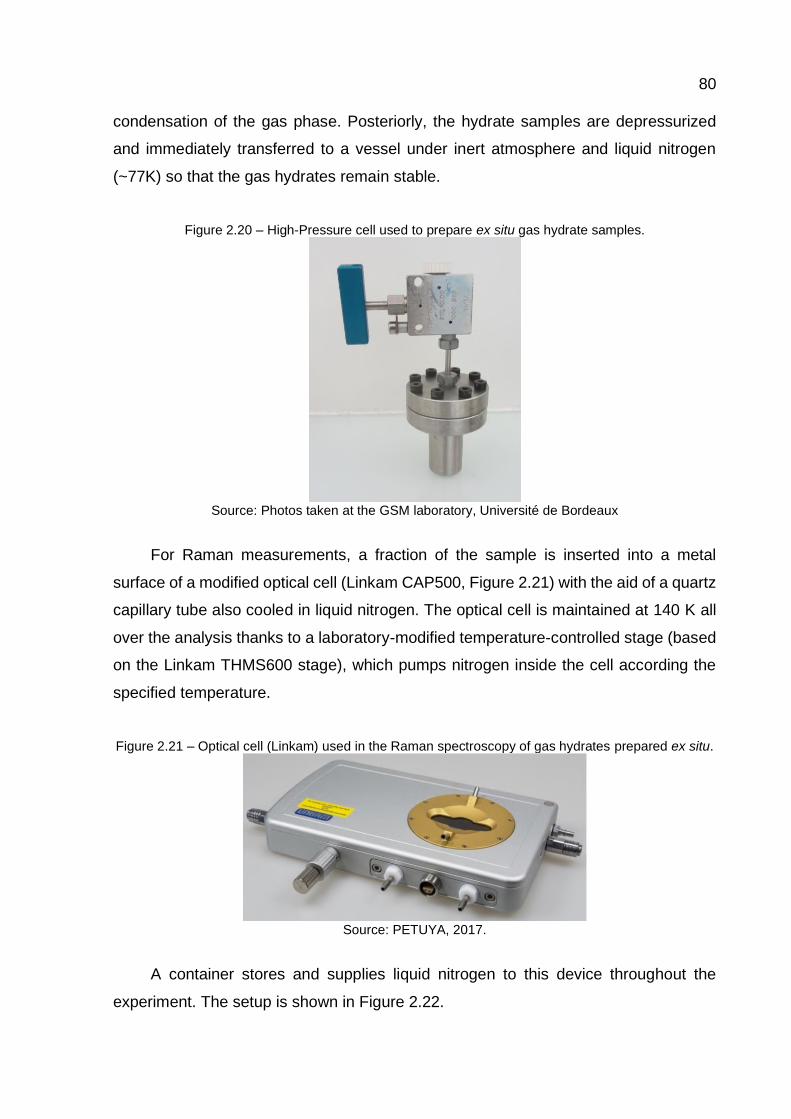
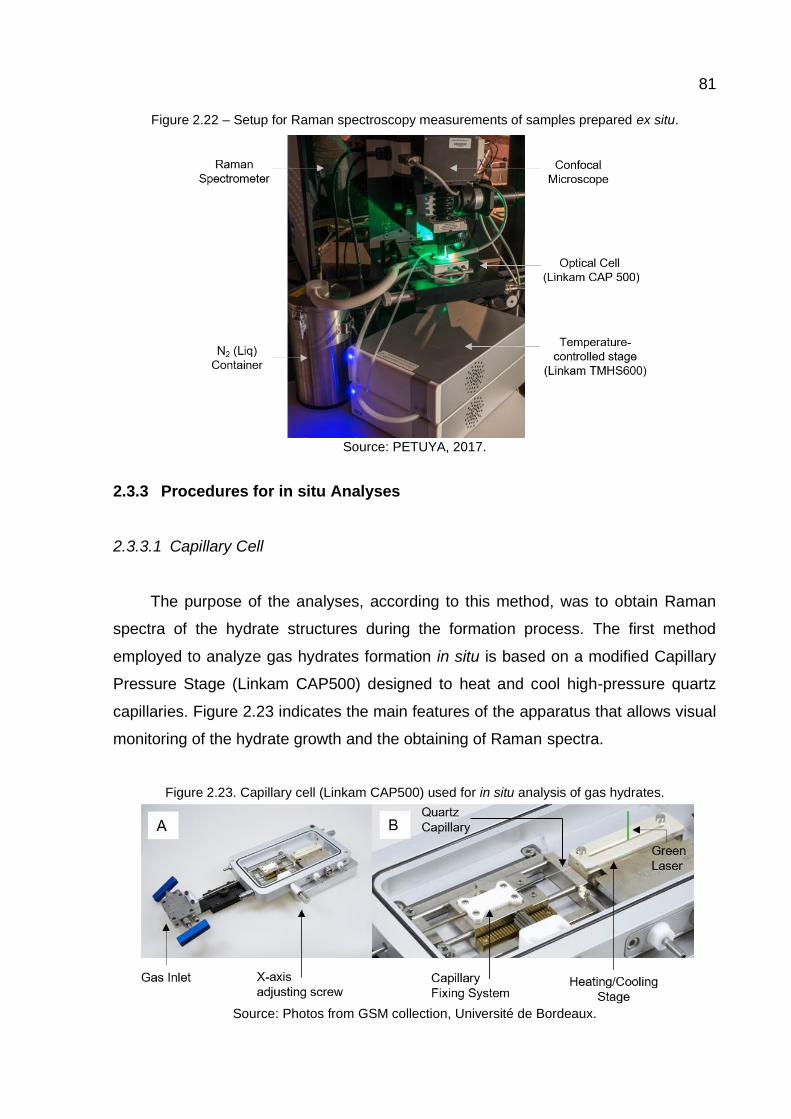
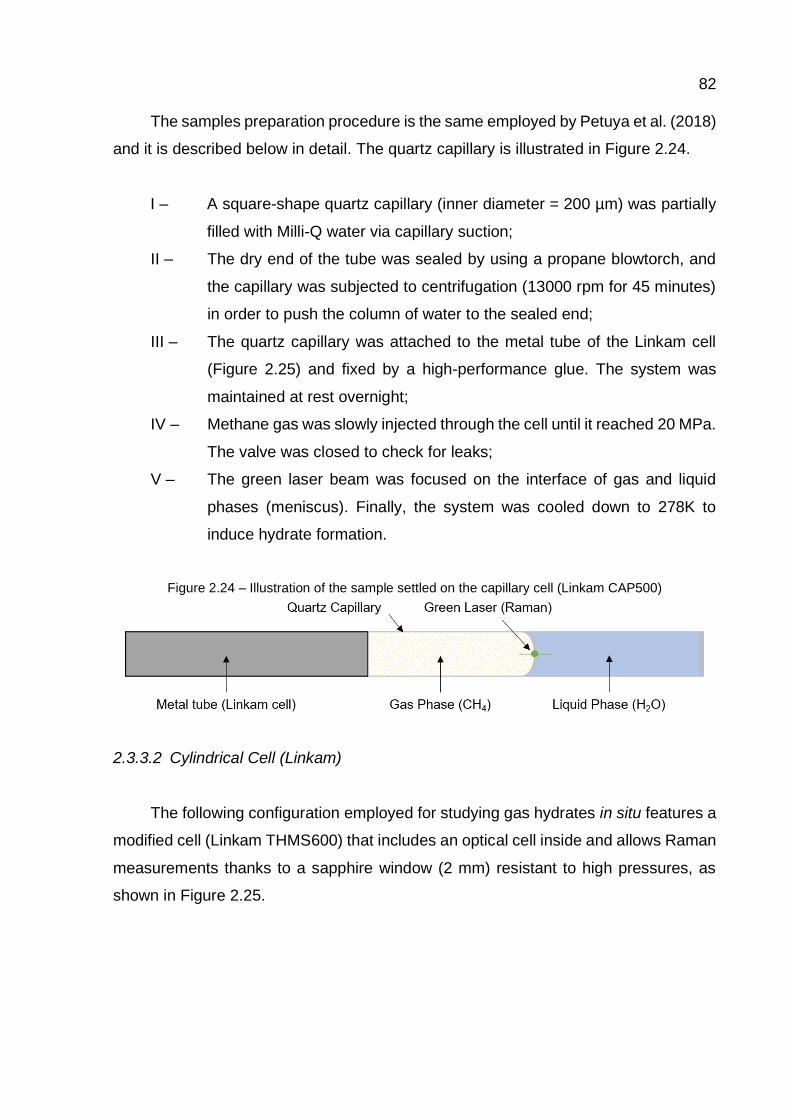


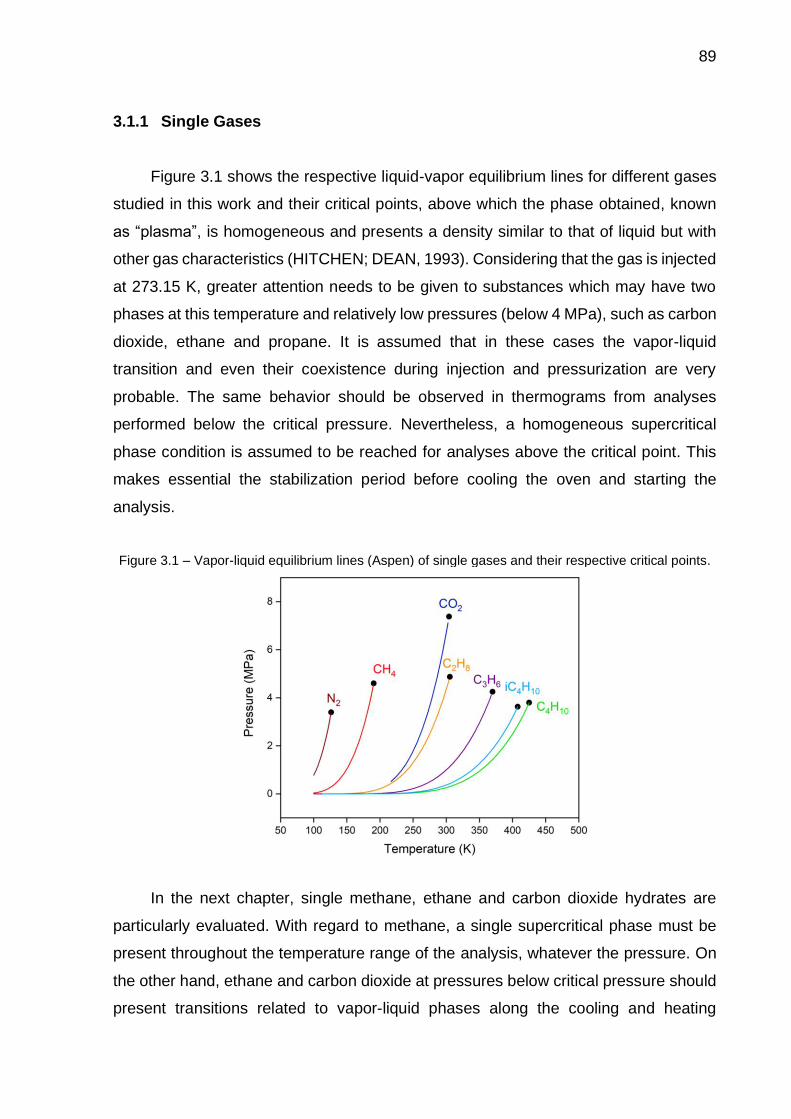

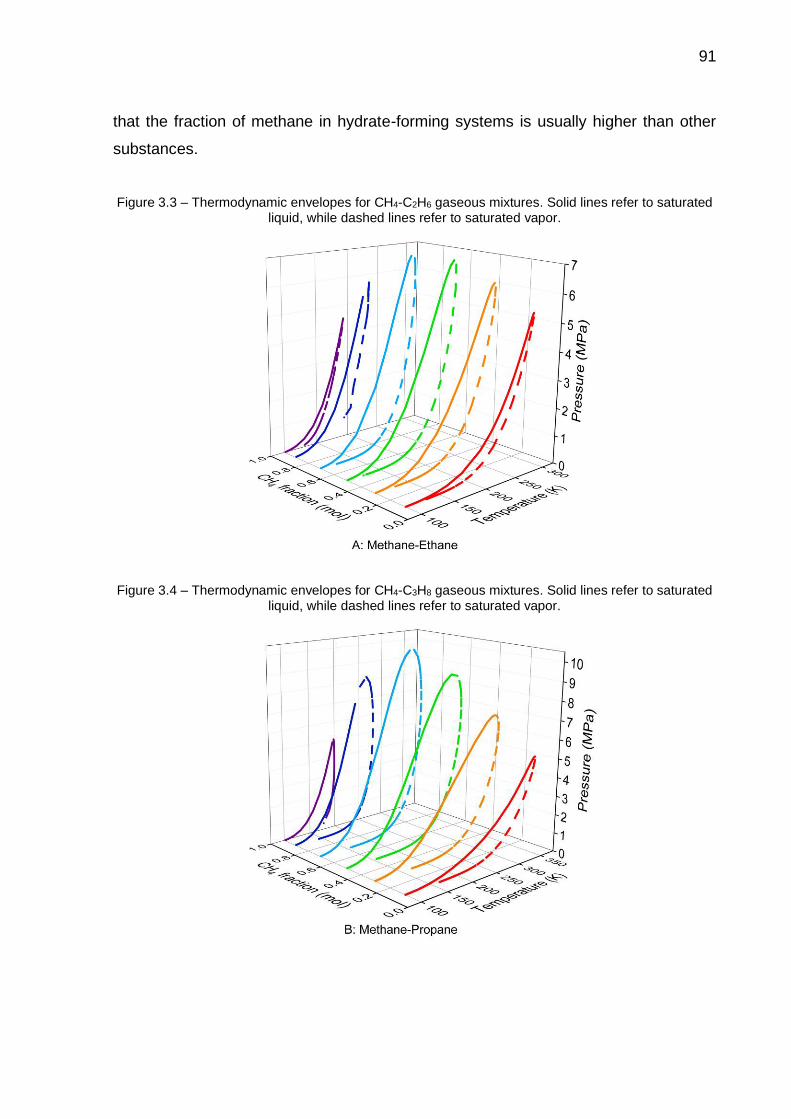
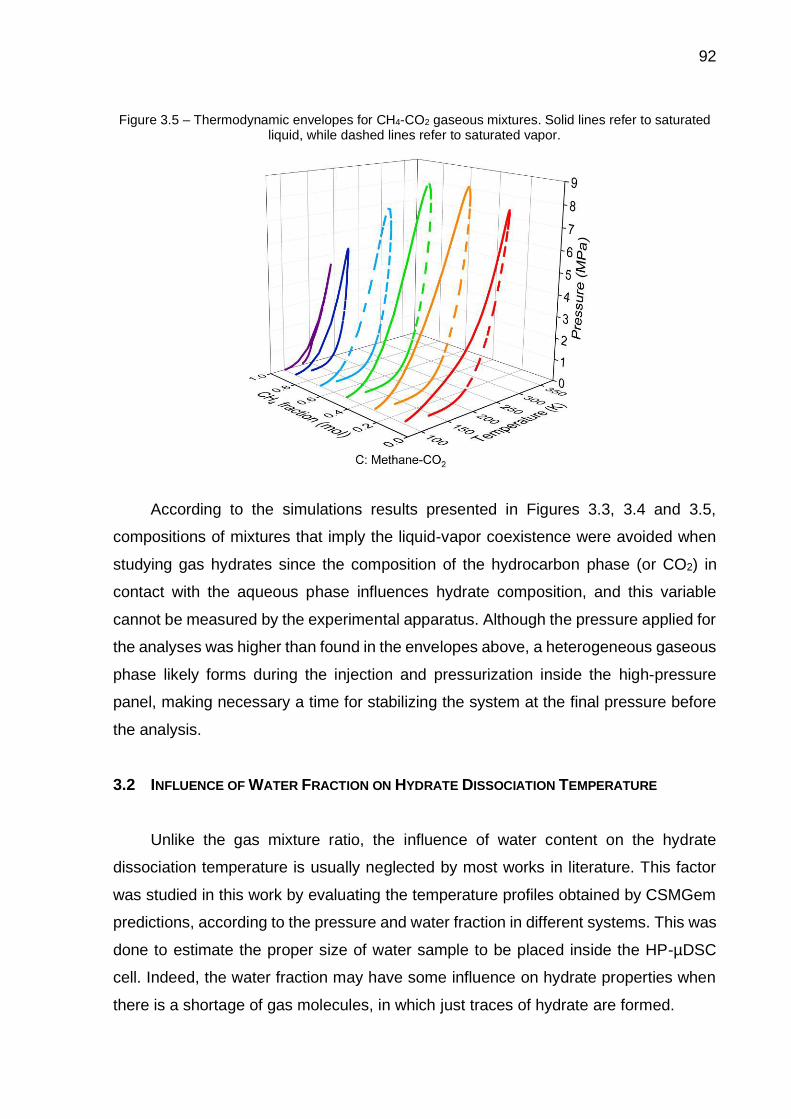


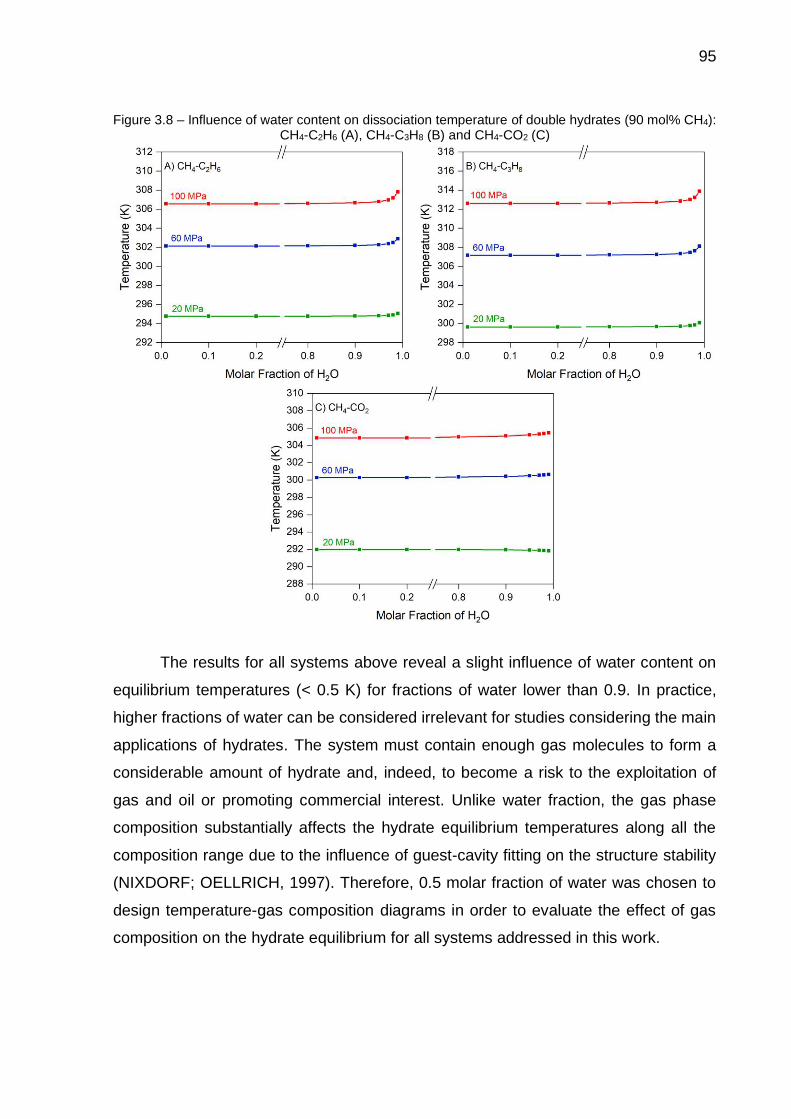
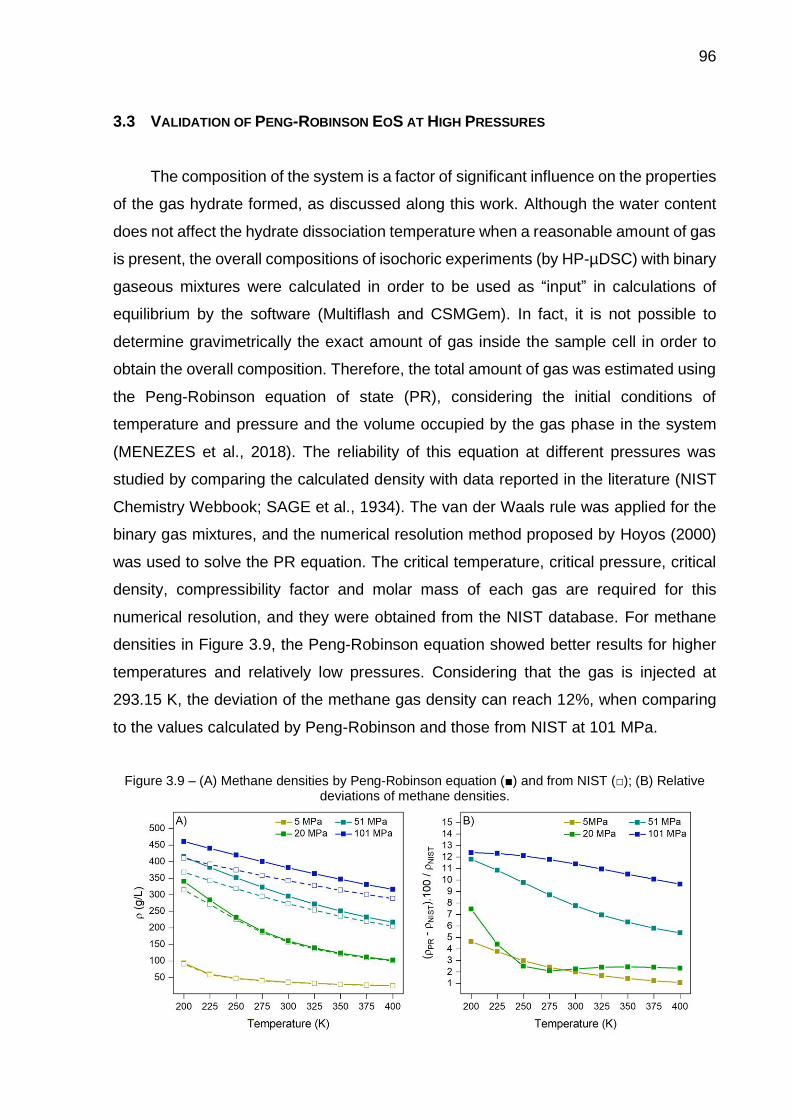


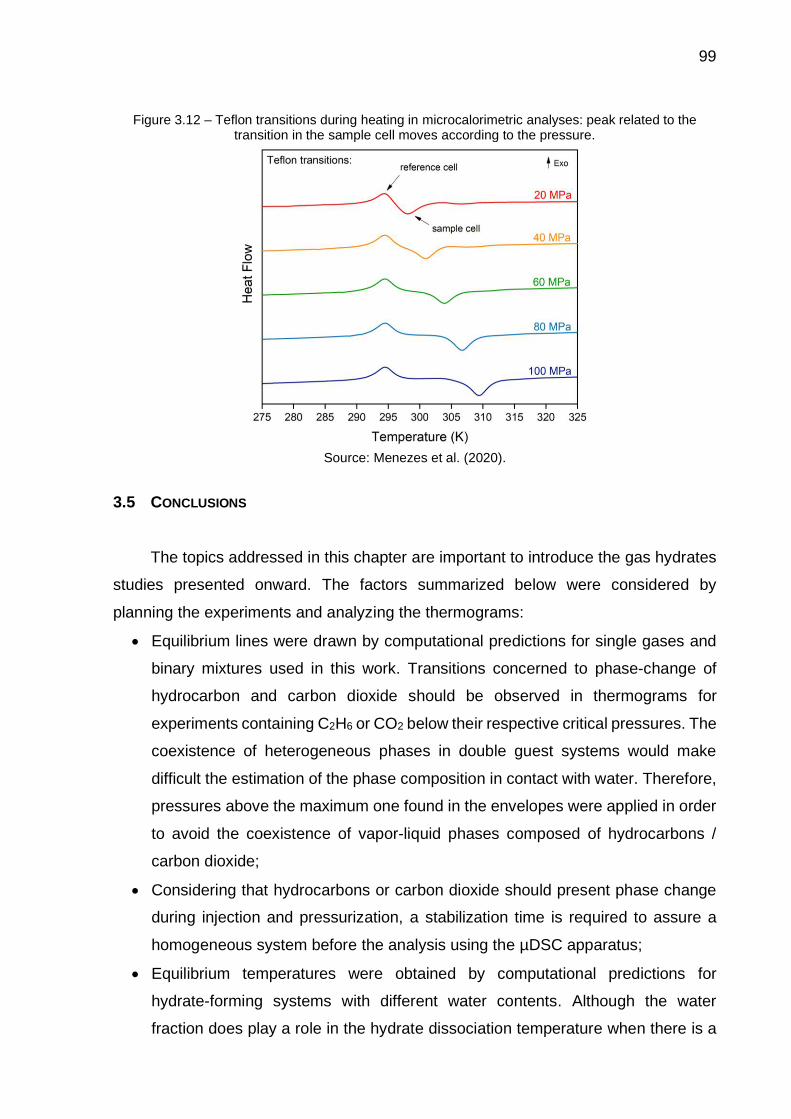


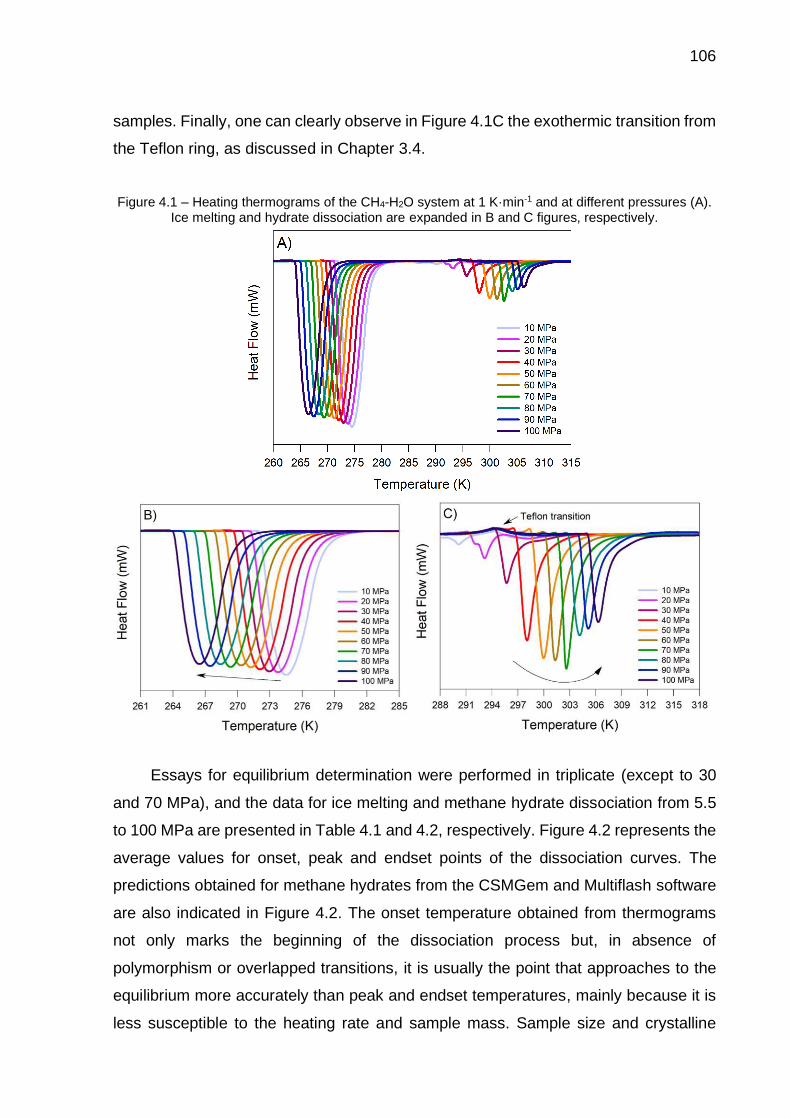


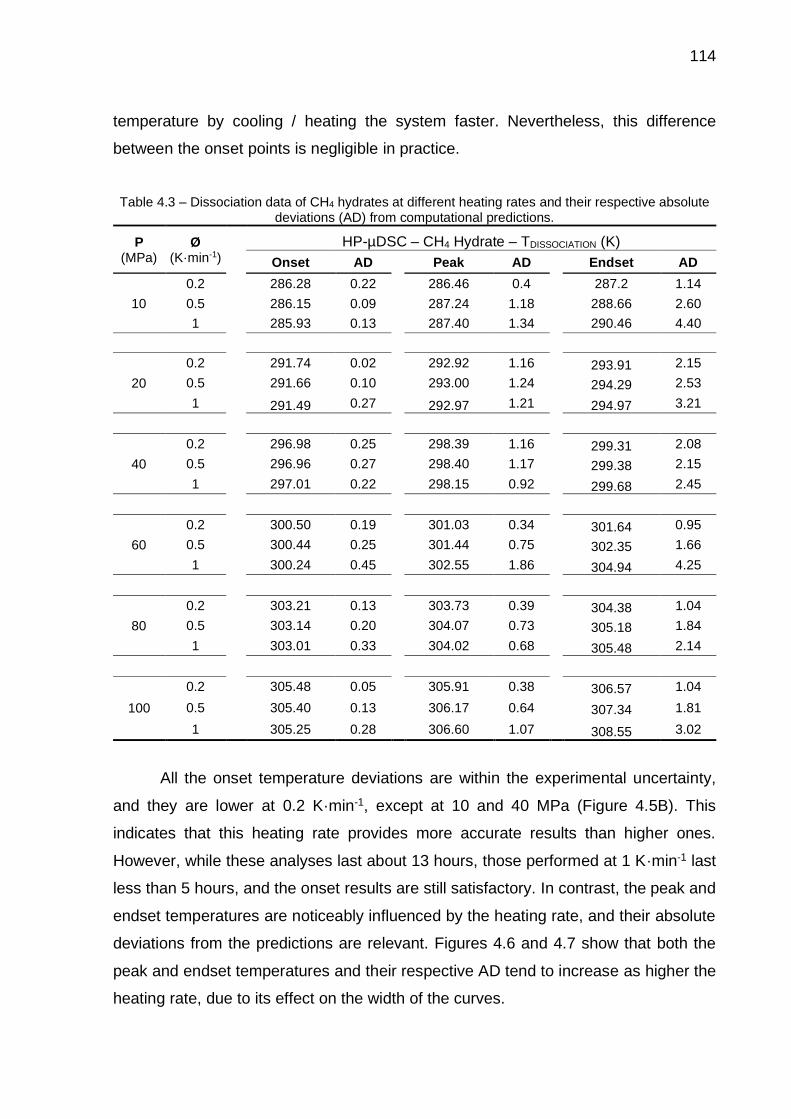

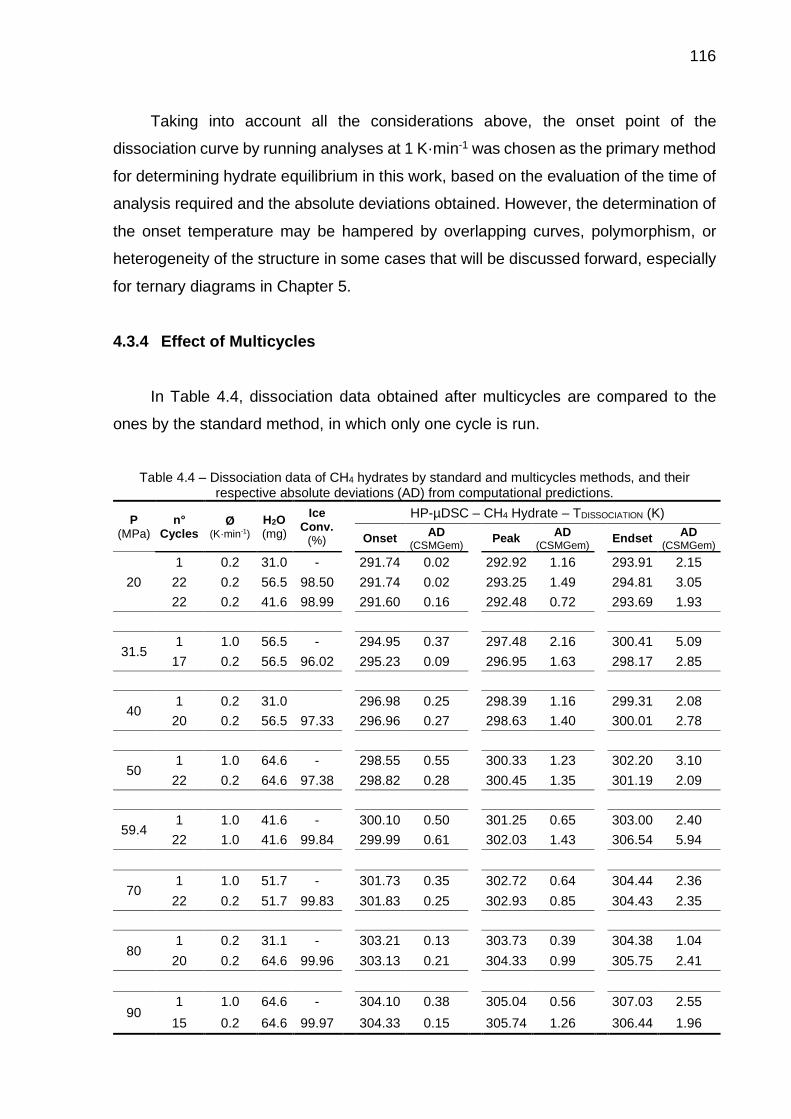
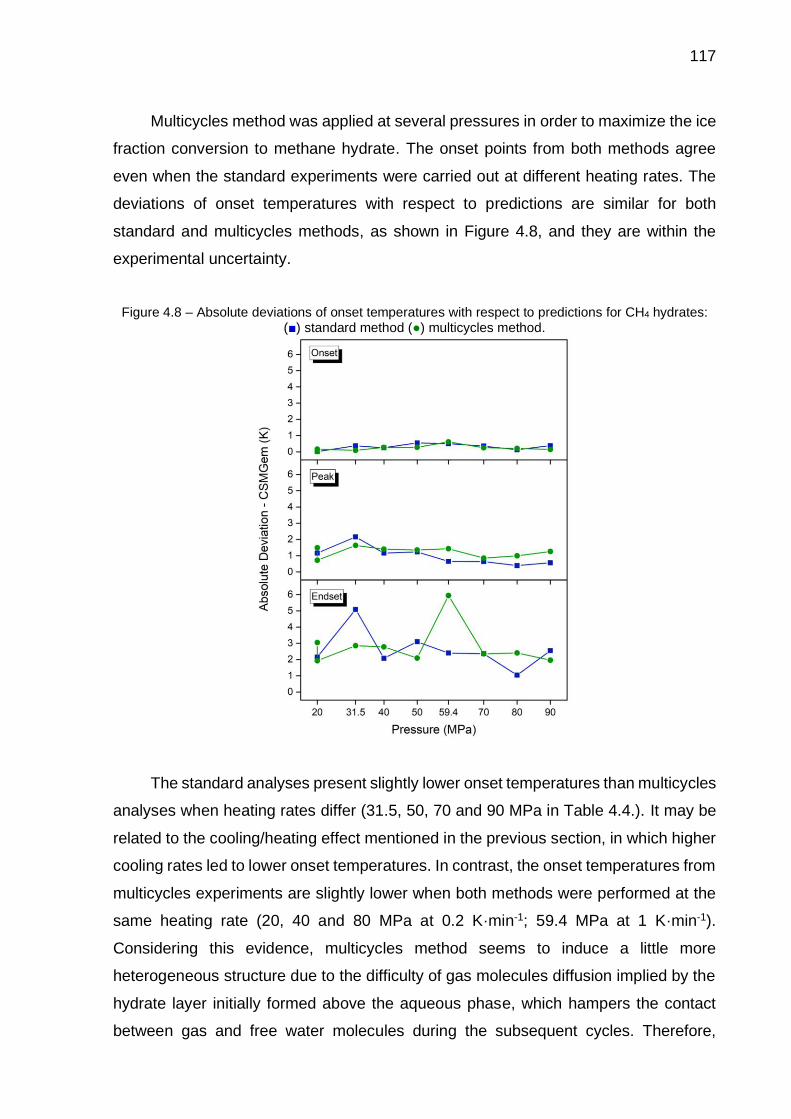

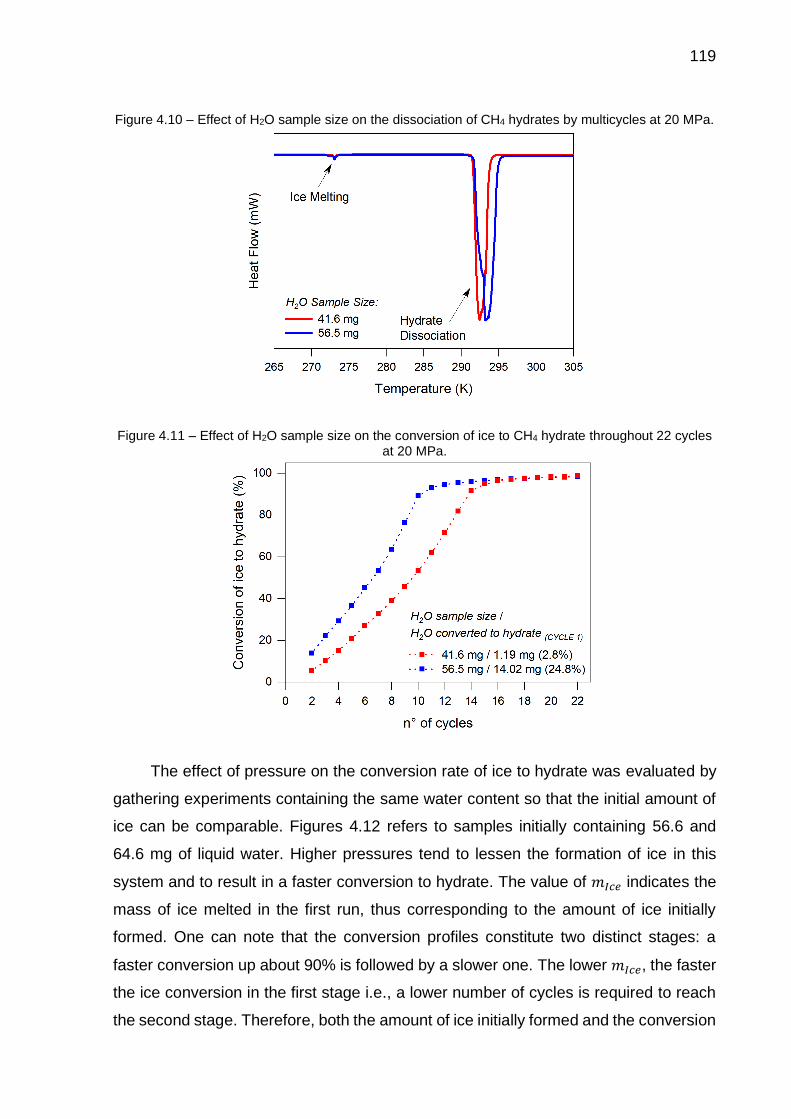

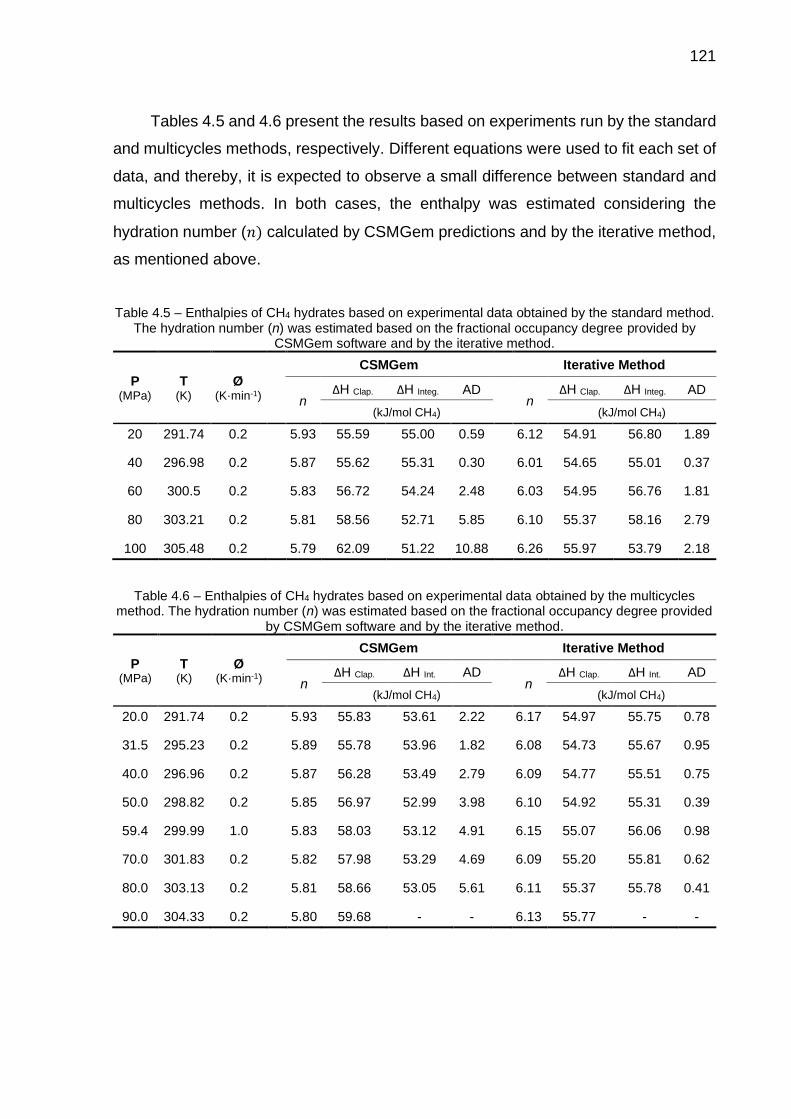
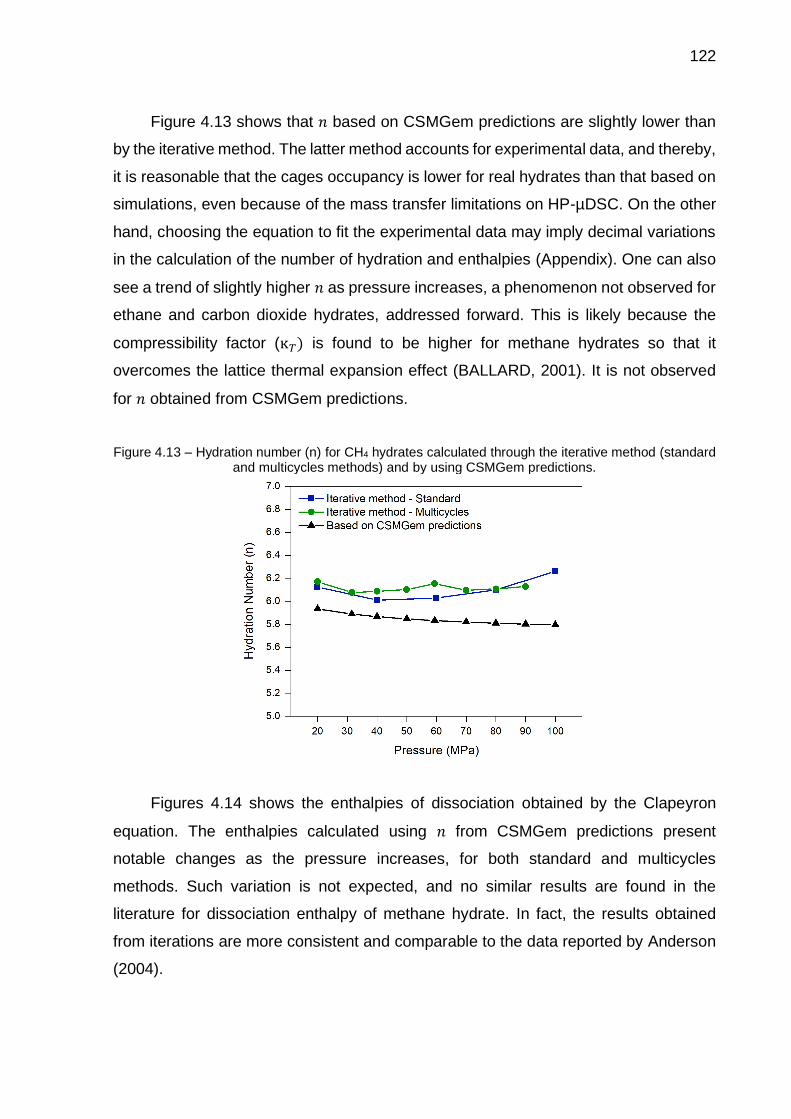
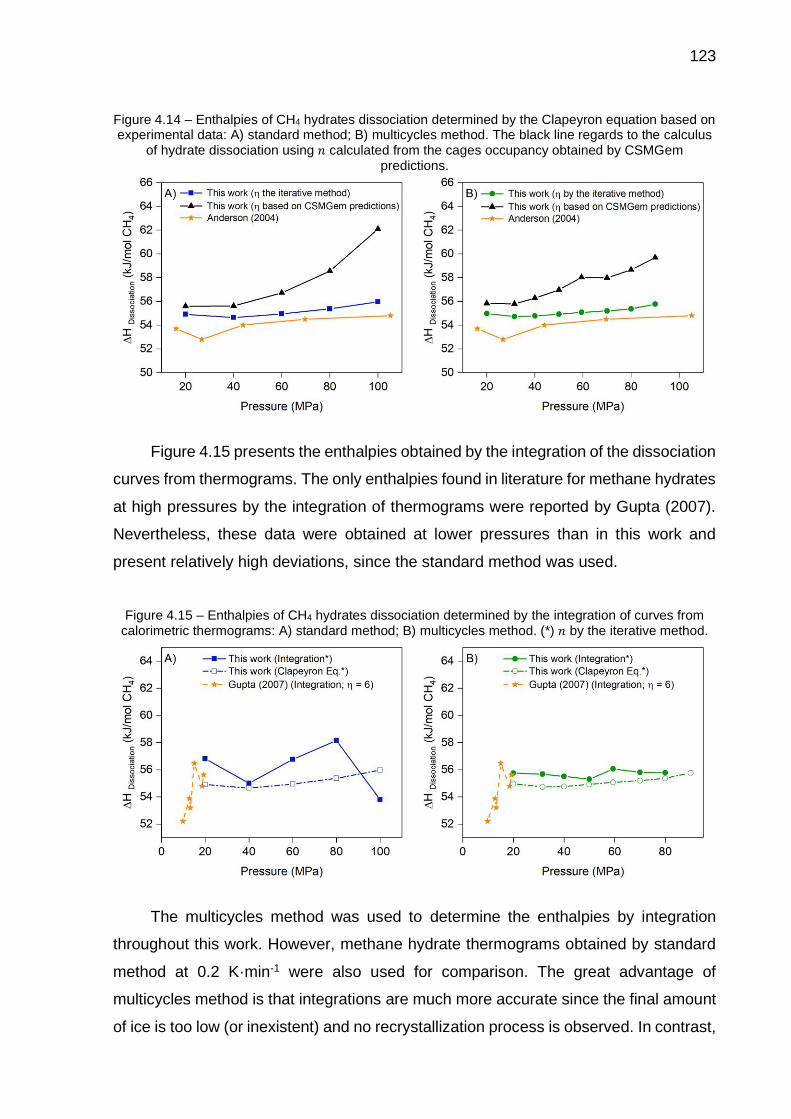
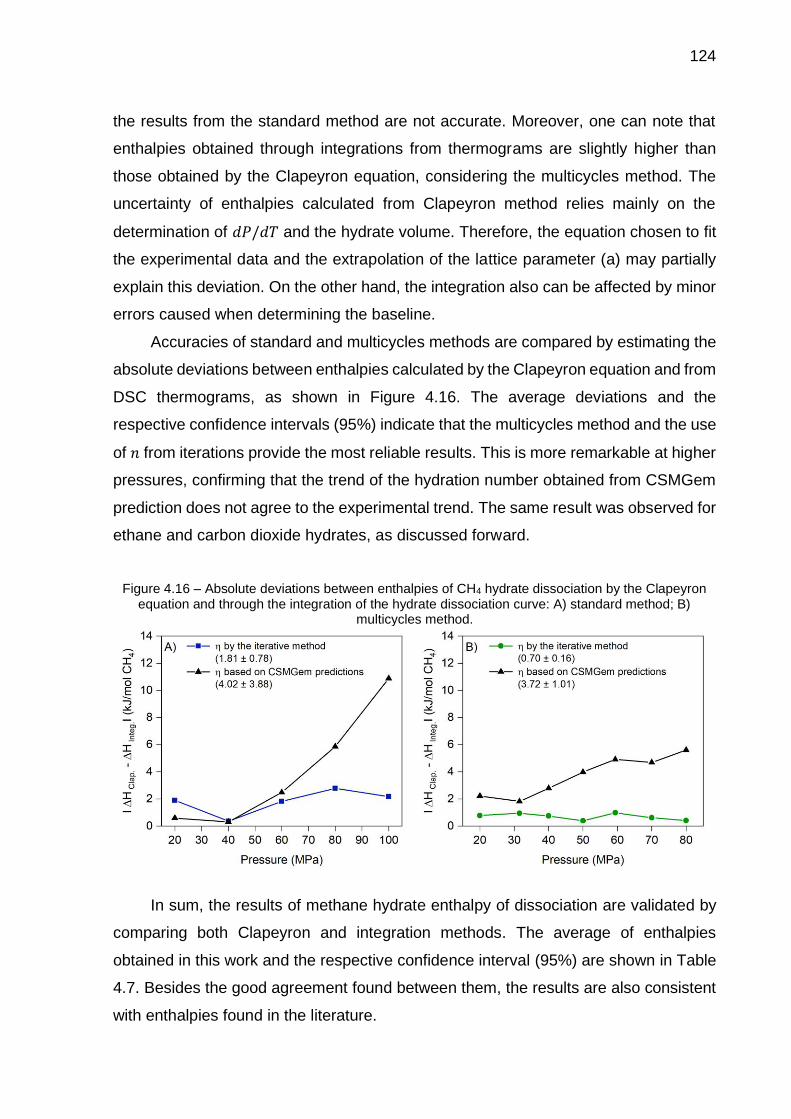

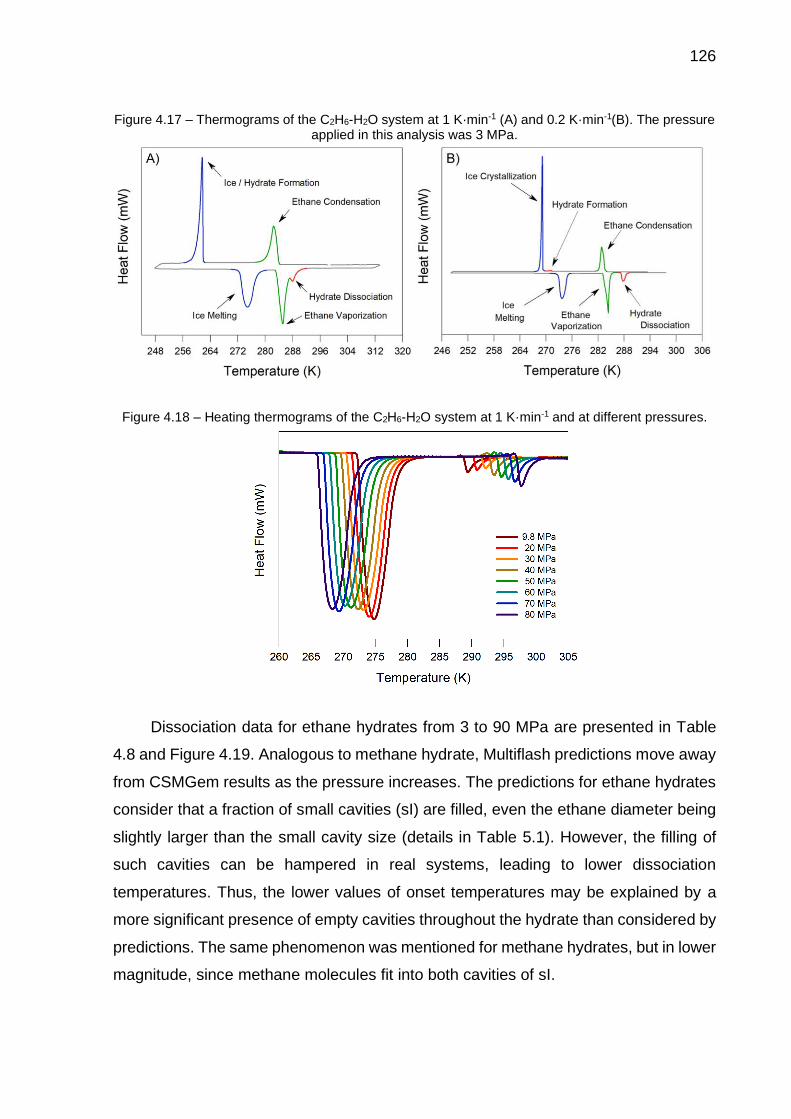

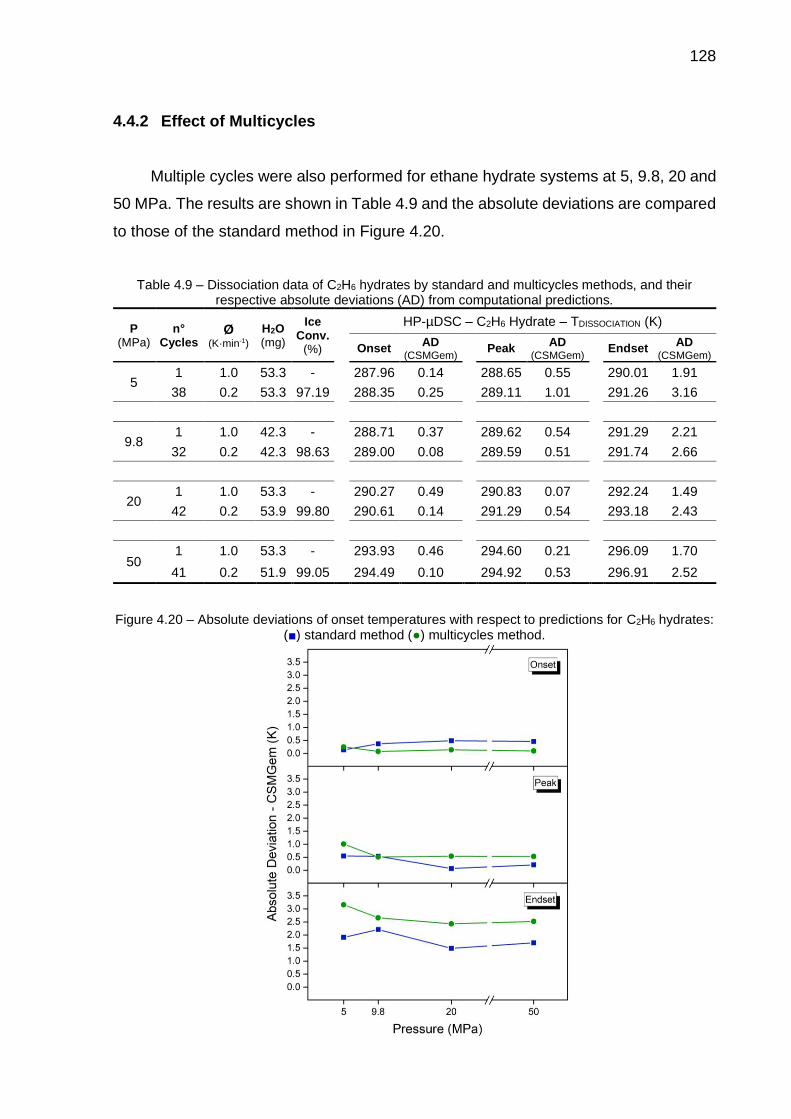
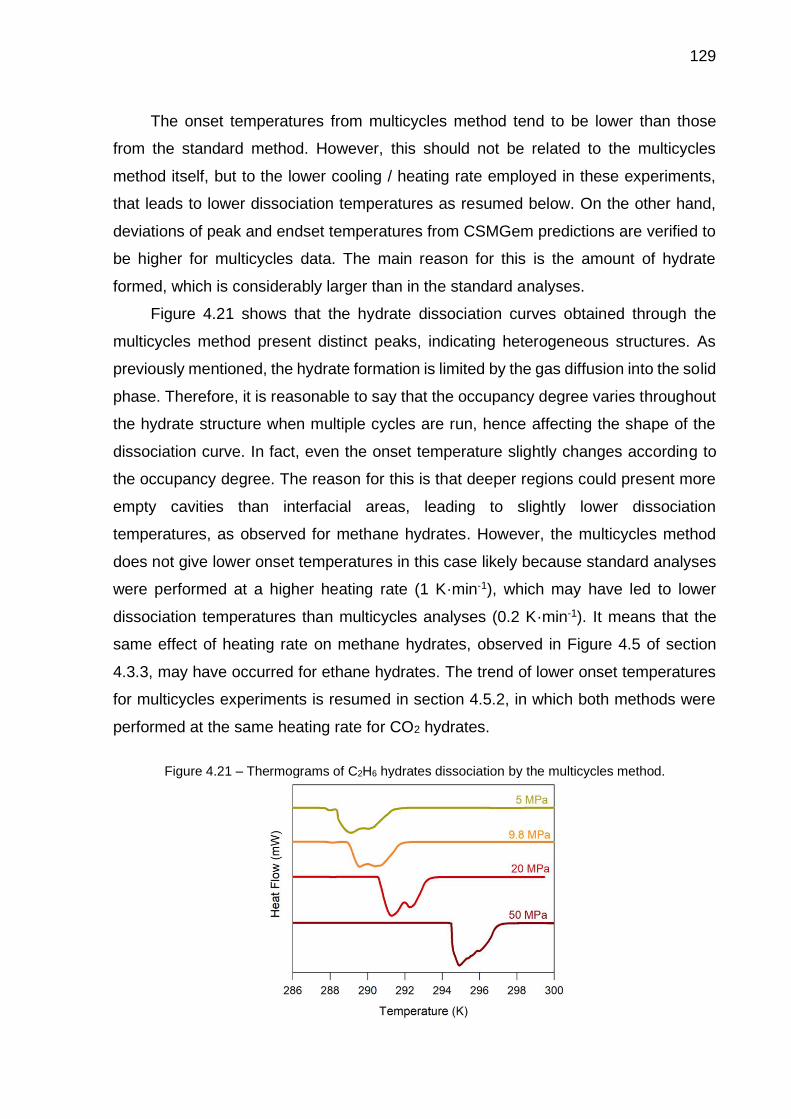
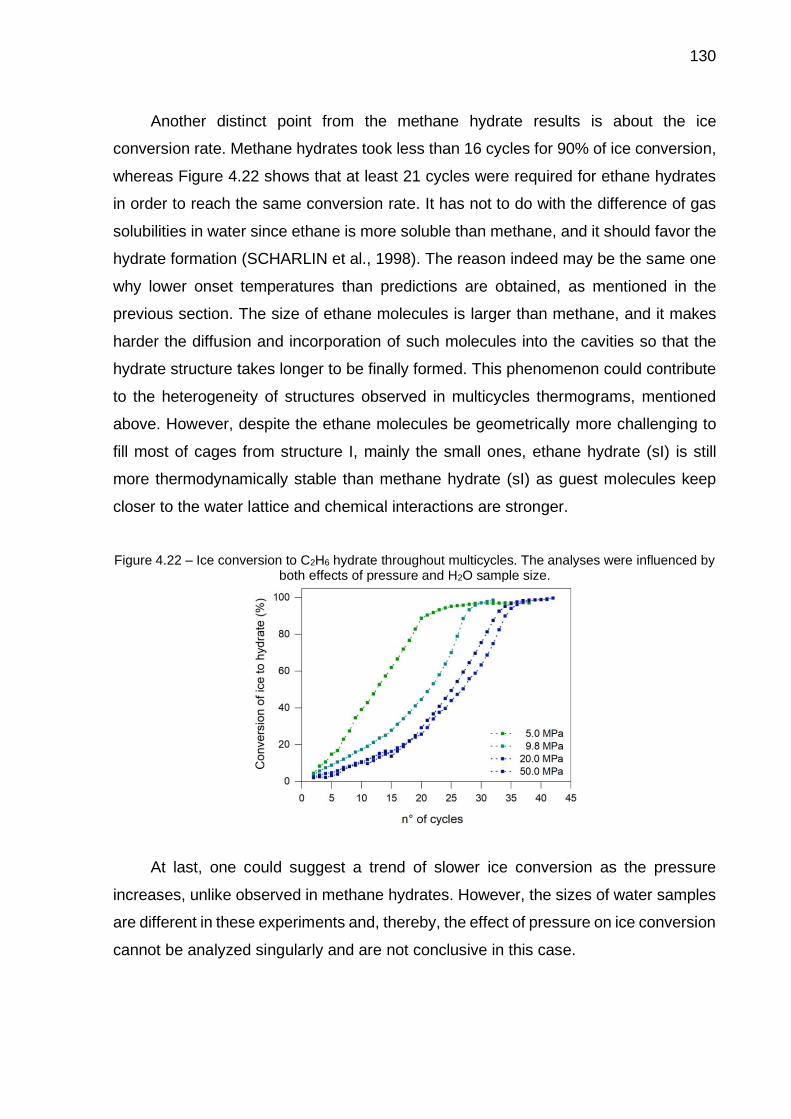
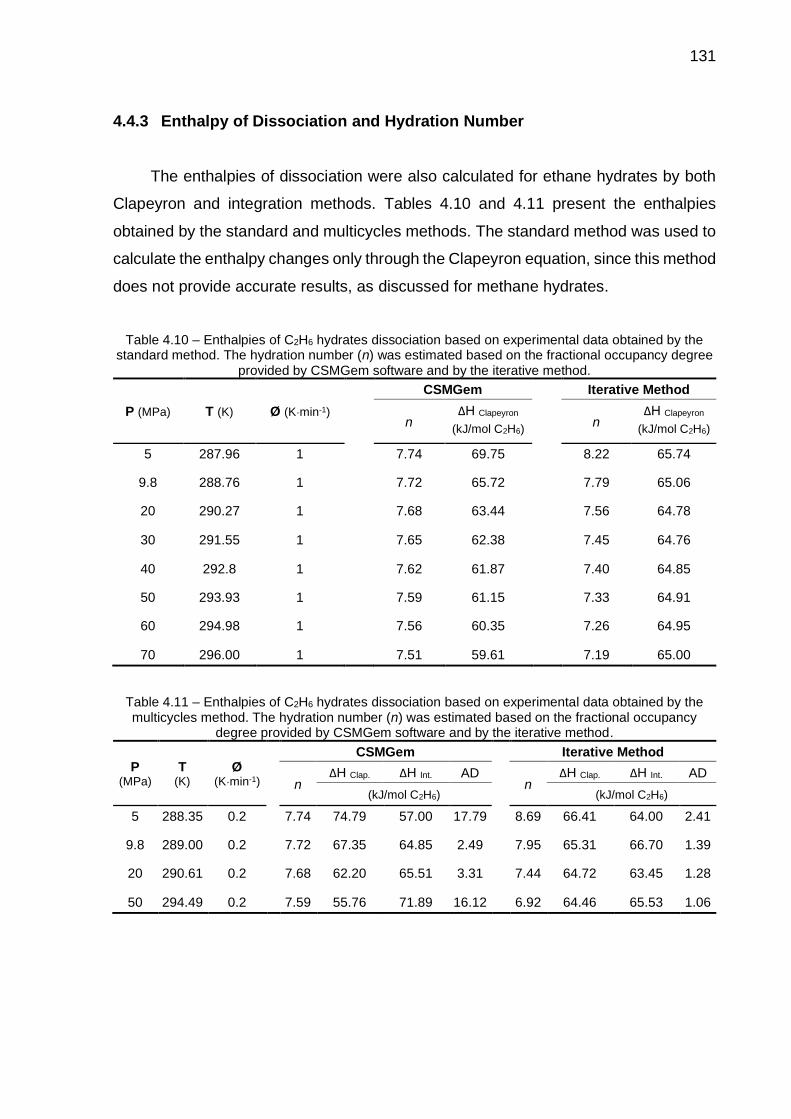
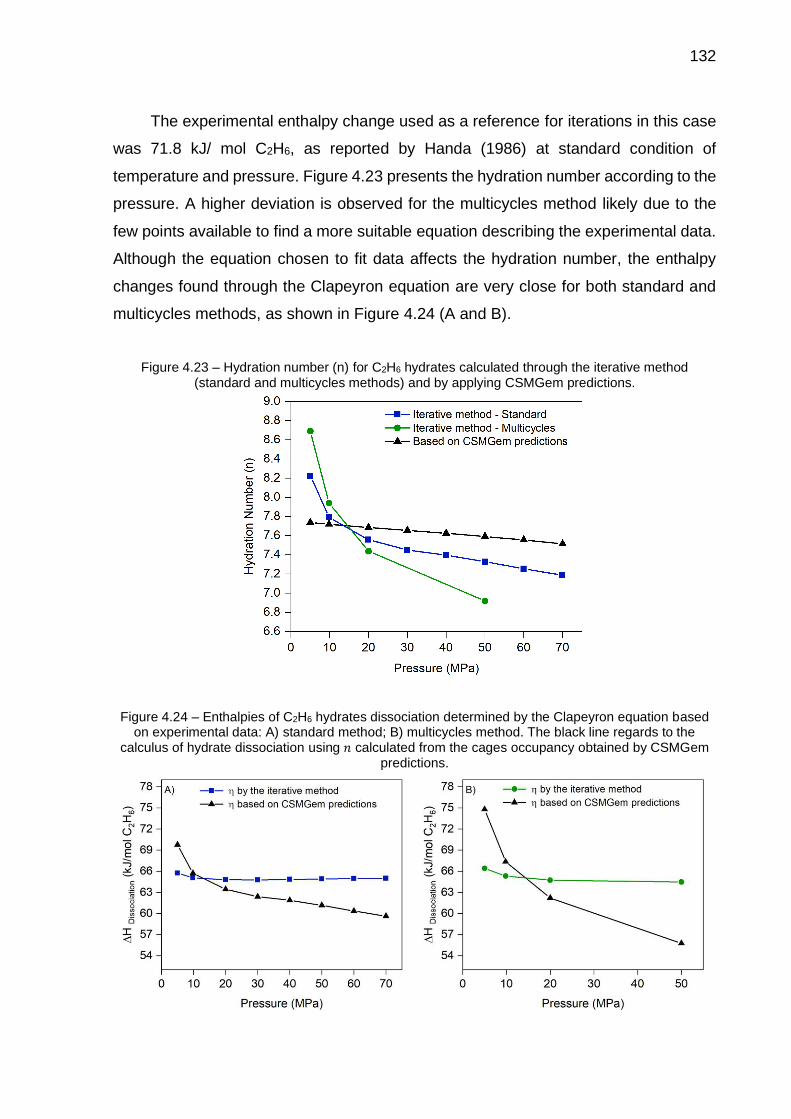
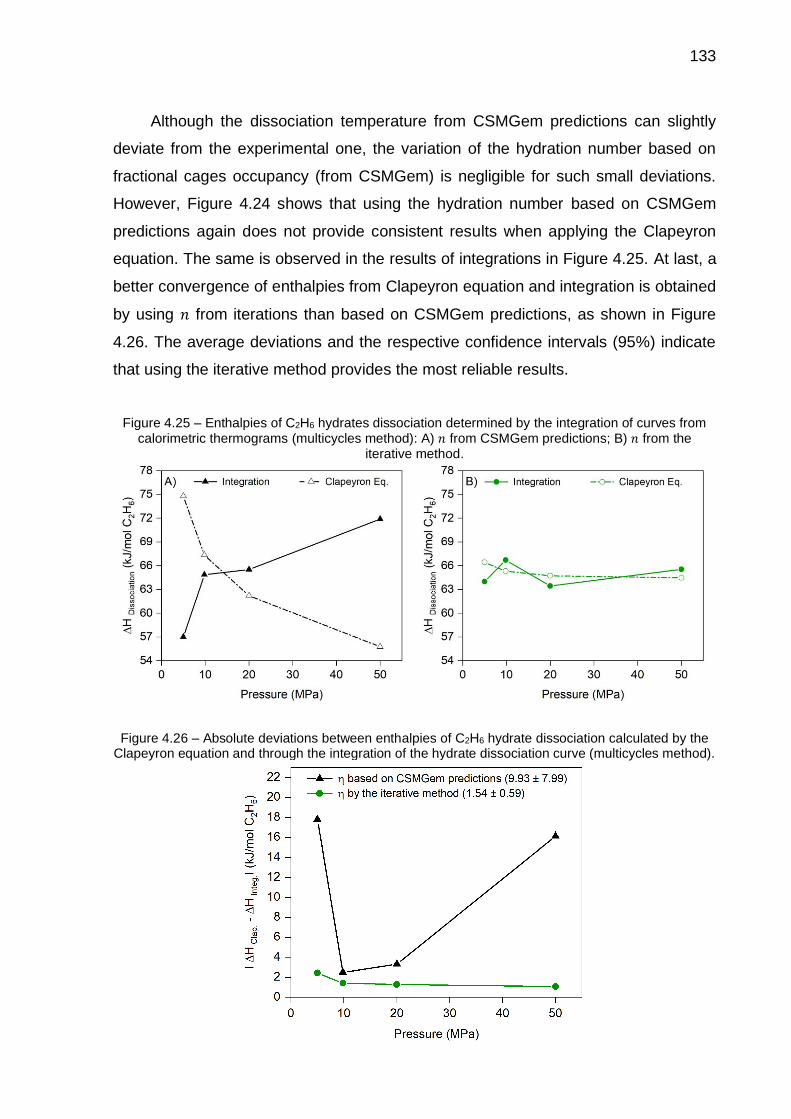


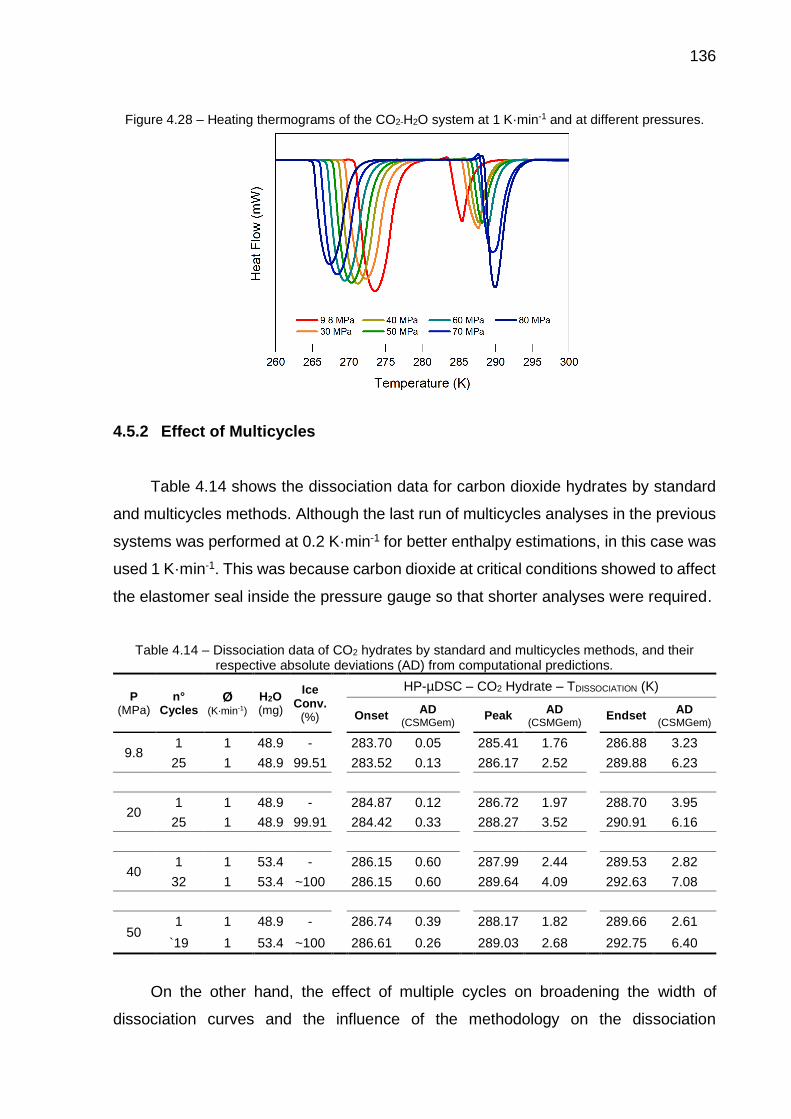
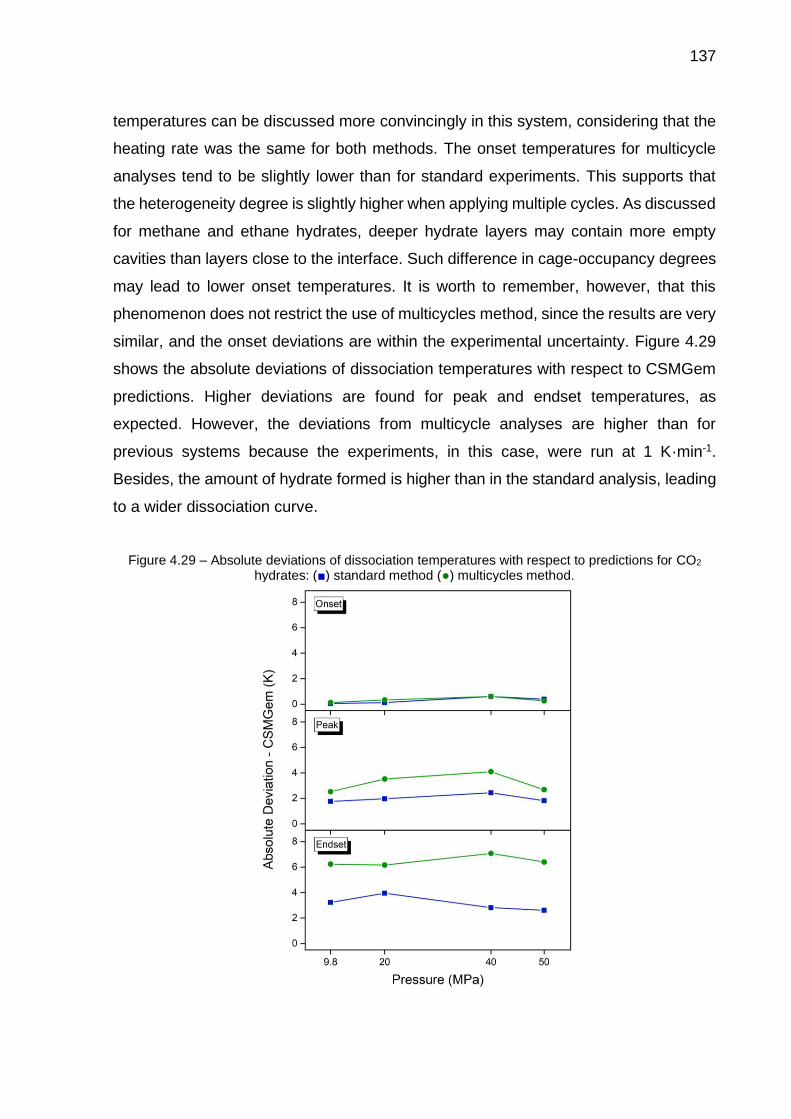
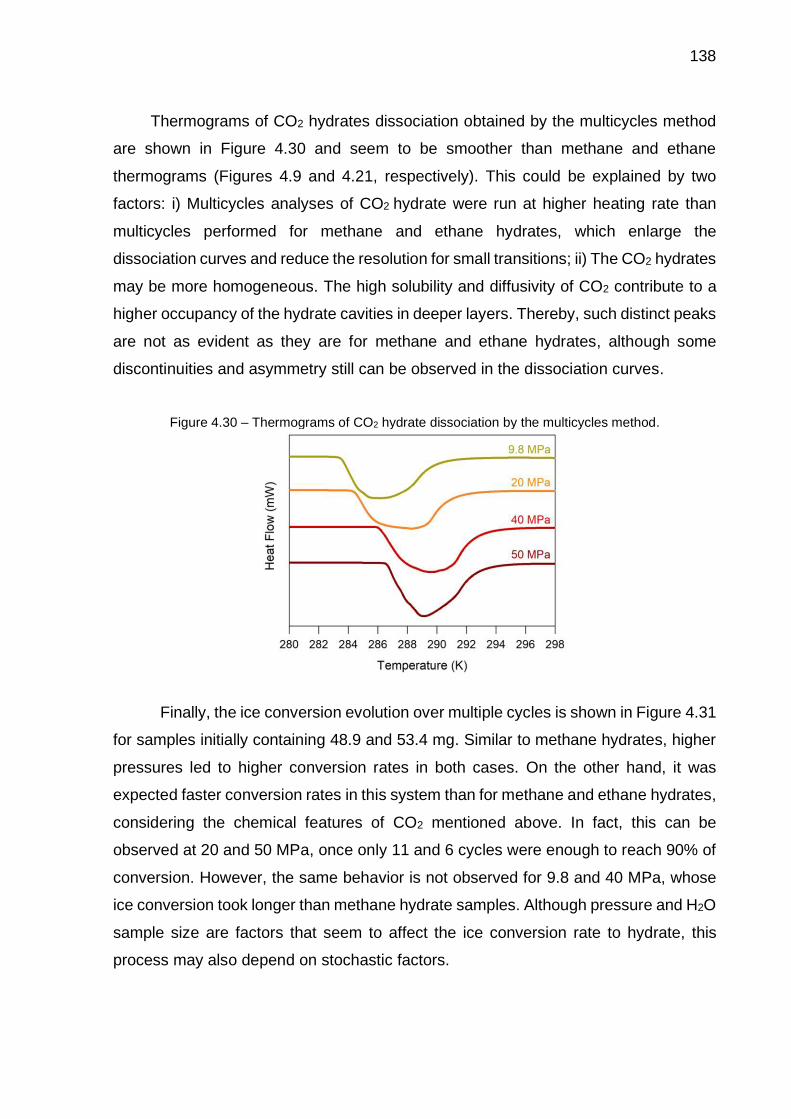


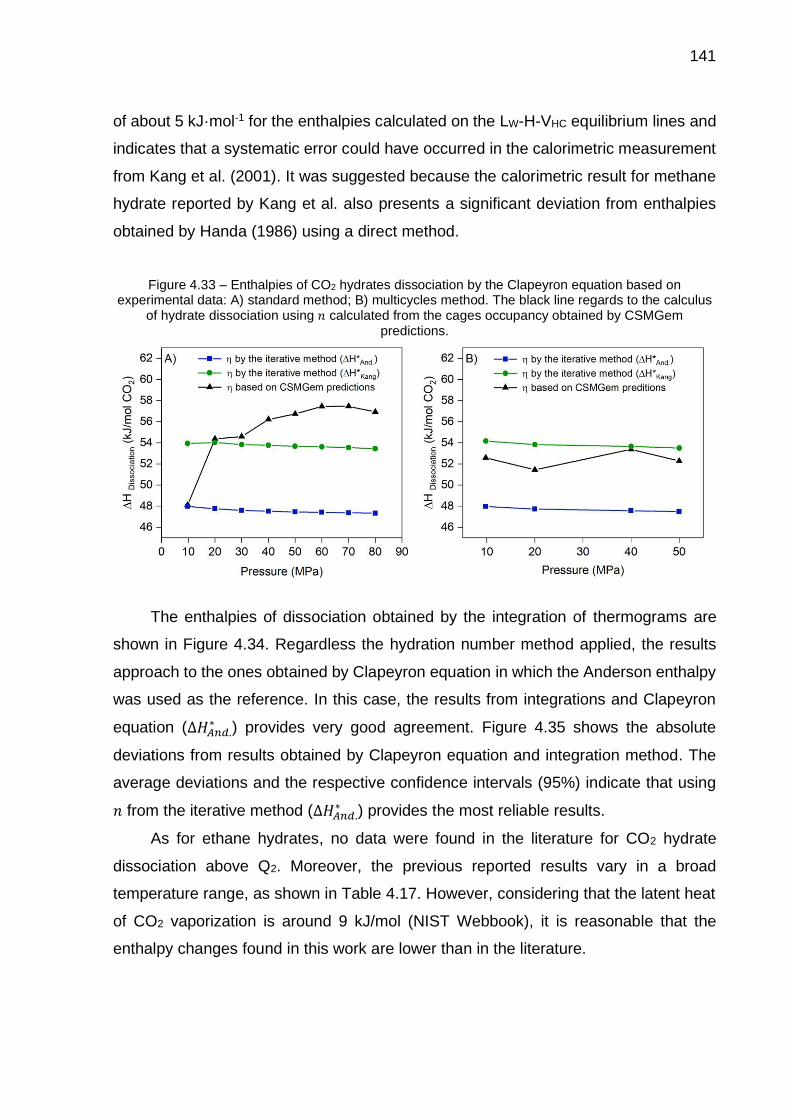
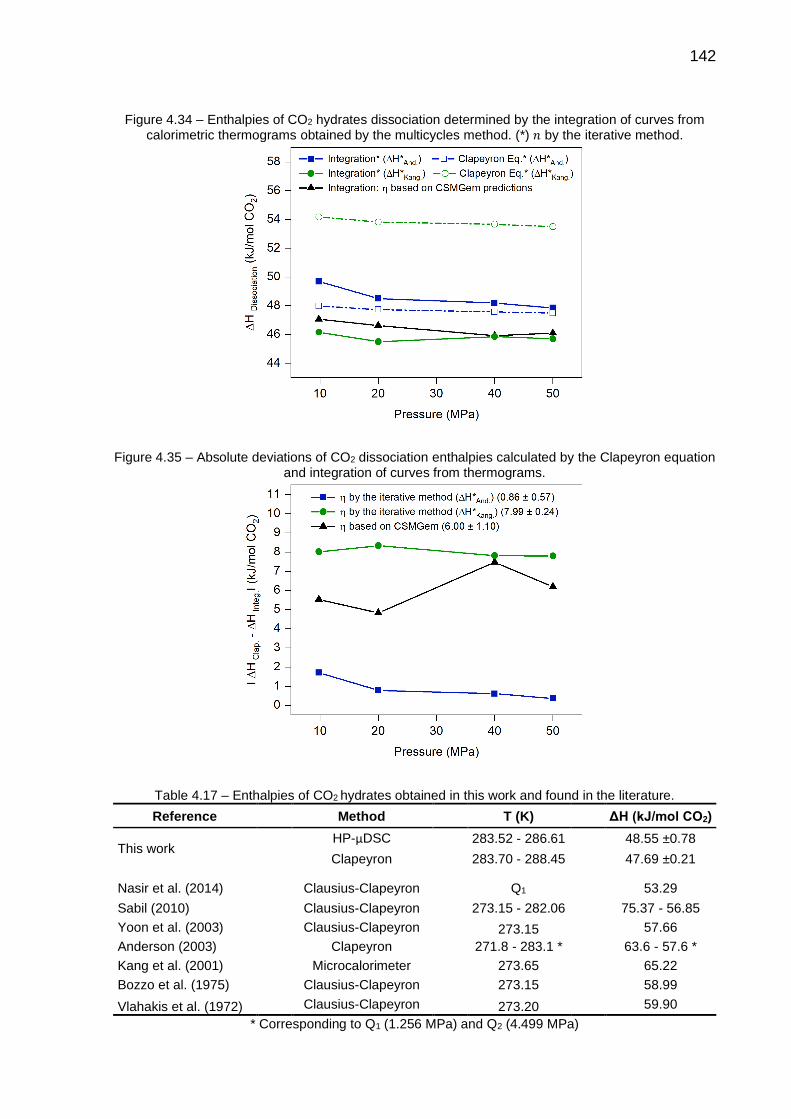


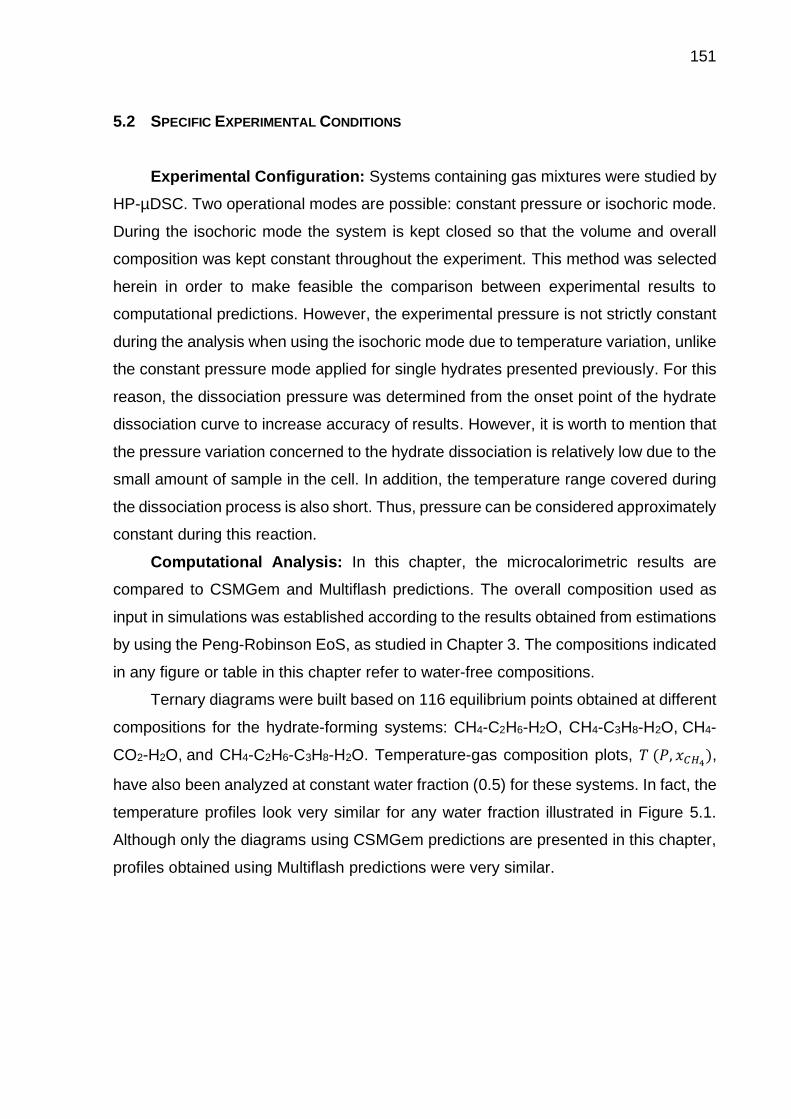


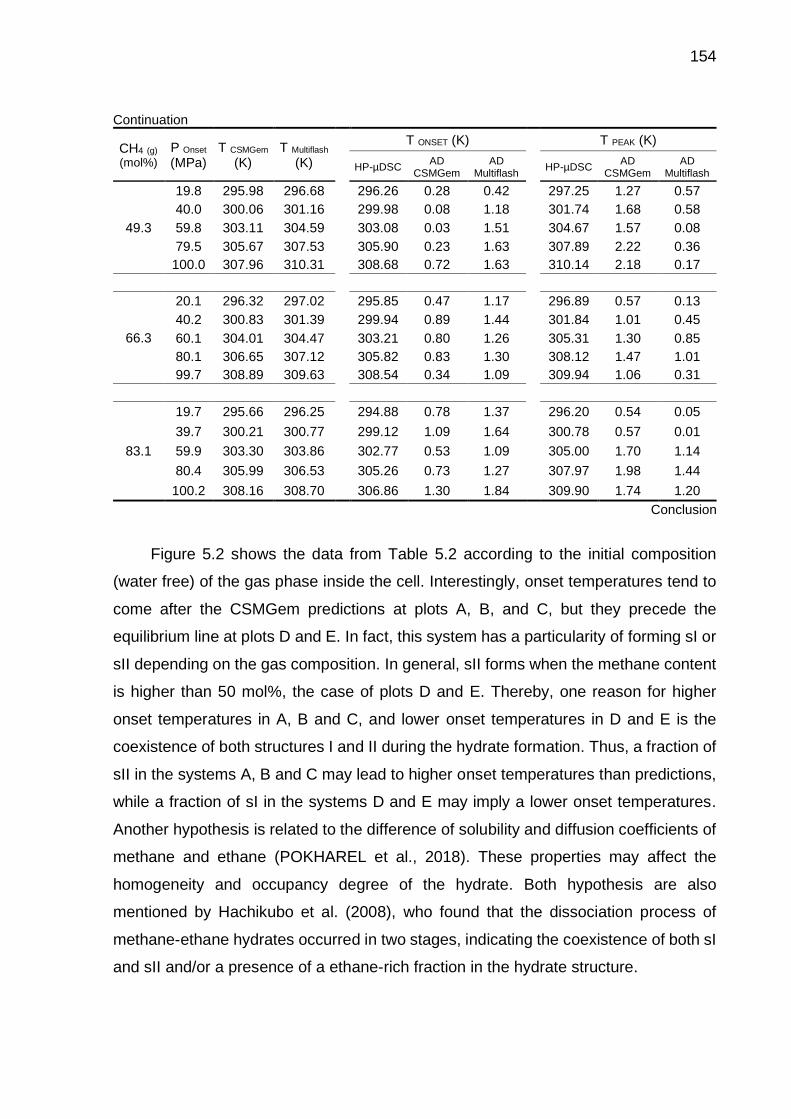


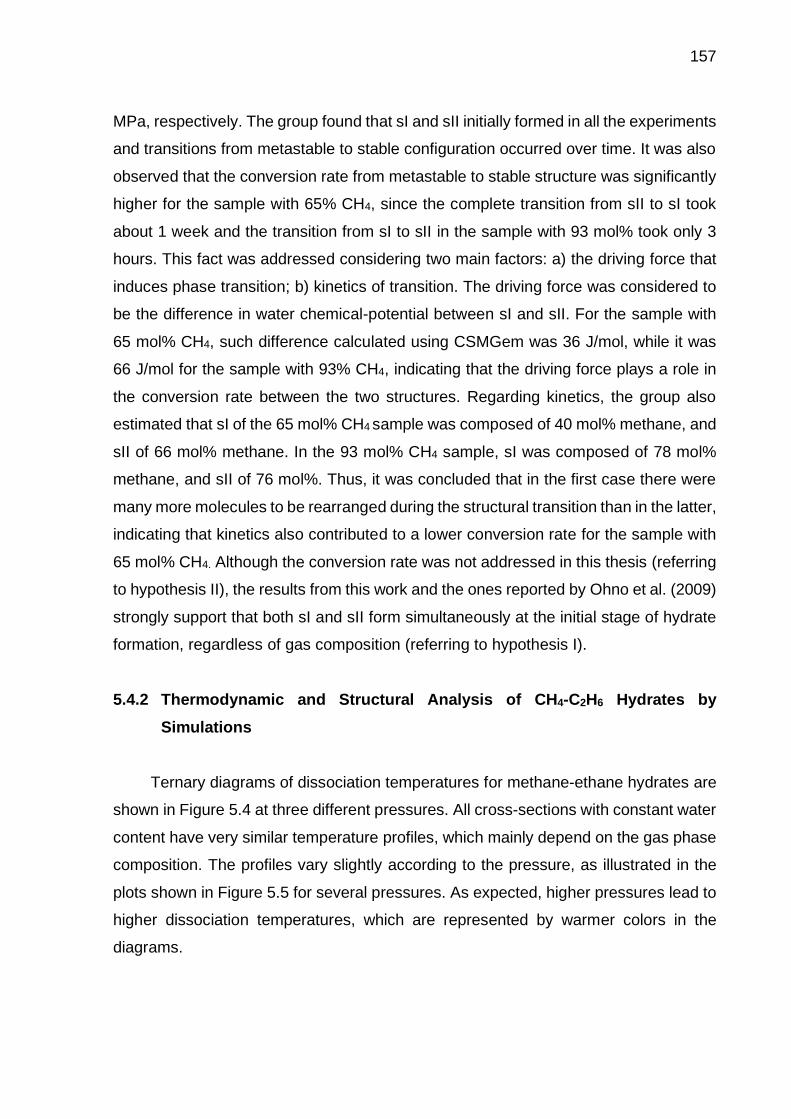


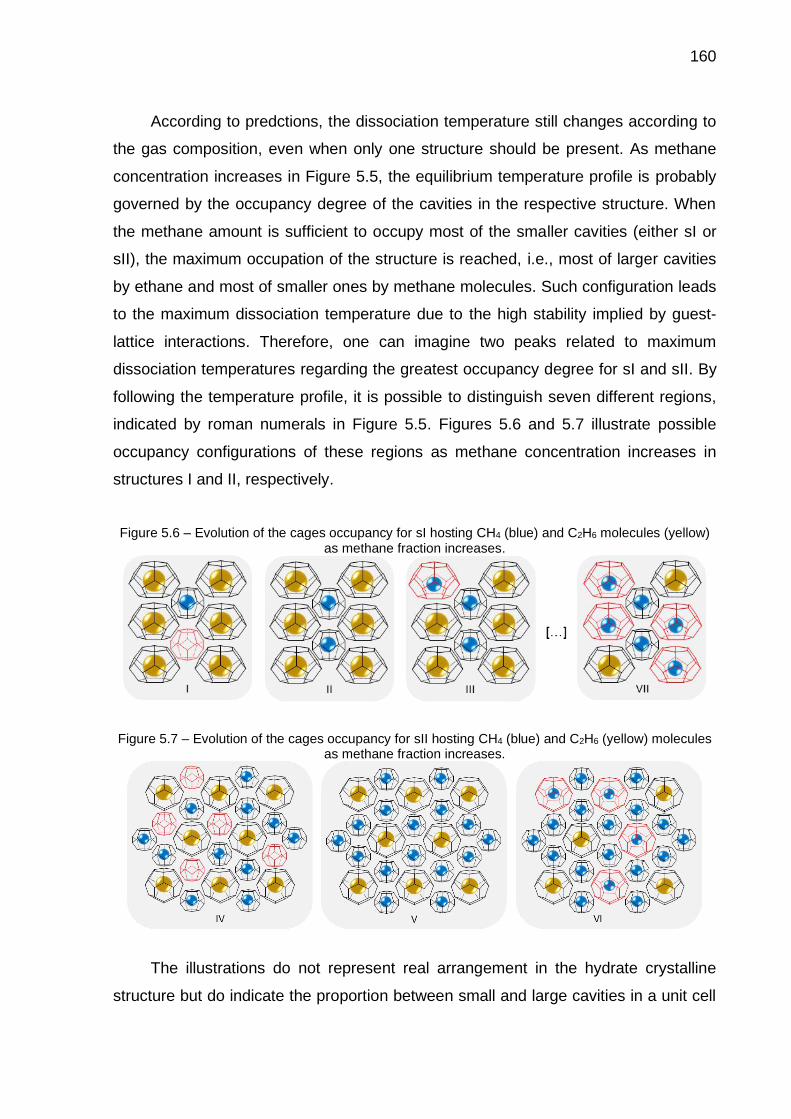


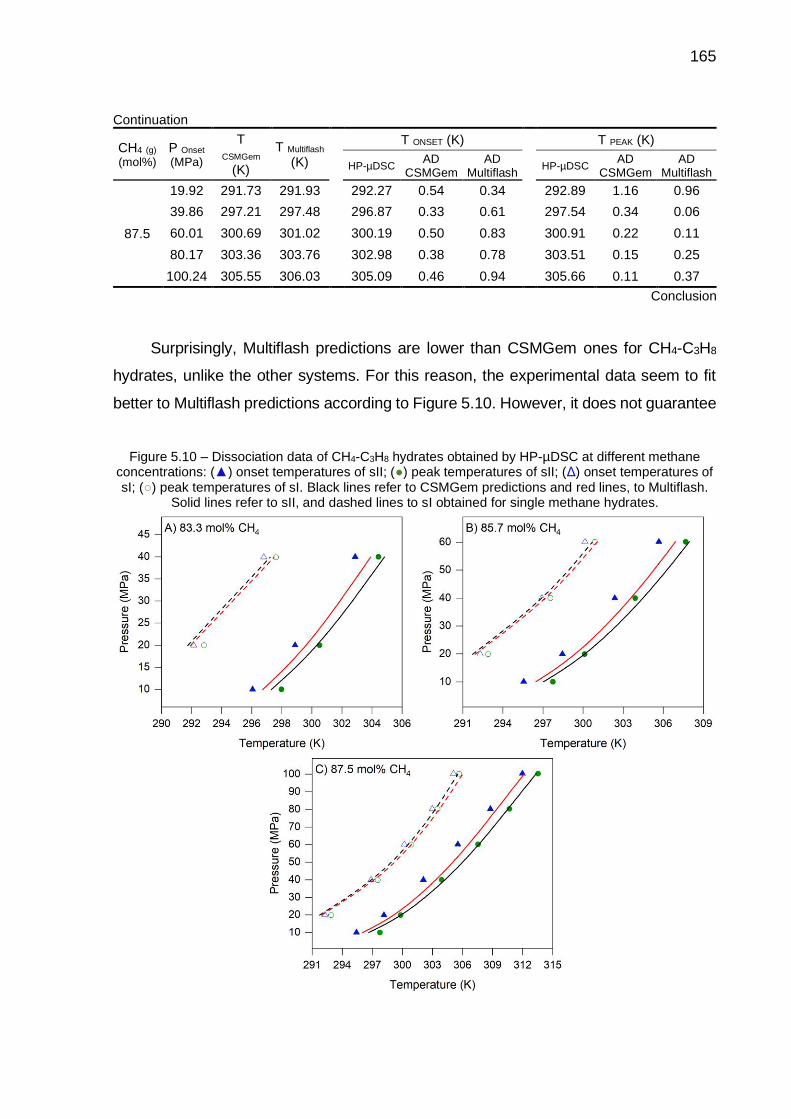
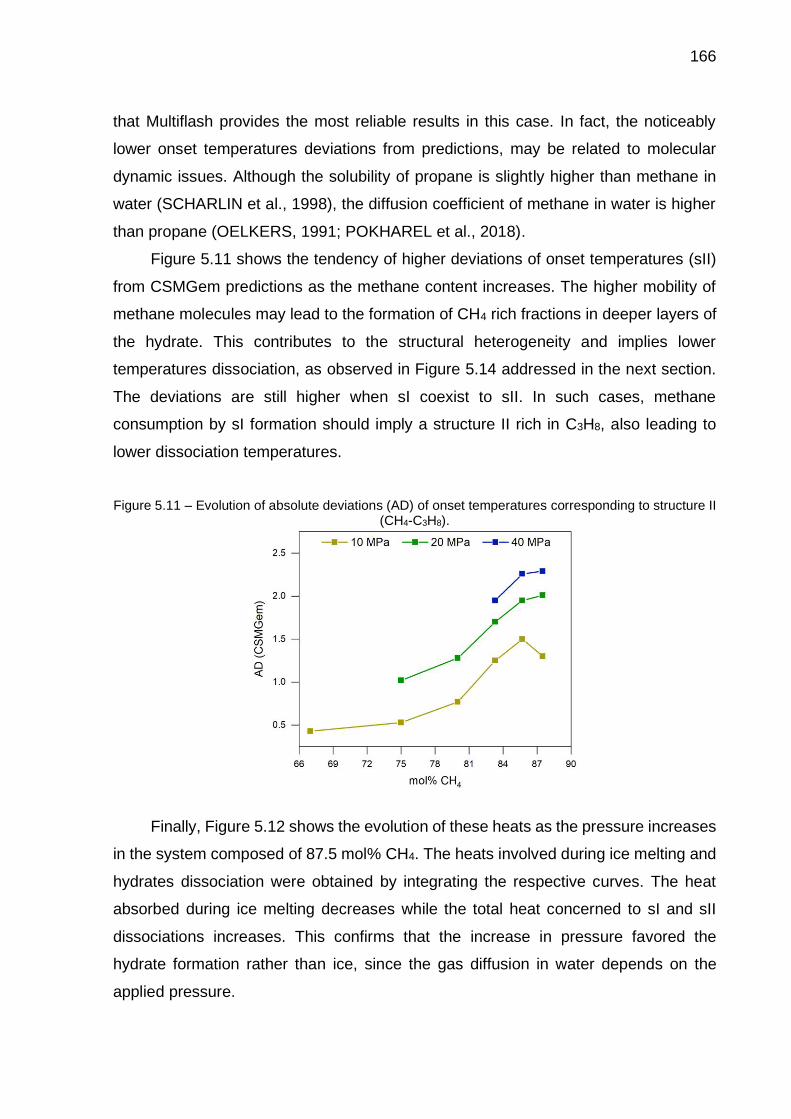


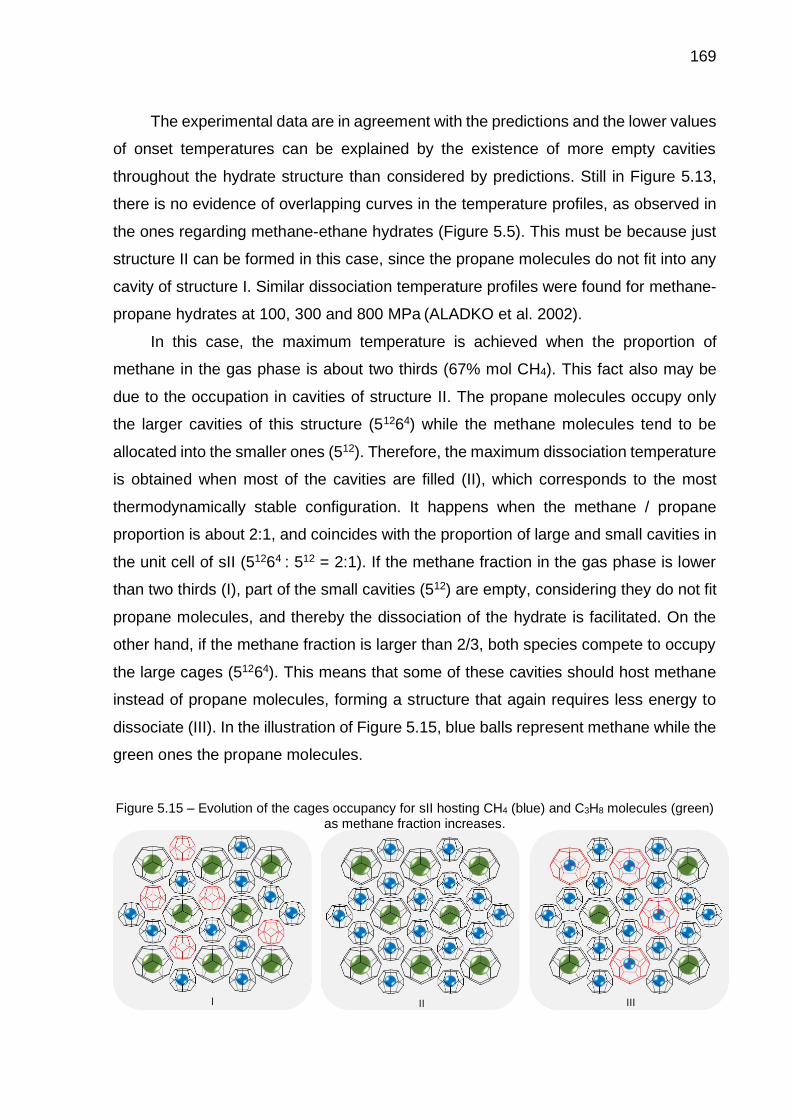


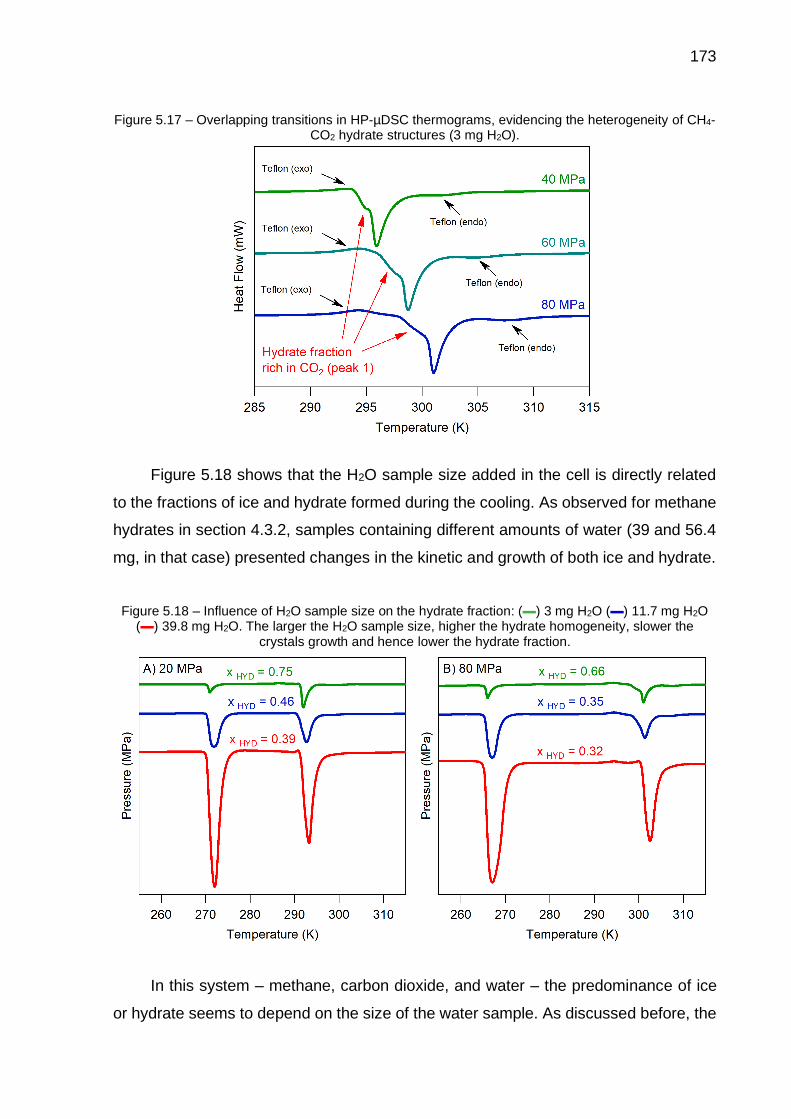
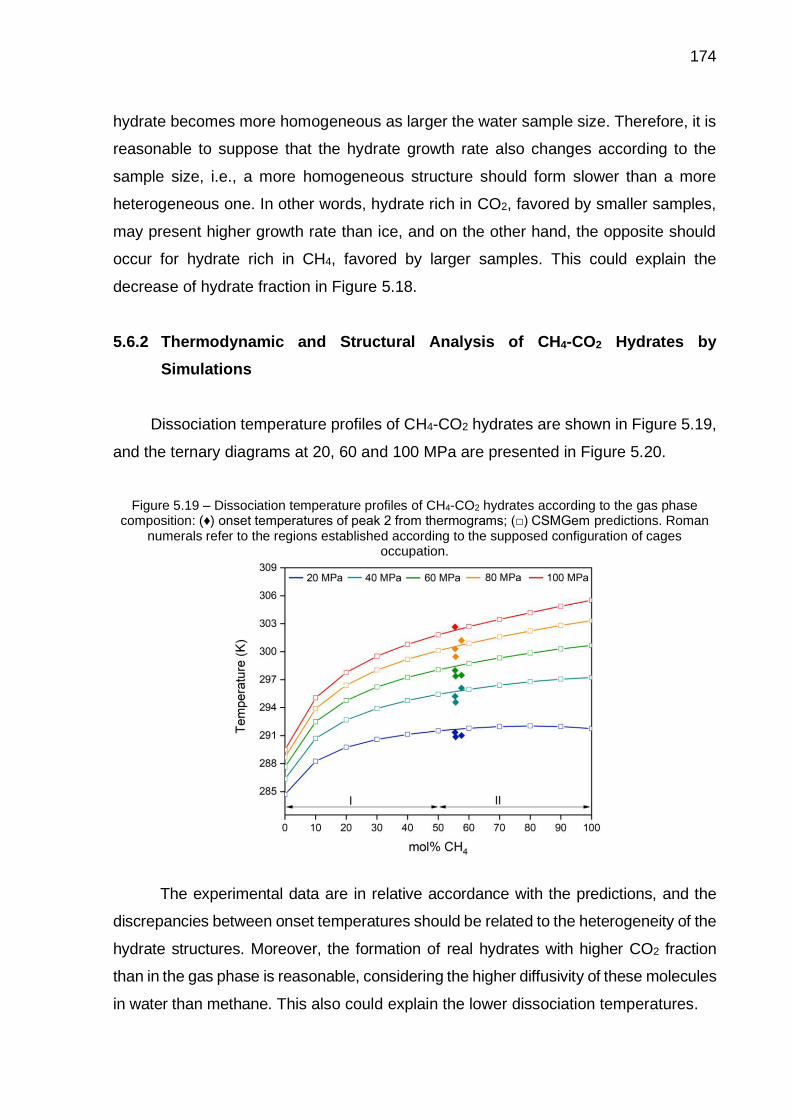
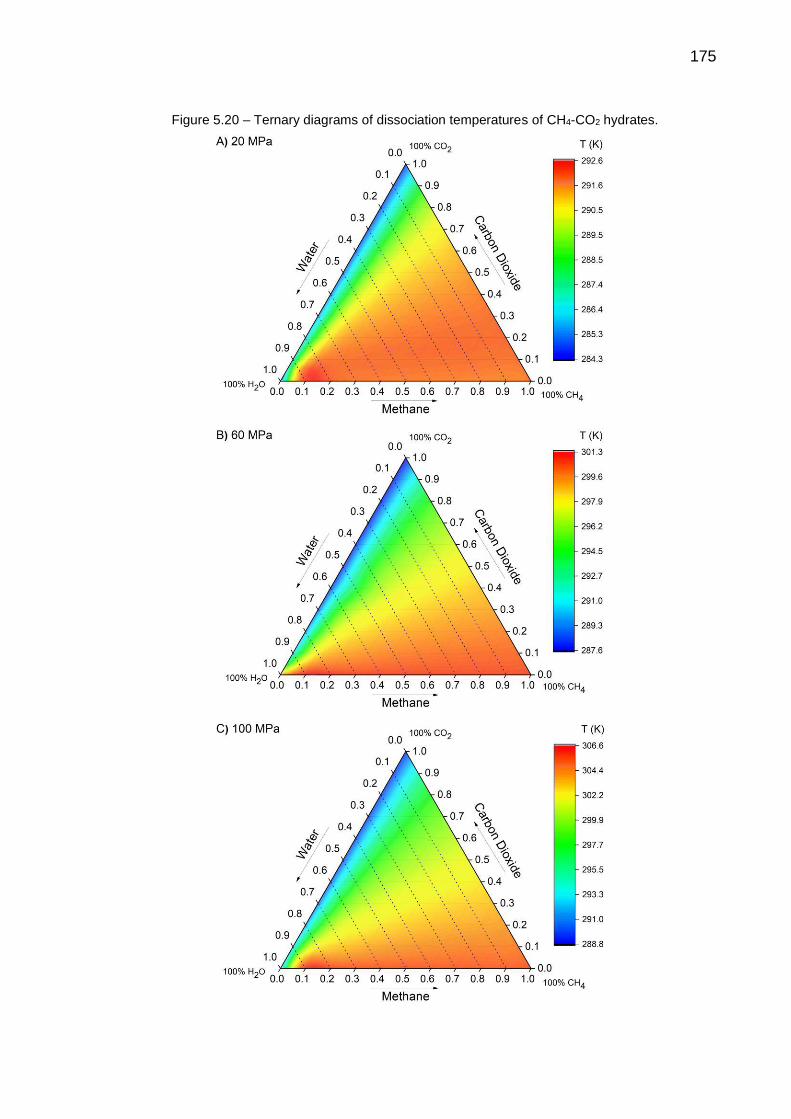


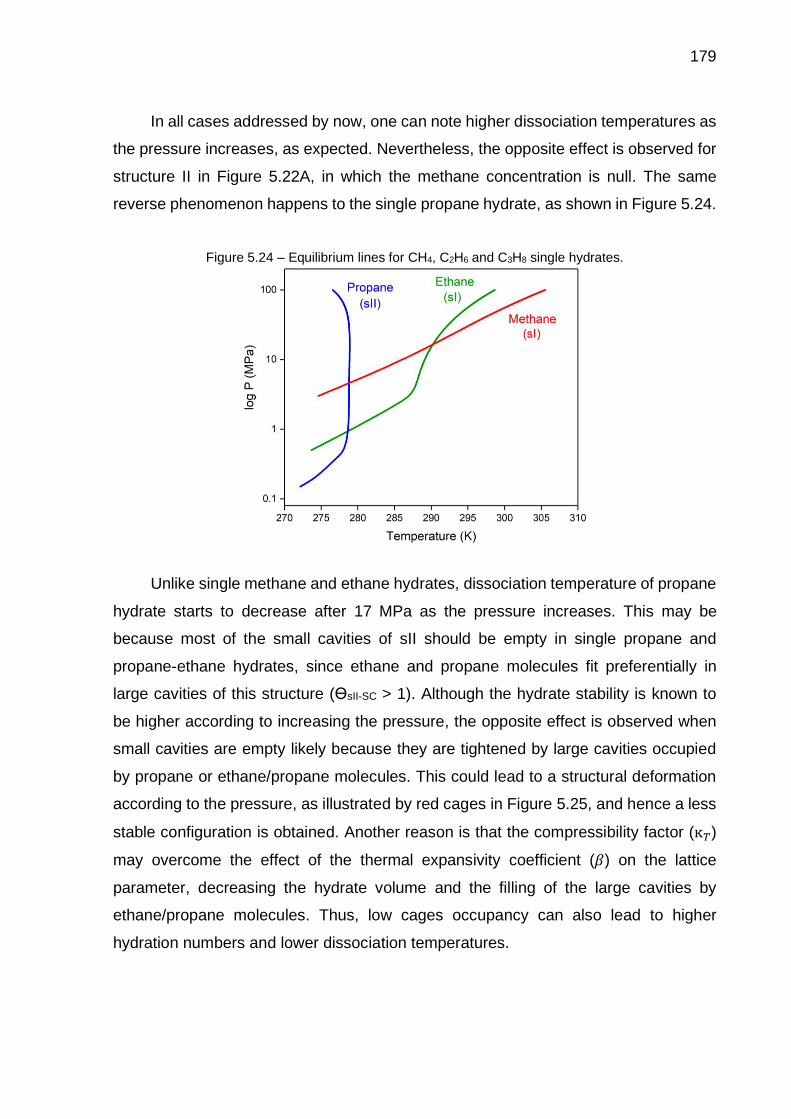


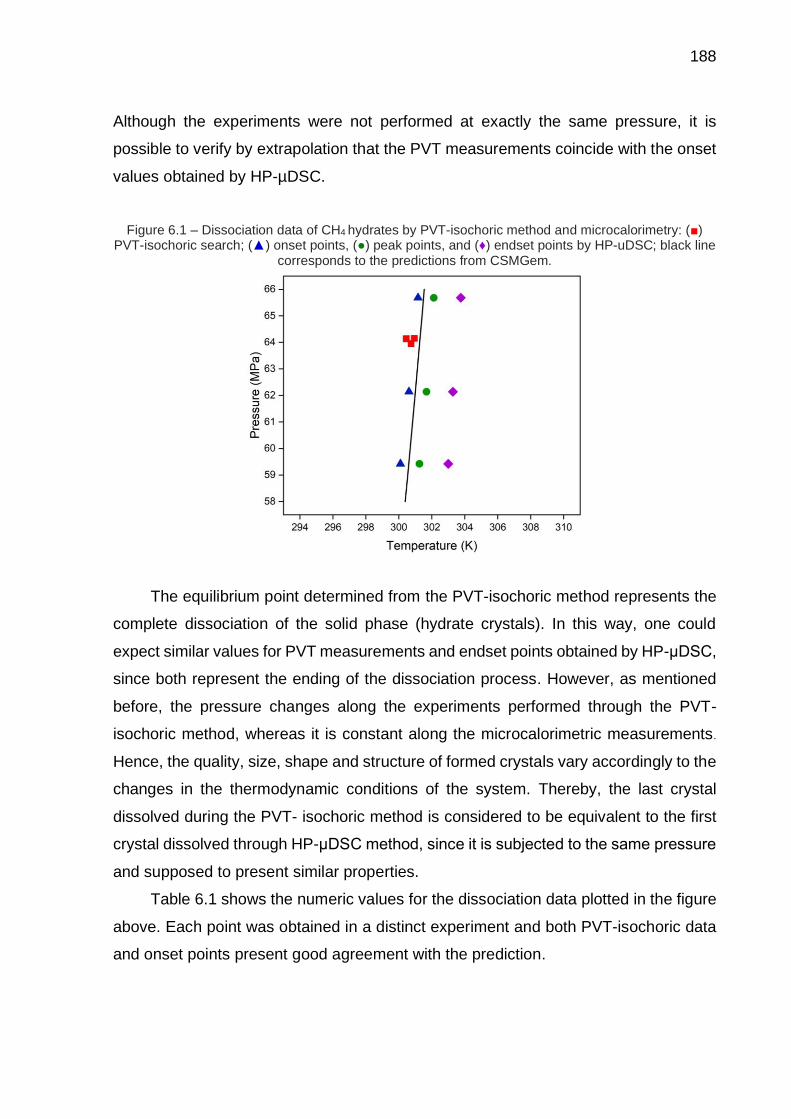


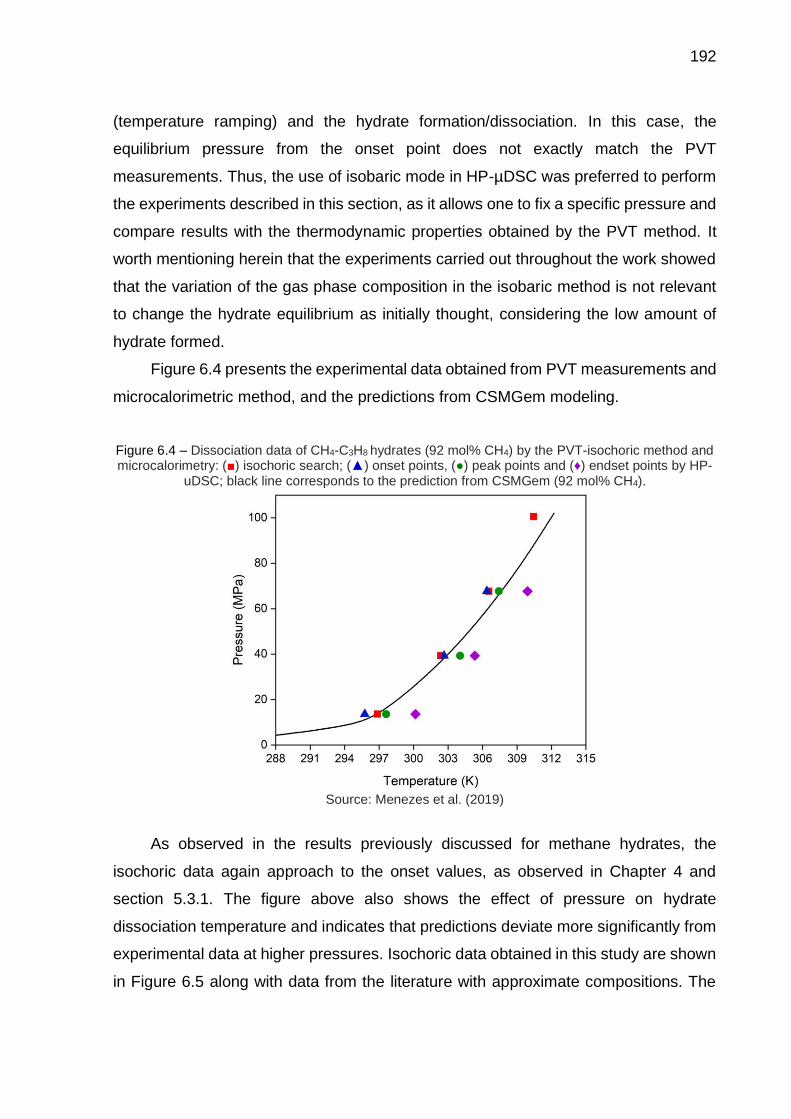
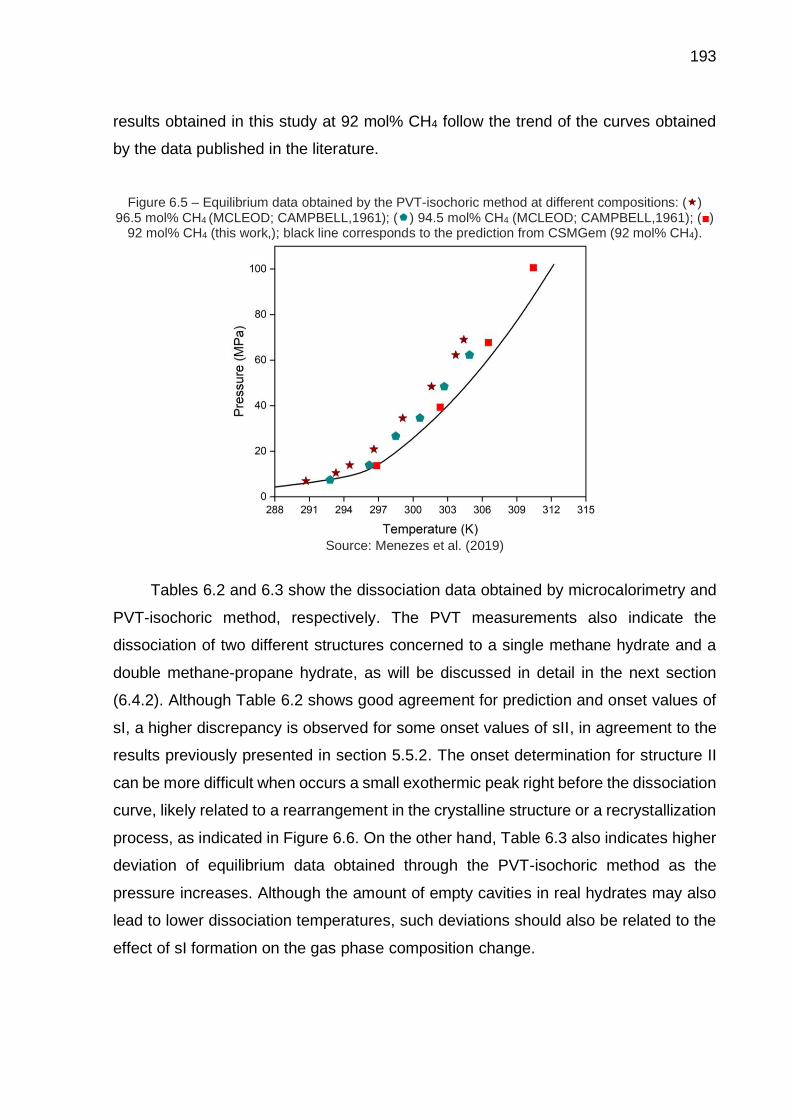
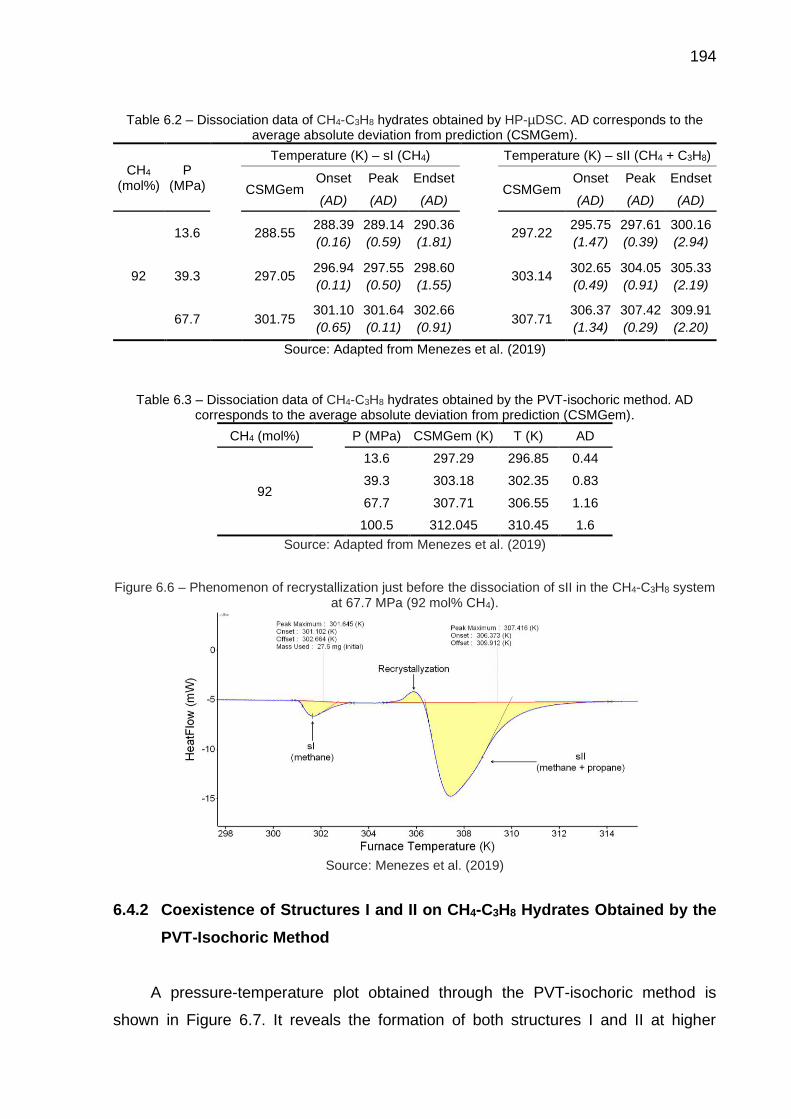
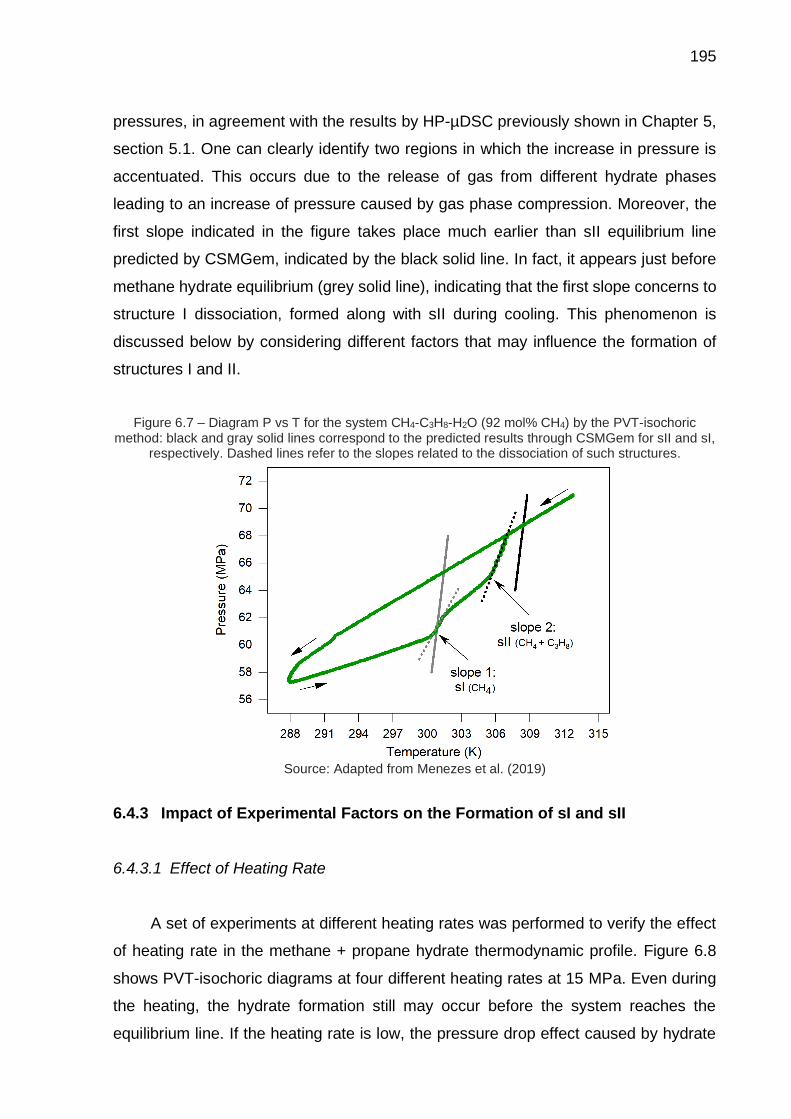


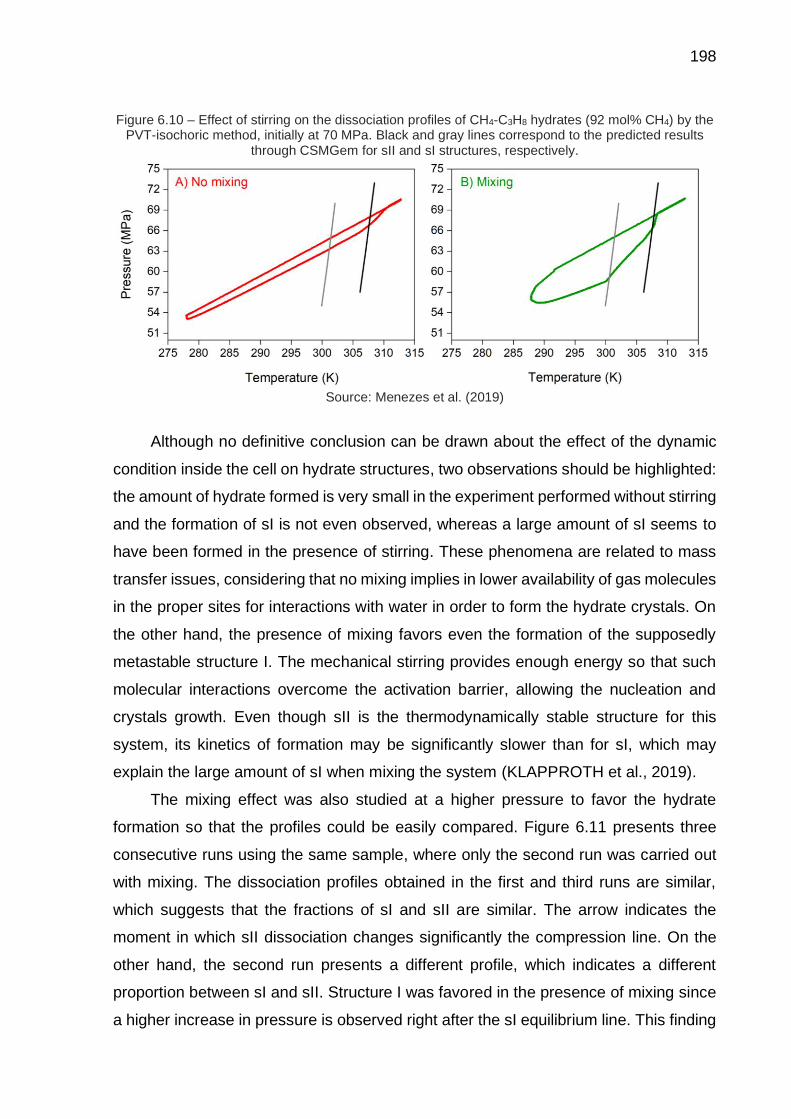
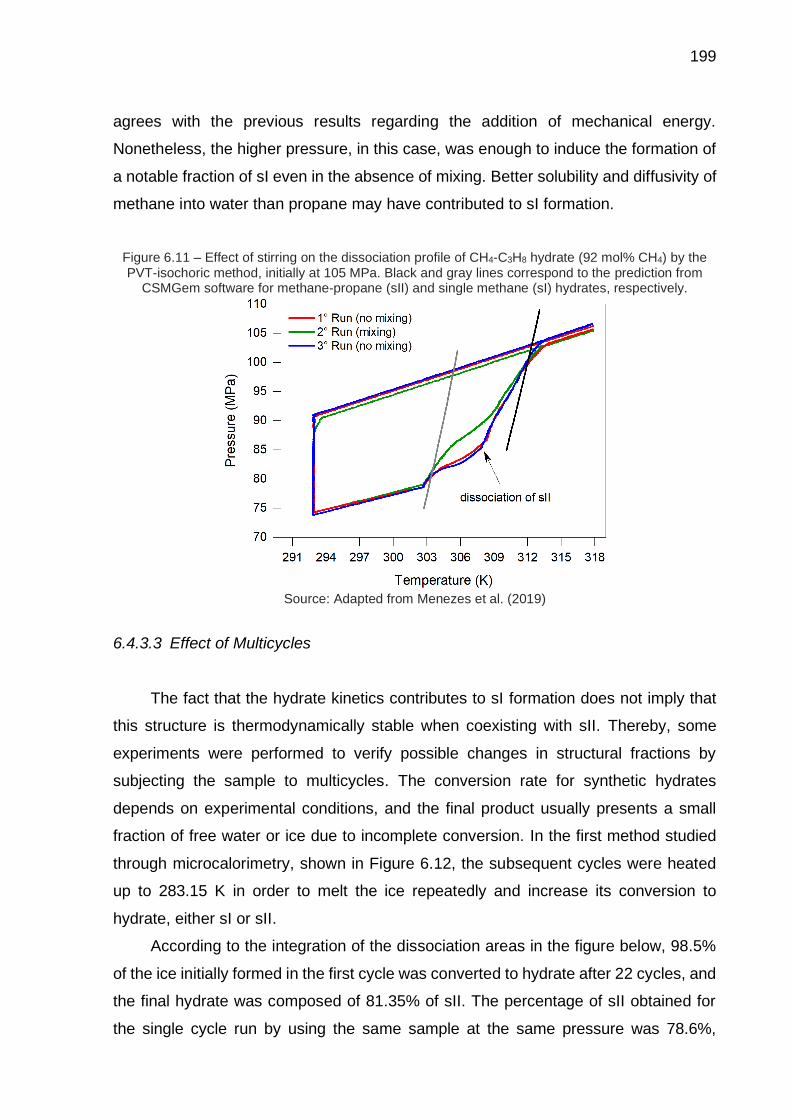
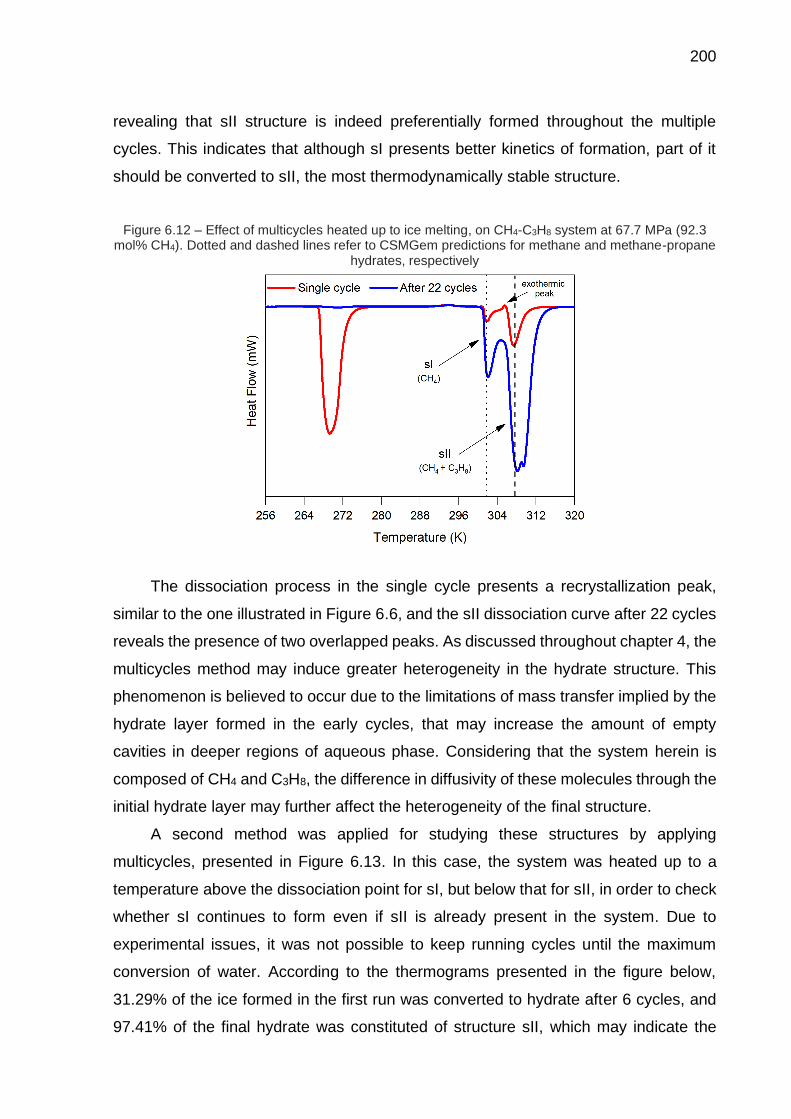
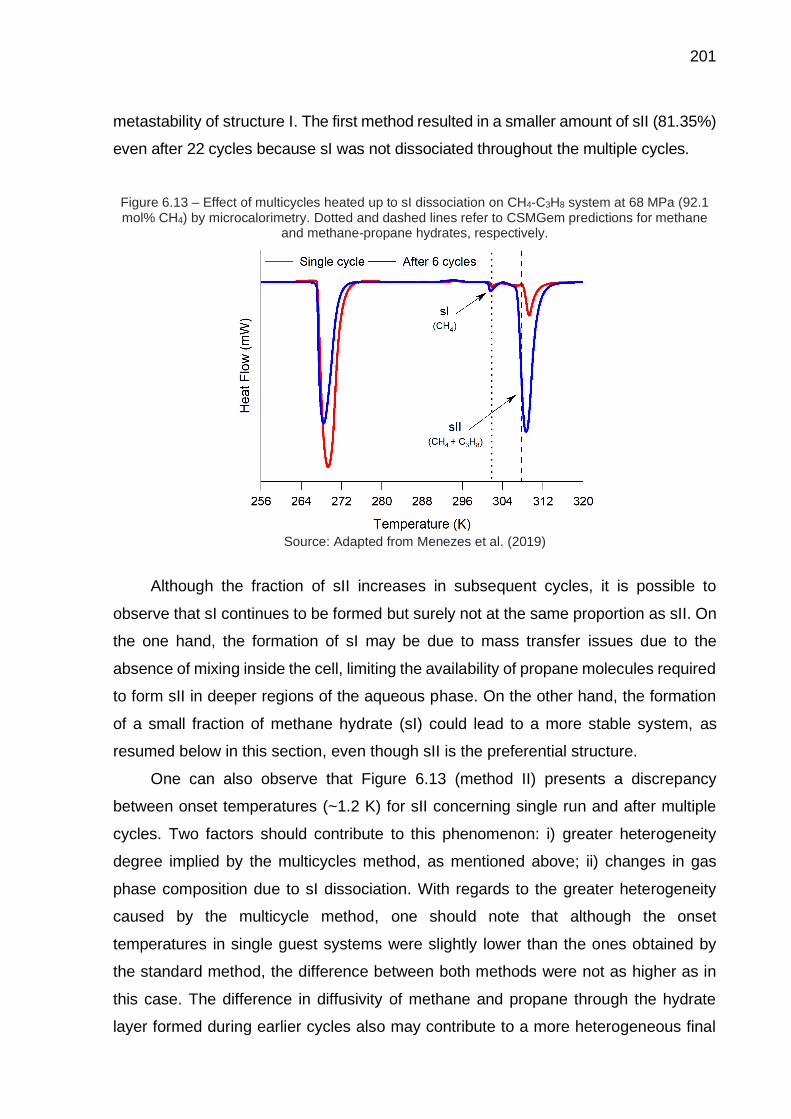


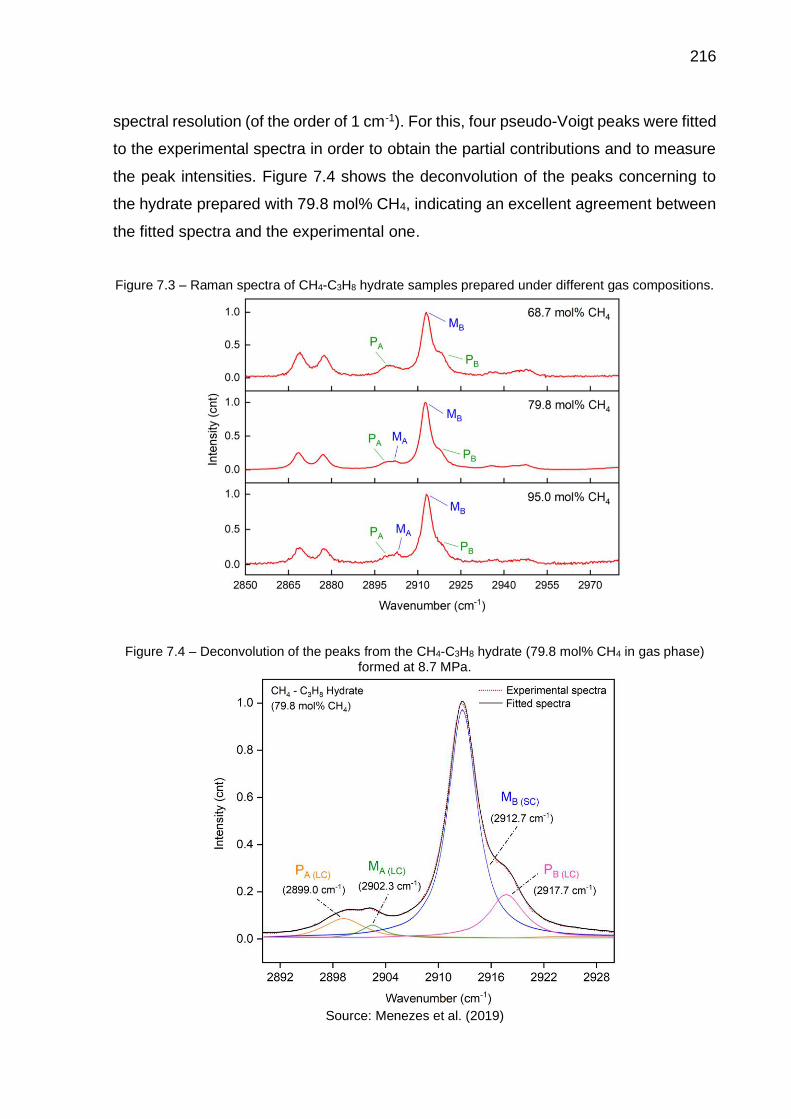
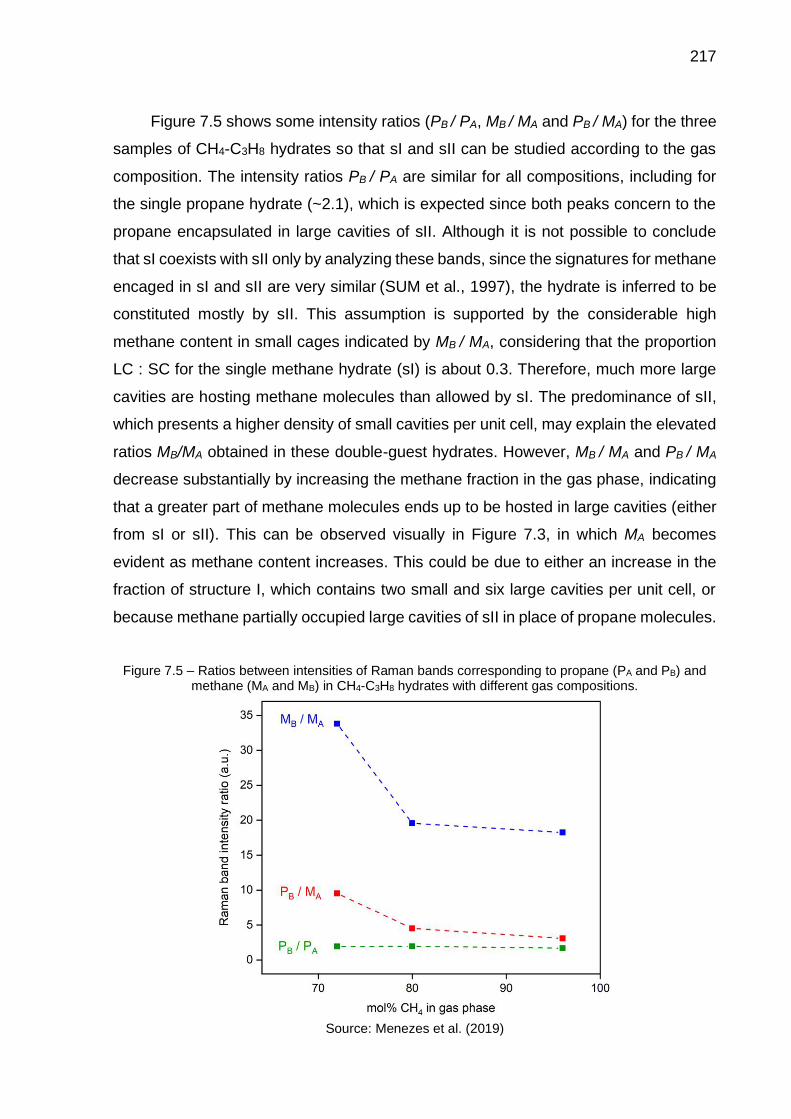


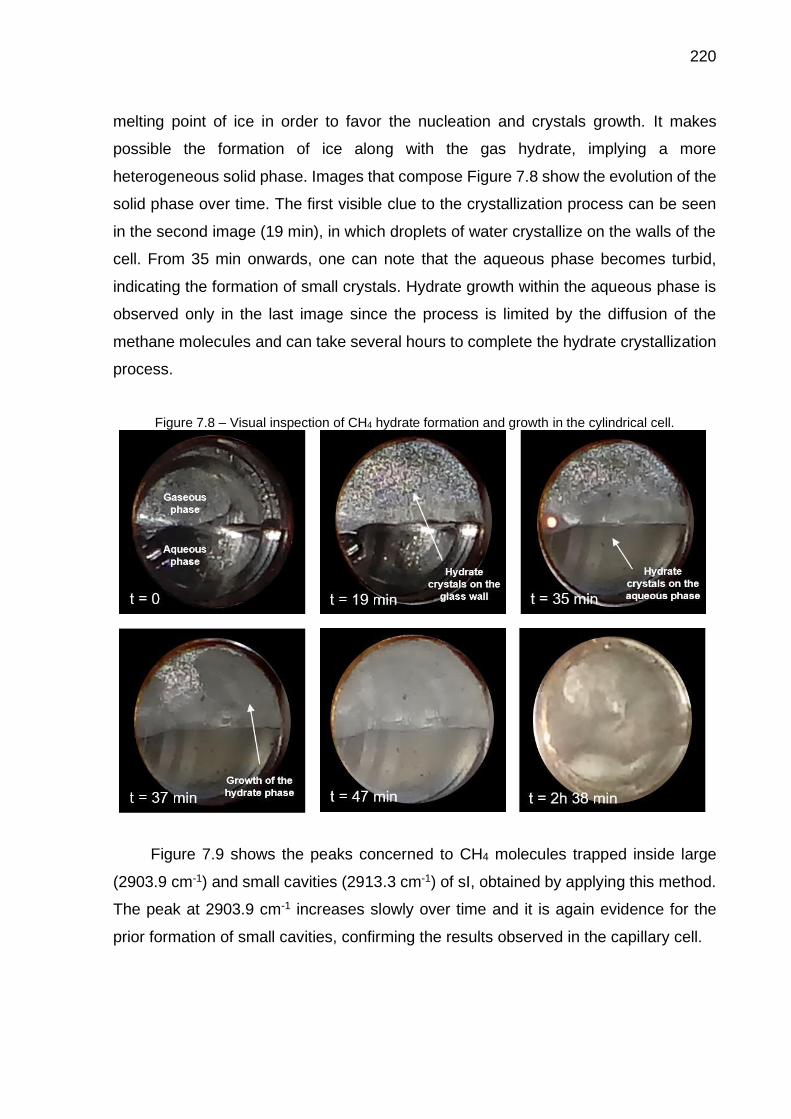


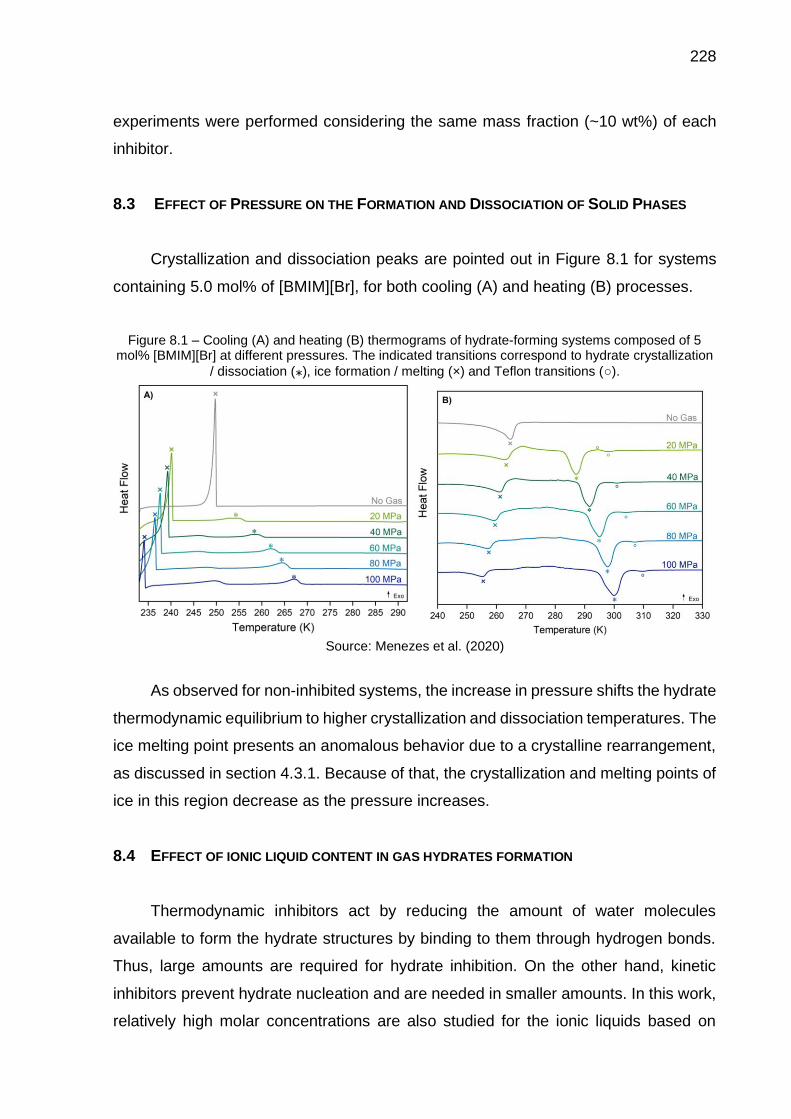
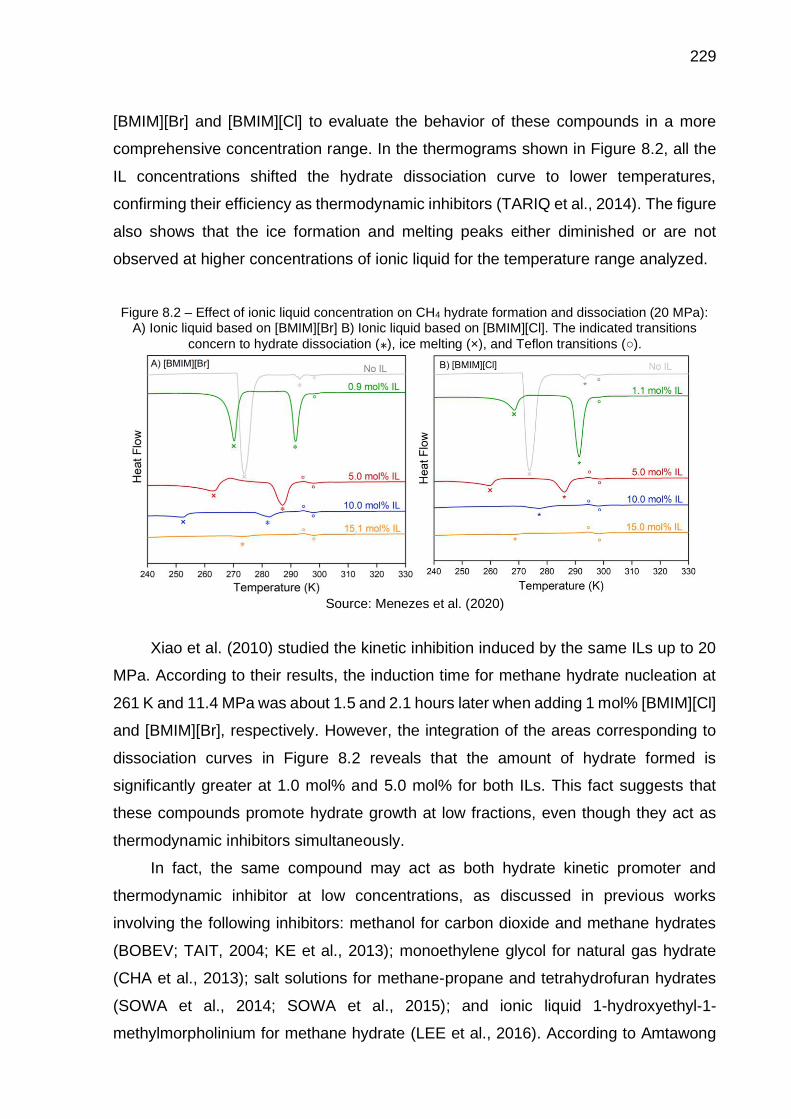


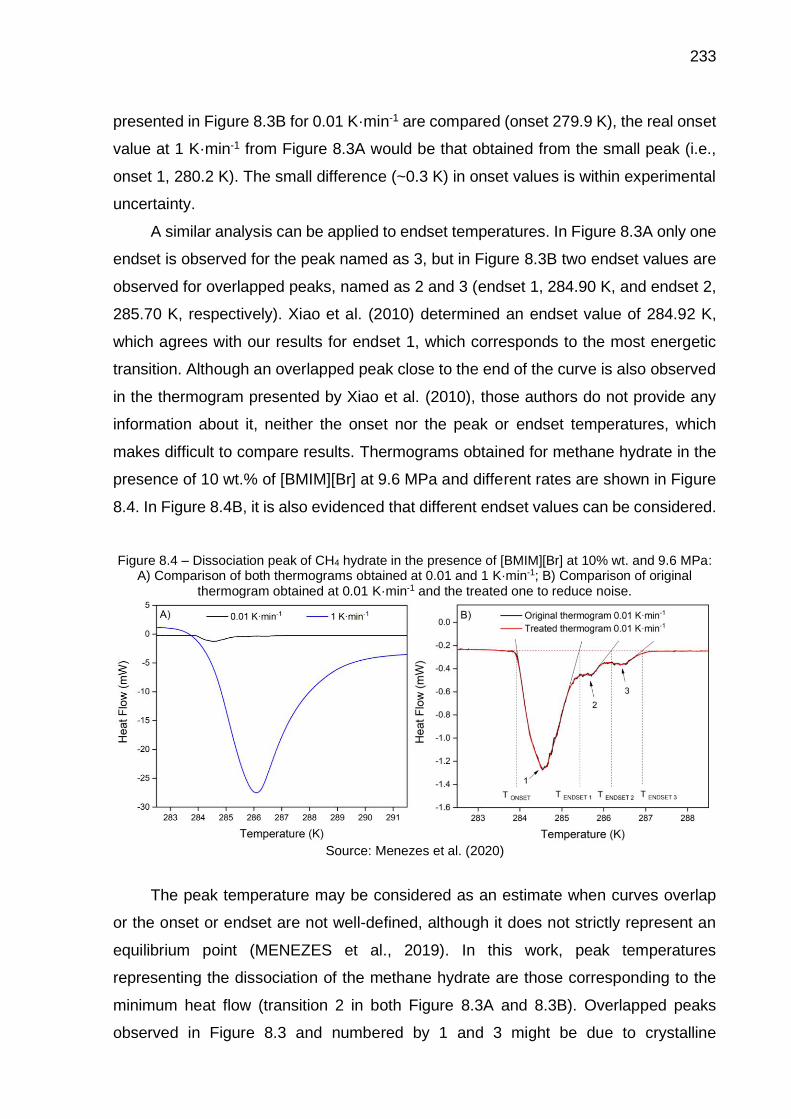


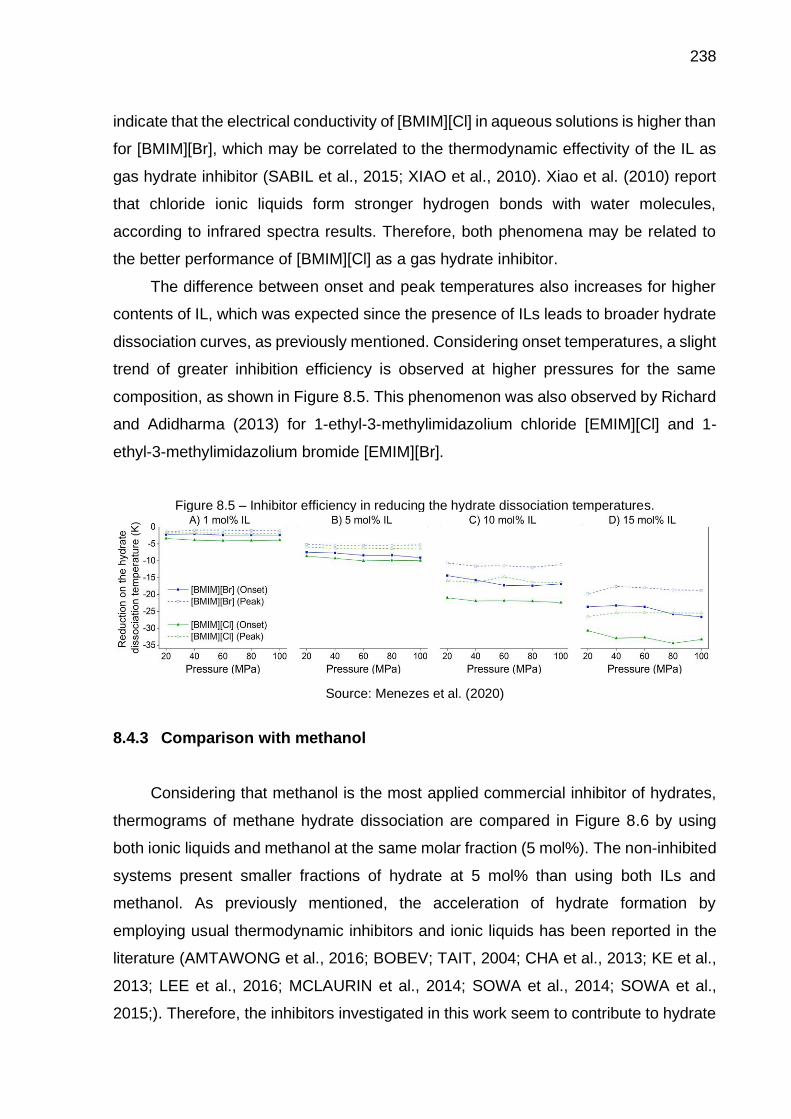
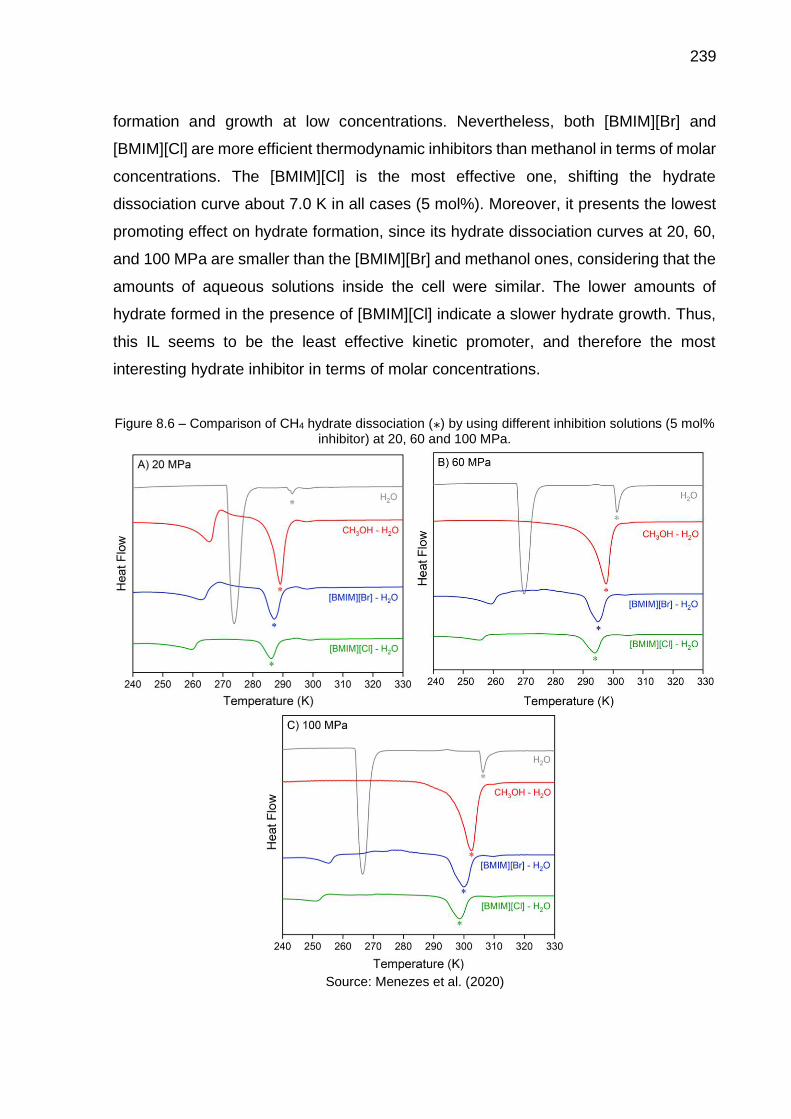
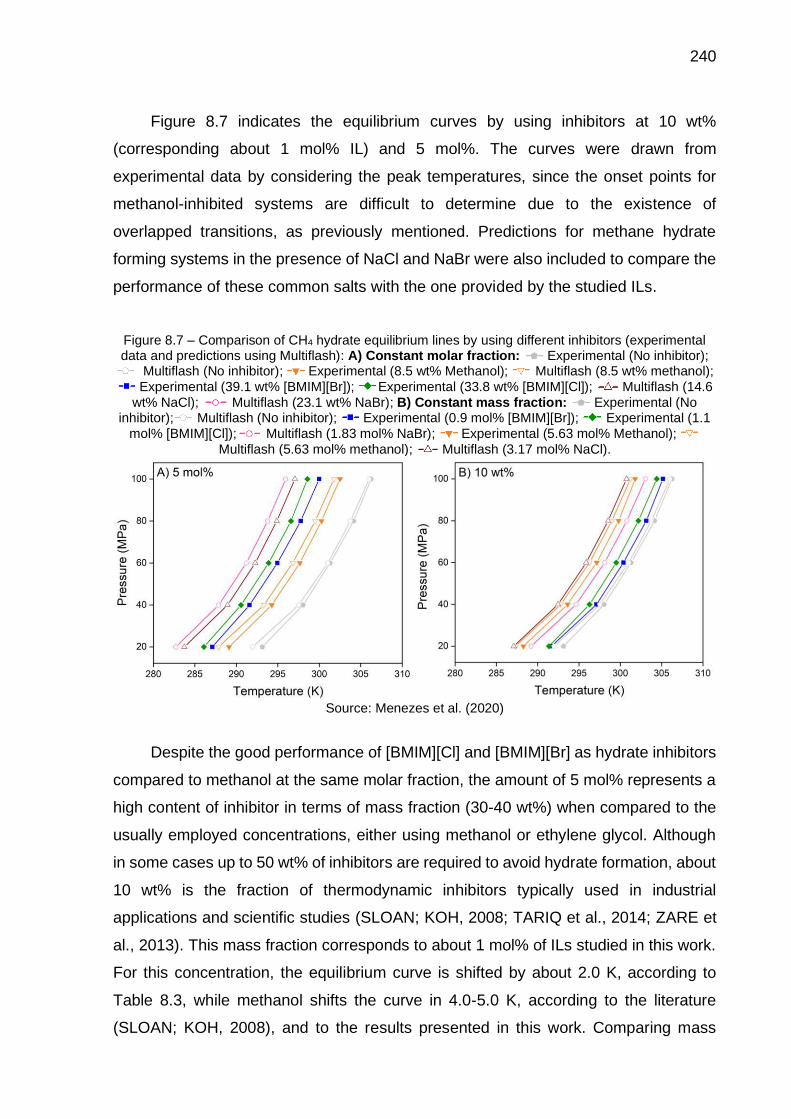


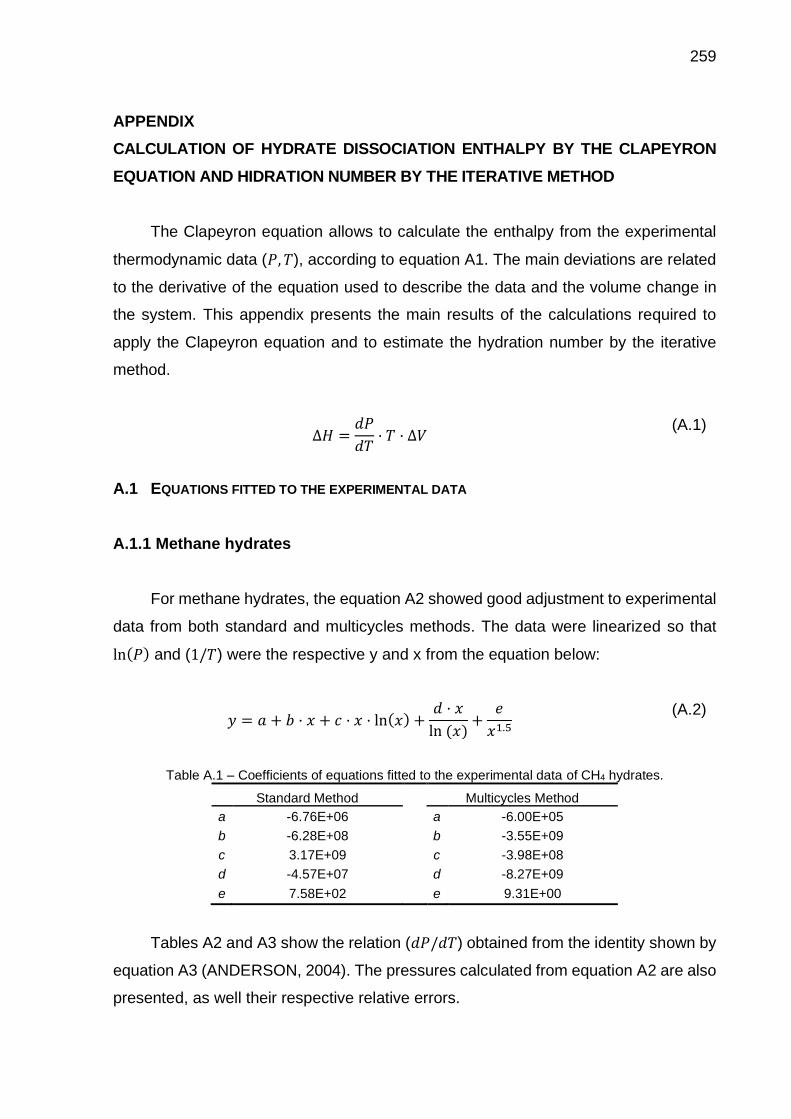

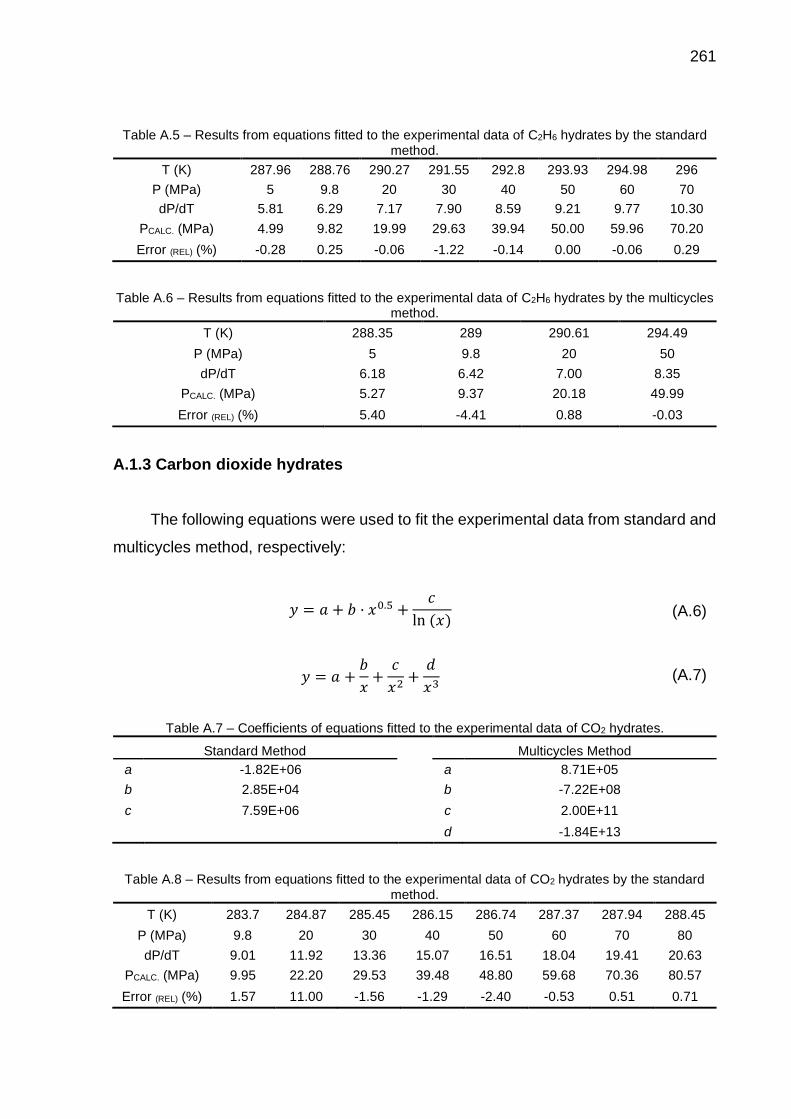
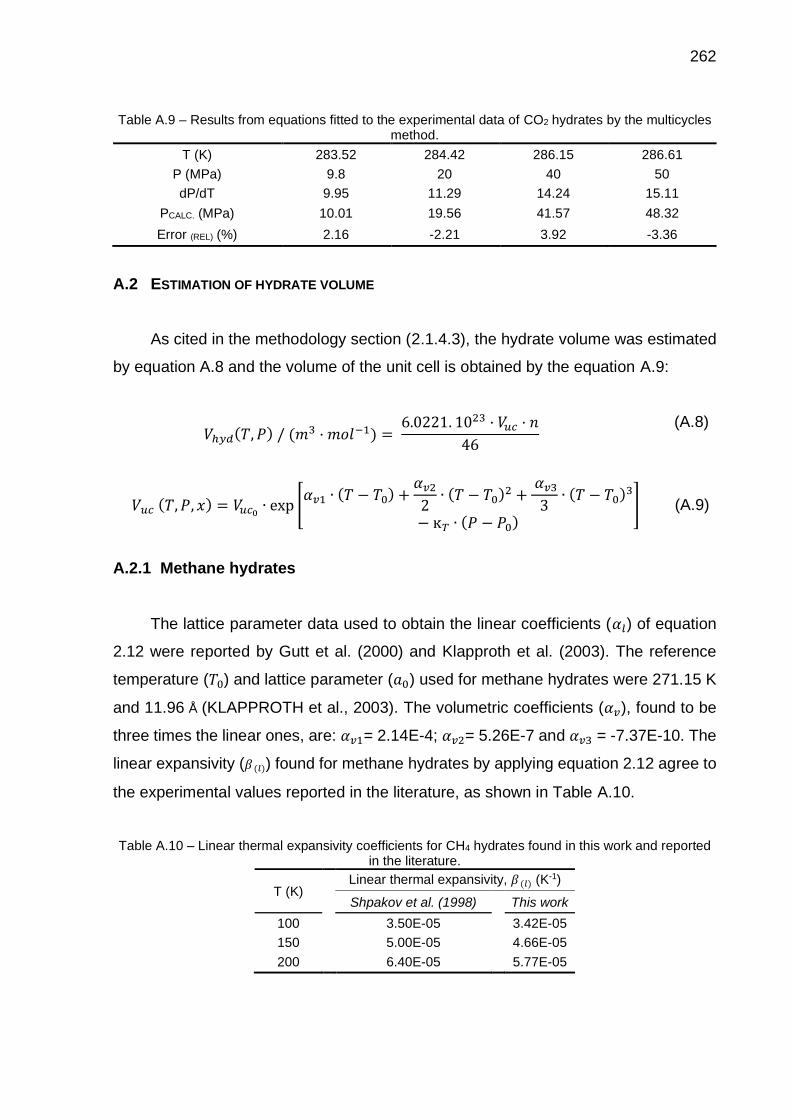

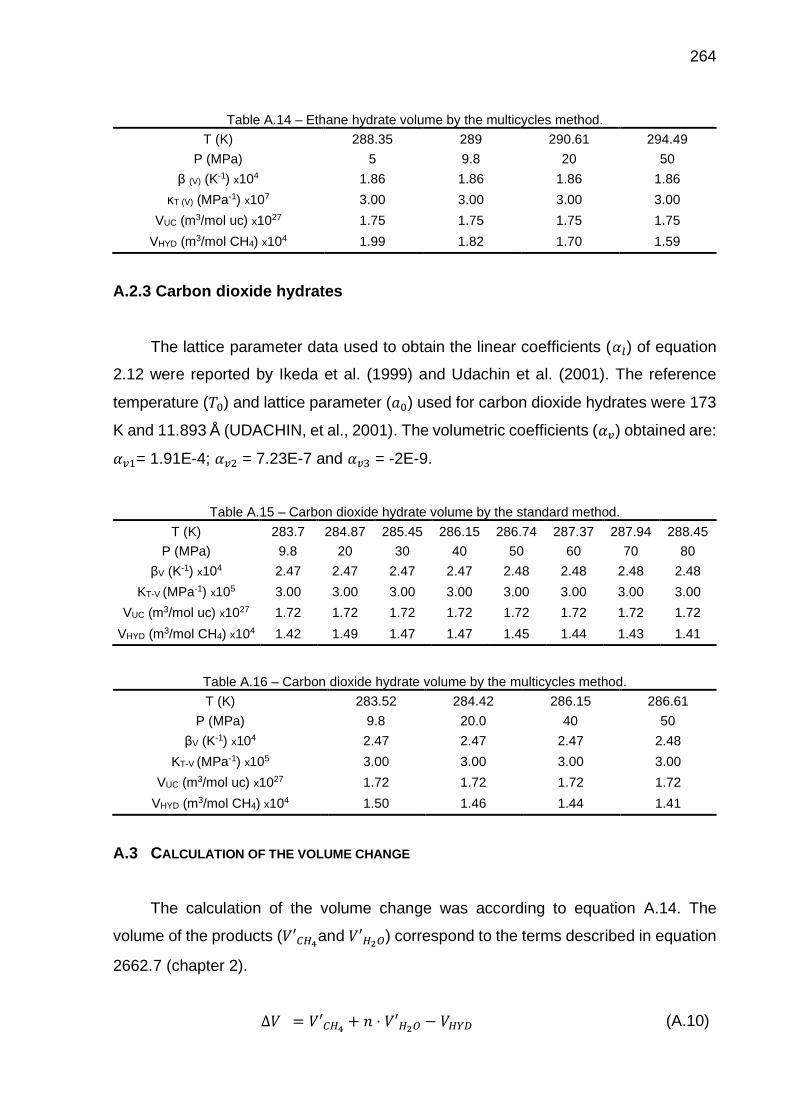


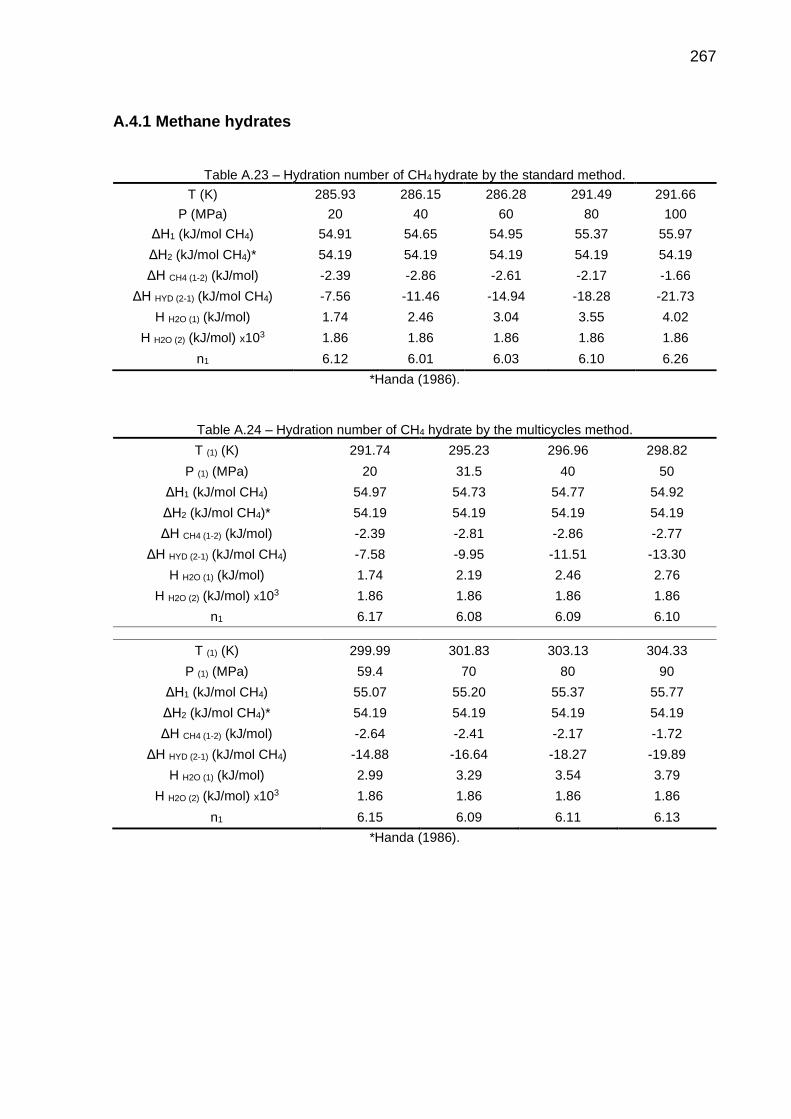

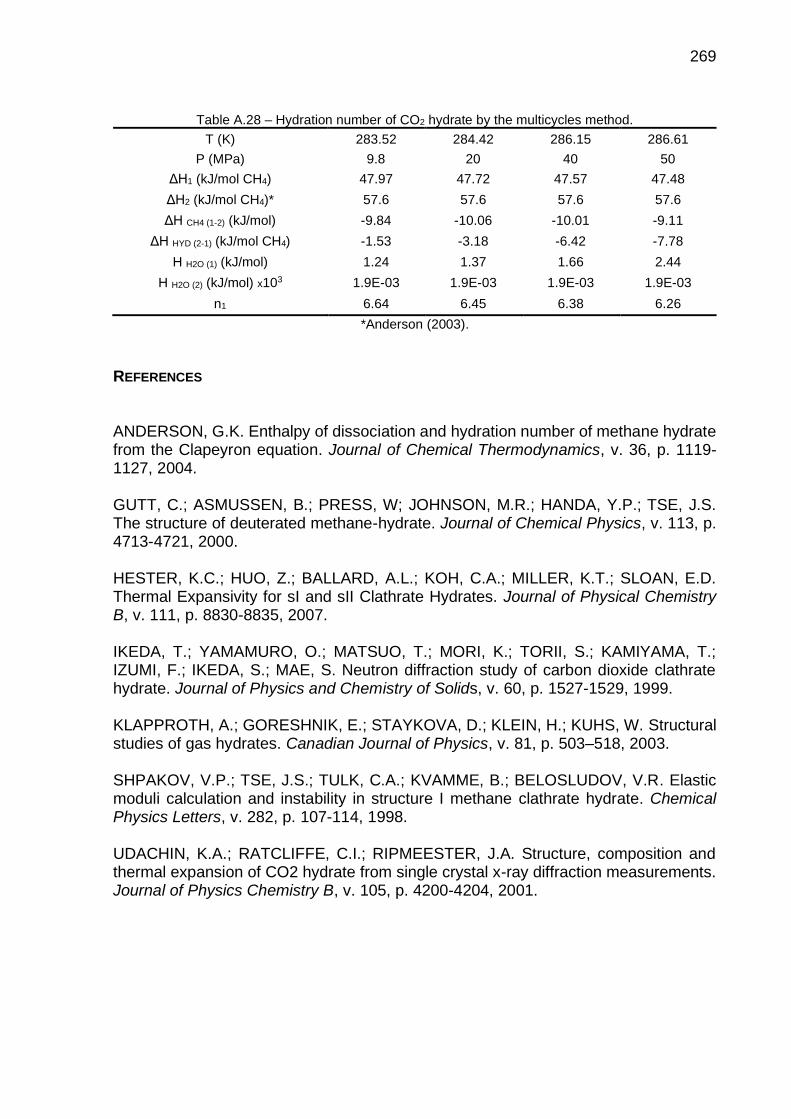

![New Techniques in Corolling Gas Hydrates [Recovered] Techniques in Corolling Gas Hydrates... · New Techniques in Controlling Gas Hydrates ... Ethane Propane ... • When hydrates](https://static.documents.pub/doc/80x56/5b865c467f8b9a195a8ca7ef/new-techniques-in-corolling-gas-hydrates-recovered-techniques-in-corolling-gas.jpg)


