* Corresponding author Email address: [email protected](M. Sato) Thermofluid Dynamic Analysis for THAI Tests with Passive Hydrogen Recombiner Masatoshi Sato * , Toshinori Matsumoto, Tomoyuki Sugiyama and Yu Maruyama Japan Atomic Energy Agency, Tokai-mura, Naka-gun, Ibaraki 319-1195, Japan Abstract Hydrogen production by the steam-zirconium chemical reaction during a severe accident could cause the occurrence of hydrogen deflagration/detonation. Passive autocatalytic recombiner (PAR) is one of the countermeasures to reduce hydrogen risk. In this study, thermofluid dynamic simulations were carried out for three tests, HR3, HR5 and HR12, with the PAR manufactured by AREVA in the OECD/NEA THAI project. The major parameters in these 3 tests were the initial pressure and steam concentration in the test vessel. Hydrogen was injected into the test vessel by the ring feed line located in the lower volume of the test vessel. When hydrogen concentration increased up to a certain value, the PAR was activated and natural convective flow was developed by the heat generation in the PAR. The thermofluid dynamic simulations were performed with an open source computational fluid dynamics (CFD) code, OpenFOAM. The solver applied was reactingFoam, which is appropriate to treat thermofluid dynamic phenomena including chemical reactions. The reactingFoam was modified by embedding the correlation equations of hydrogen recombination rate for the AREVA- manufactured PAR. The results from the present simulations indicated that the modified solver well reproduced the measured characteristics for PAR behaviour such as hydrogen recombination rate, flow velocity and temperature distribution, hydrogen and oxygen concentration, and so on. . Keywords: Severe accident, Hydrogen, PAR, CFD, OpenFOAM 1. Introduction Background and objectives 1.1. Hydrogen is generated by a chemical reaction between steam and zirconium, which is an important phenomenon occurring in a severe accident at a nuclear power station and causing deflagration and detonation in the containment vessels and reactor buildings. The Passive Autocatalytic Recombiner (PAR) is one of the countermeasures used to avoid the hydrogen risk. In order to evaluate the performance of PAR, the HR tests were conducted in the OECD/NEA THAI project under various conditions as shown in Fig. 1. The Japan Atomic Energy Agency (JAEA) have conducted thermofluid dynamic simulation on HR5 test and obtained consistent results with the test results [1]. In this study, the same simulation techniques were applied to the tests HR3 and HR12, which were carried out with the identical PAR as in HR5 under different conditions, and the applicability was investigated. Tests HR3 and HR12 1.2. The targets of simulations are the tests HR3 and HR12 which were performed at low pressure and with steam in the initial atmosphere, respectively. Figure 2 shows the vessel used in the HR tests. The PAR is mounted at the side of the inner cylinder. The ring feed line for hydrogen injection is mounted in the lower part of the vessel. In the test HR3, the initial internal pressure and temperature were 1.5 bar and 25°C, respectively, and steam was not contained initially. Although the hydrogen deflagration occurred at 91.7 minutes in the test HR3, the present simulation was conducted only for the hydrogen recombination phase before that time. In the test HR12, the initial pressure and temperature were 3.0 bar and 115 °C, respectively, and the initial steam concentration was 60%. Figure 3 shows histories of the hydrogen injection rate, recombination rate and total pressure in the tests HR3 and HR12. Those in the test HR5 are also given for reference. In each test, the hydrogen was injected twice with interval time between injections. The simulation was performed until the end of the second hydrogen injection, approximately 170 minutes, except the test HR3 with occurrence of the hydrogen deflagration.
Thermofluid Dynamic Analysis for THAI Tests with Passive Hydrogen Recombiner
Masatoshi Sato*, Toshinori Matsumoto, Tomoyuki Sugiyama and Yu Maruyama
Japan Atomic Energy Agency, Tokai-mura, Naka-gun, Ibaraki 319-1195, Japan
Abstract
Hydrogen production by the steam-zirconium chemical reaction during a severe accident could cause the occurrence of hydrogen deflagration/detonation. Passive autocatalytic recombiner (PAR) is one of the countermeasures to reduce hydrogen risk. In this study, thermofluid dynamic simulations were carried out for three tests, HR3, HR5 and HR12, with the PAR manufactured by AREVA in the OECD/NEA THAI project. The major parameters in these 3 tests were the initial pressure and steam concentration in the test vessel. Hydrogen was injected into the test vessel by the ring feed line located in the lower volume of the test vessel. When hydrogen concentration increased up to a certain value, the PAR was activated and natural convective flow was developed by the heat generation in the PAR. The thermofluid dynamic simulations were performed with an open source computational fluid dynamics (CFD) code, OpenFOAM. The solver applied was reactingFoam, which is appropriate to treat thermofluid dynamic phenomena including chemical reactions. The reactingFoam was modified by embedding the correlation equations of hydrogen recombination rate for the AREVA-manufactured PAR. The results from the present simulations indicated that the modified solver well reproduced the measured characteristics for PAR behaviour such as hydrogen recombination rate, flow velocity and temperature distribution, hydrogen and oxygen concentration, and so on.
. Keywords: Severe accident, Hydrogen, PAR, CFD, OpenFOAM
1. Introduction
Background and objectives 1.1.
Hydrogen is generated by a chemical reaction between steam and zirconium, which is an important phenomenon occurring in a severe accident at a nuclear power station and causing deflagration and detonation in the containment vessels and reactor buildings. The Passive Autocatalytic Recombiner (PAR) is one of the countermeasures used to avoid the hydrogen risk. In order to evaluate the performance of PAR, the HR tests were conducted in the OECD/NEA THAI project under various conditions as shown in Fig. 1. The Japan Atomic Energy Agency (JAEA) have conducted thermofluid dynamic simulation on HR5 test and obtained consistent results with the test results [1]. In this study, the same simulation techniques were applied to the tests HR3 and HR12, which were carried out with the identical PAR as in HR5 under different conditions, and the applicability was investigated.
Tests HR3 and HR12 1.2.
The targets of simulations are the tests HR3 and HR12 which were performed at low pressure and with steam in the initial atmosphere, respectively. Figure 2 shows the vessel used in the HR tests. The PAR is mounted at the side of the inner cylinder. The ring feed line for hydrogen injection is mounted in the lower part of the vessel. In the test HR3, the initial internal pressure and temperature were 1.5 bar and 25°C, respectively, and steam was not contained initially. Although the hydrogen deflagration occurred at 91.7 minutes in the test HR3, the present simulation was conducted only for the hydrogen recombination phase before that time. In the test HR12, the initial pressure and temperature were 3.0 bar and 115 °C, respectively, and the initial steam concentration was 60%. Figure 3 shows histories of the hydrogen injection rate, recombination rate and total pressure in the tests HR3 and HR12. Those in the test HR5 are also given for reference. In each test, the hydrogen was injected twice with interval time between injections. The simulation was performed until the end of the second hydrogen injection, approximately 170 minutes, except the test HR3 with occurrence of the hydrogen deflagration.
The 8th European Review Meeting on Severe Accident Research - ERMSAR-2017 Warsaw, Poland, 16-18 May 2017
Containment behaviour incl. H2 explosion risk, Paper N° 403
Figure 1 Matrix of HR recombiner experiments [2]
.
Figure 2 THAI test vessel [3] Figure 3 Experimental results
(a) HR3
(b) HR12
(c) HR5 [1]
The 8th European Review Meeting on Severe Accident Research -ERMSAR-2017 Warsaw, Poland, 16-18 May 2017
Containment behaviour incl. H2 explosion risk, Paper N° 403
2. Simulation code and conditions
Simulation code 2.1.
The simulation used the OpenFOAM which is open source software for thermofluid dynamics simulation [4]. Various solvers are available within the OpenFOAM. In this study, ‘reactingFoam’ solver was used to simulate thermal hydraulic gas behaviour with chemical reactions. Correlation equations for the hydrogen recombination rate were implemented to the reactingFoam solver to simulate PAR functions. The recombination rate is a function of the hydrogen concentration, oxygen concentration and total pressure at the PAR inlet. The correlation equations were provided by AREVA, the PAR manufacturer for the tests [2]. The modified solver simulates the gas composition change and heat generation of 1.2×10⁸ [J/kg] at the rate calculated by the correlation equations. To model turbulent flow, the shear stress transport (SST) k-ω model was used.
Simulation conditions 2.2.
Figure 4 shows the computational grid used for the present simulation. The total number of cells is 1,052,789. The test vessel contains an inner cylinder, PAR unit and ring feed line. The ring feed line was modelled as an octagon-shaped ring pipe with a square cross-section. The hydrogen is released from the upper side of the ring with a uniform velocity distribution. As for the boundary conditions at the inner surface of the test vessel, constant temperature and no-slip conditions were used. The wall of the test vessel was not modelled as a heat structure. The initial gas flow velocity was set to zero in the whole test vessel. Steam condensation at the surface of the test vessel was not considered in the present simulations.
Table 1 shows the initial gas conditions in the tests HR3, HR12 and HR5. The initial pressure was lower in the test HR3 than in the others. The initial gas contained steam, and gas temperature was higher in the test HR12.Table 2 gives the injection rate histories in the tests HR3, HR12 and HR5. The injected hydrogen temperature was set at 32°C.
Figure 4 Computational grid
PAR
Ring feed line
The 8th European Review Meeting on Severe Accident Research - ERMSAR-2017 Warsaw, Poland, 16-18 May 2017
Containment behaviour incl. H2 explosion risk, Paper N° 403
Distributions of hydrogen concentration, gas temperature and flow velocity in test vessel 3.1.
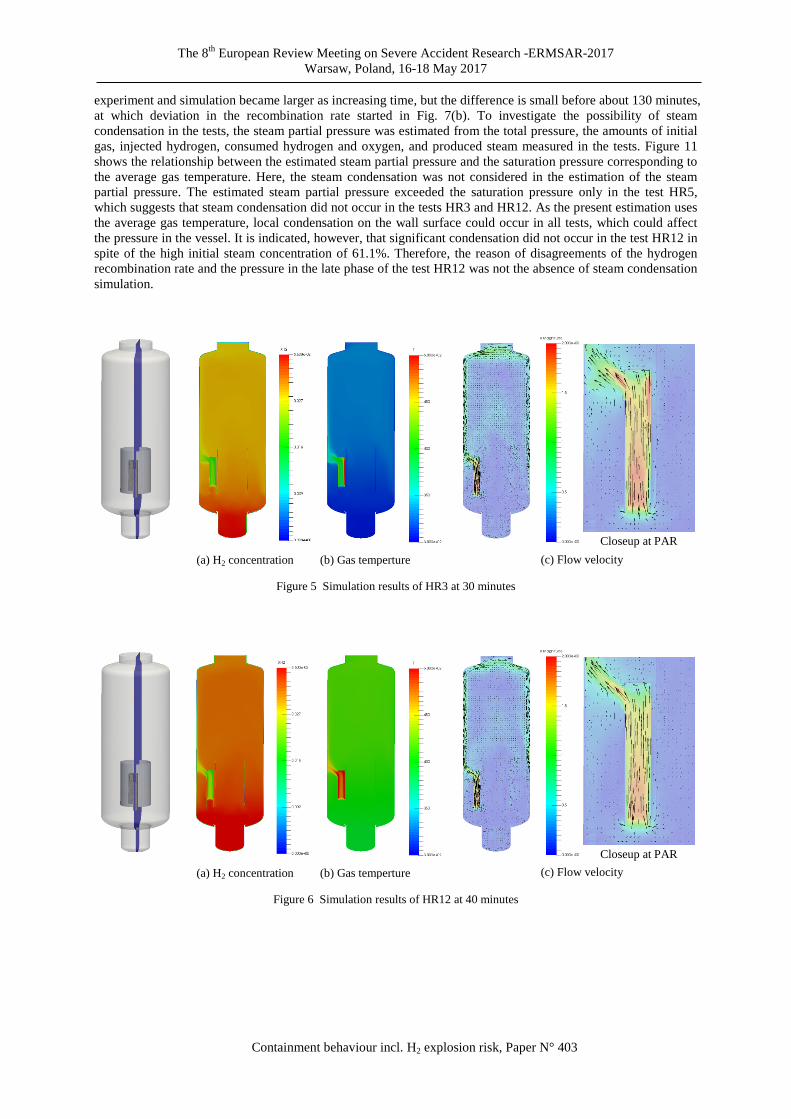
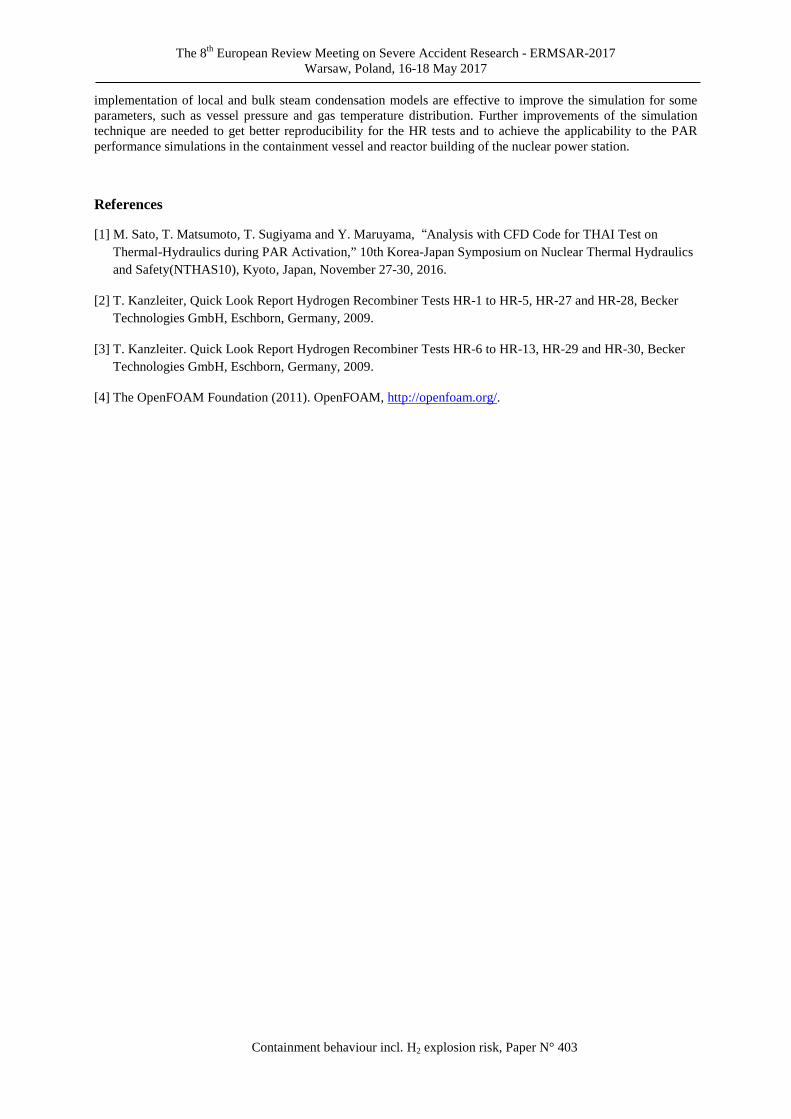
Figures 5 and 6 show calculated distributions of hydrogen concentration, gas temperature and flow velocity in the vertical cross-section of the test vessel for the tests HR3 and HR12, respectively. The cross-section was selected to include the PAR centreline as illustrated in the left figure. These distributions are results at 30 minutes for the HR3 and at 40 minutes for the HR12, both of which correspond to several minutes after the end of the first hydrogen injection. It is observed that the gas with reduced hydrogen concentration and high temperature comes out of the PAR. Because of the higher initial gas temperature in the test HR12, the gas temperature reaches higher, approximately 300°C. Upward flow is developed in the PAR due to the natural convection driven by the reaction heat in the hydrogen recombination. The gas flow rises along the wall to the vessel roof and turns into the downward flow at the wall in the opposite side. Significant difference is not observed in the flow velocity field between the tests HR3 and HR12.
Hydrogen recombination rate and pressure histories 3.2.
Figures 7(a), 7(b) and 7(c) show histories of hydrogen recombination rate in the tests HR3, HR12 and HR5, respectively. In the phase of the first hydrogen injection and the following recombination, the simulation results were in good agreement with the experiments in all cases. However, the difference from the experiment became larger especially after about 130 minutes in the test HR12. Figures 8(a), (b) and (c) show pressure histories in the test vessel in the HR3, HR12 and HR5, respectively. The simulation of the test HR3 was relatively in good agreement with the experiment. However, the calculated results in all the tests tend to be higher than the experimental results.
These disagreements of the hydrogen recombination rate and the pressure in the late phase of the test HR12 could arise from the treatment of steam condensation in the simulation. Since the present simulation does not consider the steam condensation as mentioned before, the governing factors of hydrogen recombination rate, including the total pressure and concentrations of hydrogen and oxygen, could be affected by the steam concentration in the experiment. Figure 9 shows steam concentration histories in the test HR12. The positions, at which the steam concentration was measured or calculated, are indicated in Fig. 10. The difference between the
The 8th European Review Meeting on Severe Accident Research -ERMSAR-2017 Warsaw, Poland, 16-18 May 2017
Containment behaviour incl. H2 explosion risk, Paper N° 403
experiment and simulation became larger as increasing time, but the difference is small before about 130 minutes, at which deviation in the recombination rate started in Fig. 7(b). To investigate the possibility of steam condensation in the tests, the steam partial pressure was estimated from the total pressure, the amounts of initial gas, injected hydrogen, consumed hydrogen and oxygen, and produced steam measured in the tests. Figure 11 shows the relationship between the estimated steam partial pressure and the saturation pressure corresponding to the average gas temperature. Here, the steam condensation was not considered in the estimation of the steam partial pressure. The estimated steam partial pressure exceeded the saturation pressure only in the test HR5, which suggests that steam condensation did not occur in the tests HR3 and HR12. As the present estimation uses the average gas temperature, local condensation on the wall surface could occur in all tests, which could affect the pressure in the vessel. It is indicated, however, that significant condensation did not occur in the test HR12 in spite of the high initial steam concentration of 61.1%. Therefore, the reason of disagreements of the hydrogen recombination rate and the pressure in the late phase of the test HR12 was not the absence of steam condensation simulation.
Figure 5 Simulation results of HR3 at 30 minutes
Figure 6 Simulation results of HR12 at 40 minutes
Closeup at PAR (a) H2 concentration (b) Gas temperture (c) Flow velocity
Closeup at PAR (a) H2 concentration (b) Gas temperture (c) Flow velocity
The 8th European Review Meeting on Severe Accident Research - ERMSAR-2017 Warsaw, Poland, 16-18 May 2017
Containment behaviour incl. H2 explosion risk, Paper N° 403
Figure 7 Hydrogen recombination rates Figure 8 Pressures in test vessel
Figure 9 Steam concentrations in HR12 Figure 10 Measuring points of gas properties
(c) HR5 [1]
(b) HR12
(a) HR3
(c) HR5 [1]
(b) HR12
(a) HR3
Point B
Point A
PAR outlet
PAR inlet
The 8th European Review Meeting on Severe Accident Research -ERMSAR-2017 Warsaw, Poland, 16-18 May 2017
Containment behaviour incl. H2 explosion risk, Paper N° 403
Figure 11 Relationship between steam partial pressure and saturation pressure during tests HR3, HR12 and HR5
Hydrogen concentration and gas temperature histories 3.3.
The histories of hydrogen concentrations at the PAR inlet and outlet are shown in Figs. 12(a), (b) and (c). All the simulation results generally agree with the experimental results in the phase of the first hydrogen injection and the following recombination. The deviations from the experimental results in the late phase seem to reflect those in the hydrogen recombination rates shown in Fig. 7. The hydrogen concentration histories in the test vessel, given in Figs. 13(a), (b) and (c), are quite similar to those at the PAR inlet and outlet. However, the calculated histories at the PAR outlet have high-frequency fluctuation during the no-hydrogen-injection period as well as during the injection period.
Similar fluctuations are observed in the calculated gas temperature histories at the PAR outlet as shown in Figs. 14(a), (b) and (c). This suggests that the hydrogen concentration and temperature of the PAR off-gas are highly sensitive to the recombination rate in the present simulations, and that small fluctuation of the recombination rate, indicated in Fig. 7, causes unnatural oscillations of the gas temperature and gas density above the PAR, which can consequently lead to a flow velocity oscillation.
As for the comparison of the gas temperature between the simulation and experiment, the calculated temperatures at the PAR outlet were lower than the measurements during the no-hydrogen-injection period in all the tests as shown in Figs. 14(a), (b) and (c). Since the present simulations reproduced the hydrogen recombination rate well during the period as shown in Fig. 7, the heat production rate should be also in good agreement. Therefore, the lower gas temperature at the PAR outlet has to be compensated by some other parameters, such as higher mass flow rate than in the experiment, or flat temperature profile in the cross section of the PAR channel while the channel centre had a peak temperature in the experiment. The study did not clear this problem yet.
Figures 15(a), (b) and (c) show histories of the calculated gas temperatures at the lower point A and the upper points B in the test vessel in the test HR3, HR5 and HR12, respectively. The simulations did not reproduce the experimental results well, but an interesting tendency is observed; the calculated gas temperatures at the point B decrease more quickly than the measurements in all the tests. This faster cooling could arise from the treatment of wall boundary conditions. The present simulations assumed a uniform and constant temperature at the test vessel inner surface, while the wall in the test vessel had a temperature distribution in the experiment.
50 100 150
0
1
2
Average gas temperature (°C)
Estim
ated
ste
am p
artia
lpr
essu
re (b
ar)
HR3 HR12 HR5
Steamsaturationpressure
The 8th European Review Meeting on Severe Accident Research - ERMSAR-2017 Warsaw, Poland, 16-18 May 2017
Containment behaviour incl. H2 explosion risk, Paper N° 403
Figure 12 Hydrogen concentrations in PAR Figure 13 Hydrogen concentrations in test vessel
(c) HR5 [1]
(b) HR12
(a) HR3
(c) HR5 [1]
(b) HR12
(a) HR3
The 8th European Review Meeting on Severe Accident Research -ERMSAR-2017 Warsaw, Poland, 16-18 May 2017
Containment behaviour incl. H2 explosion risk, Paper N° 403
Figure 14 Gas Temperatures at PAR Figure 15 Gas temperatures in test vessel
4. Conclusions
Thermofluid dynamic simulations were carried out on the hydrogen recombination tests HR3 and HR12 of the OECD/NEA THAI project. Results of the simulations agreed well with the experimental results for the early phase of the tests, including the 1st hydrogen injection period and the following no-injection period. Therefore, it was shown that the present simulation techniques using the OpenFOAM with the PAR correlation equations had acceptable capability to simulate the THAI-HR tests chosen in this study, and that the simulation techniques were applicable to pressures from ~1.5 to ~3 bar and temperatures from ~30 to ~115 °C. However, the reproducibility of the simulations for the late phase of the tests was not good. The estimation of steam partial pressure suggested that significant steam condensation did not occur even in the test HR12 with a high initial steam concentration. Hence, lack of steam condensation is not the dominant reason for the low reproducibility of the present simulations, but it is expected that introducing truly modelled wall boundary conditions and
(c) HR5 [1]
(b) HR12
(a) HR3
(c) HR5 [1]
(b) HR12
(a) HR3
The 8th European Review Meeting on Severe Accident Research - ERMSAR-2017 Warsaw, Poland, 16-18 May 2017
Containment behaviour incl. H2 explosion risk, Paper N° 403
implementation of local and bulk steam condensation models are effective to improve the simulation for some parameters, such as vessel pressure and gas temperature distribution. Further improvements of the simulation technique are needed to get better reproducibility for the HR tests and to achieve the applicability to the PAR performance simulations in the containment vessel and reactor building of the nuclear power station.
References
[1] M. Sato, T. Matsumoto, T. Sugiyama and Y. Maruyama, “Analysis with CFD Code for THAI Test on Thermal-Hydraulics during PAR Activation,” 10th Korea-Japan Symposium on Nuclear Thermal Hydraulics and Safety(NTHAS10), Kyoto, Japan, November 27-30, 2016.
[2] T. Kanzleiter, Quick Look Report Hydrogen Recombiner Tests HR-1 to HR-5, HR-27 and HR-28, Becker Technologies GmbH, Eschborn, Germany, 2009.
[3] T. Kanzleiter. Quick Look Report Hydrogen Recombiner Tests HR-6 to HR-13, HR-29 and HR-30, Becker Technologies GmbH, Eschborn, Germany, 2009.
[4] The OpenFOAM Foundation (2011). OpenFOAM, http://openfoam.org/.