15
THERMOFLUID MHD for ITER TBM. CURRENT STATUS By UCLA Thermofluid MHD GROUP Presented by Sergey Smolentsev US ITER TBM Meeting UCLA May 10-11, 2006
| Date post: | 21-Dec-2015 |
| Category: |
Documents |
| View: | 229 times |
| Download: | 0 times |
THERMOFLUID MHD for ITER TBM. CURRENT STATUS
By UCLA Thermofluid MHD GROUP
Presented by Sergey Smolentsev
US ITER TBM MeetingUCLA
May 10-11, 2006

Presentation layout
• MHD and Heat Transfer in the H-H phase
• Electromagnetic coupling in poloidal ducts
• PbLi manifold experiment
• Buoyancy effects modeling
• 2-D MHD turbulence modeling
• Near-future plans
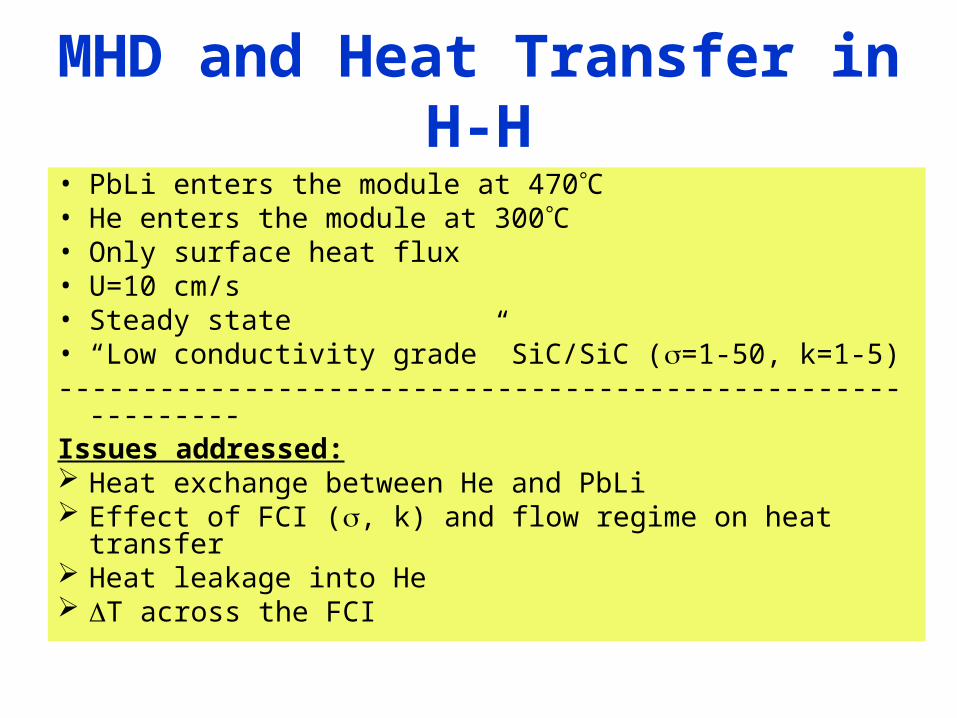
MHD and Heat Transfer in H-H
• PbLi enters the module at 470C• He enters the module at 300C• Only surface heat flux• U=10 cm/s• Steady state• “Low conductivity grade” SiC/SiC (=1-50, k=1-5)-----------------------------------------------------------Issues addressed: Heat exchange between He and PbLi Effect of FCI (, k) and flow regime on heat transfer Heat leakage into He T across the FCI
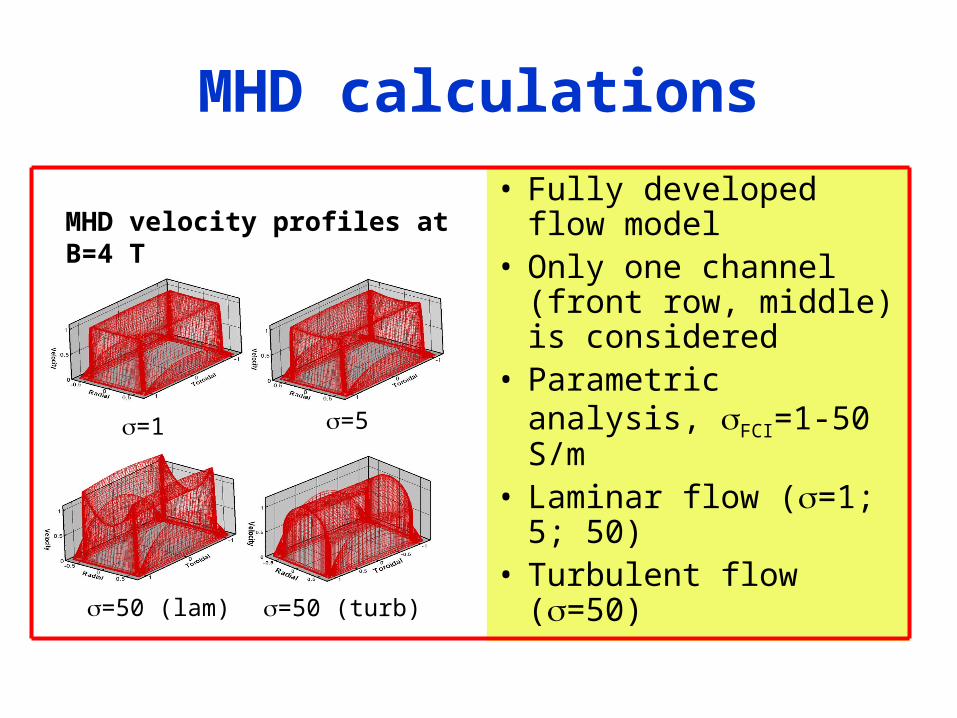
MHD calculations
=1 =5
=50 (lam) =50 (turb)
• Fully developed flow model
• Only one channel (front row, middle) is considered
• Parametric analysis, FCI=1-50 S/m
• Laminar flow (=1; 5; 50)
• Turbulent flow (=50)
MHD velocity profiles at B=4 T

Heat transfer calculations
• Velocity profile from the MHD calculations
• Temperature and h in the He flows from the He analysis
• Parametric calculations of the 3-D temperature field, using k and as parameters
Typical temperature field in H-H in the poloidal flow at U=10 cm/s

Heat exchange between He and PbLi
1. Calculate temperature field in He, assuming only surface heat flux
2. Calculate temperature in PbLi
3. Calculate heat losses from PbLi into He
4. Repeat temperature calculations in He taking into account heat losses from PbLi
5. Go to step 2
Iterate until no changes occur

Heat exchange between He and PbLi
• Iteration 1: no heat leakage assumed
• Iteration 2: First wall: 0.063 Mw/m2
Divider plate: 0.055 Top plate: 0.050 Bottom plate: 0.050 Grid plates: 0.045 Side walls: 0.059• Iteration 3: to be
performed
Tbulk at =5 S/m, k=5 W/m-K
0 0.4 0.8 1.2 1.6 2Poloidal distance
430
440
450
460
470
PbL
i Tbu
lk,
C
Iteration 1Iteration 2
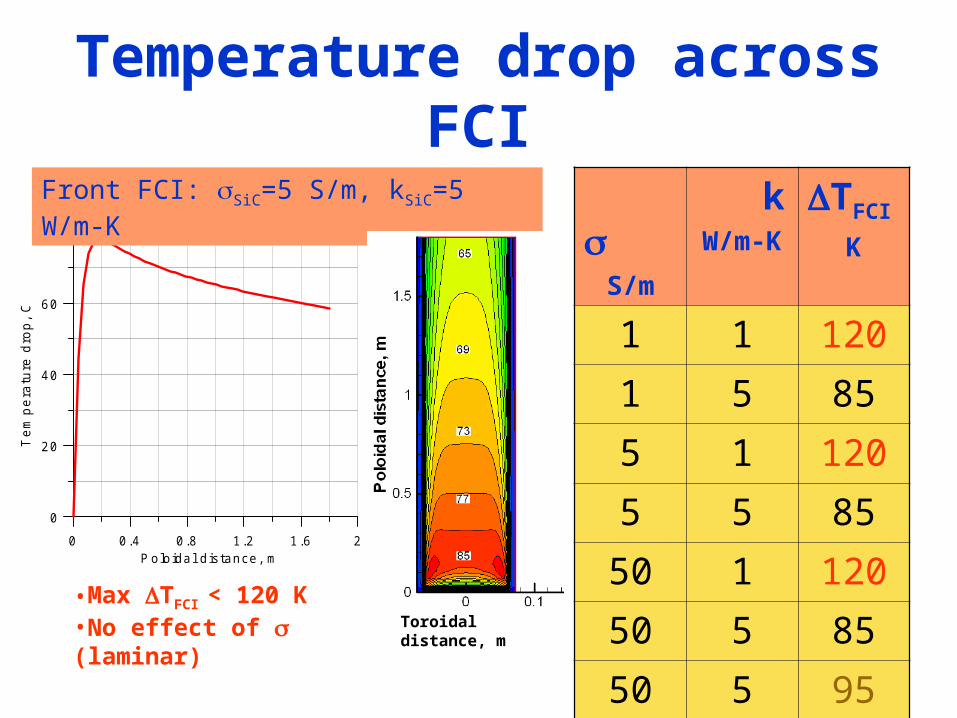
Temperature drop across FCI
0 0.4 0.8 1.2 1.6 2Poloidal distance, m
0
20
40
60
80
Tem
pera
ture
dro
p, C
Front FCI: SiC=5 S/m, kSiC=5 W/m-K
Toroidal distance, m
S/m
kW/m-K
TFCI
K
1 1 120
1 5 85
5 1 120
5 5 85
50 1 120
50 5 85
50 (t) 5 95
•Max TFCI < 120 K •No effect of (laminar)

Heat leakage into He
S/m
k
W/m-K
q Front
MW/m2
q Back
MW/m2
q Side
MW/m2
1 1 0.025 0.023 0.017
5 1 0.026 0.024 0.017
50 1 0.030 0.028 0.018
1 5 0.062 0.055 0.044
5 5 0.063 0.055 0.045
50 5 0.068 0.060 0.046
50(t) 5 0.081 0.068 0.054
0 0.4 0.8 1.2 1.6 2Polo ida l d istance , m
430
440
450
460
470
Tb
ulk
, C
•No effect of (laminar)•Turbulence is importantTPbLi~(10-40) K
k=1, =1; 5;50
k=5, =1; 5;50
k=5, =50 (turb)
Conclusions on heat transfer. Discussion issues.
• Iterative procedure coupling heat transfer in He and PbLi has been established
• Thermofluid MHD analysis has been performed in H-H assuming “low conductivity grade” SiC/SiC
• Turbulence is important
What SiC/SiC we are looking for and what SiC/SiC will be achievable in the neat future?
What to do next? (D-T, comparison with DEMO, unsteady conditions, more emphasis on MHD turbulence and buoyancy effects, meaningful experiments)
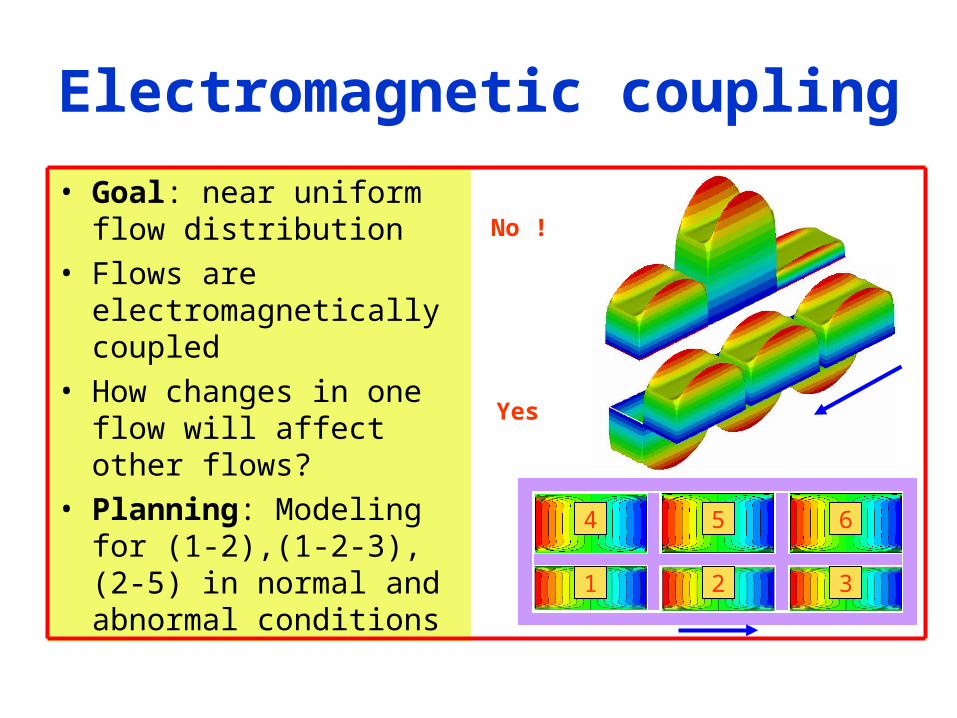
Electromagnetic coupling
• Goal: near uniform flow distribution
• Flows are electromagnetically coupled
• How changes in one flow will affect other flows?
• Planning: Modeling for (1-2),(1-2-3), (2-5) in normal and abnormal conditions
No !
Yes
1 2 3
4 5 6

Manifold experiment
• The test-article models “real” flow in the TBM, including the inlet and outlet section and three poloidal channels
• (Exp. A) Non-conducting and (Exp. B) conducting test-article• Measurements: Pi, Qi, , V• Q1: Is the flow distributed uniformly?• Q2: Do we need FCI in the inlet and outlet sections?• (Exp. C) Manifold optimization • Status: pre-fabrication
Goal: Manifold design that provides uniform flow distribution and minimizes the MHD pressure drop

Modeling buoyancy effects
• Significant effect on heat transfer
• MHD: transition to 2-D; reduction of circulation flow
• High Ha, high Gr. Computations are very time consuming
• Using periodic BC and FFT reduces the computational time by a few orders (compared to a relaxation technique)
• Status: testing
DEMO:Ha=14,900Gr=2.5 1012
ITER:Ha=6350Gr=1.5109
Before using FFT:Ha=102-103, Gr=107
0 4000 8000 12000 16000Tim e step
0
1
2
3
4
5
Nu
501x501N u at "hot" w allN u a t "co ld" w all
BGoal: 2 to 5 orders in Gr 1 order in Ha
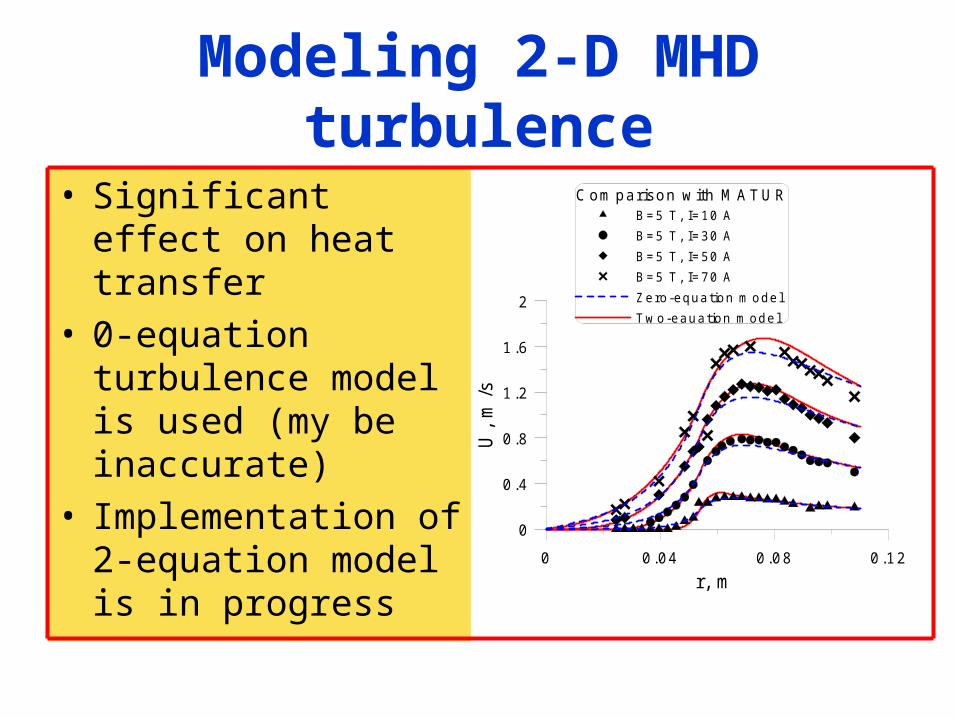
Modeling 2-D MHD turbulence
• Significant effect on heat transfer
• 0-equation turbulence model is used (my be inaccurate)
• Implementation of 2-equation model is in progress
0 0.04 0.08 0.12r, m
0
0.4
0.8
1.2
1.6
2
U, m
/s
Com parison w ith M ATURB=5 T , I=10 AB=5 T , I=30 AB=5 T , I=50 AB=5 T , I=70 AZero-equation m odelTw o-eauation m odel
Near-future plans
• Readdress MHD/heat transfer in DEMO, looking at similarities and differences with ITER
• Perform MHD/heat transfer analysis in DT• Iterate with others (He, SiC/SiC, design, stress)
to narrow the uncertainties• Keep working on modeling (electromagnetic
coupling, buoyancy effects, 2-D MHD turbulence)
• Keep working on the manifold experiment


