Thermogravimatric Analysis (TGA) Introduction:- Definition: “It is technique whereby the weight of substance, in an environment heated or cooled at a controlled rate is recorded as a function of time or temperature.” “Thermogravimetry (TG) is the branch of thermal analysis which examines the mass change of a sample as a function of temperature (in the scanning mode) or as a function of time (in the isothermal mode).” “Thermogravimetric analysis or thermal gravimetric analysis (TGA) is a method of thermal analysis in which changes in physical and chemical properties of materials are measured as a function of increasing temperature (with constant heating rate), or as a function of time (with constant temperature and/or constant mass loss)” Principle: Changes in the mass of a sample are studied while the sample is subjected to a program. Changes in temperature affect the sample. Not all thermal changes/events bring a change in mass of sample i.e. melting, crystallization but some thermal events i.e. desorption, absorption, sublimation, vaporization, oxidation, reduction and decomposition bring a drastic change in mass of sample. It is used in analysis of volatile products, gaseous products lost during the reaction in thermoplastics, thermosets, elastomers, composites, films, fibers, coatings, paints, etc. Description: It is a technique which is studied under thermal analysis and is employed for detection of such type of materials which undergo mass change (gain or loss) when subjected to thermal events viz. decomposition, oxidation, reduction, etc. Hence, it is used to analyze the decomposition, thermal stability and kinetics of materials under a variety of conditions taking place in the sample. For this reason, it is very significant to optimize those conditions/factors on which the change of mass of sample depend throughout the operation/experiment. Conditions/factors such as sample mass, volume, physical form, shape and nature of the sample holder, nature and pressure of the atmosphere in the sample chamber and the scanning rate greatly influence the recordings. Types of TGA: There are three types of thermogravimetry: 1. Dynamic TGA: In this type of analysis, the sample is subjected to condition of continuous increase in temperature usually linear with time. 2. Isothermal or Static TGA: In this type of analysis, sample is maintained at a constant temperature for a period of time during which change in weight is recorded. 3. Quasi-static TGA: In this technique sample is heated to a constant weight at each of a series of increasing temperature. Recording Of Result: The instrument used for themogravimetry is a programmed precision balance for rise in temperature known as Thermobalance.
Transcript
Thermogravimatric Analysis (TGA)
Introduction:-
Definition:
“It is technique whereby the weight of substance, in an environment heated or cooled at a controlled
rate is recorded as a function of time or temperature.”
“Thermogravimetry (TG) is the branch of thermal analysis which examines the mass change of a
sample as a function of temperature (in the scanning mode) or as a function of time (in the
isothermal
mode).”
“Thermogravimetric analysis or thermal gravimetric analysis (TGA) is a method of thermal analysis
in
which changes in physical and chemical properties of materials are measured as a function of
increasing temperature (with constant heating rate), or as a function of time (with constant
temperature and/or constant mass loss)”
Principle:
Changes in the mass of a sample are studied while the sample is subjected to a program.
Changes in temperature affect the sample. Not all thermal changes/events bring a change in mass
of sample i.e. melting, crystallization but some thermal events i.e. desorption, absorption,
sublimation, vaporization, oxidation, reduction and decomposition bring a drastic change in mass
of sample.
It is used in analysis of volatile products, gaseous products lost during the reaction in
thermoplastics, thermosets, elastomers, composites, films, fibers, coatings, paints, etc.
Description:
It is a technique which is studied under thermal analysis and is employed for detection of such type
of materials which undergo mass change (gain or loss) when subjected to thermal events viz.
decomposition, oxidation, reduction, etc. Hence, it is used to analyze the decomposition, thermal
stability and kinetics of materials under a variety of conditions taking place in the sample. For this
reason, it is very significant to optimize those conditions/factors on which the change of mass of
sample depend throughout the operation/experiment. Conditions/factors such as sample mass,
volume, physical form, shape and nature of the sample holder, nature and pressure of the
atmosphere in the sample chamber and the scanning rate greatly influence the recordings.
Types of TGA:
There are three types of thermogravimetry:
1. Dynamic TGA: In this type of analysis, the sample is subjected to condition of continuous
increase in
temperature usually linear with time.
2. Isothermal or Static TGA: In this type of analysis, sample is maintained at a constant
temperature for
a period of time during which change in weight is recorded.
3. Quasi-static TGA: In this technique sample is heated to a constant weight at each of a series of
increasing temperature.
Recording Of Result:
The instrument used for themogravimetry is a programmed precision balance for rise in temperature
known as Thermobalance.
Results are displayed by a plot of mass change versus temperature or time and are known as
Thermogravimetric curves or TG curves. TG curves are normally plotted with the mass change (Dm)
in percentage on the y-axis and temperature (T) or time (t) on the x-axis. A typical TG curve has
been shown (Figure 1). There are two temperatures in the reaction, Ti (procedural decomposition
temp.) and Tf (final temp.) representing the lowest temperature at which the onset of a mass change
is seen and the lowest temperature at which the process has been completed respectively. The
reaction temperature and interval (Tf-Ti) depend on the experimental condition; therefore, they do
not have any fixed value.
Fig.1.Characteristics of a single-stage mass-loss curve
Interpretation of TG Curves:
Types of TG Curves (Figure 2):
TG curves are classified according to their shapes into seven types.
Type A- this curves shows no mass change over the entire range of temperature. It can be
concluded that the decomposition temperature for sample is greater than the temperature
range of instrument.
Type B- this curves shows that there is large mass loss followed by mass plateau and is formed
when evaporation of volatile product(s) during drying, desorption or polymerization takes place.
If a non-interacting atmosphere is present in the chamber, type B curve will change into type A
curve.
Type C- this curve shows the single-stage decomposition temperatures (Ti and Tf).
Type D- this curve shows the multi-stage decomposition processes where reaction is resolved.
Type E- this curve shows the multi-stage decomposition reaction where reaction is not resolved.
Type F- this curve shows the increase in mass in the presence of an interacting atmosphere e.g.
surface oxidation reactions.
Type G- this curve shows multiple reactions one after the other e.g. surface oxidation reaction
followed by decomposition of reaction product(s).
Fig.2. Classification of TG Curves
Plateau:
A plateau (AB, Fig.3.) is that part of the TG curve where the mass is essentially constant or there
is no change in mass.
Procedural Decomposition Temperature:
The initial temperature, Ti, (B, Fig.3.) is that temperature (in Celsius or Kelvin) at which the
cumulative-mass change reaches a magnitude that the thermobalance can detect.
Final Temperature:
The final temperature, Tf, (C, Fig.3.), is that temperature (in Celsius or Kelvin) at which the
cumulative mass change reaches a maximum.
Fig.3. Formalized TG Curve
Reaction Interval:
The reaction interval is the temperature difference between Tf and Ti.
Isobaric Mass-change Determination:
A technique in which the equilibrium mass of a substance at constant partial pressure of the
volatile product(s), is measured as a function of temperature while the substance is subjected to
a controlled temperature program. The record is the isobaric mass-change curve; the mass is
plotted on Y-axis and temperature on X-axis increasing from left to right.
Evolved Gas Detection (EGD):
A technique in which the evolution of gas from a substance is detected as a function of
temperature while the substance is subjected to a controlled temperature program.
Evolved Gas Analysis (EGA):
A technique in which the nature and/or amount of volatile product(s) released by a substance
are/is measured as a function of temperature while the substance is subjected to a controlled
temperature program. The method of analysis should always be clearly stated.
Information from TG Curve:
The plot of weight/mass against temperature or time produced by a thermogravimeter is called
Thermogram. The following features of TG curve should be noted from Figure 1 or 3.
Plateau: a region of no mass change indicates the thermal stability of the sample/substance.
Thermal stability is the ability of a substance to maintain its properties as nearly unchanged as
possible on heat. This information about thermal stability is significant for engineers as they then
knows the temperature ranges of in which substances like alloy, building materials, polymers, etc.
can be used.
Weight/Mass Loss: heating a sample to given temperature causes it to lose weight/mass.
Mass/weight loss is informative to inorganic chemist who can then determine the composition
of substance/sample and understand the reaction involved in decomposition.
Procedural Decomposition Temperature: by looking at thermogram, one can determine the
procedural decomposition temperature (Ti) indicating the decomposition or evaporation of
sample/substance.
Composition: weight/mass lost by heating helps determine the composition of
substance/sample, also allow analytical chemists to identify unknown compound or determine
the amount/percentage/weight of a compound in mixture of different compounds.
Example of determination of weight:
Before analyzing the sample, we must preview the information related to sample. Let us take the
example of CaCo3. The information we knew about our sample is:
i. It is hygroscopic (it absorbs or attracts moisture from the air).
ii. Upon heating calcium carbonate it undergoes a reaction in which CO2 is released from the
material and only calcium oxide remains after the experiment.
CaCO3 CaO + CO2
iii. Calculating the weight:
Done by substituting the atomic mass in the formula.
CaCO3 CaO + CO2
Fig.4. TG Curve Showing the Atomic Mass of CaCO3
Where: Ca = 40.08 atomic mass units (amu)
C = 12.011 amu
O = 15.9994 amu
Ca + C + O3
(40.1) + (12.0) + [(16) x (3)]
CaCO3→ CaO + CO2
100.1 [(40.1) + (16)] + [(12.0) + (16) x (2)]
100.1 (56.1) + (44)
(100.1) (100.1) amu
The measured values are almost equal to the calculated values. The Delta Y Software calculation
was used to measure the “TG-run” (Table 1). Therefore, it is clearly mentioned that the sample we
are using is very pure. Table 1
Extrapolated onset temperature that denotes the temperature at which the weight loss begins
can also be calculated. We use the extrapolated onset Temperature (To) because it is a reproducible
temperature calculation.
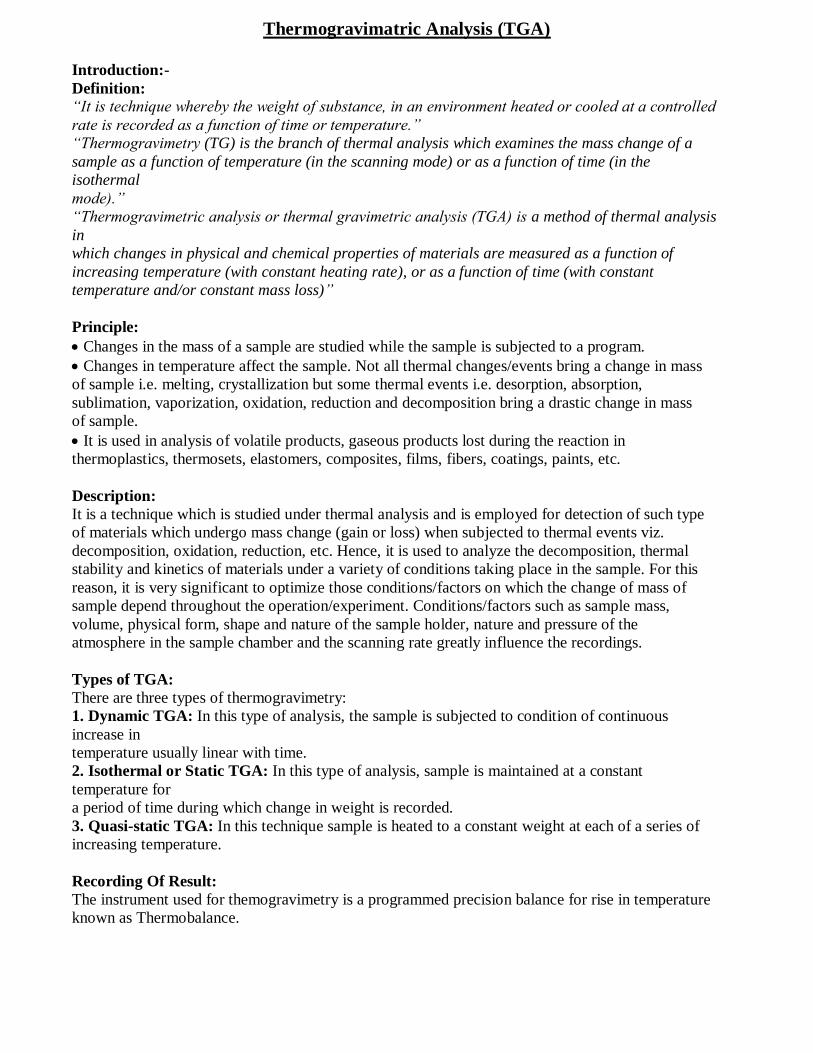
The extrapolated onset Temperature is 704.69 °C. The next calculation that is useful and finalizes
the characterization of calcium carbonate is the peak calculation derived at first weight loss curve.
The first derivative curve is displayed by Delta Y Software. The first derivative peak temperature
(Tp) is 789.03 °C. The peak of the first derivative indicates the point of greatest rate of change on
the weight loss curve. This is also known as the inflection point.
Fig.5. TG Curve showing Temperature Changes Associated with Thermal Events occurring to
CaCo3
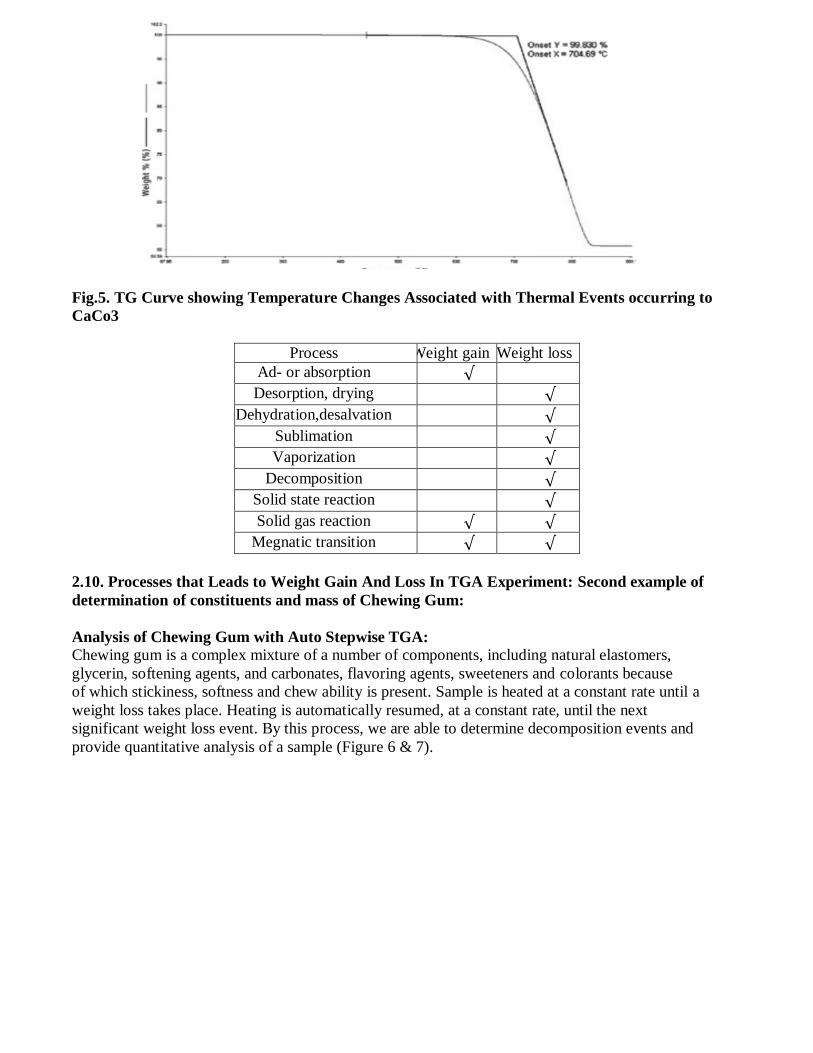
Process Weight gain Weight loss
Ad- or absorption √
Desorption, drying √
Dehydration,desalvation √
Sublimation √
Vaporization √
Decomposition √
Solid state reaction √
Solid gas reaction √ √
Megnatic transition √ √
2.10. Processes that Leads to Weight Gain And Loss In TGA Experiment: Second example of
determination of constituents and mass of Chewing Gum:
Analysis of Chewing Gum with Auto Stepwise TGA:
Chewing gum is a complex mixture of a number of components, including natural elastomers,
glycerin, softening agents, and carbonates, flavoring agents, sweeteners and colorants because
of which stickiness, softness and chew ability is present. Sample is heated at a constant rate until a
weight loss takes place. Heating is automatically resumed, at a constant rate, until the next
significant weight loss event. By this process, we are able to determine decomposition events and
provide quantitative analysis of a sample (Figure 6 & 7).
Fig.6. Standard TGA Result Doublemint Chewing Gum Sample
Fig.7. TGA Auto step wise Result for Doublemint Chewing Gum Sample.
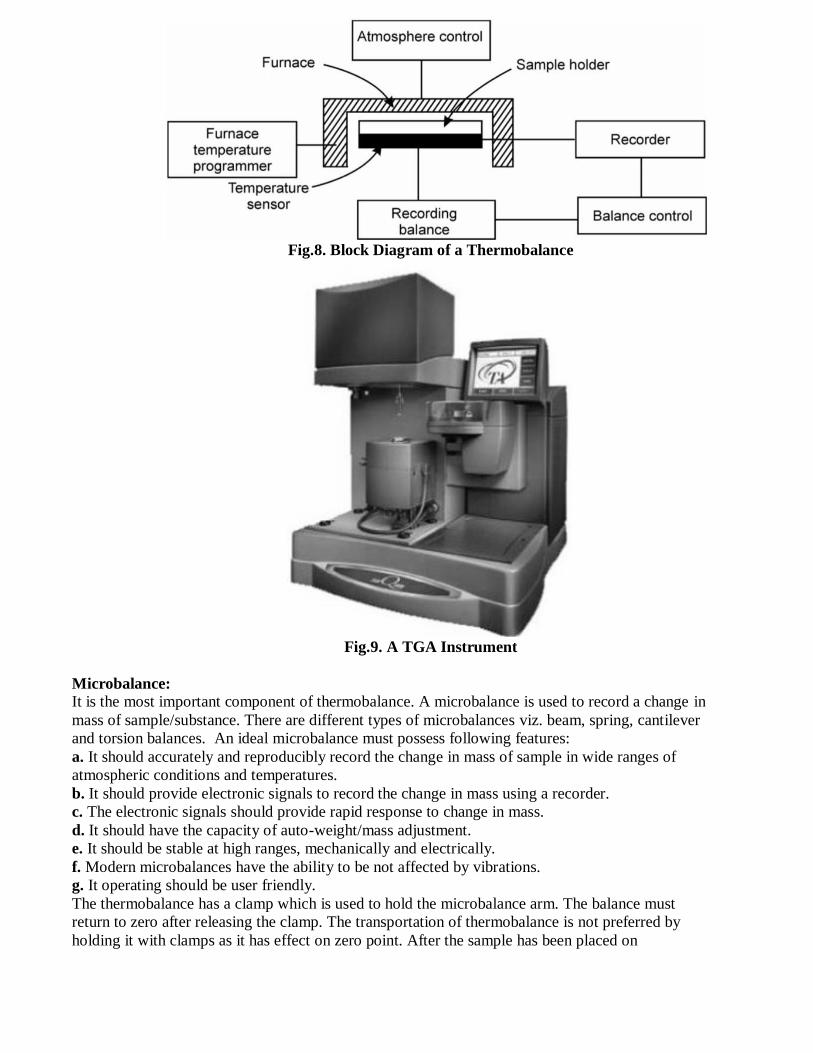
Instrumentation of Thermogravimetry:
TG curves are recorded using a Thermobalance. It consists of an electronic microbalance, a furnace,
a temperature programmer and a recorder (instrument connected to thermobalance to record the
output/curves (Figure 8 & 9).
Fig.8. Block Diagram of a Thermobalance
Fig.9. A TGA Instrument
Microbalance:
It is the most important component of thermobalance. A microbalance is used to record a change in
mass of sample/substance. There are different types of microbalances viz. beam, spring, cantilever
and torsion balances. An ideal microbalance must possess following features:
a. It should accurately and reproducibly record the change in mass of sample in wide ranges of
atmospheric conditions and temperatures.
b. It should provide electronic signals to record the change in mass using a recorder.
c. The electronic signals should provide rapid response to change in mass.
d. It should have the capacity of auto-weight/mass adjustment.
e. It should be stable at high ranges, mechanically and electrically.
f. Modern microbalances have the ability to be not affected by vibrations.
g. It operating should be user friendly.
The thermobalance has a clamp which is used to hold the microbalance arm. The balance must
return to zero after releasing the clamp. The transportation of thermobalance is not preferred by
holding it with clamps as it has effect on zero point. After the sample has been placed on
microbalance, it is left for 10-15 min to stabilize.
Recorder balances are of two types: Deflection-type instruments and Null-type instruments.
Deflection Balances: They are of following types (Figure 10):
i. Beam Type- in these balances, the conversion of deflected beams takes place into the
weight change. The curves formed are identified by the help of photographic recorded
trace, signals generated by displacement-measuring transducers or electromechanically.
ii. Helical Type- in these balances, elongation or contraction of spring occurs with change
in weight which is recorded by the help of transducers.
iii. Cantilevered Beam- in these balances, one end of beam is fixed and on other end sample
is placed. It undergoes deflection which can be recorded by the help of photographic
recorded trace, signals generated by displacement-measuring transducers or
electromechanically.
iv. Torsion Wire- in these balances, the beam is attached to hard torsion wire which acts as
fulcrum. The wire is attached to one or both ends of balance to make the deflection of
beam proportional to weight changes, which can be detected by the help of photographic
recorded trace, signals generated by displacement-measuring transducers or electromechanically.
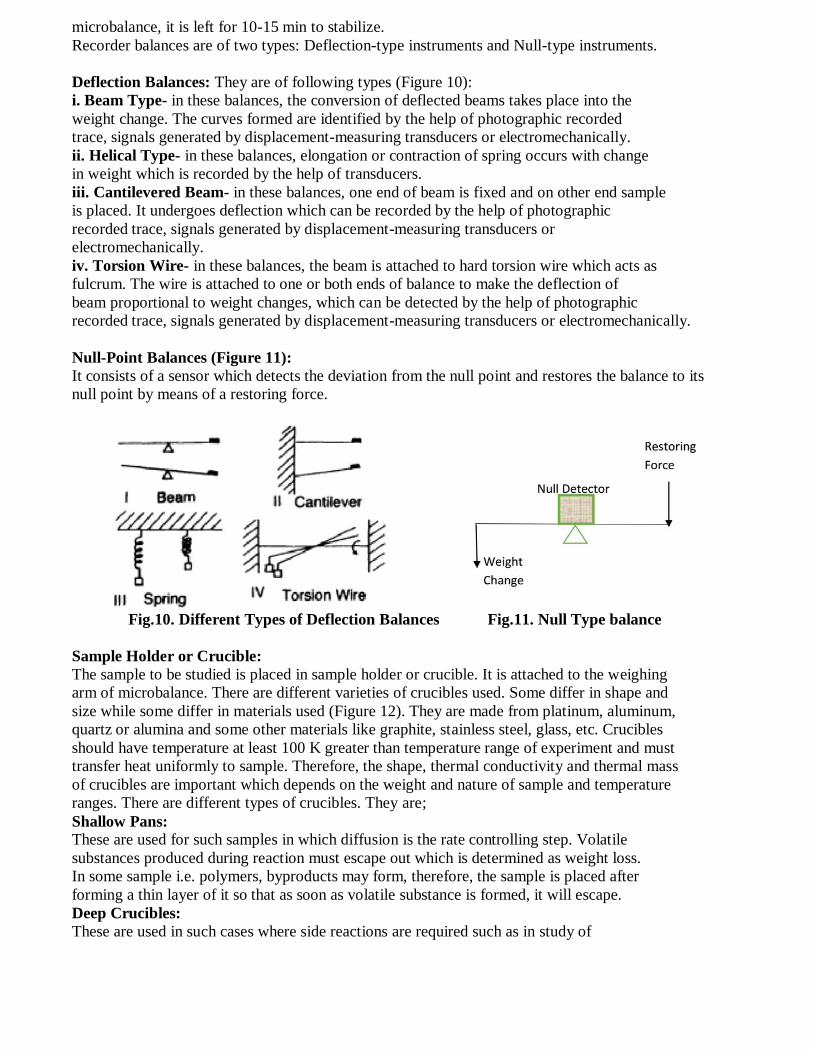
Null-Point Balances (Figure 11):
It consists of a sensor which detects the deviation from the null point and restores the balance to its
null point by means of a restoring force.
Fig.10. Different Types of Deflection Balances Fig.11. Null Type balance
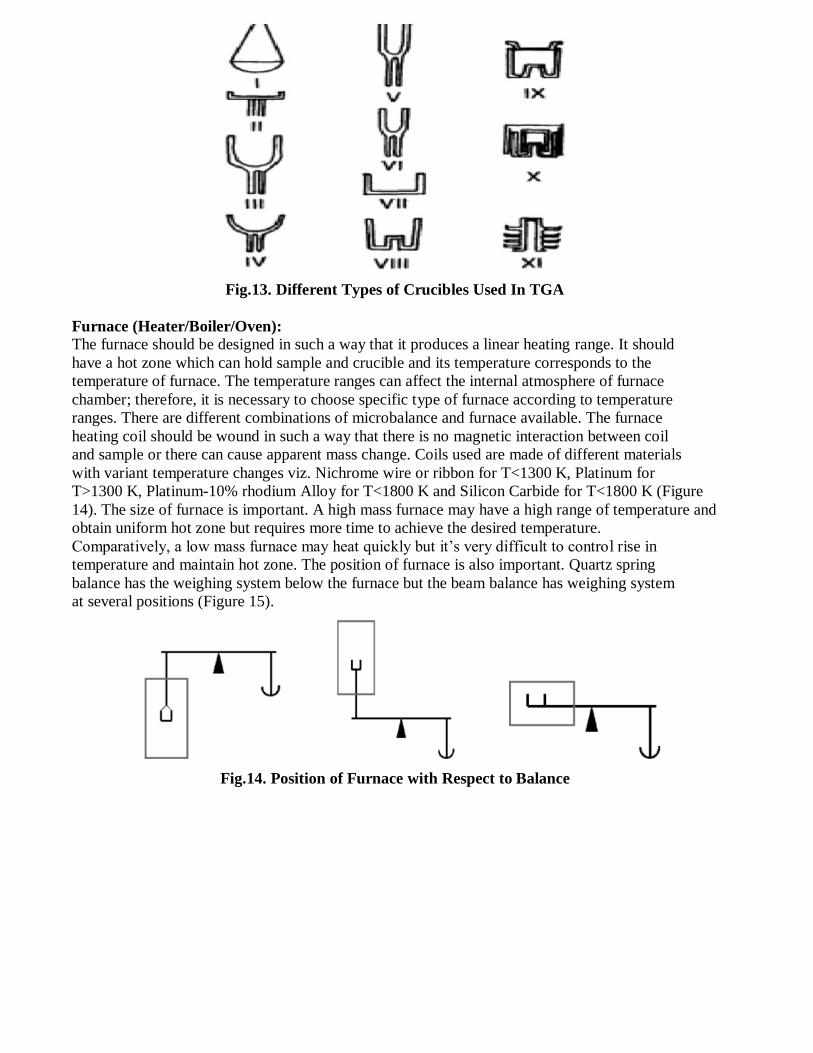
Sample Holder or Crucible:
The sample to be studied is placed in sample holder or crucible. It is attached to the weighing
arm of microbalance. There are different varieties of crucibles used. Some differ in shape and
size while some differ in materials used (Figure 12). They are made from platinum, aluminum,
quartz or alumina and some other materials like graphite, stainless steel, glass, etc. Crucibles
should have temperature at least 100 K greater than temperature range of experiment and must
transfer heat uniformly to sample. Therefore, the shape, thermal conductivity and thermal mass
of crucibles are important which depends on the weight and nature of sample and temperature
ranges. There are different types of crucibles. They are;
Shallow Pans:
These are used for such samples in which diffusion is the rate controlling step. Volatile
substances produced during reaction must escape out which is determined as weight loss.
In some sample i.e. polymers, byproducts may form, therefore, the sample is placed after
forming a thin layer of it so that as soon as volatile substance is formed, it will escape.
Deep Crucibles:
These are used in such cases where side reactions are required such as in study of
industrial scale calcinations, surface area measurements, etc.
Loosely covered Crucibles:
These are used in self-generated atmospheric studies. Rate of temperature or weight loss
is not important because the studies are done isothermally.
Retort Cups:
These are used in boiling point studies. It provides single plat of reflux for a boiling point
determination.
Fig.12. Effect of crucible thermal mass on the TG curves of powdered PMMA. Solid line,
aluminium crucible
Different types of crucibles are used for different materials i.e. Flat crucibles with small lip are
used for powdered sample whereas walled crucibles are used for liquid samples. Therefore, the
form of crucibles used will determine the temperature gradients in sample. An example for
change temperature change has been presented (Figure 13). TG curves recorded poly methyl
methacrylate (PMMA) in a normal aluminium crucible and in aluminium crucible with an
aluminium disc fitted at bottom to increase the thermal mass. The shapes and residue rates of
curves are different. The temperature at which the rate of mass loss, is maximum increased by
5 K in crucible of greater thermal mass. A regular cleaning of crucible is required which can be
done with methanol and pre-heating the crucible to its maximum temperature.
Fig.13. Different Types of Crucibles Used In TGA
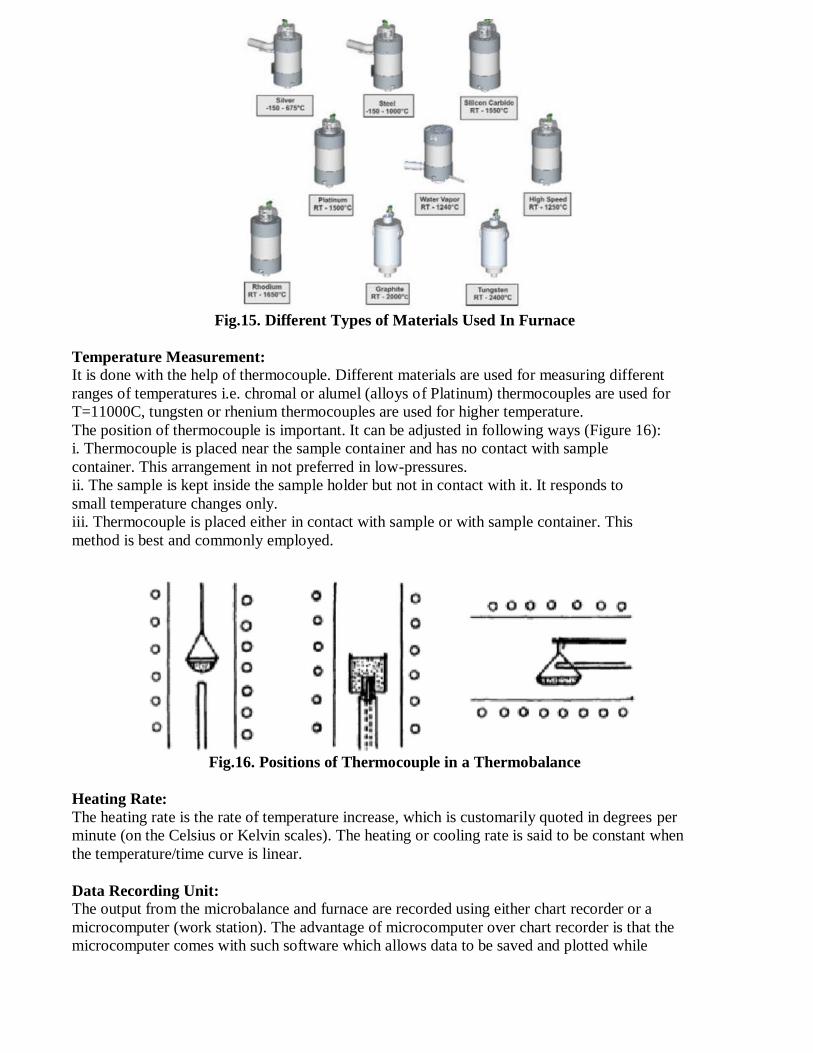
Furnace (Heater/Boiler/Oven):
The furnace should be designed in such a way that it produces a linear heating range. It should
have a hot zone which can hold sample and crucible and its temperature corresponds to the
temperature of furnace. The temperature ranges can affect the internal atmosphere of furnace
chamber; therefore, it is necessary to choose specific type of furnace according to temperature
ranges. There are different combinations of microbalance and furnace available. The furnace
heating coil should be wound in such a way that there is no magnetic interaction between coil
and sample or there can cause apparent mass change. Coils used are made of different materials
with variant temperature changes viz. Nichrome wire or ribbon for T<1300 K, Platinum for
T>1300 K, Platinum-10% rhodium Alloy for T<1800 K and Silicon Carbide for T<1800 K (Figure
14). The size of furnace is important. A high mass furnace may have a high range of temperature and
obtain uniform hot zone but requires more time to achieve the desired temperature.
Comparatively, a low mass furnace may heat quickly but it’s very difficult to control rise in
temperature and maintain hot zone. The position of furnace is also important. Quartz spring
balance has the weighing system below the furnace but the beam balance has weighing system
at several positions (Figure 15).
Fig.14. Position of Furnace with Respect to Balance
Fig.15. Different Types of Materials Used In Furnace
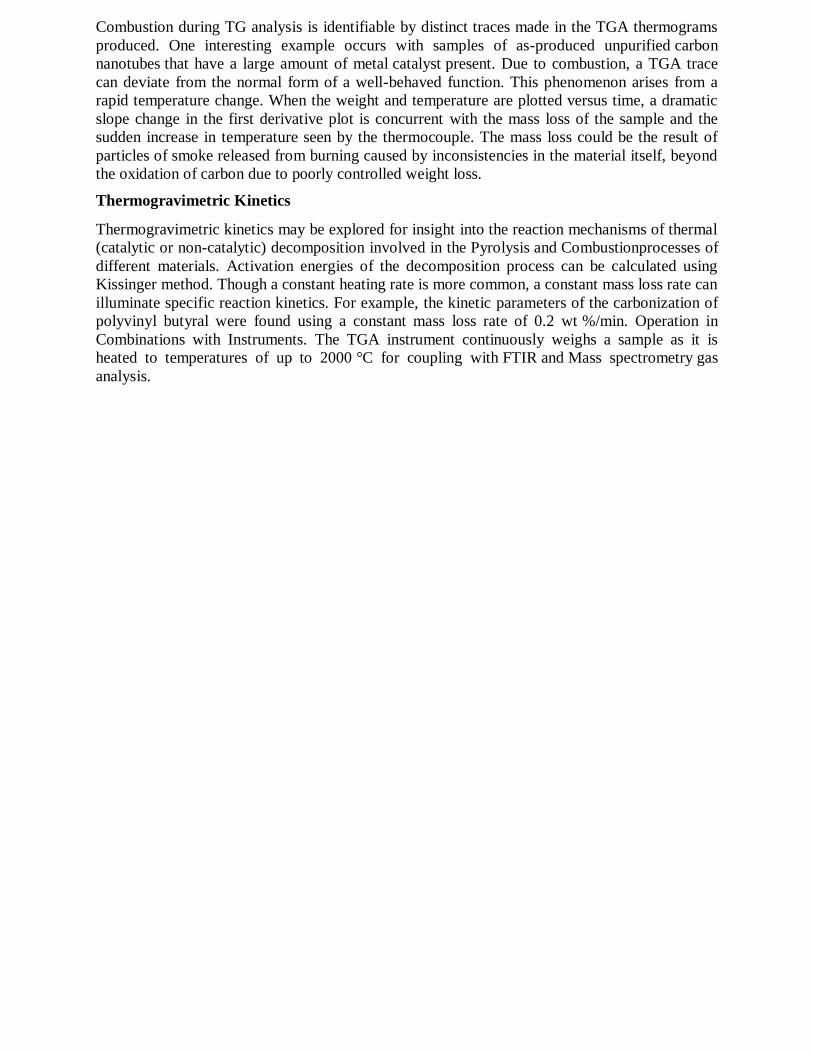
Temperature Measurement:
It is done with the help of thermocouple. Different materials are used for measuring different
ranges of temperatures i.e. chromal or alumel (alloys of Platinum) thermocouples are used for
T=11000C, tungsten or rhenium thermocouples are used for higher temperature.
The position of thermocouple is important. It can be adjusted in following ways (Figure 16):
i. Thermocouple is placed near the sample container and has no contact with sample
container. This arrangement in not preferred in low-pressures.
ii. The sample is kept inside the sample holder but not in contact with it. It responds to
small temperature changes only.
iii. Thermocouple is placed either in contact with sample or with sample container. This
method is best and commonly employed.
Fig.16. Positions of Thermocouple in a Thermobalance
Heating Rate:
The heating rate is the rate of temperature increase, which is customarily quoted in degrees per
minute (on the Celsius or Kelvin scales). The heating or cooling rate is said to be constant when
the temperature/time curve is linear.
Data Recording Unit:
The output from the microbalance and furnace are recorded using either chart recorder or a
microcomputer (work station). The advantage of microcomputer over chart recorder is that the
microcomputer comes with such software which allows data to be saved and plotted while
performing mathematical problems. Besides that, multiple TG curves can be plotted
simultaneously. In such microcomputers, we get plot of weight change versus temperature or
time.Some other recoding systems are also available viz. X-Y recorders and Time-Base
Potentiometric Strip Chart Recorder. In X-Y Recorder, plot of weight directly against temperature is
presented.
Fig.15. Multi Sample TG Analyzer
Applications:
Thermal stability
TGA can be used to evaluate the thermal stability of a material. In a desired temperature range, if
a species is thermally stable, there will be no observed mass change. Negligible mass loss
corresponds to little or no slope in the TGA trace. TGA also gives the upper use temperature of a
material. Beyond this temperature the material will begin to degrade.
TGA is used in the analysis of ceramics and thermally stable polymers. Ceramics usually melt
before they decompose as they are thermally stable over a large temperature range, thus TGA is
mainly used to investigate the thermal stability of polymers. Most polymers melt or degrade
before 200°C. However, there is a class of thermally stable polymers that are able to withstand
temperatures of at least 300°C in air and 500°C in inert gases without structural changes or
strength loss, which can be analyzed by TGA.
Oxidation and\or Combustion
The simplest materials characterization is the residue remaining after a reaction. For example, a
combustion reaction could be tested by loading a sample into a thermogravimetric analyzer
at normal conditions. The thermogravimetric analyzer would ion combustion the sample by
heating it beyond the ignition temperature of a sample. The resultant TGA curve plotted with the
y axis as percentage of initial mass would show the residue at the final point of the curve.
Oxidative mass losses are the most common observable losses in TGA.
Studying the resistance to oxidation in copper alloys is very important. For
example, NASA (National Aeronautics and Space Administration) is conducting research on
advanced copper alloys for their possible use in combustion engines. However, oxidative
degradation can occur in these alloys as copper oxides form in atmospheres that are rich in
oxygen. Resistance to oxidation is very important because NASA wants to be able to reuse
shuttle materials. TGA can be used to study the static oxidation of materials such as these for