1 The role of Australian equities and the impact of home country equity bias Authors Rosemary Steinfort, Alexis Gray Vanguard research December 2012 Connect with Vanguard™ The indexing specialist > vanguard.com.au > 1300 655 102 Executive summary. Australian investors have long held a large allocation to domestic equities, encouraged in part by the introduction of the dividend imputation system in 1987 and the Superannuation Guarantee system in 1992. Australia’s home country equity bias remains significant compared with many other countries such as the U.S. and U.K. This is despite the view that Australian equities account for only 3.5% of the global equity market (as represented by MSCI World Index in Australian dollars). In this paper we explore the potential pros and cons for Australian investors’ high average domestic equity allocation. Specifically, we show the benefits of global equity diversification based, in part, through minimum-variance portfolio analysis. While we acknowledge that dividend imputation benefits and transaction costs can provide some rationale for home country bias, our research also underscores the expected diversification and risk-mitigation benefits by allocating more significantly beyond the Australian equity market.
Transcript
1
The role of Australian equities and the impact of home country equity bias
Executive summary. Australian investors have long held a large allocation to domestic equities, encouraged in part by the introduction of the dividend imputation system in 1987 and the Superannuation Guarantee system in 1992.
Australia’s home country equity bias remains significant compared with many other countries such as the U.S. and U.K. This is despite the view that Australian equities account for only 3.5% of the global equity market (as represented by MSCI World Index in Australian dollars).
In this paper we explore the potential pros and cons for Australian investors’ high average domestic equity allocation. Specifically, we show the benefits of global equity diversification based, in part, through minimum-variance portfolio analysis. While we acknowledge that dividend imputation benefits and transaction costs can provide some rationale for home country bias, our research also underscores the expected diversification and risk-mitigation benefits by allocating more significantly beyond the Australian equity market.
2
Home country equity bias in Australia
Home country equity bias refers to the tendency for investors to hold a significant portfolio weight in domestic equities, despite the observed benefits of global diversification. In Australia, there is a considerable home country equity bias with resident investors owning on average a 73% weight in Australian equities – approximately a 70% overweight position relative to Australia’s market capitalisation (market cap) weight of 3.5% in the MSCI World Index in Australian dollars.
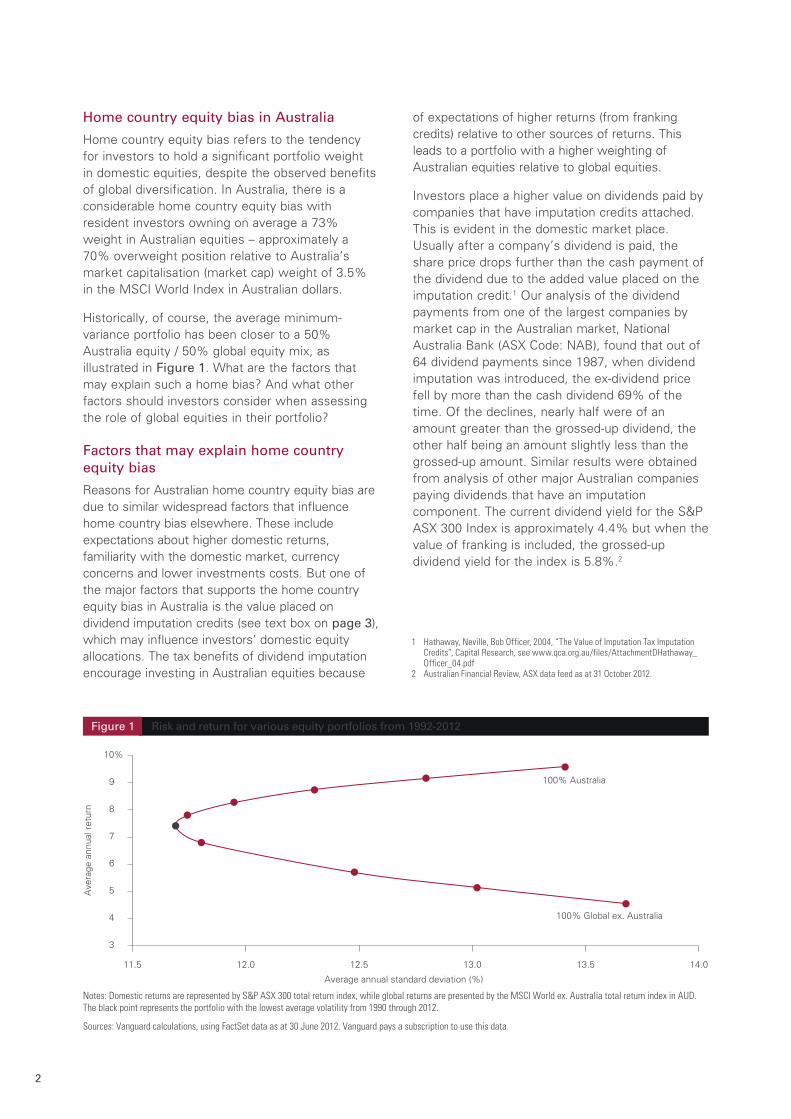
Historically, of course, the average minimum-variance portfolio has been closer to a 50% Australia equity / 50% global equity mix, as illustrated in Figure 1. What are the factors that may explain such a home bias? And what other factors should investors consider when assessing the role of global equities in their portfolio?
Factors that may explain home country equity bias
Reasons for Australian home country equity bias are due to similar widespread factors that influence home country bias elsewhere. These include expectations about higher domestic returns, familiarity with the domestic market, currency concerns and lower investments costs. But one of the major factors that supports the home country equity bias in Australia is the value placed on dividend imputation credits (see text box on page 3), which may influence investors’ domestic equity allocations. The tax benefits of dividend imputation encourage investing in Australian equities because
of expectations of higher returns (from franking credits) relative to other sources of returns. This leads to a portfolio with a higher weighting of Australian equities relative to global equities.
Investors place a higher value on dividends paid by companies that have imputation credits attached. This is evident in the domestic market place. Usually after a company’s dividend is paid, the share price drops further than the cash payment of the dividend due to the added value placed on the imputation credit.1 Our analysis of the dividend payments from one of the largest companies by market cap in the Australian market, National Australia Bank (ASX Code: NAB), found that out of 64 dividend payments since 1987, when dividend imputation was introduced, the ex-dividend price fell by more than the cash dividend 69% of the time. Of the declines, nearly half were of an amount greater than the grossed-up dividend, the other half being an amount slightly less than the grossed-up amount. Similar results were obtained from analysis of other major Australian companies paying dividends that have an imputation component. The current dividend yield for the S&P ASX 300 Index is approximately 4.4% but when the value of franking is included, the grossed-up dividend yield for the index is 5.8%.2
Risk and return for various equity portfolios from 1992-2012Figure 1
3
4
5
6
7
8
9
10%
11.5 12.0 12.5 13.0 13.5 14.0
100% Australia
100% Global ex. Australia
Ave
rage
ann
ual r
etur
n
Average annual standard deviation (%)
Sources: Vanguard calculations, using FactSet data as at 30 June 2012. Vanguard pays a subscription to use this data.
Notes: Domestic returns are represented by S&P ASX 300 total return index, while global returns are presented by the MSCI World ex. Australia total return index in AUD. The black point represents the portfolio with the lowest average volatility from 1990 through 2012.
1 Hathaway, Neville, Bob Officer, 2004, “The Value of Imputation Tax Imputation Credits”, Capital Research, see www.qca.org.au/files/AttachmentDHathaway_Officer_04.pdf
2 Australian Financial Review, ASX data feed as at 31 October 2012.
3
Another factor in the home country equity bias is attributed to the growth of the superannuation market in Australia (the fourth largest in the world).3 Superannuation has supported domestic investment due to dividend imputation – dividends are valued more by superannuation investors due to a higher grossed-up dividend yield, effectively a higher dividend payment due to the lower tax rate applicable.
The chart in Figure 3 approximates a country’s home country equity bias by comparing the percentage weighting of domestic investment in domestic securities to the percentage weighting of domestic investment in global securities. The size of the bubbles demonstrates the aggregate percentage by which the investments were overweight domestic equities relative to the market cap weight in a global portfolio.
In addition to the dividend imputation system in Australia, major reasons for home country equity bias in equity markets include the following:4
Dividend imputation and tax treatment
The tax treatment of foreign versus domestic assets can have a significant impact on the asset allocation decision. Taxes generally can be broken into four categories: capital gains, dividends (from equities), interest income (from fixed income), and transaction or stamp taxes. The degree to which an investor is exposed to these taxes could help determine the allocation to domestic equities versus global equities.
In the case of Australian domestic investors, taxation status has become increasingly important to the investment decision – especially considering the ageing population and the growth of self-managed superannuation funds (SMSFs), which are approximately 30% (A$430billion) of the total superannuation assets* The franking credit – the tax credit an investor receives, based on the difference between the investor’s marginal tax rate and 30% corporate tax rate paid by the company – is available to all resident domestic equity investors and can result in a tax refund or at least a reduced amount of tax payable on the dividend received**.
Franked dividends can be attractive to SMSFs, especially those in pension mode paying 0% tax (held in an accumulation fund), as they receive a full refund on the franking credit. A dollar paid as a franked dividend is worth more, as the investor receives not only the dividend, but a full cash refund of the franking credit as well (Figure 2 demonstrates the outcome for 0% tax rate).
The franking credit rebate may not be equal to the full amount of the 30% corporate tax rate as it also will depend on the level of franking, which is impacted by the amount of the company’s offshore earnings not paying Australian corporate tax and thus the amount of the company’s earnings subjected to Australian corporate tax. Figure 2 illustrates the tax consequences for an individual resident investor at different income tax rates, using a dividend with 100% franking.
* Australian Tax Office, 2012,”Self-managed superannuation statistical report, March 2012”.
** The purpose of dividend imputation is to reduce double taxation – double taxation refers to the taxation of company earnings and then taxed again in the hands of the investor.
Figure 2 Franking credits for different tax rates for the year ending 2013, assuming a fully franked dividend (100% franking) and implementing changes in tax brackets relative to 2012
This example uses a dividend of $700 received by a retail investor
Sources: Australian Tax Office, Vanguard calculation.
3 Towers Watson, 2012, “Global Pension Asset Study 2012”, see www.towerswatson.com/assets/pdf/6267/Global-Pensions-Asset-Study-2012.pdf
4 Phillips, Christopher, et al., 2012, “The role of home bias in global asset allocation decisions”, The Vanguard Group.
4
Expectations and behaviourOne of the earliest studies on the topic5 identified investors’ expectations about future returns in their home market as a key driver. This study showed that in each home market investors were expecting several hundred basis points returns in their own market relative to other markets – so, in order to diversify, offshore investors must be more pessimistic about their domestic market and more optimistic about global markets.
FamiliarityInvestors generally feel more comfortable with their home market and allocate investments accordingly, even if it results in a poorer risk-return trade-off for their portfolio. Strong and Xu6 showed that investors tend to be more optimistic about their domestic economies than foreign economies.
Corporate governanceDahlquist and others7 suggested that corporate governance practices have a major impact due to the variability between countries – so perceptions of companies’ accountability differ between countries.
Multinational companiesInvestors may feel that through investment in multinational companies, they will attain as much global diversification as they will need. Historical evidence suggests that a company’s performance has been more highly correlated to its domestic market, regardless of where business operations are conducted. LaBarge examined the impact of global sectors and countries on the returns of multinational firms and found that diversification across both country and sector remained relevant.8
CurrencyMany investors perceive foreign investments as inherently more risky than domestic holdings. Much of the volatility in foreign investing can be attributed to exchange-rate fluctuations, and the desire to avoid the negative impact of this could be an additional reason why investors allocate greater percentages of their portfolios to local securities. Australian dollar investors benefit from some hedging due to the hedge impact index (the difference between the unhedged and hedged
Relative magnitude of home country equity biasFigure 3
Wei
ght
in g
loba
l mar
ket
Domestic allocation to domestic equities (%)
Sources: Vanguard Investments Australia Ltd analysis based on International Monetary Fund’s (IMF) Coordinated Portfolio Investment Survey (2011), Barclays Capital, and Thomson Reuters Datastream as at 31 July 2012.
Notes: The IMF’s Coordinated Portfolio Investment Survey was used in conjunction with market-cap information to determine domestic and foreign investment. The MSCI All Country World Index (ACWI) was used to represent the world equity-market portfolio. Country weights for domestic equities were represented by the MSCI USA Investable Market Index (IMI), the MSCI UK Investable Market Index, the MSCI Australia Investable Market Index, and the MSCI Canada Investable Market Index
Australian equities U.S. equities Canada equities U.K. equities
29%
60% 70%
-10
0
10
20
30
40
50
60%
30 40 50 60 70 80 90%
42%
5 French, Kenneth R., and James M. Poterba, 1991, “Investor Diversification and Global Equity Markets”, NBER Working Paper No. 3609. Cambridge, Mass.: National Bureau of Economic Research.
6 Strong, Norman, and Xinzhong Xu, 2003, “Understanding the Equity Home Bias: Evidence from Survey Data”. Review of Economics and Statistics 85: 307–12.
7 Dahlquist, Magnus, Lee Pikowitz, Rene M. Stulz, and Rohan Williamson, 2002. “Corporate Governance, Investor Protection, and the Home Bias”, Tuck-JQFA Contemporary Corporate Governance Issues II Conference; available at http://ssrn.com/abstract=320222 or http://doi:10.2139/ssrn.320222.
8 LaBarge, Karin Peterson, 2008, “Diversification by Country and Global Sector: Considerations for Portfolio Construction”,The Vanguard Group.
5
index) being positive over the longer term but the amount of hedging across a diversified portfolio that holds different assets will be dependent on the long term objectives of the investment strategy (the risk/return targets).9
Figure 4 shows home country equity bias trends in Australia, Canada, the U.K. and the U.S.10 since 2001. Investors in Australia and Canada have marginally decreased their home country bias in equities, while U.S. and U.K. investors have become more globally diversified in their equity allocations. The reduction in equity home country bias across each country may be attributable to a number of trends in the finance industry, including increased access to global investment vehicles, increased awareness of the value of global diversification, and lower costs.11
How much exposure to Australian equity?
The relatively strong home country bias of many Australian investors is unlikely to change significantly in the short term, although over the longer term it may slowly reduce in size, as has been observed historically. So, in the current environment what allocation is appropriate for an investor’s portfolio?
If we look to global equity, as referenced by MSCI World Index in Australian dollars market cap as a guide, it would suggest a 3.5% allocation to Australian equities.12 However, we have seen most investors own far more than the market cap weight.
To investigate an appropriate allocation to Australian equities, we constructed historical portfolios of equities and fixed income for the period January 1990 to June 2012. For each portfolio we incrementally adjusted the equity allocation to Australian equities from 0% to 100% (the remainder being global equities) and estimated the impact of portfolio volatility. Figure 5 presents our findings. The historical minimum-variance portfolio for a portfolio containing 100% equities, consisting of an equity allocation of 52% Australian equities and 48% global equities, reduces portfolio volatility by 2%. Results for portfolios with a 70%/30%, 50%/50% and 30%/70% equity/fixed income exposure suggest a similar equity allocation to Australian equities and reduce portfolio volatility by a smaller amount.
One weakness of the minimum-variance portfolio approach is that it is backward looking and time dependent. When considering shorter sub periods the results were mixed. For the 10 year period ended June 2002, the historical minimum-variance reduced portfolio volatility by 1.9% and suggested a split of 48%/52% for Australian and global equities. For the 10 year period ended June 2012, the historical minimum-variance reduced portfolio volatility by only 0.8% and suggested a split of 36%/64% for Australian and global equities.
Evolution of home country equity bias in equity markets 2001, 2005 and 2010Figure 4
Sources: IMF’s Coordinated Portfolio Investment Survey (2011), Barclays Capital, and Thomson Reuters Datastream as at 31 July 2012.
Over weighting to domestic Domestic market as % of world market Domestic allocation
9 LaBarge, Karin Peterson, 2010,“Currency management: considerations for the equity hedging decision”, The Vanguard Group
10 These countries are used in the analysis because they are representative of Vanguard’s business centres
11 Phillips, Christopher B..et al., 2012, “The Role of Home Bias in Global Asset Allocation Decisions”, The Vanguard Group.
12 MSCI World Index in Australian dollars has a 3.5% exposure to Australian equities, as at 30 June 2012.
6
Although the results of our analysis are time dependent, we noted that across all time periods the historical minimum-variance portfolio approach suggested a much higher allocation to Australian equities than a market cap approach, and in the last 10 year period the equity portfolio with the lowest risk would only have a weight of 36% in Australian equities, markedly lower than the 70% over weight currently observed in the market.
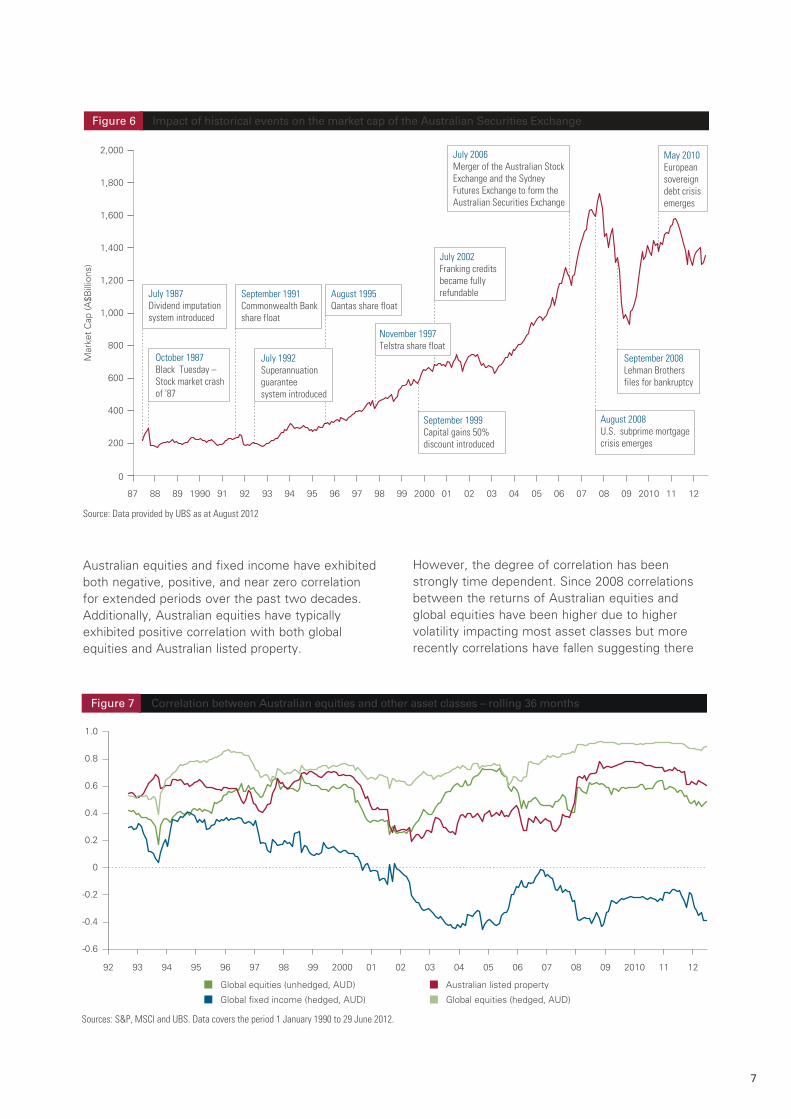
History of the Australian equity market
Home country equity bias in Australia has been influenced by historical market events. The Australian equity market value has grown more than six-fold in the last 25 years since 1987 (see Figure 6), similar to the growth in all global equity markets with the MSCI AC World Index ex Australia (in local currency terms) increasing over six times its value in 25 years.13 Australian equity market growth has been supported by a growing economy and a sound financial system, attracting a diverse mix of approximately 40% foreign investors, 40% domestic institutional investors and 20% domestic retail investors.14
Australian investors have increased their participation on the back of various pivotal events that have changed the shape of the market (see Figure 6). The introduction of the dividend imputation system and fully refundable franked dividends has increased Australian investment in companies that pay high franked dividends (such as banking shares). Superannuation legislation has a major influence on the flow of money into Australian equities resulting in superannuation assets growing from AUD170 billion in 1992 (when the Superannuation Act was enacted) to over AUD1.3 trillion in superannuation assets as at 31 March 2012,15 and forecast to reach AUD6 trillion by 2030.16
Correlations and diversification
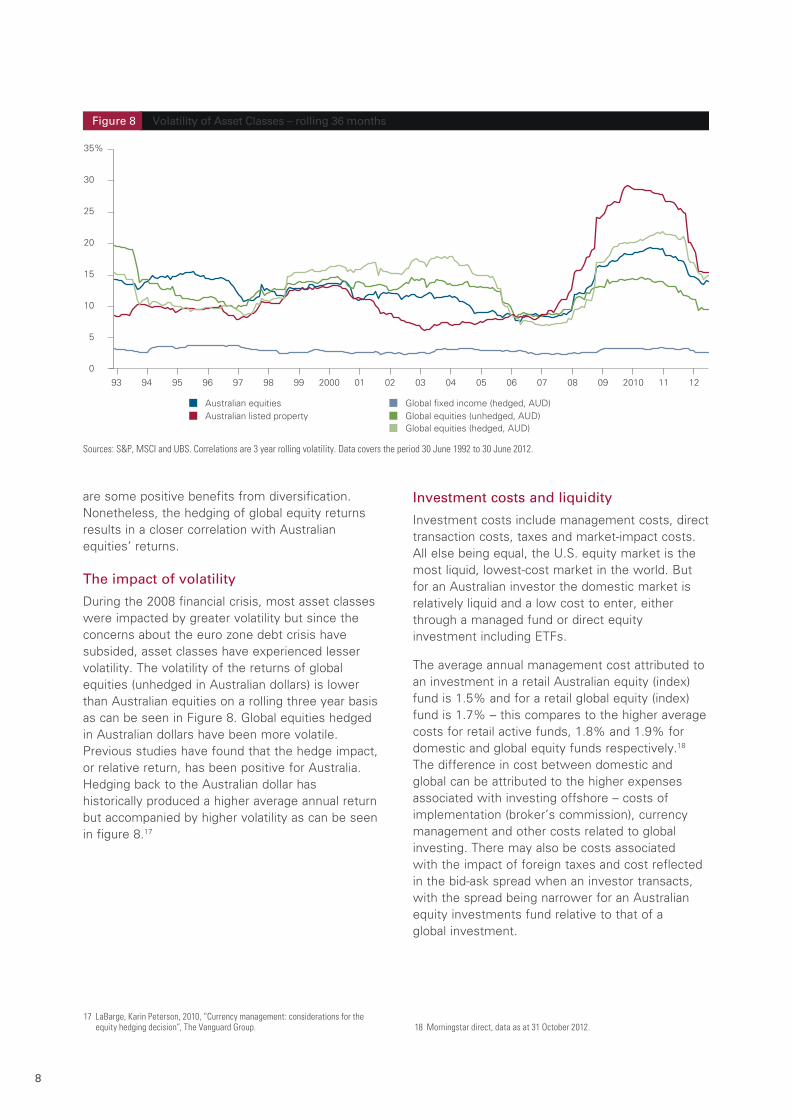
Australian equities offer exposure to major companies operating on a global basis in different economic and market conditions. But as historical evidence has shown that the performance of companies is more closely correlated with their domestic market, so benefits exist from being diversified across global markets, with different risks and rewards. In Figure 7 the correlation between returns of Australian equities and other investment options have varied over time, suggesting that diversification can be beneficial.
Average annualised change in portfolio volatility when adding Australian equities to a diversi�ed portfolio – for the period January 1990 to June 2012.
Figure 5
100% equity 70% equity/30% fixed income 50% equity/50% fixed income
Sources: S&P, MSCI and UBS. Data covers the period 1 January 1990 to 29 June 2012.
30% equity/70% fixed income
-2.5
-2.0
-1.5
-1.0
-0.5
0
0.5
1.0%
0 10 20 30 40 50 60 70 80 90 100
Percentage of equity allocation to Australian Equities (%)
13 FactSet, data as at September 201214 The ASX Group website, www.asxgroup.com.au/the-australian-market.htm,
as at 31 July 2012
15 Australian bureau of statistics (ABS), www.abs.gov.au/AUSSTATS/[email protected]/Lookup/5655.0Explanatory%20Notes1March%202012?OpenDocumen
16 Deloittes, 2012, “Dynamics the Australian Superannuation System, the next 20 year”.
7
Australian equities and fixed income have exhibited both negative, positive, and near zero correlation for extended periods over the past two decades. Additionally, Australian equities have typically exhibited positive correlation with both global equities and Australian listed property.
However, the degree of correlation has been strongly time dependent. Since 2008 correlations between the returns of Australian equities and global equities have been higher due to higher volatility impacting most asset classes but more recently correlations have fallen suggesting there
Impact of historical events on the market cap of the Australian Securities ExchangeFigure 6
Global equities (unhedged, AUD) Australian listed property
Global fixed income (hedged, AUD)
Sources: S&P, MSCI and UBS. Data covers the period 1 January 1990 to 29 June 2012.
Global equities (hedged, AUD)
8
are some positive benefits from diversification. Nonetheless, the hedging of global equity returns results in a closer correlation with Australian equities’ returns.
The impact of volatility
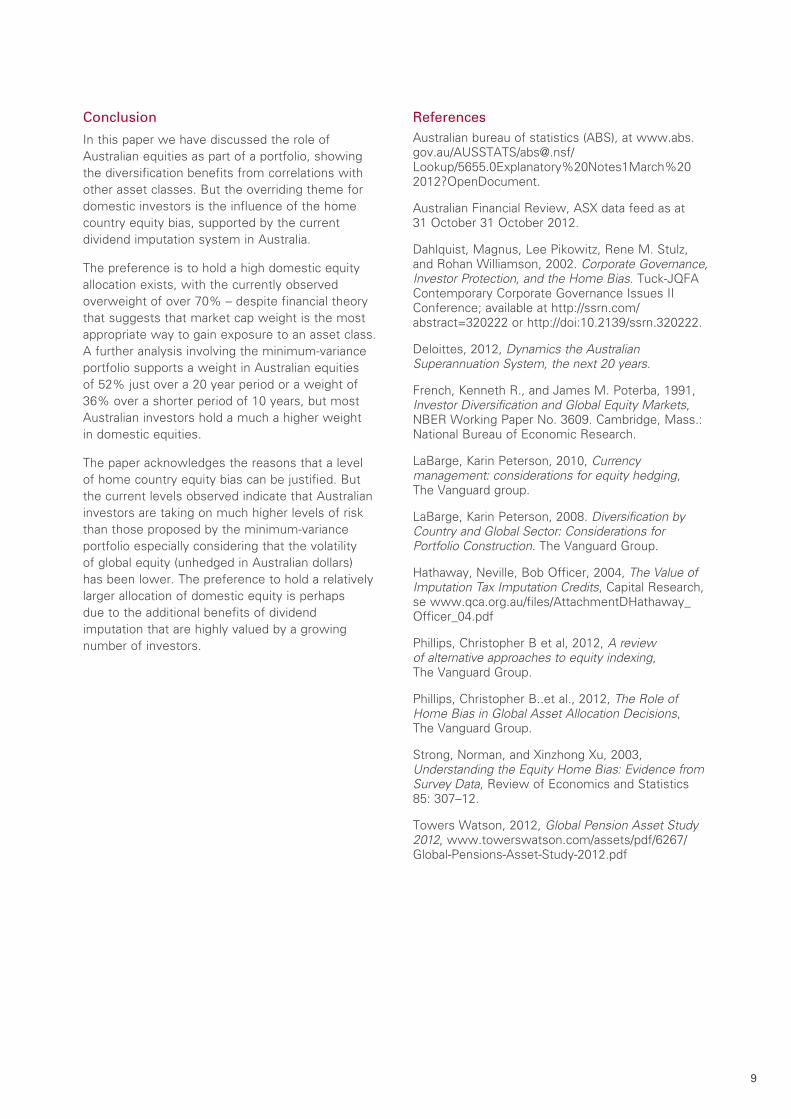
During the 2008 financial crisis, most asset classes were impacted by greater volatility but since the concerns about the euro zone debt crisis have subsided, asset classes have experienced lesser volatility. The volatility of the returns of global equities (unhedged in Australian dollars) is lower than Australian equities on a rolling three year basis as can be seen in Figure 8. Global equities hedged in Australian dollars have been more volatile. Previous studies have found that the hedge impact, or relative return, has been positive for Australia. Hedging back to the Australian dollar has historically produced a higher average annual return but accompanied by higher volatility as can be seen in figure 8.17
Investment costs and liquidity
Investment costs include management costs, direct transaction costs, taxes and market-impact costs. All else being equal, the U.S. equity market is the most liquid, lowest-cost market in the world. But for an Australian investor the domestic market is relatively liquid and a low cost to enter, either through a managed fund or direct equity investment including ETFs.
The average annual management cost attributed to an investment in a retail Australian equity (index) fund is 1.5% and for a retail global equity (index) fund is 1.7% – this compares to the higher average costs for retail active funds, 1.8% and 1.9% for domestic and global equity funds respectively.18 The difference in cost between domestic and global can be attributed to the higher expenses associated with investing offshore – costs of implementation (broker’s commission), currency management and other costs related to global investing. There may also be costs associated with the impact of foreign taxes and cost reflected in the bid-ask spread when an investor transacts, with the spread being narrower for an Australian equity investments fund relative to that of a global investment.
17 LaBarge, Karin Peterson, 2010, “Currency management: considerations for the equity hedging decision”, The Vanguard Group. 18 Morningstar direct, data as at 31 October 2012.
Volatility of Asset Classes – rolling 36 monthsFigure 8
Australian equitiesGlobal equities (unhedged, AUD)Australian listed propertyGlobal fixed income (hedged, AUD)
Sources: S&P, MSCI and UBS. Correlations are 3 year rolling volatility. Data covers the period 30 June 1992 to 30 June 2012.
Global equities (hedged, AUD)
0
5
10
15
20
25
30
35%
9
Conclusion
In this paper we have discussed the role of Australian equities as part of a portfolio, showing the diversification benefits from correlations with other asset classes. But the overriding theme for domestic investors is the influence of the home country equity bias, supported by the current dividend imputation system in Australia.
The preference is to hold a high domestic equity allocation exists, with the currently observed overweight of over 70% – despite financial theory that suggests that market cap weight is the most appropriate way to gain exposure to an asset class. A further analysis involving the minimum-variance portfolio supports a weight in Australian equities of 52% just over a 20 year period or a weight of 36% over a shorter period of 10 years, but most Australian investors hold a much a higher weight in domestic equities.
The paper acknowledges the reasons that a level of home country equity bias can be justified. But the current levels observed indicate that Australian investors are taking on much higher levels of risk than those proposed by the minimum-variance portfolio especially considering that the volatility of global equity (unhedged in Australian dollars) has been lower. The preference to hold a relatively larger allocation of domestic equity is perhaps due to the additional benefits of dividend imputation that are highly valued by a growing number of investors.
ReferencesAustralian bureau of statistics (ABS), at www.abs.gov.au/AUSSTATS/[email protected]/Lookup/5655.0Explanatory%20Notes1March%20 2012?OpenDocument.
Australian Financial Review, ASX data feed as at 31 October 31 October 2012.
Dahlquist, Magnus, Lee Pikowitz, Rene M. Stulz, and Rohan Williamson, 2002. Corporate Governance, Investor Protection, and the Home Bias. Tuck-JQFA Contemporary Corporate Governance Issues II Conference; available at http://ssrn.com/abstract=320222 or http://doi:10.2139/ssrn.320222.
Deloittes, 2012, Dynamics the Australian Superannuation System, the next 20 years.
French, Kenneth R., and James M. Poterba, 1991, Investor Diversification and Global Equity Markets, NBER Working Paper No. 3609. Cambridge, Mass.: National Bureau of Economic Research.
LaBarge, Karin Peterson, 2010, Currency management: considerations for equity hedging, The Vanguard group.
LaBarge, Karin Peterson, 2008. Diversification by Country and Global Sector: Considerations for Portfolio Construction. The Vanguard Group.
Hathaway, Neville, Bob Officer, 2004, The Value of Imputation Tax Imputation Credits, Capital Research, se www.qca.org.au/files/AttachmentDHathaway_Officer_04.pdf
Phillips, Christopher B et al, 2012, A review of alternative approaches to equity indexing, The Vanguard Group.
Phillips, Christopher B..et al., 2012, The Role of Home Bias in Global Asset Allocation Decisions, The Vanguard Group.
Strong, Norman, and Xinzhong Xu, 2003, Understanding the Equity Home Bias: Evidence from Survey Data, Review of Economics and Statistics 85: 307–12.
Towers Watson, 2012, Global Pension Asset Study 2012, www.towerswatson.com/assets/pdf/6267/Global-Pensions-Asset-Study-2012.pdf
10
Further ReadingThe Australian Stock Exchange, 2010. 2010 Australian Share Ownership Study.
Brinson, Gary P., L. Randolph Hood, and Gilbert L. Beebower, 1986. Determinants of Portfolio Performance. Financial Analysts Journal, 42(4): 39–48; reprinted in Financial Analysts Journal 51(1): 133–38 (50th Anniversary Issue, January/February 1995).
Davis, Joseph H., Francis M. Kinniry Jr., and Glenn Sheay, 2007, The Asset Allocation Debate: Provocative Questions, Enduring Realities, The Vanguard Group.
Davis, Joseph et al., 2008, What Does the Crisis of 2008 Imply for 2009 and Beyond?,The Vanguard Group.
Davis, Joseph et al., 2008, Macroeconomic Expectations and the Stock Market: The Importance of a Longer-Term Perspective, The Vanguard Group.
International Monetary Fund, 2011. Coordinated Portfolio Investment Survey.
Philips, Christopher B,. 2012. Considerations for Investing in Non-US Equities. The Vanguard Group.
Wallick et al., 2012, The Global Case for Strategic Asset Allocation, The Vanguard Group.
11
This paper includes general information and is intended to assist you. Vanguard Investments Australia Ltd (ABN 72 072 881 086 / AFS Licence 227263) is the product issuer. We have not taken yours or your clients’ circumstances into account when preparing this paper so it may not be applicable to the particular situation you are considering. You should consider yours and your clients’ circumstances, and our Product Disclosure Statement (“PDS”), before making any investment decision or recommendation. You can access our PDS at vanguard.com.au or by calling 1300 655 102. Past performance is not an indication of future performance. This paper was prepared in good faith and we accept no liability for any errors or omissions.