SAGE-Hindawi Access to ResearchStem Cells InternationalVolume 2011, Article ID 429187, 12 pagesdoi:10.4061/2011/429187
Research Article
The Role of Glucose, Serum, and Three-DimensionalCell Culture on the Metabolism of Bone Marrow-DerivedMesenchymal Stem Cells
Byron Deorosan1 and Eric A. Nauman1, 2, 3
1 Weldon School of Biomedical Engineering, Purdue University, 585 Purdue Mall, West Lafayette, IN 47907-2088, USA2 School of Mechanical Engineering, Purdue University, 585 Purdue Mall, West Lafayette, IN 47907-2088, USA3 Department of Basic Medical Sciences, Purdue University, 585 Purdue Mall, West Lafayette, IN 47907-2088, USA
Correspondence should be addressed to Eric A. Nauman, [email protected]
Received 3 December 2010; Accepted 7 February 2011
Mesenchymal stem cells (MSCs) have become a critical addition to all facets of tissue engineering. While most in vitro researchhas focused on their behavior in two-dimensional culture, relatively little is known about the cells’ behavior in three-dimensionalculture, especially with regard to their metabolic state. To evaluate MSC metabolism during twodimensional culture, murine bonemarrow-derived MSCs were cultured for one week using twelve different medium compositions, varying in both glucose and fetalbovine serum (FBS) concentrations. The results indicate that glucose concentration was the more important factor in sustainingcell growth and viability. To evaluate metabolic state during three-dimensional culture, MSCs were cultured for one week using twodifferent medium compositions and two different concentrations of collagen gel matrix. The medium compositions only varied inglucose concentration. The results indicate that glucose and extracellular matrix were significant factors in the metabolic responseof the cells. However, cells cultured in low density collagen exhibited considerable cell death, likely because of physical contractionof the collagen hydrogel which was not observed in the higher density collagen. These findings will be useful to the developmentof in vitro cell culture models that properly mimic in vivo physiological processes.
1. Introduction
Tissue engineering integrates the application of engineeringand biological principles to study, design, develop, andrepair biological structures. It is an iterative, objective-driven process which has spurred the production of artificialskin [1–3] and led to advances in the development ofsmooth muscle tissue [4, 5], synthetic blood vessels [6–8], cardiac tissue analogues [9–11], renal tubules [12, 13],intestinal segments [14, 15], bladder substitutes [16–18], andbone tissue scaffolds [19–21]. Long-term success of thesetissue-engineered therapies requires their biocompatibilitywith the host tissue and the development of functionallydifferentiated cells within the implanted tissue. Stem cellsare important to these applications because of their abilityto differentiate into various cell types.
Bone marrow-derived mesenchymal stem cells (MSCs)are less controversial to obtain and easier to controlthan embryonic stem cells [22]. But, all stem cells mustbe subjected to various environmental cues in order todifferentiate into specific cell types. To date, the mostcommon method of controlling stem cell differentiation isto implement physiologically relevant factor proteins andmolecular cues designed to take advantage of the naturalcompetence of the MSCs. This process has led to advancesin liver repair [23–28], islet cell regeneration [29–34],bone augmentation [35–37], and spinal cord regeneration[38–40].
While these advances are significant to the field, currentresearch is lacking in relation to the three-dimensionalculture of MSCs, their metabolic state, and how both ofthese considerations may affect their terminal differentiation.
2 Stem Cells International
It is important to consider how cells will respond in three-dimensional culture compared with two-dimensional culturebecause it has been shown that extracellular matrix interac-tions cause many different cellular reactions related to dif-ferentiation, proliferation, growth, motility, and gene expres-sion [41–49]. Additionally, because aerobic metabolism andanaerobic metabolism are the primary means of derivingenergy for cells and because much more energy is derivedaerobically than anaerobically, it is reasonable to assume thatthe prevailing metabolic state experienced by the cells willhave a significant effect on the terminal differentiation ofthe stem cells. Evidence has shown that metabolic state caninfluence both protein activation and protein conformation[50, 51], both of which are crucial during cell differentiation.This may also affect the ability of growth factors and otherstimuli to induce the desired outcomes in vivo.
Consequently, the overall motivation of this series ofexperiments was to investigate the metabolic state of MSCs inculture in response to variations in glucose and fetal bovineserum (FBS) concentrations in both two-dimensional andthree-dimensional culture conditions.
2. Materials and Methods
2.1. Two-Dimensional Cell Culture. Murine MSCs (ATCCNumber CRL-12424) were used for these experiments(ATCC, Manassas, Va, USA). MSCs were cultured inmaintenance medium composed of glutamine-free Dul-becco’s modification of Eagle’s medium (DMEM) (90-113-PB, Mediatech, Herndon, VA) supplemented with 10%FBS (Invitrogen, Carlsbad, Calif, USA), 1% penicillin-streptomycin (10 mg/mL, Sigma-Aldrich, St. Louis, Mo,USA), and 0.1% amphotericin-B (250 μg/mL, Sigma-Aldrich,St. Louis, MO). The glucose concentration within thismedium was made to be 25.0 mM by adding D-glucose(4912, Mallinckrodt, Phillipsburg, NJ, USA). MSCs wereseeded in either 6-well or 24-well plates (BD Biosciences,San Jose, Calif, USA) at a density of 1.5×10⁴/cm2. The 6-well plates were used to measure samples for the metabolicassays, and the 24-well plates were used to acquire cellnumber at various days throughout the experiment. Atthis density, the cells were nearly confluent upon seeding,in order to minimize cell proliferation over the courseof the experiment. Upon seeding the cells, wells in the6-well and 24-well plates were filled with 2.4 mL and 0.5 mLof maintenance medium respectively so that the mediumheight would be the same between the two plate types. Thecells were allowed to attach and stabilize for twelve hoursafter seeding. The immediate conclusion of this twelve-hourperiod corresponds to “day 0.” The study lasted a total ofsix days. Twelve experimental medium groups were used inthis portion of the study corresponding to twelve glucoseconcentration (0.5 mM, 1.0 mM, 5.0 mM, and 25.0 mM)and serum concentration (2%, 5%, or 10%) combinations.Twelve samples were accorded to each group, except thepyruvate groups (please see below). Subsequently, 1.0 mLmedium samples were obtained on days 4 and 6 for theglucose, lactate, and pyruvate analysis. Cell number wasmeasured on days 0, 2, 4, and 6. Medium was refreshed in
wells that were not analyzed on that particular experimentalday.
2.2. Three-Dimensional Cell Culture. Circular collagen gelswith an area of 2.0 cm2 and a height of 0.5 mm wereused as three-dimensional scaffolds for culturing the MSCs.Collagen was harvested from porcine tendon and placed in0.5 M acetic acid (Mallinckrodt Baker, Phillipsburg, NJ). Theacid soluble collagen was neutralized with 2.0 M sodiumhydroxide (NaOH) (Mallinkrodt Baker, Phillipsburg, NJ).High-density gels at 5.0 mg/mL and low-density gels at2.5 mg/mL were prepared in 24-well plates. Each gel wasformed using 100 μL of collagen solution and each contained250,000 MSCs. Four experimental groups were used inthis portion of the study corresponding to two glucoseconcentration (0.5 mM and 25.0 mM) and final collagenconcentration (2.5 mg/mL and 5.0 mg/mL) combinations.Twelve samples were accorded to each group. The serumconcentration for each case was 5%. For each mediumcombination, a volume of 0.5 mL was used for each well ofthe 24-well plates. Subsequently, the medium was collectedon days 4 and 6 for the glucose and lactate characterization.Cell number was measured on days 0, 2, 4, and 6.
2.3. Cell Population. The 24-well plates were used for cellnumber determination for both two- and three-dimensionalcultures. Briefly, Hoechst dye (Invitrogen, Carlsbad, Calif,USA) was added to DMEM for a final concentration of5.0 μg/mL. A 100 μL volume of this Hoechst solution wasadded to each well of the 24-well plates. Subsequently,the plates were placed in a 37◦C, 5% CO2 incubatorfor fifteen minutes. Each plate was read in a fluorometer(Thermo Electron, Finland) using an excitation of 355 nmand the emission was measured at 460 nm. Backgroundmeasurements were taken using cell-free empty wells forthe two-dimensional culture or cell-free gels for the three-dimensional culture. The fluorometer readings, in conjunc-tion with an experimentally determined calibration curve,were used to calculate the cell population within each well.
2.4. Cell Viability. The same 24-well plates used to assess cellpopulation were used to observe cell viability qualitativelyusing fluorescence imaging. Briefly, both calcein-AM andethidium bromide (Fluka, St. Louis, MO) were added toDMEM for a final concentration of 2.5 μM. Calcein-AMindicates living cells by emitting 517 nm light when excitedby 494 nm light, and ethidium bromide indicates dead cellsby emitting 617 nm light when excited by 528 nm light.A 100 μL volume of this solution was added to each well ofthe 24-well plates. Subsequently, the plates were placed in a37◦C, 5% CO2 incubator for fifteen minutes. The wells wereobserved using the 10X and 40X magnification objectives onan IX71 fluorescence microscope (Olympus, Center Valley,Pa, USA), and TIFF images were taken using a QColor 5camera (Olympus, Center Valley, PA) and QCapture Proversion 5.0.1.26 software (QImaging, Surrey, BC, Canada).The TIFF images were converted to bitmap images usingIrfanview version 4.25 software (Irfan Skiljan, 2009) and were
Stem Cells International 3
then merged using Artweaver version 0.3.9.9 software (BorisEyrich, 2005).
2.5. Glucose Assay. Medium samples were tested for glucoseconcentration using a fluorometric assay kit (Invitrogen,Carlsbad, CA). The kit indicates the presence of glucoseby activating fluorescent resorufin, which has absorptionmaxima at 571 nm and emission maxima at 585 nm. Sampleswere diluted with deionized water so that the glucoseconcentration would fall within the optimum detectionrange of the kit, between 3.0 μM and 50.0 μM. Fluorescencewas measured using a fluorometer with excitation at 530 nmand emission detection at 590 nm. Background measure-ments were taken using glucose-free DMEM (Invitrogen,Carlsbad, CA). The emission values were converted toglucose concentration using a calibration curve. Then, theseconcentrations were multiplied by the dilution factor toobtain the glucose concentration within each extracellularsample. This resulting concentration was subtracted from theactual starting glucose concentration of the original growthmedium to obtain the glucose consumption.
2.6. Lactate Assay. Medium samples were tested for lac-tate concentration using a spectrophotometric assay kit(Instruchemie, The Netherlands). The kit determines theconcentration of lactate by detecting an increase in theabsorbance of reduced nicotinamide adenine dinucleotide(NAD) at 340 nm, indicating the amount of lactate originallypresent in the sample. The NAD absorbance at 340 nmwas measured with a spectrophotometer (Thermo Electron,Finland). Extracellular samples were diluted with an equalamount of deionized water so that the lactate concen-tration would fall within the optimum detection rangeof the kit, between 0.22 mM and 13.32 mM. Backgroundmeasurements for extracellular samples were taken usingordinary DMEM. These background measurements weresubtracted from their respective absorption measurements.Background-subtracted measurements were converted tolactate concentrations using a calibration curve.
2.7. Pyruvate Assay. Extracellular and intracellular sampleswere tested for pyruvate concentration using a spectropho-tometric assay kit (Instruchemie, The Netherlands). The kitdetermines the concentration of pyruvate by detecting adecrease in the absorbance of oxidized nicotinamide adeninedinucleotide (NAD) at 340 nm, indicating the amount ofpyruvate originally present in the sample. The NADHabsorbance at 340 nm was measured with a spectrophotome-ter (Thermo Electron, Finland). The optimum detectionrange of the kit was between 0.011 mM and 0.340 mM.
Pyruvate measurements were taken using both anintracellular and extracellular approach. The extracellularapproach was performed in both the two- and three-dimensional conditions with six samples accorded to eachcondition. The extracellular approach consisted of measur-ing the pyruvate concentration within the same mediumsamples used for glucose and lactate measurements. Theintracellular approach was only performed for the two-dimensional case. Briefly, each well of the 6-well plate
was rinsed twice with PBS after the medium sample wasextracted for extracellular measurements. Next, the cellswere removed from the wells using cell scrapers, 0.5 mLof cold perchloric acid was added to each well, and thecell/acid solution was placed in microcentrifuge tubes. Next,the samples were subjected to vortex for thirty seconds,placed in a −20◦C freezer for five minutes, and thencentrifuged for ten minutes at 1700 ×g (Beckman Coulter,Fullerton, CA). The resulting supernatant was used toassay for pyruvate concentration. The samples did not haveto be diluted in either the extracellular or intracellularcase. Background measurements for intracellular sampleswere taken using deionized water samples. Backgroundmeasurements for extracellular samples were taken usingordinary DMEM. These background measurements weresubtracted from their respective absorption measurements.Background-subtracted measurements were converted tolactate concentrations using a calibration curve.
2.8. Characterization of the Gel Transport Properties. Viscousdrag coefficients were obtained for trypan blue (Sigma-Aldrich, St. Louis, MO) diffusing through 2.5 mg/mL and5.0 mg/mL collagen gels. Clear 1.0 cm diameter test tubeswere used to hold 2.0 mL of each gel concentration (N = 3for each concentration). The tubes were then capped andplaced in a 37◦C incubator for two hours. After incubation,each received 1.0 mL of 0.13% trypan blue solution. Thetrypan blue solution was allowed to diffuse through thecollagen gels while the tubes were maintained at 37◦C. Overthe span of 3 days, the tubes were periodically photographed(Canon EOS Rebel Digital EF-S 18-55; Tokyo, Japan) and theimages were used to determine the distance that the trypanblue solution advanced through the gels using QCapture Prosoftware (version 5.0.1.26; QImaging; Surrey, BC, Canada).The process was repeated for a set of trypan blue solutionsin pure water. After all of the data was collected, the trypanblue advancement was plotted versus time. A second-orderpolynomial curve was fit to the data points, and the equationwas used to find values for both the velocity and accelerationof the dye through the gels. A force balance on the trypanblue molecules was used to estimate values of the dragcoefficient
−ζ ∗ vdrift − ρgelVg + ρtrypanVg = ρtrypanVa, (1)
where ζ is the drag coefficient, vdrift is the drift velocity ofthe trypan blue molecules, ρgel is the density of the gel, Vis the volume of the molecule that is diffusing through thematrix, g is the acceleration due to gravity, ρtrypan is thedensity of trypan blue powder, and a is the experimentallydetermined acceleration of the trypan blue through thecollagen matrix. For these experiments, the values of theconstants in (1) were the following: V was 1.20E − 28 m3,ρtrypan was 1667 kg/m3, ρgel was 1000 kg/m3, and g was9.8 m/s2. The same values were used to estimate the dragcoefficient for trypan blue in water. Afterward, (1) was usedto solve for relative drag coefficients consisting of the dragcoefficients of trypan blue in collagen gels normalized to thatof trypan blue in water. It is critical to note that experimental
4 Stem Cells International
values for the acceleration of the trypan blue molecule weremuch smaller than those of the acceleration due to gravity.Therefore, the term containing a was negligible in solvingfor the relative drag coefficients. Relative diffusivity valueswere calculated by taking the reciprocal of the respective dragcoefficients.
2.9. Statistics. StatView version 5.0.1 was used to apply aone factor analysis of variance (ANOVA) and Tukey-Kramerpost-hoc test to the data to evaluate statistical significancebetween the groups at a significance level of P < .05.
3. Results
3.1. Cell Population. The cell population at the start of thetwo-dimensional experiment was even between the differentexperimental groups (Figure 1). The population data beganto exhibit significant differences between serum concentra-tions at day two and between glucose concentrations at dayfour. However, by day six significant differences betweenserum groups were not found. Additionally, higher glu-cose concentrations produced higher cell populations thanthe lower glucose concentrations. The three-dimensionalcell population data did not exhibit significant differencesbetween the two collagen densities or the two glucoseconcentrations (Figure 2). However, of note are the highstandard deviations for most of the data.
3.2. Cell Viability. The two-dimensional, day zero cell via-bility indicates high cell number and confluency before thecells were exposed to any experimental treatments (imagesnot shown). However, by day two the cells in the 0.5 mMand 1.0 mM environments exhibited low viability whilethose in the 5.0 mM and 25.0 mM environments exhibitedhigh viability (Figure 3). This trend continued throughdays four and six. For the three-dimensional culture, therewere noticeable differences in the cell viability betweenboth the collagen densities and the environmental glucoseconcentrations. At day zero, the cell viability and confluencywere higher for cells placed in the 2.5 mg/mL collagen matrix(images not shown). Once applied, the 0.5 mM glucoseenvironment caused the cells to exhibit low viability andconfluency for the duration of the experiment regardlessof the collagen density (Figure 4). In the 25.0 mM glucosegroup, cell viability and confluency steadily decreased in the2.5 mg/mL group while viability and confluency increased inthe 5.0 mg/mL group (Figure 4).
3.3. Glucose Consumption. In both the two- and three-dimensional cases, glucose consumption was the highestin the 25.0 mM groups (data not shown). For the two-dimensional case, there were three cases of significant differ-ences between serum groups and a number of significant dif-ferences between glucose groups. The three-dimensional casedid not yield a significant difference between collagen groupsor glucose groups until day six, when the consumption washigher for the cells in the 5.0 mg/mL collagen matrix than thecells in the 2.5 mg/mL collagen matrix.
3.4. Lactate Production. Groups with higher glucose con-sumption would be expected to yield higher lactate pro-duction as the endpoint of glycolysis. This behavior wasshown in the lactate production data, with lactate productionincreasing with increasing glucose consumption in both two-and three-dimensional cultures (data not shown). At all FBSlevels on days 4 and 6 the 0.5 mM and 1.0 mM glucosegroups exhibited significantly lower lactate production thanthe 15 mM group at the P < .05 level. Similarly, lactateproduction mirrored the glucose consumption in three-dimensional culture for both days four and six. There wasno significant effect of FBS on lactate production in the twodimensional cultures.
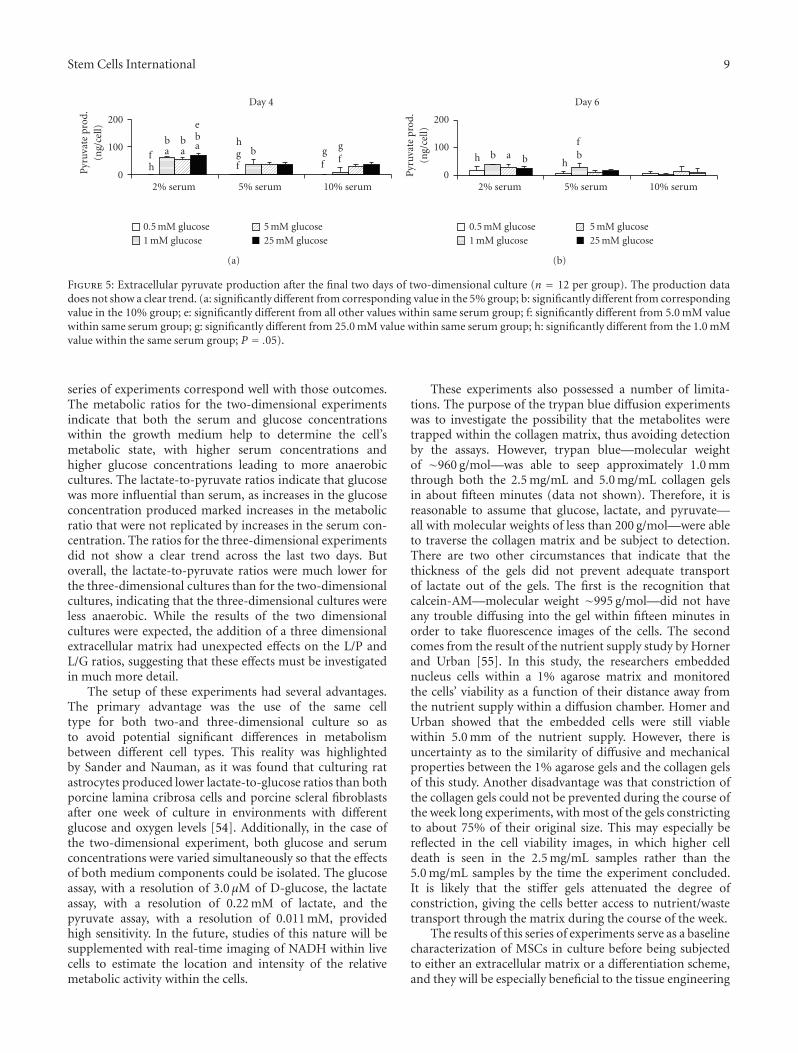
3.5. Pyruvate Production. As pyruvate is not likely toaccumulate, being converted to either lactate or acetylcoenzyme A, the amount of pyruvate produced wouldnot be expected to have a consistent pattern amongst theexperimental glucose groups. This random behavior wasshown in both the intracellular and extracellular, two-dimensional culture data, especially in terms of statisticalsignificance (Figure 5). However, the overall pyruvate levelsdid decrease as the serum concentration increased in both ofthe two-dimensional cases. The pyruvate production levelsin the three-dimensional culture were consistently higher forthe 25.0 mM glucose group than the 0.5 mM glucose group.
3.6. Metabolic Ratios. Lactate-to-pyruvate ratios for two-dimensional culture showed an increasing trend with anincrease in the starting glucose concentration, indicatingthat higher glucose cultures were more anaerobic (Table 1).For the lactate-to-glucose ratios for two-dimensional culture,the values within the 2% serum group exhibited a similarincreasing trend with an increase in starting glucose con-centration (Table 2). However, the values within the 5% and10% serum groups did not. Of note are the discrepanciesin the actual sample populations when evaluating statisticalsignificance. Many samples showed little to no pyruvateproduction, causing calculation of the lactate-to-pyruvateratios to become impossible. Additionally, some samplesshowed little to no glucose consumption in the 0.5 and1.0 mM groups, causing lactate-to-glucose ratio calculationsto become impossible as well. This explains why a numberof experimental groups lack the expected twelve samples.The lactate-to-pyruvate and lactate-to-glucose ratios for thethree-dimensional culture did not show any clear trend(Table 2).
3.7. Gel Transport Properties. Drift velocities and acceler-ations indicate that the trypan blue molecules traveledquicker through the 2.5 mg/mL gel than the 5.0 mg/mL gel(Table 3). These characteristics were reflected in the meandrag coefficients, as that of the 5.0 mg/mL gel was larger thanthat of the 2.5 mg/mL gel.
4. Discussion
The overall purpose of this research was to investigate possi-ble differences in the metabolic state of MSCs when cultured
Stem Cells International 5
0
2
4
2% serum 5% serum 10% serum
Day 0
Cel
lnu
mbe
r(×
106
cells
)
(a)
0
2
4
2% serum 5% serum 10% serum
Day 2
Cel
lnu
mbe
r(×
106
cells
)
a aa a
b b b b
(b)
0
2
4
2% serum 5% serum 10% serum
Day 4
Cel
lnu
mbe
r(×
106
cells
)
a c ab d d d d
0.5 mM glucose1 mM glucose
5 mM glucose25 mM glucose
(c)
0
2
4
2% serum 5% serum 10% serum
Day 6
Cel
lnu
mbe
r(×
106
cells
)
d dd
d
0.5 mM glucose1 mM glucose
5 mM glucose25 mM glucose
(d)
Figure 1: Cell population (mean ± standard deviation) over the course of six days while in two-dimensional culture (n = 12 per group).Higher glucose and serum concentrations appear to produce higher cell populations over time. (a: significance between corresponding valuein the 5% group; b: significance between corresponding value in the 10% group; c: significance between corresponding values in the 5% and10% groups; d: significantly difference between the 5.0 and 25.0 mM glucose values within the same serum group; P = .05).
0
2
4
Low density High density
Day 0
Cel
lnu
mbe
r(×
106
cells
)
(a)
0
2
4
Low density High density
Day 2
Cel
lnu
mbe
r(×
106
cells
)
(b)
0
2
4
Low density High density
Day 4
Cel
lnu
mbe
r(×
106
cells
)
0.5 mM glucose25 mM glucose
(c)
0
2
4
Low density High density
Day 6
Cel
lnu
mbe
r(×
106
cells
)
0.5 mM glucose25 mM glucose
(d)
Figure 2: Cell population (mean ± standard deviation) over the course of six days while in three-dimensional culture (n = 12 pergroup). Culturing the cells within the differing three-dimensional environments did not produce any particular trend in the cell population.Statistical significance was not observed at the P = .05 level.
6 Stem Cells International
Table 1: Summary of two-dimensional L/P ratios and L/G ratios. L/P ratios indicate that groups with a higher starting glucose concentrationexhibited a more anaerobic characteristic. This trend was similar in the L/G ratios for the 2% serum group, but not for either the 5% or 10%serum groups. (a: significantly different from corresponding value in the 5.0 mg/mL group; b: significantly different from the 25.0 mM valuewithin the same collagen group; f: significantly different from 5.0 mM value within same serum group; P = .05).
Table 2: Summary of three-dimensional metabolic ratios. There was no clear trend in the data. (a: significantly different from correspondingvalue in the 5.0 mg/mL group; b: significantly different from the 25.0 mM value within the same collagen group; P = .05).
Experimental Group L/P Ratio L/G Ratio
Mean St. Dev. N Mean St. Dev. N
Day 4
0.5 mM/low density 2.30b 5.66 12 1.93 2.29 6
25.0 mM/low density 11.92a 5.41 7 0.92a 0.97 12
0.5 mM/high density 2.15b 2.42 12 15.47b 11.20 8
25.0 mM/high density 18.73 4.95 6 1.11 0.88 12
Day 6
0.5 mM/low density 74.75a,b 77.85 3 17.30a 47.92 12
25.0 mM/Low Density 8.49 9.85 12 2.34 2.44 8
0.5 mM/high density 2.92 1.15 6 11.04b 8.60 8
25.0 mM/high density 6.32 7.23 12 1.02 1.22 12
Table 3: Summary of results pertaining to trypan blue diffusion through collagen gels. The diffusivity for both cell densities is roughly thesame. ∗Relative drag coefficient and relative diffusivity values were calculated by normalizing against that of water (there was no significantdifference between the diffusivity values of the 2.5 mg/mL and 5.0 mg/mL groups).
Relative diffusivity∗ 1.0 N/A 6.9E − 06 6.4E − 06 to 7.6E− 06 6.3E− 06 5.8E− 06 to 6.7E− 06
Stem Cells International 7
0.5 mM
2%5%
10%
(a)
1 mM
(b)
5 mM
(c)
25 mM
(d)
Figure 3: Fluorescence microscopy images indicating the viability of BMSCs in two-dimensional culture after the second day (increasingglucose concentrations from left to right; increasing serum concentrations from top to bottom). Calcein-AM indicates living cells by emittinggreen light, while ethidium bromide indicates dead cells by emitting red light. The 0.5 mM and 1.0 mM environments resulted in low viabilityand sparse cell distribution. The 5.0 mM and 25.0 mM environments resulted in high viability and the maintenance of high confluency.Varying the serum concentration did not produce a noticeable difference in the viability. This result was consistent throughout the course ofthe week (20x objective; scale bar represents 250 μm).
in ordinary two-dimensional culture versus collagen-basedthree-dimensional culture. The two-dimensional experi-ments consisted of subjecting the cells to various mediumtypes that differed in both glucose and serum concentrations.The three-dimensional experiments subjected cells to twodifferent glucose concentrations and two collagen densities.The three-dimensional cultures were only subjected to varia-tion in glucose concentration as glucose appeared to have themost critical effect on cell growth, viability, and metabolicstate. The 5% serum concentration was chosen because ofits moderation between the 2% and 10% serum groups. Theresults highlight relative differences in the metabolic stateof MSCs when cultured within these differing conditions.Overall, the two most important factors in affecting thecell population were starting glucose concentrations and theaddition of a three-dimensional matrix.
This result could have important implications for stemcell therapies, as differences in metabolic state during culturemay affect the terminal differentiation of the MSCs. Humanadipose-derived stem cells have already shown evidence ofthis as their differentiation into osteogenic cells is altered bychanging their metabolic conditions [52]. As differentiationis a complex process undertaken by stem cells, it is reasonableto assume that achieving any specific terminal differentiation
is dependent upon a significant amount of energy use.Both aerobic metabolism and anaerobic cell metabolismproduce the energy that all cells depend upon to carry outphysiological processes. Furthermore, evidence has shownthat cells exhibit a preference for one metabolic state over theother for specific processes [50, 51].
Anaerobic glycolysis and the aerobic citric acid cycle arethe two primary means for cells to obtain energy. They can bedistinguished by the fate of the glucose consumed by the cells.In glycolysis, the glucose is converted to pyruvate, which isthen converted to lactate as a dead-end product. However, inthe citric acid cycle, the pyruvate produced at the conclusionof glycolysis enters into the citric acid cycle in the form ofacetyl coenzyme-A. The relative metabolic state—whetheraerobic or anaerobic—of a cell culture can be assessed aftermeasuring the glucose consumed and lactate produced; thehigher the amount of lactate, the more likely that the relativemetabolic state anaerobic.
These data elucidate the ability of growth mediumglucose and serum concentrations to alter the metabolic stateof the MSCs. It has already been shown that adipose-derivedstem cells from rabbits [53] and humans [52] increasetheir lactate production, proliferation, and viability whenexposed to higher glucose environments. The results of this
8 Stem Cells International
0.5 mM 25 mM0.5 mM
Three-dimensional viability after day 2
2.5
mg/
mL
5m
g/m
L
(a)
0.5 mM 25 mM0.5 mM
Three-dimensional viability after day 6
2.5
mg/
mL
5m
g/m
L
(b)
Figure 4: Fluorescence microscopy images indicating the viability of BMSCs in three-dimensional culture after the second and sixth days(increasing glucose concentrations from left to right; increasing collagen densities from top to bottom). Calcein-AM indicates living cells byemitting green light, while ethidium bromide indicates dead cells by emitting red light. After day 2, the 0.5 mM environment resulted in lowviability, while the 25.0 mM environment resulted in high viability. By day 6, the 0.5 mM environment and the 25.0 mM−2.5 mg/mL groupresulted in low viability, while the 25.0 mM−5.0 mg/mL group resulted in high viability and confluency. (40x objective; scale bar represents100 μm).
Stem Cells International 9
0
100
200
2% serum 5% serum 10% serum
Day 4
Pyr
uvat
epr
od.
(ng/
cell)
hf a
bab a
be
fgh
bfg
fg
0.5 mM glucose1 mM glucose
5 mM glucose25 mM glucose
(a)
0
100
200
2% serum 5% serum 10% serum
Day 6
Pyr
uvat
epr
od.
(ng/
cell)
h b a b hbf
0.5 mM glucose1 mM glucose
5 mM glucose25 mM glucose
(b)
Figure 5: Extracellular pyruvate production after the final two days of two-dimensional culture (n = 12 per group). The production datadoes not show a clear trend. (a: significantly different from corresponding value in the 5% group; b: significantly different from correspondingvalue in the 10% group; e: significantly different from all other values within same serum group; f: significantly different from 5.0 mM valuewithin same serum group; g: significantly different from 25.0 mM value within same serum group; h: significantly different from the 1.0 mMvalue within the same serum group; P = .05).
series of experiments correspond well with those outcomes.The metabolic ratios for the two-dimensional experimentsindicate that both the serum and glucose concentrationswithin the growth medium help to determine the cell’smetabolic state, with higher serum concentrations andhigher glucose concentrations leading to more anaerobiccultures. The lactate-to-pyruvate ratios indicate that glucosewas more influential than serum, as increases in the glucoseconcentration produced marked increases in the metabolicratio that were not replicated by increases in the serum con-centration. The ratios for the three-dimensional experimentsdid not show a clear trend across the last two days. Butoverall, the lactate-to-pyruvate ratios were much lower forthe three-dimensional cultures than for the two-dimensionalcultures, indicating that the three-dimensional cultures wereless anaerobic. While the results of the two dimensionalcultures were expected, the addition of a three dimensionalextracellular matrix had unexpected effects on the L/P andL/G ratios, suggesting that these effects must be investigatedin much more detail.
The setup of these experiments had several advantages.The primary advantage was the use of the same celltype for both two-and three-dimensional culture so asto avoid potential significant differences in metabolismbetween different cell types. This reality was highlightedby Sander and Nauman, as it was found that culturing ratastrocytes produced lower lactate-to-glucose ratios than bothporcine lamina cribrosa cells and porcine scleral fibroblastsafter one week of culture in environments with differentglucose and oxygen levels [54]. Additionally, in the case ofthe two-dimensional experiment, both glucose and serumconcentrations were varied simultaneously so that the effectsof both medium components could be isolated. The glucoseassay, with a resolution of 3.0 μM of D-glucose, the lactateassay, with a resolution of 0.22 mM of lactate, and thepyruvate assay, with a resolution of 0.011 mM, providedhigh sensitivity. In the future, studies of this nature will besupplemented with real-time imaging of NADH within livecells to estimate the location and intensity of the relativemetabolic activity within the cells.
These experiments also possessed a number of limita-tions. The purpose of the trypan blue diffusion experimentswas to investigate the possibility that the metabolites weretrapped within the collagen matrix, thus avoiding detectionby the assays. However, trypan blue—molecular weightof ∼960 g/mol—was able to seep approximately 1.0 mmthrough both the 2.5 mg/mL and 5.0 mg/mL collagen gelsin about fifteen minutes (data not shown). Therefore, it isreasonable to assume that glucose, lactate, and pyruvate—all with molecular weights of less than 200 g/mol—were ableto traverse the collagen matrix and be subject to detection.There are two other circumstances that indicate that thethickness of the gels did not prevent adequate transportof lactate out of the gels. The first is the recognition thatcalcein-AM—molecular weight ∼995 g/mol—did not haveany trouble diffusing into the gel within fifteen minutes inorder to take fluorescence images of the cells. The secondcomes from the result of the nutrient supply study by Hornerand Urban [55]. In this study, the researchers embeddednucleus cells within a 1% agarose matrix and monitoredthe cells’ viability as a function of their distance away fromthe nutrient supply within a diffusion chamber. Homer andUrban showed that the embedded cells were still viablewithin 5.0 mm of the nutrient supply. However, there isuncertainty as to the similarity of diffusive and mechanicalproperties between the 1% agarose gels and the collagen gelsof this study. Another disadvantage was that constriction ofthe collagen gels could not be prevented during the course ofthe week long experiments, with most of the gels constrictingto about 75% of their original size. This may especially bereflected in the cell viability images, in which higher celldeath is seen in the 2.5 mg/mL samples rather than the5.0 mg/mL samples by the time the experiment concluded.It is likely that the stiffer gels attenuated the degree ofconstriction, giving the cells better access to nutrient/wastetransport through the matrix during the course of the week.
The results of this series of experiments serve as a baselinecharacterization of MSCs in culture before being subjectedto either an extracellular matrix or a differentiation scheme,and they will be especially beneficial to the tissue engineering
10 Stem Cells International
field. While it is well documented that extracellular matriceshave significant effects on several cell types [56–59], theeffect of extracellular matrices on cell metabolism have yet tobe investigated. Because cell metabolism is altered in three-dimensional culture when compared to two-dimensionalculture, this could have significant implications on the useof extracellular matrices because cell metabolism affects allof cellular physiology. Therefore, a future study on the effectof cell metabolism on stem cell terminal differentiation isimperative. Additionally, it will be equally important toperform a study investigating differences in cell metabolismversus the type of extracellular matrix material used. Herein,we demonstrated that glucose is the dominant factor affect-ing cell metabolism, but FBS also modulates this effect, andthe long-term effects of culture conditions on phenotype andphenotypic potential must still be elucidated. It is anticipatedthat FBS availability may play a more important role indifferentiation, and it is possible that the protein contentof the FBS could play a role in coupling the metabolic anddifferentiation pathways.
While, there is always great risk associated with tran-sitioning from in vitro to in vivo studies because theenvironments are different in many ways, from practicaland ethical standpoints, it would be advantageous to havea means of investigating a set of experimental variables onan artificial tissue analogue prior to implementing the samevariables in an animal system; this intermediate step couldaccelerate research findings and prevent the unnecessarydeaths of the animals should the results from this in vitrotissue reveal dangerous effects that the two-dimensional casealone did not reveal. Consequently, this intermediate stepcould potentially decrease costs associated with in vitro-to-in vivo experimentation.
5. Conclusions
The results of this study indicate that the amount of glucoseprovided and the presence of an extracellular matrix doindeed affect the metabolic state and viability of cells inculture. Providing larger concentrations of glucose may bea way to push the cells toward the anaerobic state, all elsebeing equal. Additionally, the results demonstrated that thethree-dimensional culture of MSCs may have to take placewithin a relatively stiff matrix or a composite of collagenhydrogel and collagen fibers [60, 61] to prevent decreasesin cell viability, and further work is needed to elucidatethe effects of extracellular matrix on MSC metabolism.Diffusion results show that the overall transport properties oftwo high-density collagen gels were essentially the same, sothat differences in the results between experimental groupsin three-dimensional culture could not be attributed todifferences in transport properties. Further investigationis required to elucidate the effects of metabolic state onphenotype and phenotypic potential.
Acknowledgments
The authors would like to acknowledge the funding from theNational Science Foundation Graduate Research Fellowship
Program. They would also like to thank Dr. Sherry Voytik-Harbin in the Weldon School of Biomedical Engineering atPurdue University for her donation of the MSCs used in theseexperiments.
References
[1] A. D. Metcalfe and M. W. J. Ferguson, “Tissue engineering ofreplacement skin: the crossroads of biomaterials, wound heal-ing, embryonic development, stem cells and regeneration,”Journal of the Royal Society Interface, vol. 4, no. 14, pp. 413–417, 2007.
[2] A. D. Metcalfe and M. W. J. Ferguson, “Bioengineering skinusing mechanisms of regeneration and repair,” Biomaterials,vol. 28, no. 34, pp. 5100–5113, 2007.
[3] S. Llames, E. Garcıa, V. Garcıa et al., “Clinical results of anautologous engineered skin,” Cell and Tissue Banking, vol. 7,no. 1, pp. 47–53, 2006.
[4] F. Opitz, K. Schenke-Layland, T. U. Cohnert, and U. A. Stock,“Phenotypical plasticity of vascular smooth muscle cells—effect of in vitro and in vivo shear stress for tissue engineeringof blood vessels,” Tissue Engineering, vol. 13, no. 10, pp. 2505–2514, 2007.
[5] B. M. Leung and M. V. Sefton, “A modular tissue engineeringconstruct containing smooth muscle cells and endothelialcells,” Annals of Biomedical Engineering, vol. 35, no. 12, pp.2039–2049, 2007.
[6] J. Y. Liu, D. D. Swartz, H. F. Peng, S. F. Gugino, J. A. Russell, andS. T. Andreadis, “Functional tissue-engineered blood vesselsfrom bone marrow progenitor cells,” Cardiovascular Research,vol. 75, no. 3, pp. 618–628, 2007.
[7] G. E. Amiel, M. Komura, OZ. Shapira et al., “Engineeringof blood vessels from acellular collagen matrices coated withhuman endothelial cells,” Tissue Engineering, vol. 12, no. 8, pp.2355–2365, 2006.
[8] S. Heydarkhan-Hagvall, M. Esguerra, G. Helenius, R.Soderberg, B. R. Johansson, and B. Risberg, “Production ofextracellular matrix components in tissue-engineered bloodvessels,” Tissue Engineering, vol. 12, no. 4, pp. 831–842, 2006.
[9] A. N. Morritt, S. K. Bortolotto, R. J. Dilley et al., “Cardiactissue engineering in an in vivo vascularized chamber,”Circulation, vol. 115, no. 3, pp. 353–360, 2007.
[10] X. M. Guo, Y. S. Zhao, H. X. Chang et al., “Creation ofengineered cardiac tissue in vitro from mouse embryonic stemcells,” Circulation, vol. 113, no. 18, pp. 2229–2237, 2006.
[11] M. Radisic, H. Park, F. Chen et al., “Biomimetic approachto cardiac tissue engineering: oxygen carriers and channeledscaffolds,” Tissue Engineering, vol. 12, no. 8, pp. 2077–2091,2006.
[12] S. Heber, L. Denk, K. Hu, and W. W. Minuth, “Modulating thedevelopment of renal tubules growing in serum-free culturemedium at an artificial interstitium,” Tissue Engineering, vol.13, no. 2, pp. 281–292, 2007.
[13] W. W. Minuth, L. Denk, and K. Hu, “The role of polyesterinterstitium and aldosterone during structural development ofrenal tubules in serum-free medium,” Biomaterials, vol. 28, no.30, pp. 4418–4428, 2007.
[14] D. C. Chen, J. R. Avansino, V. G. Agopian et al., “Comparisonof polyester scaffolds for bioengineered intestinal mucosa,”Cells Tissues Organs, vol. 184, no. 3-4, pp. 154–165, 2007.
[15] Y. Nakase, A. Hagiwara, T. Nakamura et al., “Tissue engineer-ing of small intestinal tissue using collagen sponge scaffoldsseeded with smooth muscle cells,” Tissue Engineering, vol. 12,no. 2, pp. 403–412, 2006.
Stem Cells International 11
[16] F. Bolland, S. Korossis, S. P. Wilshaw et al., “Development andcharacterisation of a full-thickness acellular porcine bladdermatrix for tissue engineering,” Biomaterials, vol. 28, no. 6, pp.1061–1070, 2007.
[17] M. Pattison, T. J. Webster, J. Leslie, M. Kaefer, and K. M.Haberstroh, “Evaluating the in vitro and in vivo efficacyof nano-structured polymers for bladder tissue replacementapplications,” Macromolecular Bioscience, vol. 7, no. 5, pp.690–700, 2007.
[18] C. Danielsson, S. Ruault, A. Basset-Dardare, and P. Frey,“Modified collagen fleece, a scaffold for transplantation ofhuman bladder smooth muscle cells,” Biomaterials, vol. 27, no.7, pp. 1054–1060, 2006.
[19] M. S. Kim, Y. N. Shin, M. H. Cho et al., “Adhesion behavior ofhuman bone marrow stromal cells on differentially wettablepolymer surfaces,” Tissue Engineering, vol. 13, no. 8, pp. 2095–2103, 2007.
[20] E. H. Chung, M. Gilbert, A. S. Virdi, K. Sena, D. R. Sumner,and K. E. Healy, “Biomimetic artificial ECMs stimulate boneregeneration,” Journal of Biomedical Materials Research. Part A,vol. 79, no. 4, pp. 815–826, 2006.
[21] H. Wang, Y. Li, YI. Zuo, J. Li, S. Ma, and L. Cheng,“Biocompatibility and osteogenesis of biomimetic nano-hydroxyapatite/polyamide composite scaffolds for bone tissueengineering,” Biomaterials, vol. 28, no. 22, pp. 3338–3348,2007.
[22] D. A. Shimko, C. A. Burks, K. C. Dee, and E. A. Nauman,“Comparison of in vitro mineralization by murine embryonicand adult stem cells cultured in an osteogenic medium,” TissueEngineering, vol. 10, no. 9-10, pp. 1386–1398, 2004.
[23] S. Terai, I. Sakaida, N. Yamamoto et al., “An in vivo modelfor monitoring trans-differentiation of bone marrow cells intofunctional hepatocytes,” Journal of Biochemistry, vol. 134, no.4, pp. 551–558, 2003.
[24] X. Wang, H. Willenbring, Y. Akkari et al., “Cell fusion isthe principal source of bone-marrow-derived hepatocytes,”Nature, vol. 422, no. 6934, pp. 897–901, 2003.
[25] R. A. Faris, T. Konkin, and G. Halpert, “Liver stem cells: apotential source of hepatocytes for the treatment of humanliver disease,” Artificial Organs, vol. 25, no. 7, pp. 513–521,2001.
[26] M. R. Alison, R. Poulsom, R. Jeffery et al., “Celldifferentiation—hepatocytes from non-hepatic adult stemcells,” Nature, vol. 406, no. 6793, p. 257, 2000.
[27] N. D. Theise, M. Nimmakayalu, R. Gardner et al., “Liver frombone marrow in humans,” Hepatology, vol. 32, no. 1, pp. 11–16, 2000.
[28] S. Terai, T. Ishikawa, K. Omori et al., “Improved liver functionin patients with liver cirrhosis after autologous bone marrowcell infusion therapy,” Stem Cells, vol. 24, no. 10, pp. 2292–2298, 2006.
[29] J. C. Voltarelli, C. E. B. Couri, A. B. P. L. Stracieri etal., “Autologous nonmyeloablative hematopoietic stem celltransplantation in newly diagnosed type 1 diabetes mellitus,”Journal of the American Medical Association, vol. 297, no. 14,pp. 1568–1576, 2007.
[30] H. Miszta-Lane, M. Mirbolooki, A. M. James Shapiro, and J.R. T. Lakey, “Stem cell sources for clinical islet transplantationin type 1 diabetes: embryonic and adult stem cells,” MedicalHypotheses, vol. 67, no. 4, pp. 909–913, 2006.
[31] D. Hess, L. Li, M. Martin et al., “Bone marrow-derived stemcells initiate pancreatic regeneration,” Nature Biotechnology,vol. 21, no. 7, pp. 763–770, 2003.
[32] Y. Hori, I. C. Rulifson, B. C. Tsai, J. J. Heit, J. D. Cahoy,and S. K. Kim, “Growth inhibitors promote differentiationof insulin-producing tissue from embryonic stem cells,”Proceedings of the National Academy of Sciences of the UnitedStates of America, vol. 99, no. 25, pp. 16105–16110, 2002.
[33] N. Lumelsky, O. Blondel, P. Laeng, I. Velasco, R. Ravin, andR. McKay, “Differentiation of embryonic stem cells to insulin-secreting structures similar to pancreatic islets,” Science, vol.292, no. 5520, pp. 1389–1394, 2001.
[34] B. Soria, A. Skoudy, and F. Martin, “From stem cells tobeta cells: new strategies in cell therapy of diabetes mellitus,”Diabetologia, vol. 44, no. 4, pp. 407–415, 2001.
[35] K. Shimizu, A. Ito, T. Yoshida, Y. Yamada, M. Ueda, and H.Honda, “Bone tissue engineering with human mesenchymalstem cell sheets constructed using magnetite nanoparticlesand magnetic force,” Journal of Biomedical Materials Research.Part B, vol. 82, no. 2, pp. 471–480, 2007.
[36] H. Hattori, K. Masuoka, M. Sato et al., “Bone formation usinghuman adipose tissue-derived stromal cells and a biodegrad-able scaffold,” Journal of Biomedical Materials Research. Part B,vol. 76, no. 1, pp. 230–239, 2006.
[37] J. R. Mauney, V. Volloch, and D. L. Kaplan, “Role of adult mes-enchymal stem cells in bone tissue-engineering applications:current status and future prospects,” Tissue Engineering, vol.11, no. 5-6, pp. 787–802, 2005.
[38] D. Cızkova, J. Rosocha, I. Vanicky, S. Jergova, and M. Cızek,“Transplants of human mesenchymal stem cells improvefunctional recovery after spinal cord injury in the rat,” Cellularand Molecular Neurobiology, vol. 26, no. 7-8, pp. 1167–1180,2006.
[39] Y. B. Deng, Q. T. Yuan, X. G. Liu et al., “Functional recoveryafter rhesus monkey spinal cord injury by transplantationof bone marrow mesenchymal-stem cell-derived neurons,”Chinese Medical Journal, vol. 118, no. 18, pp. 1533–1541, 2005.
[40] K. H. Lee, H. Suh-Kim, J. S. Choi et al., “Human mesenchy-mal stem cell transplantation promotes functional recoveryfollowing acute spinal cord injury in rats,” Acta NeurobiologiaeExperimentalis, vol. 67, no. 1, pp. 13–22, 2007.
[41] J. Rohrbough, E. Rushton, E. Woodruff, T. Fergestad, K.Vigneswaran, and K. Broadie, “Presynaptic establishment ofthe synaptic cleft extracellular matrix is required for post-synaptic differentiation,” Genes and Development, vol. 21, no.20, pp. 2607–2628, 2007.
[42] C. Streuli, “Extracellular matrix remodelling and cellulardifferentiation,” Current Opinion in Cell Biology, vol. 11, no.5, pp. 634–640, 1999.
[43] J. A. Pedersen and M. A. Swartz, “Mechanobiology in the thirddimension,” Annals of Biomedical Engineering, vol. 33, no. 11,pp. 1469–1490, 2005.
[44] V. Terraciano, N. Hwang, L. Moroni et al., “Differentialresponse of adult and embryonic mesenchymal progenitorcells to mechanical compression in hydrogels,” Stem Cells, vol.25, no. 11, pp. 2730–2738, 2007.
[45] I. Titushkin and M. Cho, “Modulation of cellular mechanicsduring osteogenic differentiation of human mesenchymalstem cells,” Biophysical Journal, vol. 93, no. 10, pp. 3693–3702,2007.
[46] J. A. Pedersen, F. Boschetti, and M. A. Swartz, “Effects ofextracellular fiber architecture on cell membrane shear stressin a 3D fibrous matrix,” Journal of Biomechanics, vol. 40, no. 7,pp. 1484–1492, 2007.
[47] L. E. Freed, F. Guilak, X. E. Guo et al., “Advanced toolsfor tissue engineering: scaffolds, bioreactors, and signaling,”Tissue Engineering, vol. 12, no. 12, pp. 3285–3305, 2006.
12 Stem Cells International
[48] M. Schindler, A. Nur-E-Kamal, I. Ahmed et al., “Living inthree dimensions: 3D nanostructured environments for cellculture and regenerative medicine,” Cell Biochemistry andBiophysics, vol. 45, no. 2, pp. 215–227, 2006.
[49] L. J. Smith, J. S. Swaim, C. Yao et al., “Increased osteoblastcell density on nanostructured PLGA-coated nanostructuredtitanium for orthopedic applications,” International Journal ofNanomedicine, vol. 2, no. 3, pp. 493–499, 2007.
[50] E. Gatlik-Landwojtowicz, P. Aanismaa, and A. Seelig, “The rateof P-glycoprotein activation depends on the metabolic state ofthe cell,” Biochemistry, vol. 43, no. 46, pp. 14840–14851, 2004.
[51] H. D. Vishwasrao, A. A. Heikal, K. A. Kasischke, andW. W. Webb, “Conformational dependence of intracellularNADH on metabolic state revealed by associated fluorescenceanisotropy,” Journal of Biological Chemistry, vol. 280, no. 26,pp. 25119–25126, 2005.
[52] B. T. Mischen, K. E. Follmar, K. E. Moyer et al., “Metabolic andfunctional characterization of human adipose-derived stemcells in tissue engineering?” Plastic and Reconstructive Surgery,vol. 122, no. 3, pp. 725–738, 2008.
[53] K. E. Follmar, F. C. Decroos, H. L. Prichard, H. T. Wang,D. Erdmann, and K. C. Olbrich, “Effects of glutamine,glucose, and oxygen concentration on the metabolism andproliferation of rabbit adipose-derived stem cells,” TissueEngineering, vol. 12, no. 12, pp. 3525–3533, 2006.
[54] E. A. Sander and E. A. Nauman, “Effects of reduced oxygenand glucose levels on ocular cells in vitro: implications fortissue models,” Cells Tissues Organs, vol. 191, no. 2, pp. 141–151, 2010.
[55] H. A. Horner and J. P. G. Urban, “2001 Volvo award winner inbasic science studies: effect of nutrient supply on the viabilityof cells from the nucleus pulposus of the intervertebral disc,”Spine, vol. 26, no. 23, pp. 2543–2549, 2001.
[56] S. Han, J. D. Ritzenthaler, B. Wingerd, H. N. Rivera,and J. Roman, “Extracellular matrix fibronectin increasesprostaglandin E receptor subtype EP4 in lung carcinoma cellsthrough multiple signaling pathways: the role of AP-2,” Journalof Biological Chemistry, vol. 282, no. 11, pp. 7961–7972, 2007.
[57] I. A. Potapova, G. R. Gaudette, P. R. Brink et al., “Mes-enchymal stem cells support migration, extracellular matrixinvasion, proliferation, and survival of endothelial cells invitro,” Stem Cells, vol. 25, no. 7, pp. 1761–1768, 2007.
[58] C. Toral, M. E. Mendoza-Garrido, E. Azorın et al., “Effect ofextracellular matrix on adhesion, viability, actin cytoskeletonand K+ currents of cells expressing human ether a go-gochannels,” Life Sciences, vol. 81, no. 3, pp. 255–265, 2007.
[59] C. B. Khatiwala, S. R. Peyton, and A. J. Putnam, “Intrinsicmechanical properties of the extracellular matrix affect thebehavior of pre-osteoblastic MC3T3-E1 cells,” American Jour-nal of Physiology, vol. 290, no. 6, pp. C1640–C1650, 2006.
[60] E. Gentleman, E. A. Nauman, K. C. Dee, and G. A. Livesay,“Short collagen fibers provide control of contraction andpermeability in fibroblast-seeded collagen gels,” Tissue Engi-neering, vol. 10, no. 3-4, pp. 421–427, 2004.
[61] K. E. Lewus and E. A. Nauman, “In vitro characterizationof a bone marrow stem cell-seeded collagen gel compositefor soft tissue grafts: effects of fiber number and serumconcentration,” Tissue Engineering, vol. 11, no. 7-8, pp. 1015–1022, 2005.