Page 1
UNIVERSITY OF MISKOLC
FACULTY OF ECONOMICS
THESIS ANNOUNCEMENT
FULL NAME: Heena Kapoor
NEPTUN CODE: YL70T
TYPE OF PROGRAMME: MSc
NAME OF PROGRAMME: Master of Business Administration (English)
NAME OF SPECIALISATION: Economics
RESPONSIBLE DEPARTMENT OR INSTITUTE: Institute of Management Science
TITLE OF THESIS: Comparative Analysis On Budapest Stock Exchange And Bombay Stock
Exchange
ASSIGNMENT:
− Introducing the economy of India and Hungary
− Introducing the Stock exchanges of both countries Analysis of the financial ratio of
the company
− Analyzing the Value at Risk model using company stock prices
BASE ORGANISATION : Richter Gedeon Nyrt, Sun Pharma, OTP Bank, SBI, MOL and ONGC
INTERNAL CONSULTANT : Dr Zsombori Zsolt, Lecturer
EXTERNAL CONSULTANT (name, position):
DATE OF THESIS ANNOUNCEMENT:
Date: …………………
………………………………..
Head of Institute
Page 2
UNIVERSITY OF MISKOLC
FACULTY OF ECONOMICS
CONSULTATION SHEET
FULL NAME: HEENA KAPOOR
NEPTUN CODE: YL970T
TITLE OF THESIS: Comparative Analysis On Budapest Stock Exchange And Bombay Stock
Exchange
BASE ORGANISATION : Richter Gedeon Nyrt, Sun Pharma, OTP Bank, SBI, MOL and ONGC
INTERNAL CONSULTANT : Dr Zsombori Zsolt, Assistant Professor
EXTERNAL CONSULTANT (name, position):
DATES OF CONSULTATIONS:
Consultation date Signature of internal
consultant Consultation date
Signature of external
consultant
The thesis can be accepted:
Date: …………………
………………………………..
Internal Consultant
Date: …………………
………………………………..
External Consultant
Page 3
Declaration Of Originality
FULL NAME: HEENA KAPOOR
NEPTUN CODE: YL970T
TITLE OF THESIS: Comparative Analysis On Budapest Stock Exchange And Bombay Stock
Exchange
I, the undersigned, hereby declare under penalty and perjury that each part of my thesis (text,
figures, tables, etc.) – except the cited ones − is my own work and does not rely on other
documents including my previous theses.
I am aware of the fact that plagiarism consists of:
− direct quoting without indicating the reference;
− indirect quoting without indicating the reference;
− publishing others’ ideas as my own.
I, the undersigned, hereby declare that I am aware of the definition of plagiarism and I
understand that according to connecting regulations my thesis can be rejected and
disciplinary proceedings may be applied if plagiarism is proved.
I declare that the electronic (CD and uploaded) and hard copy of my thesis are identical in
form and content.
Date: …………………
………………………………..
Signature of Student
Page 4
STUDENT’S DECLARATION FORM
Student’s name: HEENA KAPOOR
Neptun code: YL970T
Faculty and programme: Faculty of Economics, Master of business administration
Year of thesis submission: 2019
Title of the thesis: Comparative analysis of Budapest stock exchange and Bombay stock
exchange
I request that my thesis be treated confidentially (requires an application for confidential
treatment). (Please underline as applicable.)
Yes No
I allow the university library to publish my thesis as full text on the Internet. (Please underline as applicable.)
Yes No
In full awareness of my liability I declare that the electronic version of my thesis is identical to the printed thesis I submitted.
Date: …………………….
…………………………………………..
Signature of student
Student’s current address: 2/A kiss Jozsef utca, Budapest, 1081 Hungary
E-mail: [email protected]
Phone number: +36702715667
Page 5
UNIVERSITY OF MISKOLC
FACULTY OF ECONOMICS
Comparative Analysis of Budapest Stock Exchange
and Bombay Stock Exchange
Heena Kapoor
2019
Page 6
Abstract
Stock market is a vital part of every economy. Rise and fall in economy are reflected by the
stock market. Bullish stock market is the sign of developing industrial sector and growing
economy of the country. This thesis involves the analysis of Budapest stock exchange and
Bombay stock exchange, and in order to further understand the associated risk, a comparison
was made between them using two statistical techniques. The Oil, Banking and
Pharmaceutical industries forms the backbone of nation’s economy. Thus, the analysis was
conducted on the prominent companies in Oil, Banking and Pharmaceutical industries of
both the stock exchanges. The VaR analysis was performed on the portfolio to analyse the
risk associated with market. The evaluation of companies operating, and financial
performance was conducted using ratio analysis technique.
Financial results have become an important indicator for business valuation. The Average
Price Return have the significant influence on the Ratios represents the aggregate value of a
company or stock. The purpose of this study is to analyse the relationship between the
Financial Ratio and the Average Price Return of the chosen companies from the two Stock
Exchanges. The price of company’s stock is a significant factor and should be kept in mind
while making investment as it shows the value of a company. We took 3 companies from 3
important sector of economy- Banking, Pharmaceuticals and Oil.
Page 7
Table of Contents
1. Introduction ................................................................................................................... 1
2. Objectives ...................................................................................................................... 5
3. Limitations of the study ................................................................................................. 6
4. Hypotheses .................................................................................................................... 7
5. Methodology .................................................................................................................. 8
1. Value at Risk ....................................................................................................... 8
2. Benchmark model ....................................................................................................... 8
3. Excel ........................................................................................................................... 8
6. Literature Review .......................................................................................................... 9
7. Theoretical Background .............................................................................................. 12
7.1 Hungarian Economy .............................................................................................. 12
7.2 Indian Economy ......................................................................................................... 14
7.3 Stock Exchange ..................................................................................................... 16
7.3.1 Budapest Stock Exchange ...................................................................................... 17
7.3.2 Bombay Stock Exchange ........................................................................................ 20
7.3.3 Listed Domestic Companies ................................................................................... 22
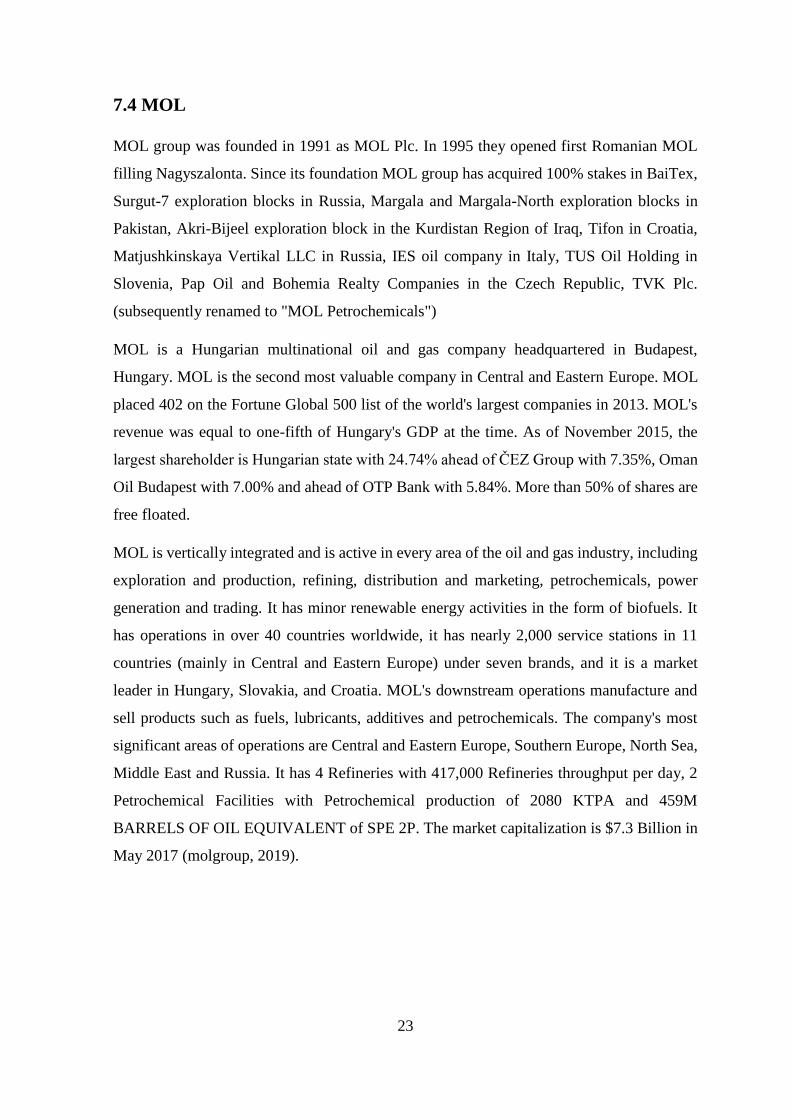
7.4 MOL .......................................................................................................................... 23
7.5 Oil and Natural Gas Corporation Ltd ........................................................................ 24
7.6 OTP BANK ............................................................................................................... 25
7.7 State Bank of India .................................................................................................... 26
7.8 Richter Gedeon Nyrt ............................................................................................. 27
7.9 Sun Pharmaceuticals .................................................................................................. 28
7.10 Investment Risk Management ................................................................................. 29
7.11 VAR MODEL ................................................................................................... 30
7.12 Ratio .................................................................................................................. 33
7.13 T-Test in Ms-Excel............................................................................................ 36
8 Quantitative Analysis ................................................................................................... 37
8.1.1 OTP ......................................................................................................................... 37
Ratio Analysis ............................................................................................................. 37
T-TEST ........................................................................................................................ 37
8.1.2 Richter Gedeon Nyrt ............................................................................................... 39
RATIO ANALYSIS .................................................................................................... 39
T-TEST ........................................................................................................................ 39
Page 8
8.1.3 MOL ....................................................................................................................... 41
RATIO ANALYSIS .................................................................................................... 41
T-TEST ........................................................................................................................ 41
8.1.4 SBI .......................................................................................................................... 43
RATIO ANALYSIS .................................................................................................... 43
T-TEST ........................................................................................................................ 43
8.1.5 Sun Pharma ....................................................................................................... 45
RATIO ANALYSIS .................................................................................................... 45
T-TEST ........................................................................................................................ 45
8.1.6 ONGC ..................................................................................................................... 47
RATIO ANALYSIS .................................................................................................... 47
T-TEST ........................................................................................................................ 47
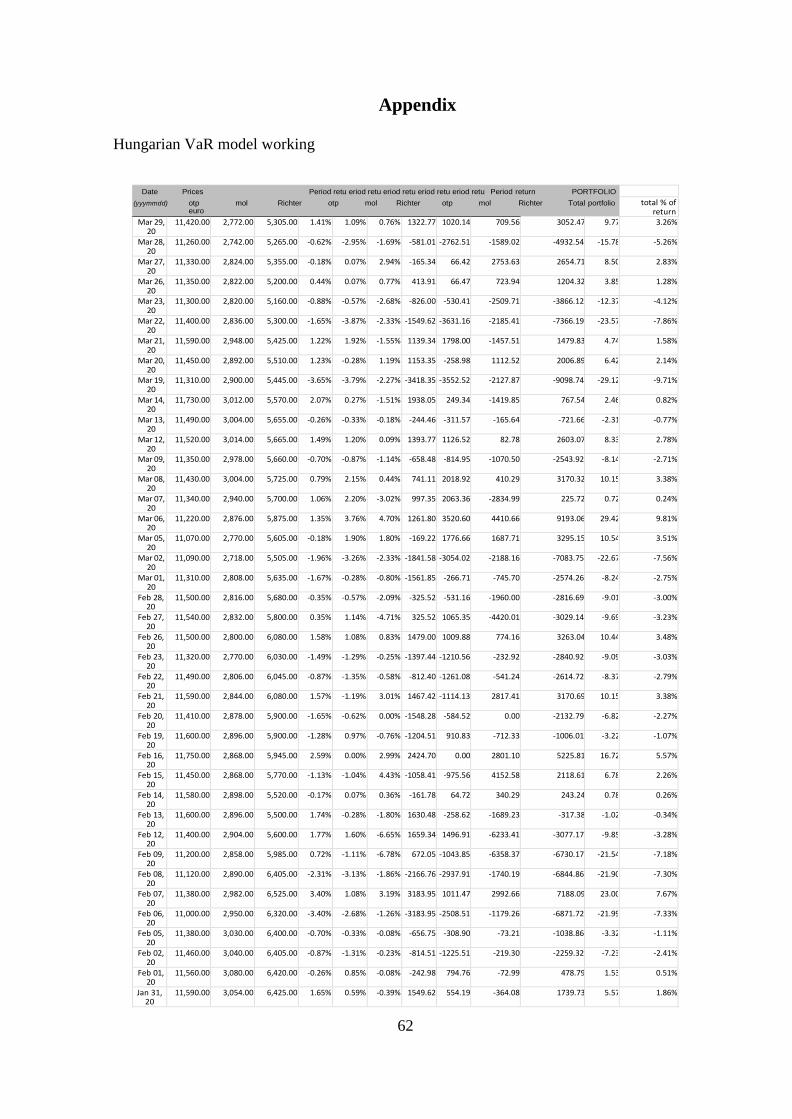
8.2.1 HUNGARIAN COMPANIES’ PORTFOLIO .................................................. 49
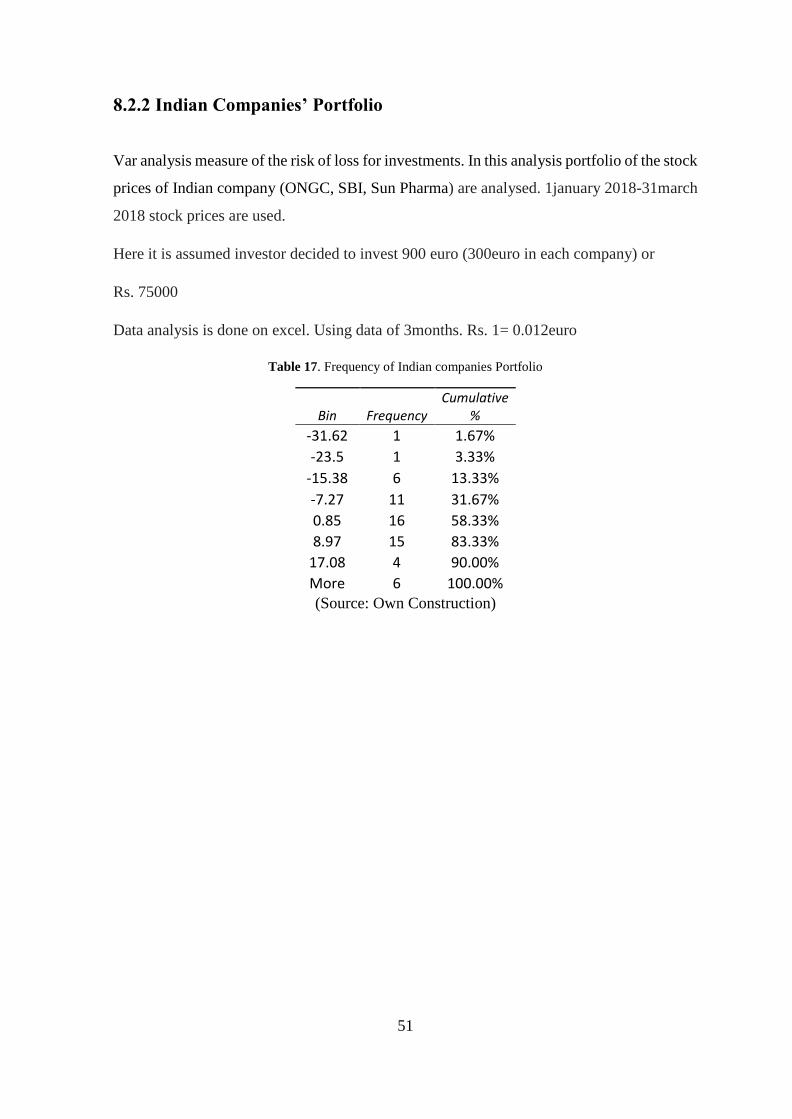
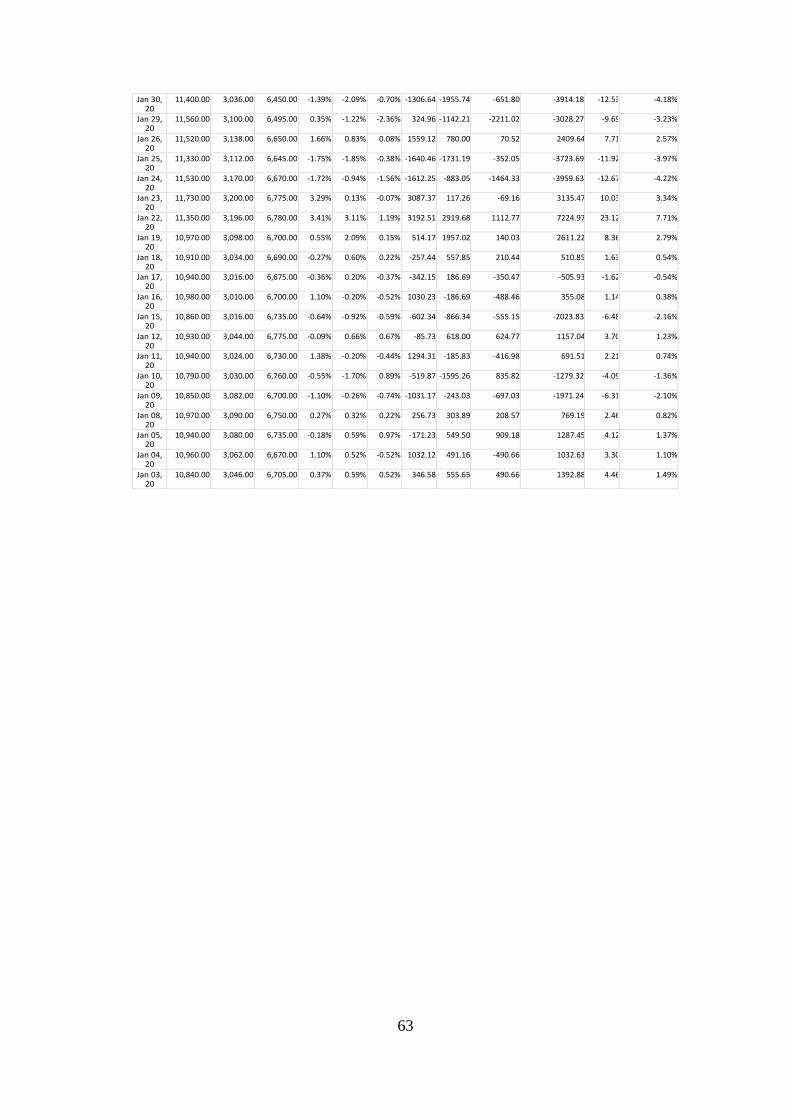
8.2.2 Indian Companies’ Portfolio .................................................................................. 51
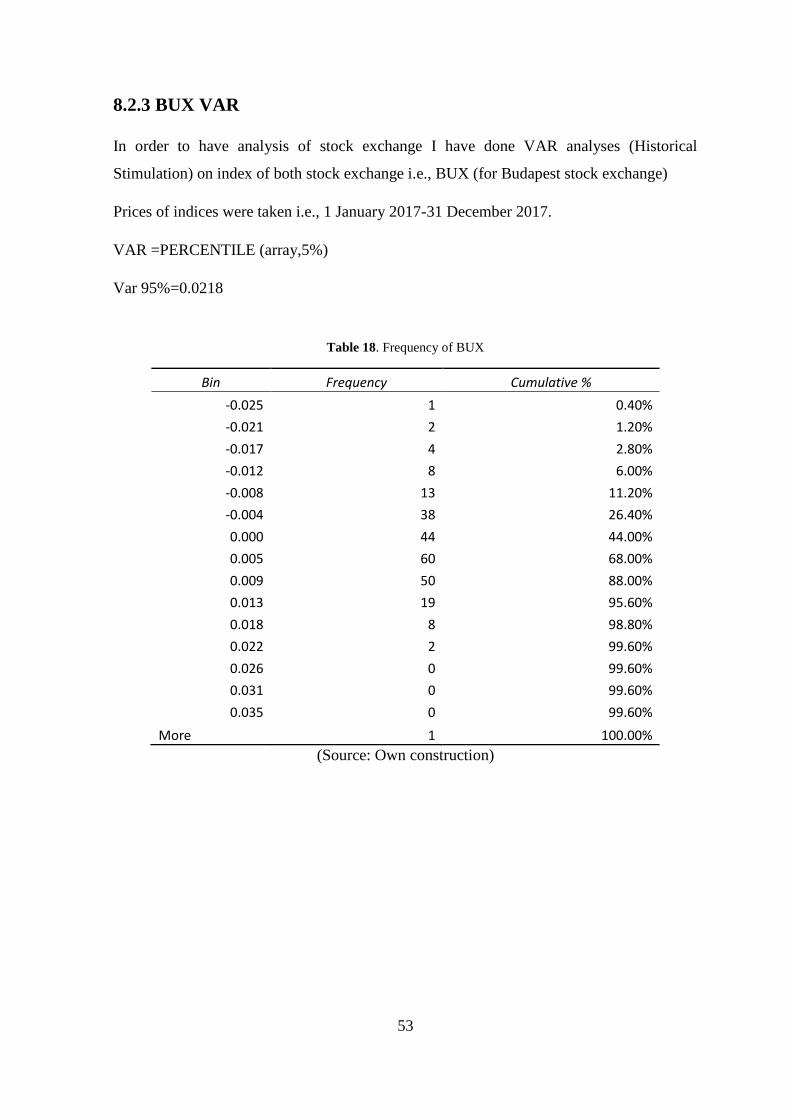
8.2.3 BUX VAR .............................................................................................................. 53
8.2.4 SENSEX VAR ........................................................................................................ 55
9. Conclusion ....................................................................................................................... 57
References ........................................................................................................................... 59
Appendix ............................................................................................................................. 62
Page 9
List of Figures
Figure 1. Listed domestic companies in India .................................................................... 22
Figure 2. Listed domestic companies in Hungary .............................................................. 22
Figure 3. Probability density versus portfolio value with 90% confidence in portfolio ..... 30
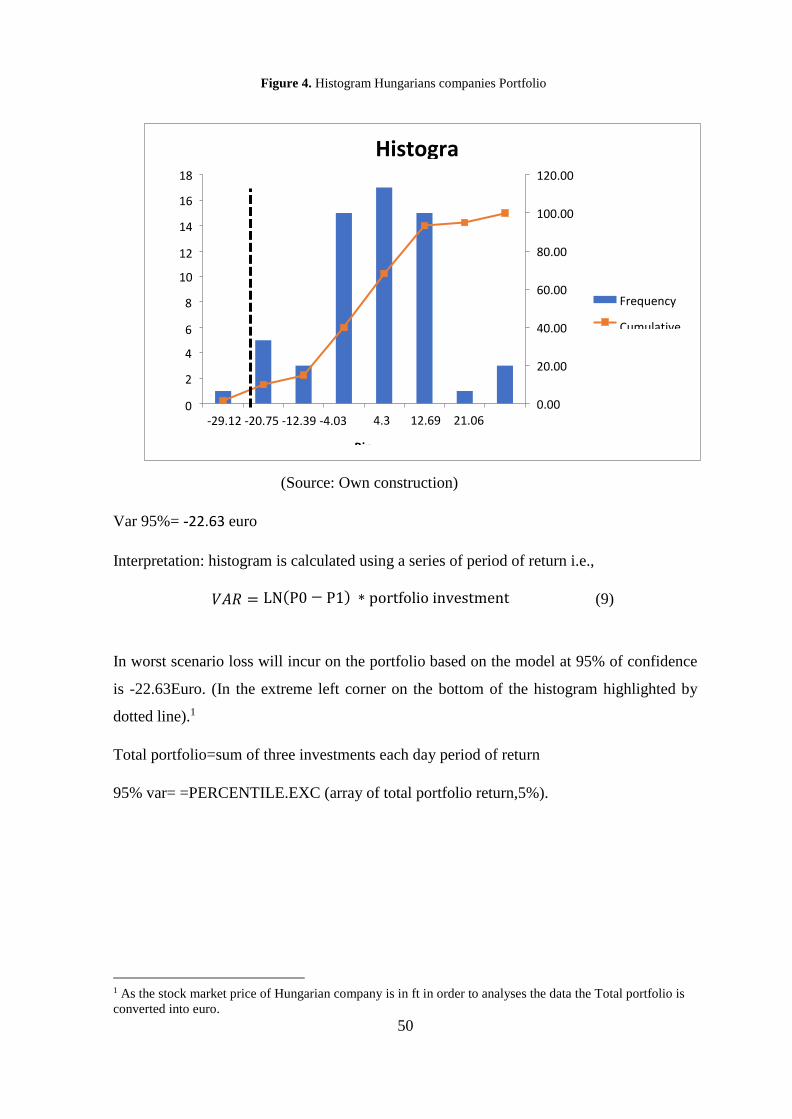
Figure 4. Histogram Hungarians companies Portfolio ...................................................... 50
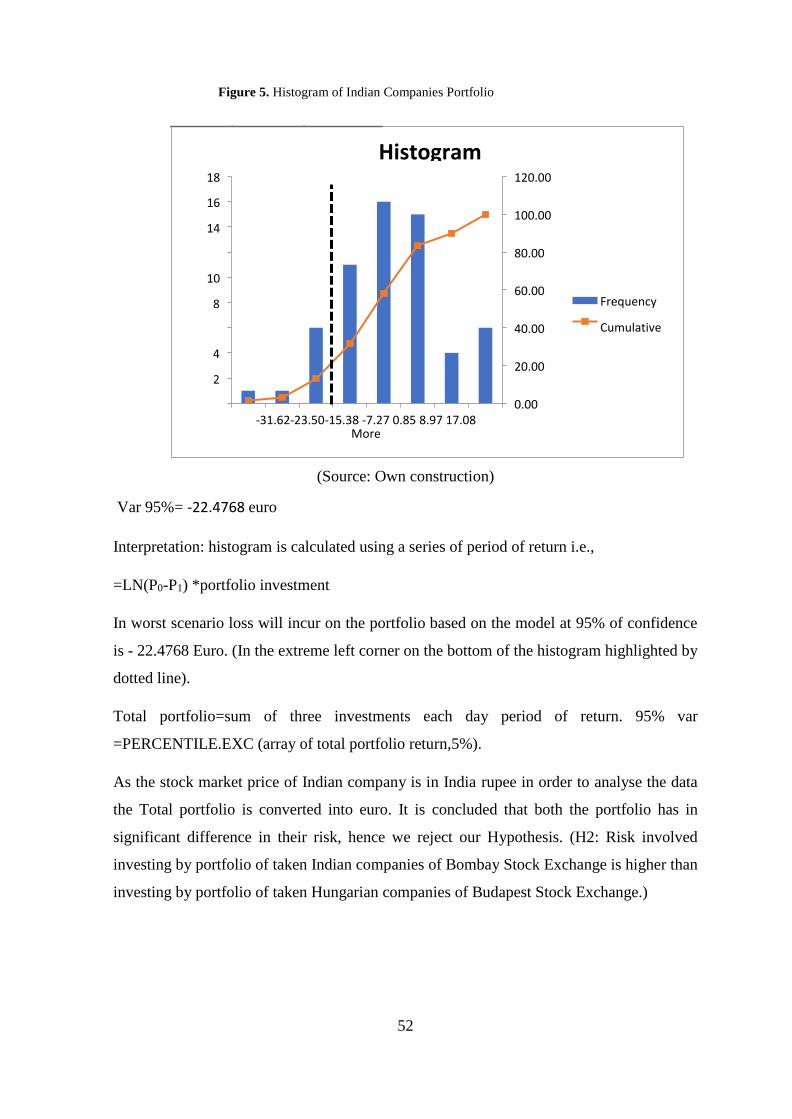
Figure 5. Histogram of Indian Companies Portfolio .......................................................... 52
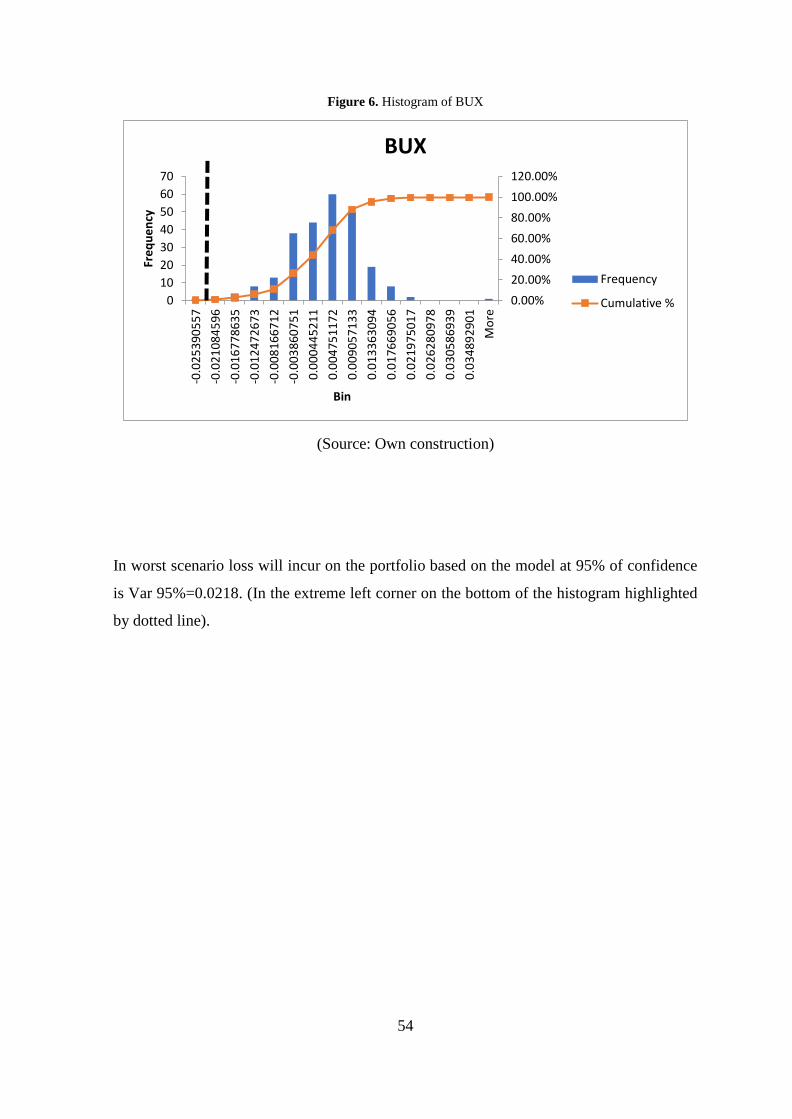
Figure 6. Histogram of BUX ............................................................................................... 54
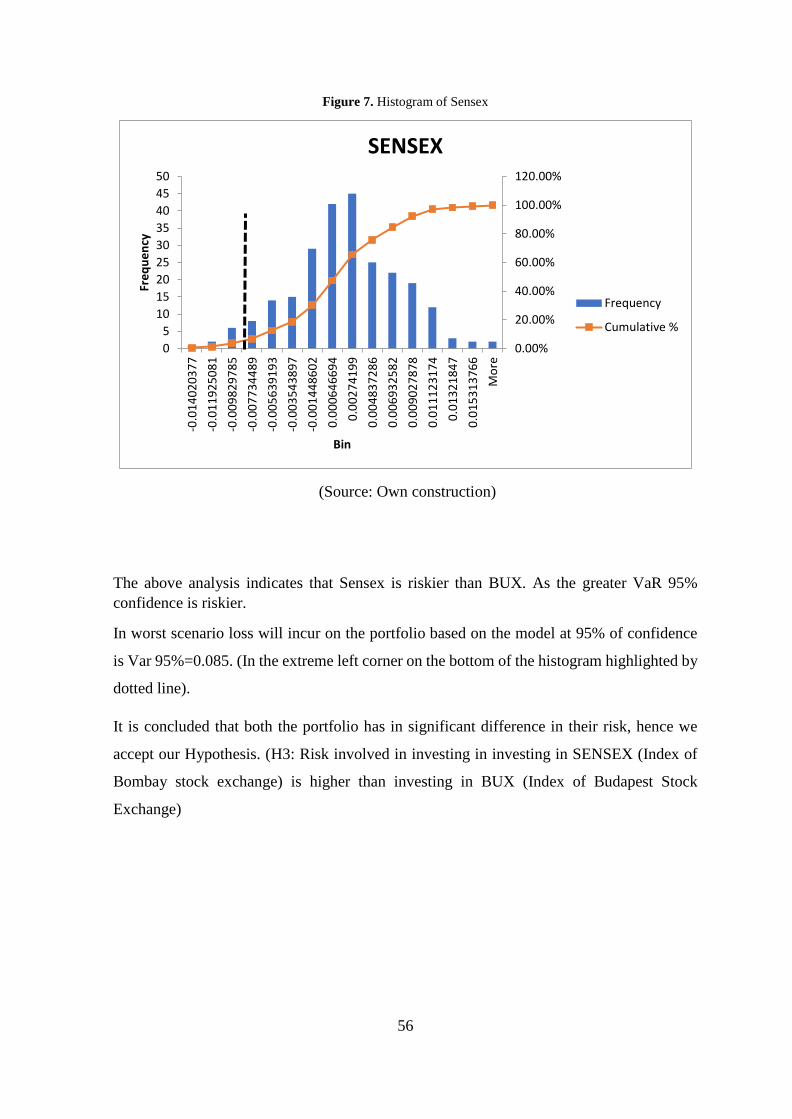
Figure 7. Histogram of Sensex ............................................................................................ 56
Page 10
List of Tables
Table 1. Selected companies from each industry of Hungary and India .............................. 3
Table 2. The list of requirements for Initial public Issue .................................................... 17
Table 3. Payment of listing fee ............................................................................................ 21
Table 4. OTP Ratio analysis ............................................................................................... 37
Table 5. OTP T-Test ............................................................................................................ 37
Table 6. Richter Gedeon Nyrt Ratio analysis ...................................................................... 39
Table 7. Richter Gedeon Nyrt T-Test .................................................................................. 39
Table 8. MOL Ratio analysis ............................................................................................... 41
Table 9. MOL T-Test ........................................................................................................... 41
Table 10. SBI Ratio analysis ............................................................................................... 43
Table 11. SBI T-Test ............................................................................................................ 43
Table 12. Sun Pharma Ratio analysis ................................................................................. 45
Table 13. Sun Pharma T-Test .............................................................................................. 45
Table 14. ONGC Ratio analysis .......................................................................................... 47
Table 15. ONGC T-Test ...................................................................................................... 47
Table 16. Frequency of Hungarians companies Portfolio .................................................. 49
Table 17. Frequency of Indian companies Portfolio ........................................................... 51
Table 18. Frequency of BUX ............................................................................................... 53
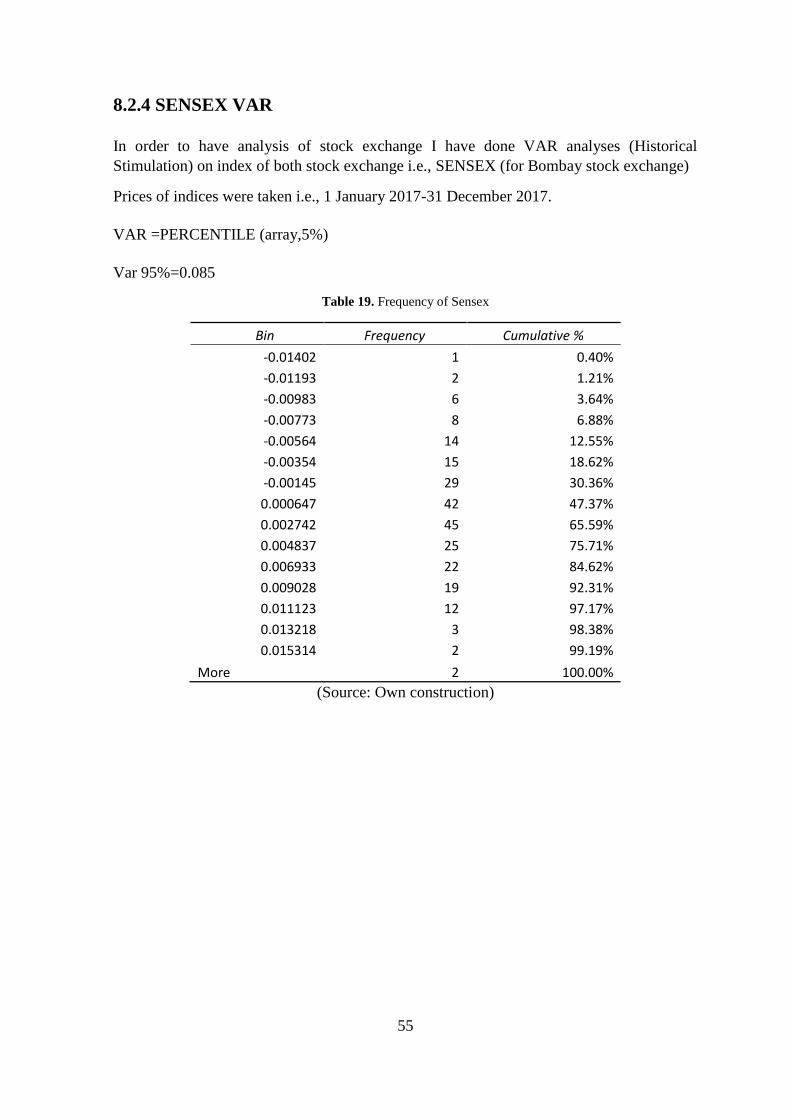
Table 19. Frequency of Sensex ............................................................................................ 55
Page 11
1
1. Introduction
Stock Market is a key indicator of the financial strength of the country’s economy. It is a
marketplace where different types of securities are being freely traded between the traders
or investors. Stock Exchange provides a great platform for purchasing and selling
securities, debt and derivatives with easy liquidity option. Nowadays, the stock market
has become very intense and is increasingly gaining importance in the economic growth
of a country.
It is not only important for the country’s economic growth but also the main sources of
finance for all the companies and allows them to publicly trade their shares or raise capital
or additional capital in case of expansion by selling shares of the company in an open
market. For some companies (especially the large companies) it is a more flexible way to
raise capital than borrowing from Banks. Stock Market is a reflector of the economic
condition of a country’s economy, if an economy is growing then the production of
outputs are increasing which increase the sale and profit of the companies which in turn
increases the tax paid by them to the government and also shoots up the GDP percentage.
Higher profit will also attract new investors in the market as investors are getting a high
interest in the shares. But it can also work in reversing way also, loss or less profit may
affect the share prices and can cause create disturbance in the stock market which can
create disturbance in the economic condition of the company. It helps in mobilizing the
resources in the economy.
Companies have to get listed on the stock market and sell their shares. This enables them
to gain finance to invest. In a free-market economy, stock market plays an important role
because it provides an easy access to the capital in exchange of giving up a certain
percentage of ownership. It acts as a bridge between the person who needs money and
have a new idea (Company) and those who have surplus money and want to invest and
earn interest (investors). It provides a platform for investors to grow their small amount
of money into large, without taking the risk of starting a business by themselves or leaving
their career to earn some extra money. Stock market gives a good interest on investment
if we compare with the returns given by the banks but the investment involves a certain
level of risk associated with it. Most of the countries have more than one major stock
exchanges. Example New York Stock Exchange (NYSE), National Association of
Securities Dealers Automated Quotations NASDAQ of America. National Stock
Page 12
2
Exchange of India and Bombay stock exchange of India. The stock market is an example
of perfect competition market as it provides all the information is readily available to the
investor and prospective investor as most countries promote transparency when it comes
to the stock market as it is the one the main component for an economy the stock exchange
of countries is free from control of the government. But have to work according to rules
and regulations of that countries. Each country has its own set of laws that help in smooth
functioning of the stock exchange and provide protection to the investors. Due to an
increase e of a number of scams in the stock market, it is important to have some
regulatory bodies in order to stabilize the confidence of the investors. In order to avoid
scams and attract investors Government of each country came up with their rules and law
which help in governing the stock market easily. These laws are made to have a more
transparent view of stock exchange.
With the globalization, accessing the international market became easier. Now not only
local investors have their investment in the market but also the international traders are
involved. International traders are mostly interested in investing the developing Economy
as it provides a great return on their investments. Globalization affected all spheres- stock
market was also one among them. It gave rise to the integration of financial market.
Globalization had made foreign investment in stock market much easier. Because of
transparency in this business, the investment in stocks are not limited to the local market,
many investors are investing in different countries stock by Global depository receipt etc.
In the market there are numerous of company listed on exchanges. In order to determine
the size of the company analysing the share prices are not enough, Market Capitalization
is the one of the common techniques to determine the size. In recent years Market
capitalization have become an important indicator in order to evaluate the companies in
the stock market. Market capitalization is the total dollar value of all outstanding shares
of a company. It is calculated by multiplying the current share price by the number of
outstanding shares. Outstanding Shares are all the shares which are currently owned by
stockholders, company officials, and investors in the public domain. Usually analyst use
the figure to determine the size and the position of the company. Since it is calculated
with the help of share price which is not stable so, the market capitalization can also
fluctuate on daily basis.
Page 13
3
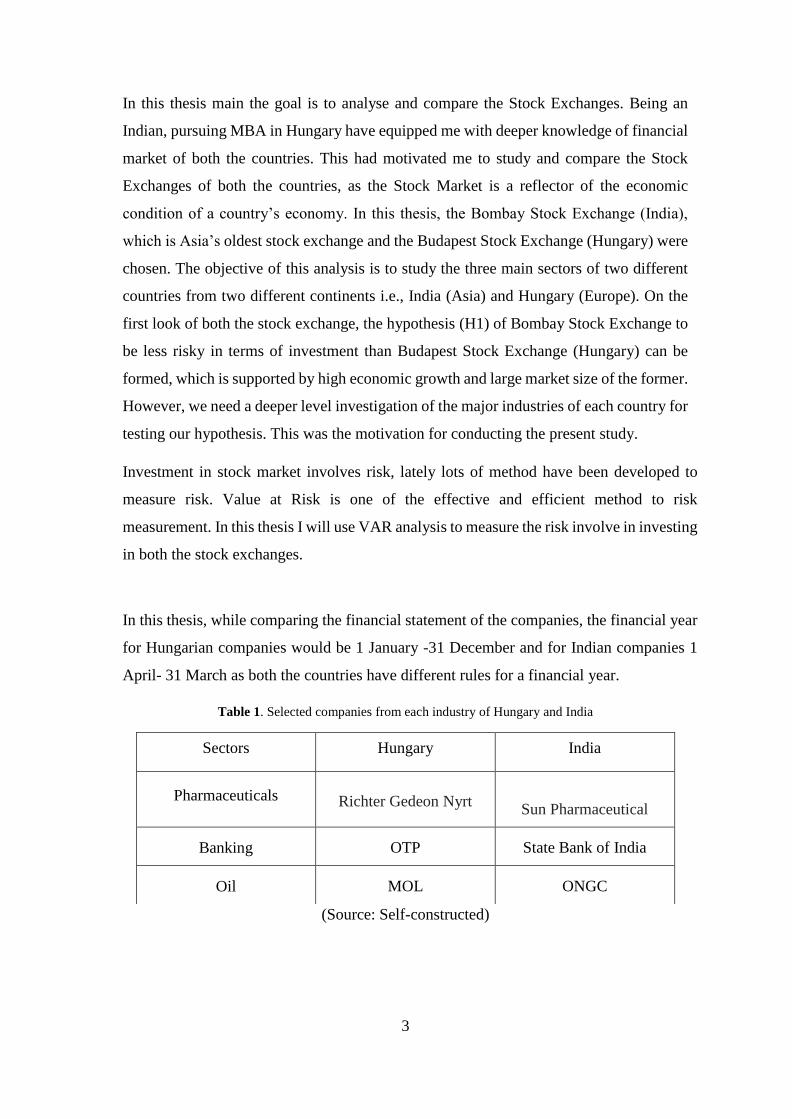
In this thesis main the goal is to analyse and compare the Stock Exchanges. Being an
Indian, pursuing MBA in Hungary have equipped me with deeper knowledge of financial
market of both the countries. This had motivated me to study and compare the Stock
Exchanges of both the countries, as the Stock Market is a reflector of the economic
condition of a country’s economy. In this thesis, the Bombay Stock Exchange (India),
which is Asia’s oldest stock exchange and the Budapest Stock Exchange (Hungary) were
chosen. The objective of this analysis is to study the three main sectors of two different
countries from two different continents i.e., India (Asia) and Hungary (Europe). On the
first look of both the stock exchange, the hypothesis (H1) of Bombay Stock Exchange to
be less risky in terms of investment than Budapest Stock Exchange (Hungary) can be
formed, which is supported by high economic growth and large market size of the former.
However, we need a deeper level investigation of the major industries of each country for
testing our hypothesis. This was the motivation for conducting the present study.
Investment in stock market involves risk, lately lots of method have been developed to
measure risk. Value at Risk is one of the effective and efficient method to risk
measurement. In this thesis I will use VAR analysis to measure the risk involve in investing
in both the stock exchanges.
In this thesis, while comparing the financial statement of the companies, the financial year
for Hungarian companies would be 1 January -31 December and for Indian companies 1
April- 31 March as both the countries have different rules for a financial year.
Table 1. Selected companies from each industry of Hungary and India
(Source: Self-constructed)
Sectors Hungary India
Pharmaceuticals Richter Gedeon Nyrt
Sun Pharmaceutical
Banking OTP State Bank of India
Oil MOL ONGC
Page 14
4
Pharmaceuticals, Banking and Oil Company are the main sectors of both the countries. The
choose companies are one of the leading players in the economy and have a good financial
position which is been proved by bench mark analysis.
In this thesis I will try to formulate the relationship between chosen firm’s financial
performance, market price and risk involved in investing. Due to globalization accessing to
worldwide market became easy, now investors have lots of option to invest not in local
market but also in different countries. To make correct decision in-depth analysis is
important. In this thesis I took two developing countries situated in different continents (Asia
and Europe). I will analyse the historical price movement of the selected companies and
stock exchange with their financial performance.
Page 15
5
2. Objectives
• To have a comparative analysis of both stock exchanges
• To study the fluctuations in share prices of selected companies
• Effect of the stock exchange on the economy of both Countries.
• Analysis of financial position of the company using ratio analysis and the risk involves
the stocks of taken companies with the help of a model.
• To understand the correlation between the stock prices and financial performances.
• To find out investing in which country is more risker and profitable by using historical
data and analysing it.
Page 16
6
3. Limitations of the study
• The topic has a broad nature which is a limitation.
• The study is based only on secondary data.
• Time is a major constraint for a detailed study.
• Two countries follow different financial years.
Page 17
7
4. Hypotheses
➢ H1: There is significant relationship between taken companies financial ratios and
their stock market price.
➢ H2: Risk involved investing by portfolio of taken Indian companies of Bombay
Stock Exchange is higher than investing by portfolio of taken Hungarian companies
of Budapest Stock Exchange.
➢ H3: Risk involved in investing in investing in SENSEX (Index of Bombay stock
exchange) is higher than investing in BUX (Index of Budapest Stock Exchange).
Page 18
8
5. Methodology
To have an in-depth study of both the countries, I have chosen 3 companies from each
country. In this thesis two methods are being used:
1. Value at Risk - As share market is uncertain and VAR model is one of the models
which help in calculating the risk. In this thesis, I have compared the risk involved
in the shares of the chosen company.
2. Benchmark model - Financial position of the company has a strong influence on
the stock prices of the company. In order to have some pictures of the company’s
financial statements in this thesis I have done ratio analysis and compare the ratios
with the benchmark ratios.
3. Excel - (Software) Data is analyse using statistical formulas and processed to get
the results.
Page 19
9
6. Literature Review
The stock exchange has become a major source of earning and it is a market which is
difficult to predict. Many studies are done on the stock market. With the globalization of
capital markets, stock exchanges around the world have faced their most challenging era
since 2005. While the traditional role of the stock exchange should evolve by enforcing
competitive advantage, as the heart of modern capital markets, stock exchanges give rise
to both capital demand outflows and capital supply inflows, and both must be taken into
consideration. Since 2005, the competition among the world's stock exchanges has rapidly
increased. To secure their competitive positions, the traditional role of the stock exchange
needs to change quickly through the enforcement of competitive advantage. (Lo, 2013)
According to a researcher, there is a link between economic variables with growth are
extremely significant. These indicators are either quantitative or qualitative. The active-
features are stock market size in terms of market capitalisation ratio, having positive
significance correlated with real per capita GDP, market liquidity and activity in terms of
value traded, turnover, and further having a positive sign with growth, namely that market
volatility has negatively and insignificantly correlated with real per capita GDP growth.
(Masoud, 2003) Stock market volatility modelling and estimation have established certain
issues of great interest not only for investors, financial practitioners and academics,
especially in terms of modern finance perspectives. Moreover, one of the main aims of the
investment process is to reduce the high exposure to risk considering the fact that
international portfolio diversification provides superior risk-adjusted returns. (Ramona
Birăua, 2015).
The study of (Prasad, 2015) focused on the effect of profitability and market value ratios
on market. In this study 23 listed infrastructural companies of CNX infrastructure Index
has been taken for analysis. The main finding is market capitalization and firm performance
that the influence of various variables such as return on equity (ROE), P/E ratio, return on
asset (ROA), profitability etc. over market capitalization has been undertaking
independently.
This study of (Dr. Mohammad Abdelkarim Yousef Almumani, April 2018) aims to
investigate the effect of profitability ratios and market value ratios on the market
capitalization for Jordanian listed commercial banks. In this study data of 2010-2016 was
used from the Amman stock exchange archives. Thus, the study draws out a relationship
Page 20
10
of market capitalization with five other variables namely ROE, ROA, EPS, PER and DPR.
The finding of study is that return on equity and dividend pay-out ratio are the major
determinants of market capitalization of the listed commercial banks in Jordan.
The study of (MacKenzie, 2015)focus on the risk indices are used to communicate risks to
the public, understand how risk is changing over time, compare among different risks, and
support decision making. This paper focus on the importance of describing risk with a
probability distribution, developing a numerical risk measure that summarizes the
probability distribution, and finally translating the risk measure to an index.
The study of (Li*, 2015) focus on VaR model is mainly suitable for measuring market risk,
and not a measure of credit risk. It is because of existing financial risk measure is not perfect,
it is worth our financial institutions to learn it and study it. The study emphasis on studied
theories, methods and technical standards of China's financial risk management, in order to
enhance the competitiveness level of our financial institutions.
The study (Vinay Kaura) focused on historical prices to create future scenarios one can
determine the “Value-At Risk” of a specified portfolio using back testing, this report
demonstrates how the developed model would have, hypothetically, been able to make
profits of up to 40% over the course of the past year while the FTSE 100 benchmark rose by
only 27%.
According to Mussalam earnings yield ratio, and dividend yield ratio enhance market stock
returns while other ratios do not effect on market stock returns in Qatar. (MUSALLAM,
2018)
In study market-to-book ratio, dividend yield and firm size have significant positive
relationship with stock returns, while price-to-sales ratio and earnings per share are
insignificant and negative relationship with the stock returns. (LAI Ping-fu (Brian), 2016)
According the study there are relationships between the financial ratios which is valuable
information to the stock investors. (Meri, Kamışlı', & Temizel, November 2017)
The article emphasizes that the market fluctuations relations to the prices, due to price
movements it is difficult to observe the pattern, it is observed that the financial position and
performance of the firms are in correlation with present market prices. (GAUTAMI &
KALYAN, 2018)
Page 21
11
The researcher did an analysis on a sample of 46 firms to show the value relevance of the
financial ratios and their usefulness in security valuation in Egypt. They used three models
to test for linear and non-linear relationships and Concluded that ROE seems to play a
significant role in investment decisions in the Egyptian market (Omran & Ragab, 2004)
Page 22
12
7. Theoretical Background
7.1 Hungarian Economy
Hungary is one of the Central and Eastern European countries. The total land area is 90,530
Km2 with approx. 10 million population. Despite being in European Union Hungarian
government have retained its own Currency which Hungarian forint (HUF). Average market
value of 1 Euro=310 ft
Hungary became member of European Union in since 1 May 2004.
Hungary is the democratic country. From 2016 Hungary becomes an attractive country for
tourism and employment. Hungarian Government decided to adopt Privatization policy in
1990 because of Hungarian foreign debt got so much increased that the government decide
to sell some part of state property instead of being in debt. During the early nineties, century
lot of government decided to take this step. External Debt in Hungary increased to 105322.07
EUR Million in the second quarter of 2018 from 103657.39 EUR Million in the first quarter
of 2018 (Economics .T, 2019)
In 20th century The Hungarian economy have been open to the world for trade. Hungarian
economy went through a deep transformational and structural crisis during the transition,
and it resulted in a modern national economy, ready for the
Integration into the European Union. This came together with mainly necessary sacrifices
that the society, the majority of the people had to suffer, but in the same time these sacrifices
created the long-run conditions for catching up. Among others the catching up.
The volume of gross domestic product was 4.2% higher in Hungary in the 1st quarter of
2017 than in the corresponding period of the previous year. The primary contributors to the
growth were market-based services and industry. (ksh, 2019)
After privatization lot of new companies came into the market which gave a boost to the
economy and increases competition. In 1994 government decided to enter join European
Union. European Union main motto is to ensure free movement of people and trade. It helps
the Hungarian market to import goods and technology from other EU member countries
easily, moreover, the union also provide economic support to Hungarian
In 2004 Hungary became the tenth country to join the union.
Hungary was one of those countries which was affected by the 2008 global crises -6.4% was
the recession which affected the economy and it took a lot of time to recover from this loss.
Page 23
13
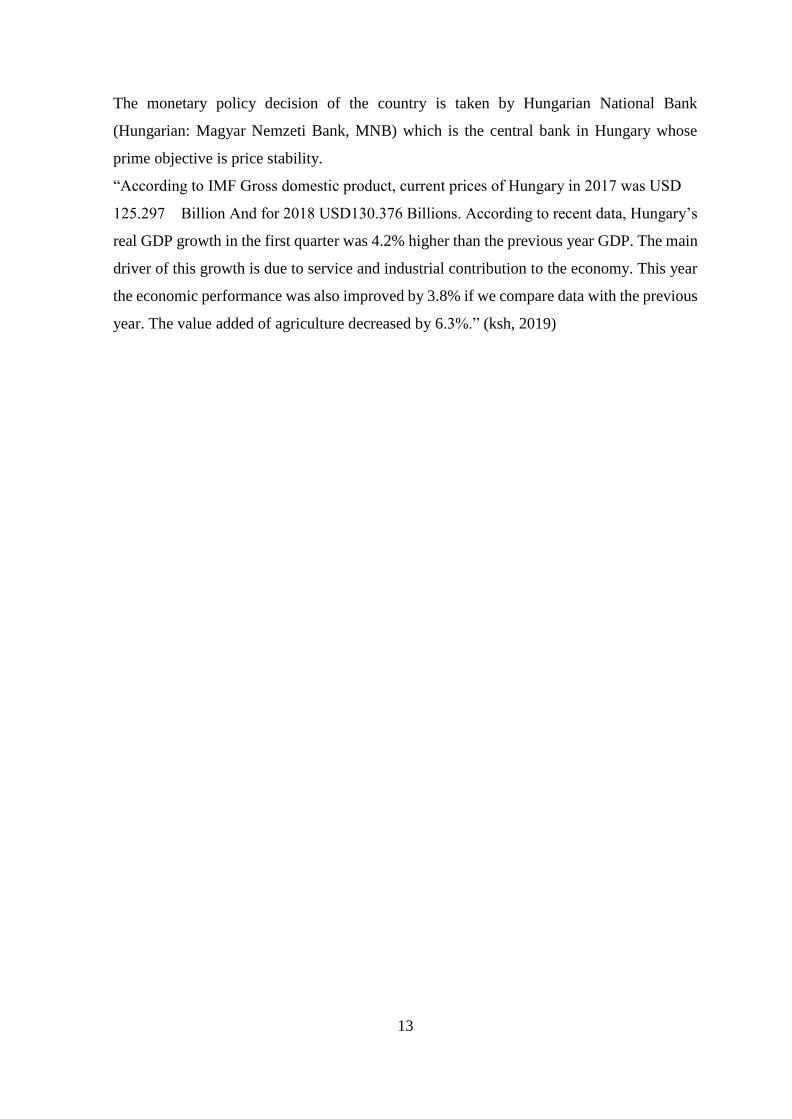
The monetary policy decision of the country is taken by Hungarian National Bank
(Hungarian: Magyar Nemzeti Bank, MNB) which is the central bank in Hungary whose
prime objective is price stability.
“According to IMF Gross domestic product, current prices of Hungary in 2017 was USD
125.297 Billion And for 2018 USD130.376 Billions. According to recent data, Hungary’s
real GDP growth in the first quarter was 4.2% higher than the previous year GDP. The main
driver of this growth is due to service and industrial contribution to the economy. This year
the economic performance was also improved by 3.8% if we compare data with the previous
year. The value added of agriculture decreased by 6.3%.” (ksh, 2019)
Page 24
14
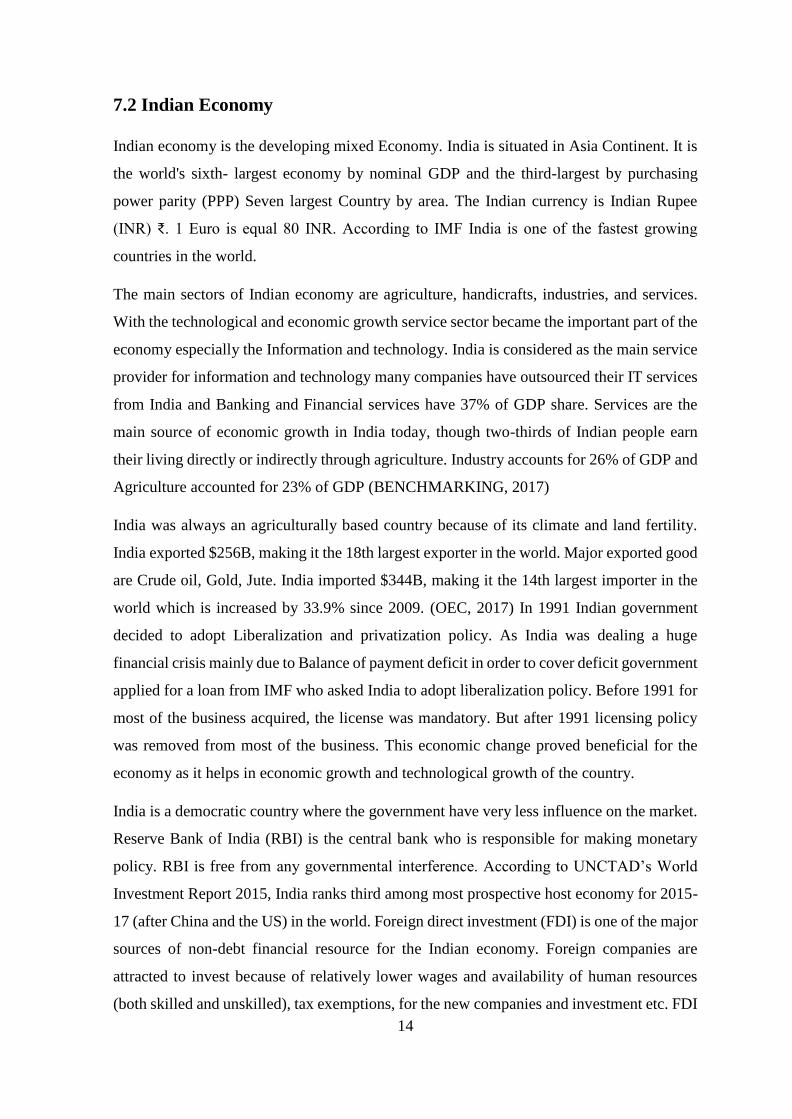
7.2 Indian Economy
Indian economy is the developing mixed Economy. India is situated in Asia Continent. It is
the world's sixth- largest economy by nominal GDP and the third-largest by purchasing
power parity (PPP) Seven largest Country by area. The Indian currency is Indian Rupee
(INR) ₹. 1 Euro is equal 80 INR. According to IMF India is one of the fastest growing
countries in the world.
The main sectors of Indian economy are agriculture, handicrafts, industries, and services.
With the technological and economic growth service sector became the important part of the
economy especially the Information and technology. India is considered as the main service
provider for information and technology many companies have outsourced their IT services
from India and Banking and Financial services have 37% of GDP share. Services are the
main source of economic growth in India today, though two-thirds of Indian people earn
their living directly or indirectly through agriculture. Industry accounts for 26% of GDP and
Agriculture accounted for 23% of GDP (BENCHMARKING, 2017)
India was always an agriculturally based country because of its climate and land fertility.
India exported $256B, making it the 18th largest exporter in the world. Major exported good
are Crude oil, Gold, Jute. India imported $344B, making it the 14th largest importer in the
world which is increased by 33.9% since 2009. (OEC, 2017) In 1991 Indian government
decided to adopt Liberalization and privatization policy. As India was dealing a huge
financial crisis mainly due to Balance of payment deficit in order to cover deficit government
applied for a loan from IMF who asked India to adopt liberalization policy. Before 1991 for
most of the business acquired, the license was mandatory. But after 1991 licensing policy
was removed from most of the business. This economic change proved beneficial for the
economy as it helps in economic growth and technological growth of the country.
India is a democratic country where the government have very less influence on the market.
Reserve Bank of India (RBI) is the central bank who is responsible for making monetary
policy. RBI is free from any governmental interference. According to UNCTAD’s World
Investment Report 2015, India ranks third among most prospective host economy for 2015-
17 (after China and the US) in the world. Foreign direct investment (FDI) is one of the major
sources of non-debt financial resource for the Indian economy. Foreign companies are
attracted to invest because of relatively lower wages and availability of human resources
(both skilled and unskilled), tax exemptions, for the new companies and investment etc. FDI
Page 25
15
not only increases capital flow in the country but also help in technological growth and give
rise to the level of employment in the country. In 2017 India has 7.2% GDP rate According
to IMF the GDP will rise further to 7.8% in 2019.
In 2016, the Indian government decided to demonetize its 500- and 1000- rupee notes, which
is the two biggest currency notes in India. The government replaced the 500rupee notes with
a new note and removed 1000 rupee note from the economy and issued a new 2000rupee
note. This change was made in overnight and time period of exchanging the currency was
very short. The government took this step-in order to remove fake currency and black money
(untaxed amount) in circulation. This was an unexpected move by the government which
impacted the stock market as a number of investors left the market and some left due to lack
of funds and other withdraw as they were expecting fall in the market. It took some time for
the exchange to come back to normal place. The government tax collection was also
increased to the demonetization.
In 2017 Indian economy faced another major change in the form of new tax reform the
government introduces new indirect tax i.e., Goods and service tax and replaced some of its
old indirect tax which also created some disturbance in the economic system of the country.
This increases the government revenue from taxation. The major reform done by the new
government had increased the personal tax collection to 2.3% of GDP
Page 26
16
7.3 Stock Exchange
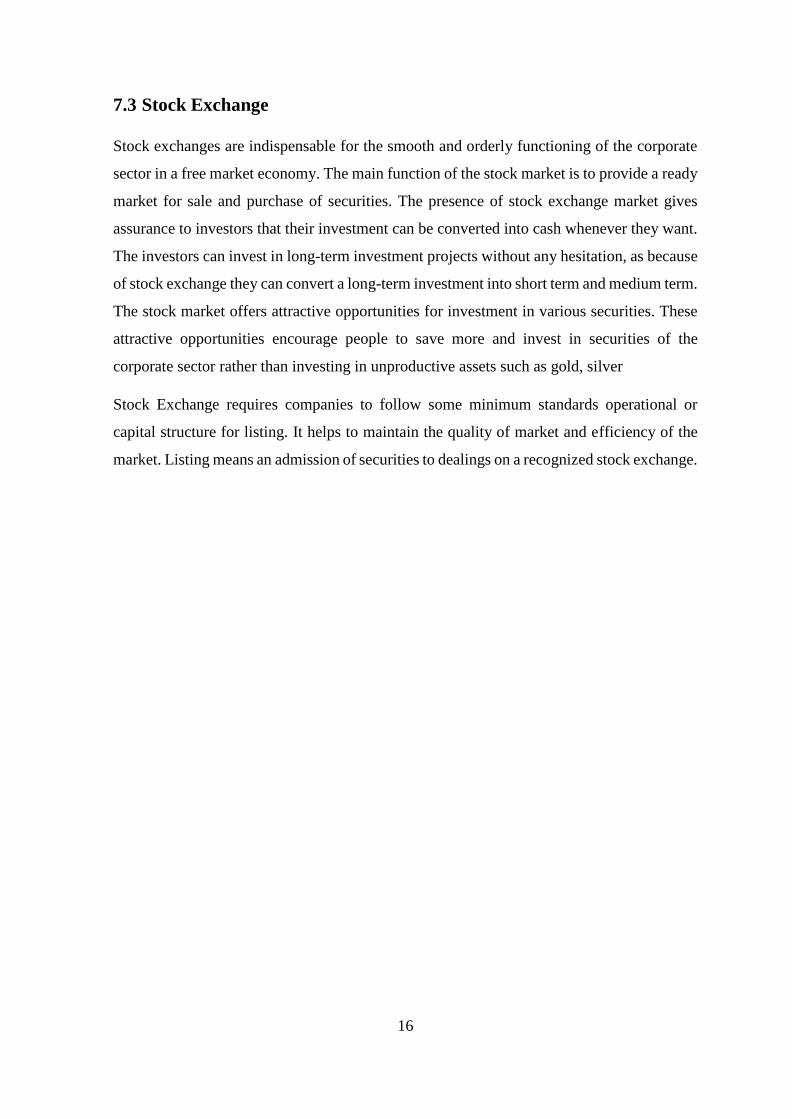
Stock exchanges are indispensable for the smooth and orderly functioning of the corporate
sector in a free market economy. The main function of the stock market is to provide a ready
market for sale and purchase of securities. The presence of stock exchange market gives
assurance to investors that their investment can be converted into cash whenever they want.
The investors can invest in long-term investment projects without any hesitation, as because
of stock exchange they can convert a long-term investment into short term and medium term.
The stock market offers attractive opportunities for investment in various securities. These
attractive opportunities encourage people to save more and invest in securities of the
corporate sector rather than investing in unproductive assets such as gold, silver
Stock Exchange requires companies to follow some minimum standards operational or
capital structure for listing. It helps to maintain the quality of market and efficiency of the
market. Listing means an admission of securities to dealings on a recognized stock exchange.
Page 27
17
7.3.1 Budapest Stock Exchange
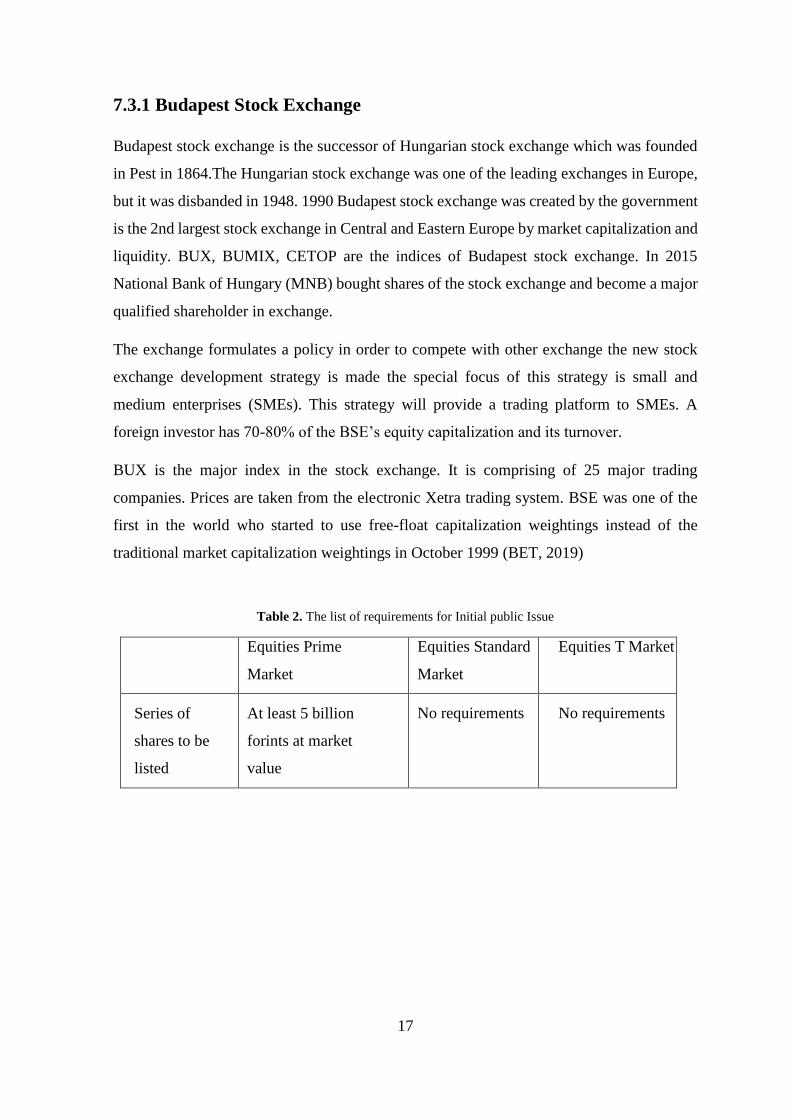
Budapest stock exchange is the successor of Hungarian stock exchange which was founded
in Pest in 1864.The Hungarian stock exchange was one of the leading exchanges in Europe,
but it was disbanded in 1948. 1990 Budapest stock exchange was created by the government
is the 2nd largest stock exchange in Central and Eastern Europe by market capitalization and
liquidity. BUX, BUMIX, CETOP are the indices of Budapest stock exchange. In 2015
National Bank of Hungary (MNB) bought shares of the stock exchange and become a major
qualified shareholder in exchange.
The exchange formulates a policy in order to compete with other exchange the new stock
exchange development strategy is made the special focus of this strategy is small and
medium enterprises (SMEs). This strategy will provide a trading platform to SMEs. A
foreign investor has 70-80% of the BSE’s equity capitalization and its turnover.
BUX is the major index in the stock exchange. It is comprising of 25 major trading
companies. Prices are taken from the electronic Xetra trading system. BSE was one of the
first in the world who started to use free-float capitalization weightings instead of the
traditional market capitalization weightings in October 1999 (BET, 2019)
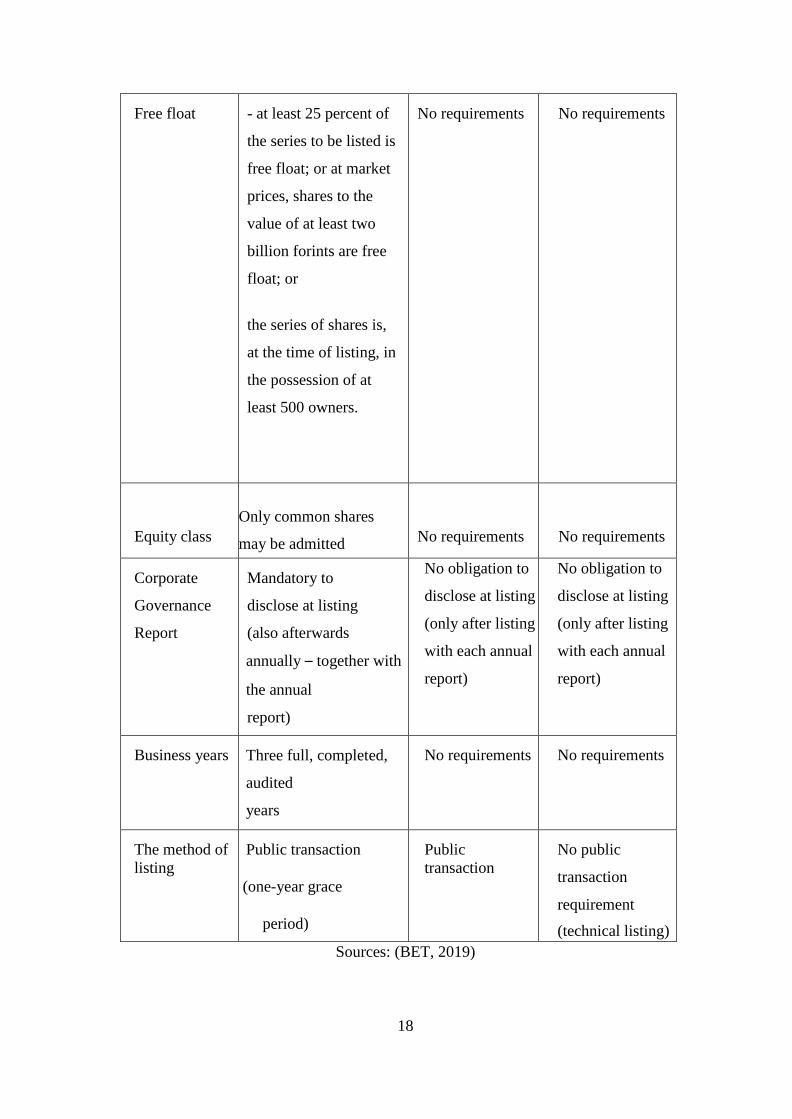
Table 2. The list of requirements for Initial public Issue
Equities Prime
Market
Equities Standard
Market
Equities T Market
Series of
shares to be
listed
At least 5 billion
forints at market
value
No requirements No requirements
Page 28
18
Free float - at least 25 percent of
the series to be listed is
free float; or at market
prices, shares to the
value of at least two
billion forints are free
float; or
the series of shares is,
at the time of listing, in
the possession of at
least 500 owners.
No requirements No requirements
Equity class
Only common shares
may be admitted
No requirements
No requirements
Corporate
Governance
Report
Mandatory to
disclose at listing
(also afterwards
annually – together with
the annual
report)
No obligation to
disclose at listing
(only after listing
with each annual
report)
No obligation to
disclose at listing
(only after listing
with each annual
report)
Business years Three full, completed,
audited
years
No requirements No requirements
The method of
listing
Public transaction
(one-year grace
period)
Public
transaction
No public
transaction
requirement
(technical listing)
Sources: (BET, 2019)
Page 29
19
The listing fee payable Issuers are not obliged to pay a fee for listing Equities and Other
Securities Issued. The Amount of the annual listing maintenance fee is based on
https://www.bse.hu/Issuers/Listing-on-the-BSE/Terms-of-Listing capitalization.
The Budapest Stock Exchange's Market Capitalization is $23.2 Billion, Market
Capitalization to GDP ratio, which when compared to the historic ratio is an indicator that a
market is over or undervalued, is 17.77% (BET, 2019)
Page 30
20
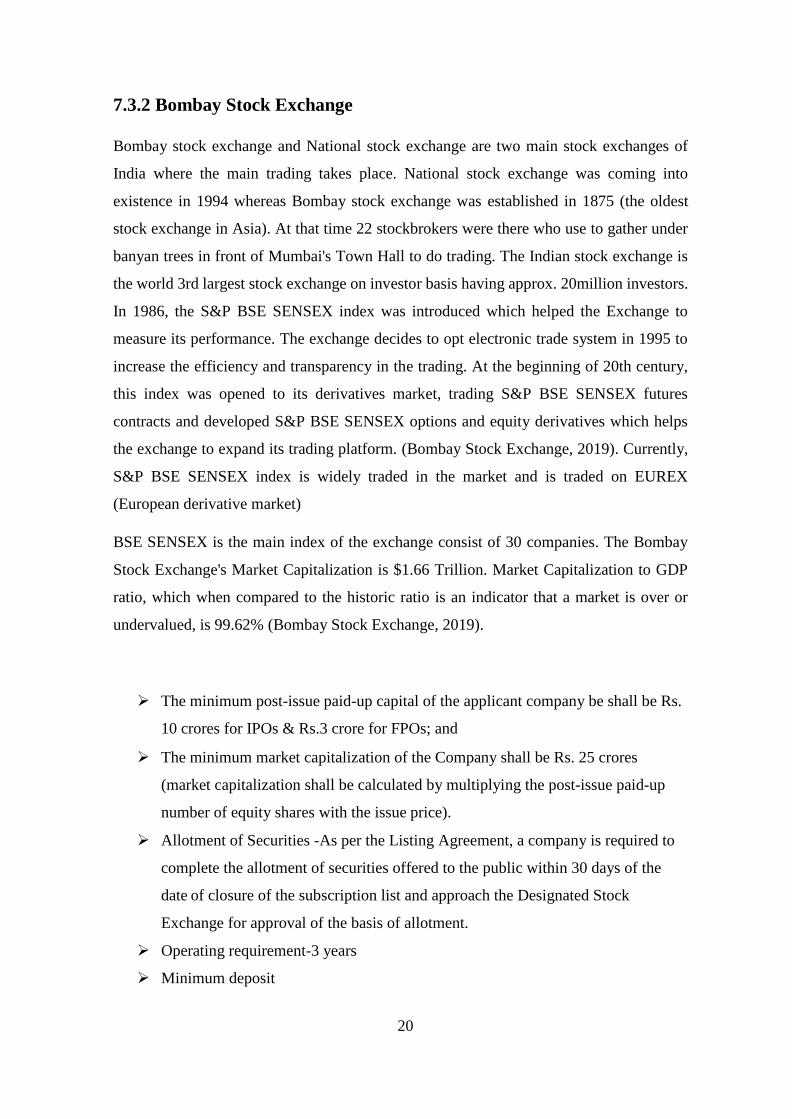
7.3.2 Bombay Stock Exchange
Bombay stock exchange and National stock exchange are two main stock exchanges of
India where the main trading takes place. National stock exchange was coming into
existence in 1994 whereas Bombay stock exchange was established in 1875 (the oldest
stock exchange in Asia). At that time 22 stockbrokers were there who use to gather under
banyan trees in front of Mumbai's Town Hall to do trading. The Indian stock exchange is
the world 3rd largest stock exchange on investor basis having approx. 20million investors.
In 1986, the S&P BSE SENSEX index was introduced which helped the Exchange to
measure its performance. The exchange decides to opt electronic trade system in 1995 to
increase the efficiency and transparency in the trading. At the beginning of 20th century,
this index was opened to its derivatives market, trading S&P BSE SENSEX futures
contracts and developed S&P BSE SENSEX options and equity derivatives which helps
the exchange to expand its trading platform. (Bombay Stock Exchange, 2019). Currently,
S&P BSE SENSEX index is widely traded in the market and is traded on EUREX
(European derivative market)
BSE SENSEX is the main index of the exchange consist of 30 companies. The Bombay
Stock Exchange's Market Capitalization is $1.66 Trillion. Market Capitalization to GDP
ratio, which when compared to the historic ratio is an indicator that a market is over or
undervalued, is 99.62% (Bombay Stock Exchange, 2019).
➢ The minimum post-issue paid-up capital of the applicant company be shall be Rs.
10 crores for IPOs & Rs.3 crore for FPOs; and
➢ The minimum market capitalization of the Company shall be Rs. 25 crores
(market capitalization shall be calculated by multiplying the post-issue paid-up
number of equity shares with the issue price).
➢ Allotment of Securities -As per the Listing Agreement, a company is required to
complete the allotment of securities offered to the public within 30 days of the
date of closure of the subscription list and approach the Designated Stock
Exchange for approval of the basis of allotment.
➢ Operating requirement-3 years
➢ Minimum deposit
Page 31
21
➢ Companies making public/rights issues are required to deposit 1% of the issue
amount with the Designated Stock Exchange before the issue opens
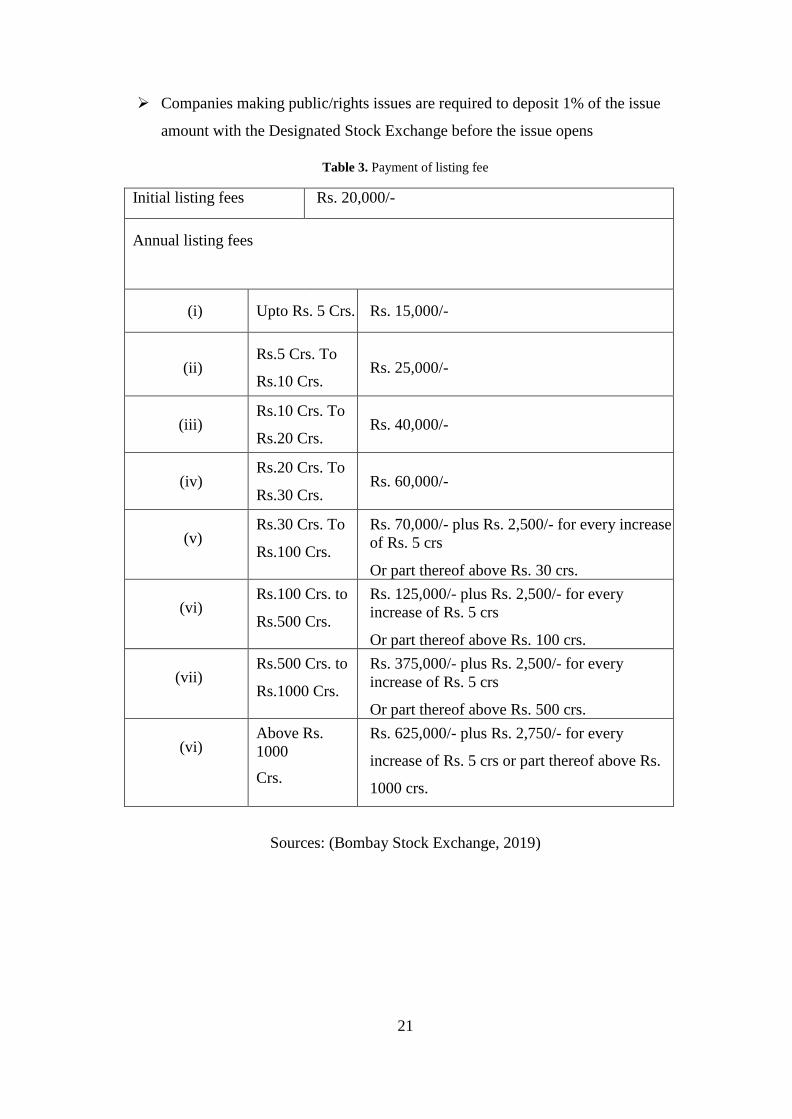
Table 3. Payment of listing fee
Initial listing fees Rs. 20,000/-
Annual listing fees
(i) Upto Rs. 5 Crs. Rs. 15,000/-
(ii)
Rs.5 Crs. To
Rs.10 Crs.
Rs. 25,000/-
(iii) Rs.10 Crs. To
Rs.20 Crs.
Rs. 40,000/-
(iv) Rs.20 Crs. To
Rs.30 Crs.
Rs. 60,000/-
(v) Rs.30 Crs. To
Rs.100 Crs.
Rs. 70,000/- plus Rs. 2,500/- for every increase
of Rs. 5 crs
Or part thereof above Rs. 30 crs.
(vi) Rs.100 Crs. to
Rs.500 Crs.
Rs. 125,000/- plus Rs. 2,500/- for every
increase of Rs. 5 crs
Or part thereof above Rs. 100 crs.
(vii) Rs.500 Crs. to
Rs.1000 Crs.
Rs. 375,000/- plus Rs. 2,500/- for every
increase of Rs. 5 crs
Or part thereof above Rs. 500 crs.
(vi) Above Rs.
1000
Crs.
Rs. 625,000/- plus Rs. 2,750/- for every
increase of Rs. 5 crs or part thereof above Rs.
1000 crs.
Sources: (Bombay Stock Exchange, 2019)
Page 32
22
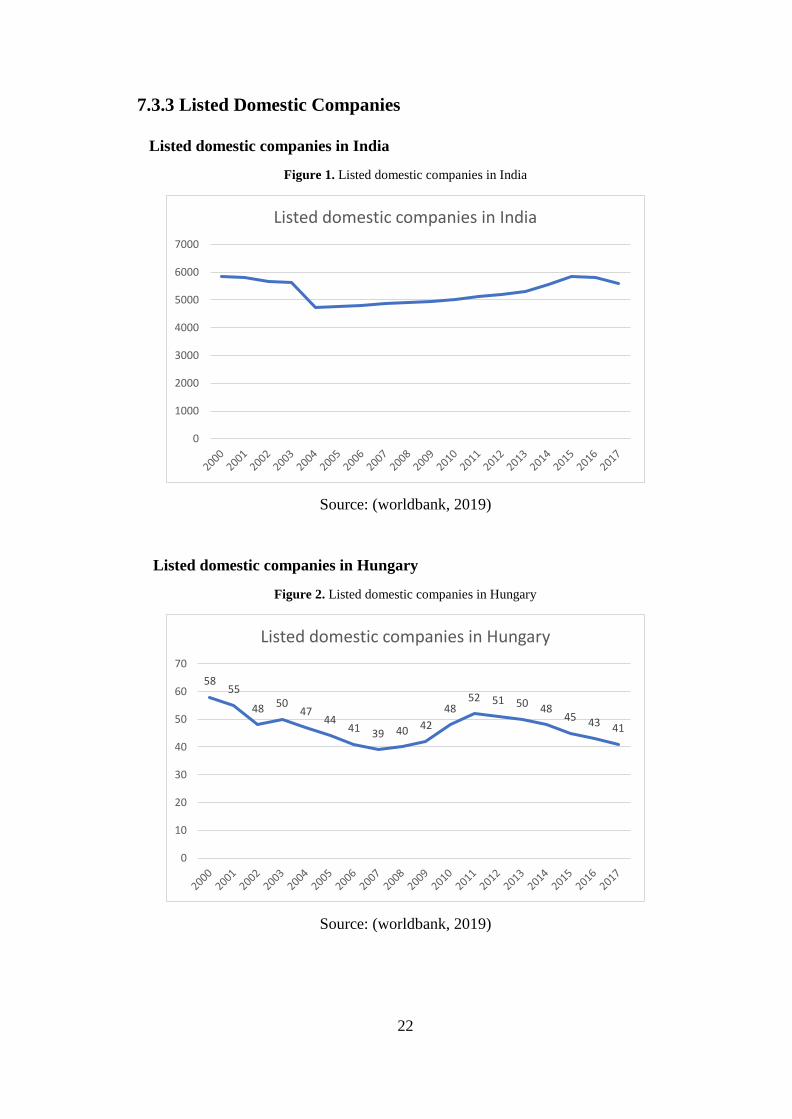
7.3.3 Listed Domestic Companies
Listed domestic companies in India
Figure 1. Listed domestic companies in India
Source: (worldbank, 2019)
Listed domestic companies in Hungary
Figure 2. Listed domestic companies in Hungary
Source: (worldbank, 2019)
0
1000
2000
3000
4000
5000
6000
7000
Listed domestic companies in India
5855
48 5047
4441 39 40 42
4852 51 50 48
45 43 41
0
10
20
30
40
50
60
70
Listed domestic companies in Hungary
Page 33
23
7.4 MOL
MOL group was founded in 1991 as MOL Plc. In 1995 they opened first Romanian MOL
filling Nagyszalonta. Since its foundation MOL group has acquired 100% stakes in BaiTex,
Surgut-7 exploration blocks in Russia, Margala and Margala-North exploration blocks in
Pakistan, Akri-Bijeel exploration block in the Kurdistan Region of Iraq, Tifon in Croatia,
Matjushkinskaya Vertikal LLC in Russia, IES oil company in Italy, TUS Oil Holding in
Slovenia, Pap Oil and Bohemia Realty Companies in the Czech Republic, TVK Plc.
(subsequently renamed to "MOL Petrochemicals")
MOL is a Hungarian multinational oil and gas company headquartered in Budapest,
Hungary. MOL is the second most valuable company in Central and Eastern Europe. MOL
placed 402 on the Fortune Global 500 list of the world's largest companies in 2013. MOL's
revenue was equal to one-fifth of Hungary's GDP at the time. As of November 2015, the
largest shareholder is Hungarian state with 24.74% ahead of ČEZ Group with 7.35%, Oman
Oil Budapest with 7.00% and ahead of OTP Bank with 5.84%. More than 50% of shares are
free floated.
MOL is vertically integrated and is active in every area of the oil and gas industry, including
exploration and production, refining, distribution and marketing, petrochemicals, power
generation and trading. It has minor renewable energy activities in the form of biofuels. It
has operations in over 40 countries worldwide, it has nearly 2,000 service stations in 11
countries (mainly in Central and Eastern Europe) under seven brands, and it is a market
leader in Hungary, Slovakia, and Croatia. MOL's downstream operations manufacture and
sell products such as fuels, lubricants, additives and petrochemicals. The company's most
significant areas of operations are Central and Eastern Europe, Southern Europe, North Sea,
Middle East and Russia. It has 4 Refineries with 417,000 Refineries throughput per day, 2
Petrochemical Facilities with Petrochemical production of 2080 KTPA and 459M
BARRELS OF OIL EQUIVALENT of SPE 2P. The market capitalization is $7.3 Billion in
May 2017 (molgroup, 2019).
Page 34
24
7.5 Oil and Natural Gas Corporation Ltd
Oil and Natural Gas Corporation Ltd. (ONGC) is an India oil company a Navaratna public
sector enterprise engaged in the exploration of hydrocarbons is one of the leading companies
with significant contribution in its industrial and economic growth over the years ONGC has
been fairly successful in building up a vibrant oil industry in the country. The Oil and Natural
directorate were formed in the year 1952 as part of Department of Geological Survey of
India (GSI) to undertake the task of exploration of crude oil in the country. The directorate
was transformed into commission in the year 1956 thenceforth it was known as Oil and
Natural Gas Commission till recently in the year 1993 when it converted into a public limited
company and is known as Oil and Natural Gas Corporation Limited. The various products
of ONGC are Crude Oil, NGL (Natural Gasoline), LPG (Liquefied Petroleum Gas), Ethane-
Propane, Natural Gas.
Maharatna ONGC is the largest producer of crude oil and natural gas in India, contributing
around 70 percent of Indian domestic production.
It is one of the most valued public enterprises in India, and one of the highest profit-making
and dividend-paying. ONGC has a unique distinction of being a company with in-house
service capabilities in all areas of Exploration and Production of oil & gas and related oilfield
services. Winner of the Best Employer award, a dedicated team of over 33,927 professionals’
toils round the clock in challenging locations.
Its wholly-owned subsidiary ONGC Videsh Limited (OVL) is the biggest Indian
multinational in the energy space, participating in 36 oil and gas properties in 17 countries.
ONGC subsidiary Mangalore Refinery and Petrochemicals Limited.
ONGC is one of the most valuable corporations trading on Indian stock exchanges. With a
current approximate share price of around INR 250 per share and 8555.60 million equity
share base, the market valuation of ONGC is INR 2,138,900 million. Its market
capitalization is 231,960.73 (Oil and Natural Gas Corporation Limited, 2019).
Page 35
25
7.6 OTP BANK
OTP Bank Group is one of the largest independent financial services providers in Central
and Eastern Europe with a full range of banking services for private individuals and
corporate clients. OTP Group comprises large subsidiaries, granting services in the field of
insurance, real estate, factoring, leasing and asset management, investment and pension
funds. The bank is serving clients in 9 countries, namely Hungary, Slovakia, Bulgaria,
Serbia, Romania, Croatia, Ukraine, Montenegro and Russia.
OTP Group provides its universal financial services through several subsidiaries. In
Hungary, traditional banking operations are performed by the Bank while specialized
services, including car leasing, investment funds are developed and offered by the Bank's
subsidiaries. Insurance claims of OTP Group clients are supplied by sales of insurance
products with strategic collaboration with French insurance company, Groupama, after its
OTP Garancia aqutision. The predecessor of OTP Bank called the National Savings Bank
(OTP Bank) was established in 1949 as a nationwide, state-owned, banking entity providing
retail deposits and loans. In the ensuing years, its activities and the scope of its authority
gradually widened.
Nowadays OTP Groups' more than 38,000 employees are serving 13 million clients in over
1,500 branches and through electronic channels on all the markets of the bank. OTP is still
the largest commercial bank in Hungary with over 25% market share. OTP Group started its
activity in 1949 when OTP Bank was founded as state savings and commercial bank. OTP
stands for Országos Takarék Pénztár (National Savings Bank) which indicates the original
purpose of establishment of the bank. The bank went public in 1995, and the share of the
state in the bank capital decreased to one preferential gold share, which also eliminated
shortly thereafter. Currently, most of the banks' shares are owned by private and institutional
investors.OTP has a high free float shareholder structure; the free float ratio reaches the
68.61%. The rest is held by one of the Forbes billionaire Megdet Rahimkulov in 8.88%,
Hungarian MOL Group in 8.57%, French Groupama in 8.30% and American Lazard in
5.64%. The market cap of otp as on May 2017 was $7.9 Billion (OTP, 2019).
Page 36
26
7.7 State Bank of India
State Bank of India (SBI) is an Indian multinational, public sector banking and financial
services company. It is a government-owned corporation with its headquarters in Mumbai,
Maharashtra. State Bank of India (SBI), with a 200-year history, is the largest commercial
bank in India in terms of assets, deposits, profits, branches, customers and employees. The
Government of India is the single largest shareholder of this Fortune 500 entity with 61.58%
ownership. SBI is ranked 60th in the list of Top 1000 Banks in the world by "The Banker"
in July 2012.
The SBI group consists of SBI and five associate banks. The group has an extensive network,
with over 20000 plus branches in India and another 173 offices in 34 countries across the
world.
As of 31st March 2012, the group had assets worth USD 359 billion, deposits of USD 278
billion and capital & reserves in excess of USD 20.88 billion. The group commands over
22% share of the domestic Indian banking market. SBI’s non- banking subsidiaries/joint
ventures are market leaders in their respective areas and provide wide-ranging services,
which include life insurance, merchant banking, mutual funds, credit cards, factoring
services, security trading and primary dealership, making the SBI Group a truly large
financial supermarket and India’s financial icon. SBI has arrangements with over 1500
various international/local banks to exchange financial messages through SWIFT in all
business centres of the world to facilitate trade related banking business, reinforced by
dedicated and highly skilled teams of professionals. (Linda, 2019)
In April market cap of SBI Rs 2,35,307.51 crore. On April 1, 2017, the State Bank of India,
India's largest bank, merged with five of its associate banks (State Bank of Bikaner & Jaipur,
State Bank of Hyderabad, State Bank of Mysore, State Bank of Patiala and State Bank of
Travancore), and with the Bhartiya Mahila Bank. This merger was the first largest
consolidation in the Indian banking industry.
Page 37
27
7.8 Richter Gedeon Nyrt
Richter Group is active in two major business segments, primarily Pharmaceuticals
comprising the research and development, manufacturing, sales and marketing of
pharmaceutical products, and it is also engaged in the Wholesale and Retail of these
products. In addition, there is a third group (’Other’) of companies comprising those
members of the Group that provide auxiliary services to the former segments. Research,
development, manufacturing and marketing of pharmaceutical products are the core
activities of Richter and in this endeavour, the Group is supported by a number of
subsidiaries, joint ventures and associated companies. Manufacturing subsidiaries of the
Group which operate in traditional markets together with a broad network of trading
affiliates that ensure a strong market presence have together created the foundation for
regional leadership and a global presence in the area of Women’s Healthcare (Richter, 2019).
Richter Gedeon Nyrt is a Hungarian company registered under Budapest stock exchange.
The total number of shares in issue at 186,374,860 as of 31 December 2016 which is as same
as in last year. The Company is following corporate governance Corporate Governance
according to guidelines set by the Budapest Stock Exchange and the directives of the capital
market.
Gedeon Richter’s key principles of Corporate Governance are to create and maintain
satisfactory shareholders so as to enhance shareholder value, to differentiate the roles and
responsibilities of the Board of Directors, the Executive Board and the Supervisory Board,
and to operate the Group’s business in compliance with legal and regulatory requirements
and to maintain the highest ethical standards (Richter, 2019).
Page 38
28
7.9 Sun Pharmaceuticals
Sun Pharmaceuticals was established by Mr Dilip Shanghvi in 1983 in Vapi, India with five
products to treat psychiatry ailments. Today, it is the largest chronic prescription company
in India and a market leader in psychiatry, neurology, cardiology, orthopedics,
ophthalmology, gastroenterology and nephrology. Sun Pharma was listed on the stock
exchange in 1994 in an issue oversubscribed 55 times. The founding family continues to
hold a majority stake in the company. Today Sun Pharma is the second largest and the most
profitable pharmaceutical company in India, as well as the largest pharmaceutical company
by market capitalization on the Indian exchanges. They have over 40 (API & finished dose)
state-of-the-art manufacturing sites spanning 6 continents. These manufacturing units are
located in India, the US, Brazil, Canada, Egypt, Hungary, Israel, Bangladesh, Mexico,
Romania, Ireland, Morocco, Nigeria, South Africa and Malaysia. These units provide best-
in-class products to patients across 150 countries worldwide.
In Hungary, they engaged in manufacturing and sale of APIs, intermediates and finished
products which are supplied in the domestic and foreign markets.Some of their key APIs
include Codeine Phosphate Hemihydrate, Dihydrocodeine Bitartrate, and Pholcodine,
Ethylmorphine HCl, Oxycodone HCl, Morphine Sulfate, Phenobarbital Acid and Sodium.
Their diverse product portfolio covers cardiology, substances for the central nervous system,
antidepressants, antispasmodics and other products for coughing.
Their operations in Hungary are supported by global R&D and manufacturing with an
unwavering commitment to quality. Their medicines are trusted by healthcare professionals
and patients in over 150 countries of the world. Their global presence is supported by over
41 manufacturing facilities across 5 continents. They have a multi-cultural workforce
comprising more than 30,000 employees of over 50 nationalities.
In 2007, Sun Pharma demerged its innovative R&D arm and listed it separately on the stock
market as the Sun Pharma Advanced Research Company Ltd. (NSE: SPARC, BSE: 532872).
In 2013, SPARC declared revenue of Rs. 873 million. SPARC focuses on new chemical
entities (NCE) research. Market Cap in May 2017 was $24.9 Billion (sunpharma, 2019)
Page 39
29
7.10 Investment Risk Management
Risk means uncertainty in the investment. In the stock market, there is a risk that the investor
will not get the same amount which he had expected. Generally, return on investment is
related to the risk. High returns mean high risk associated with that investment. High return
is the reward for the risk taken for an investment. It can be caused by a various event like
fluctuation in prices, changes in governmental policy, some disturbance in the world market,
Risk can’t be removed from an investment but can be minimized with the risk management.
Risk management is the process of identifying, analysing the uncertain event that will affect
the investment. In order to make investment less risky, there is some model. With help of
models and analysis, the investor can have a rough idea about the risk involves in the
investments. Risk management is not only beneficial for the investor but also to the
organization. It is the ongoing process it needs to be applied and make changes with the time.
The risk can be reduced either by transferring the risk or sharing the risk. Transferring risk
is diversifying the investment or making a diversified portfolio with this the risk got
transferred to financial investments or hedging.
Financial risk modelling is done determine the risk it includes lots of model Value at Risk is
the most common and efficient model to identify the risk. Basel II also proposed the risk
modelling.
Page 40
30
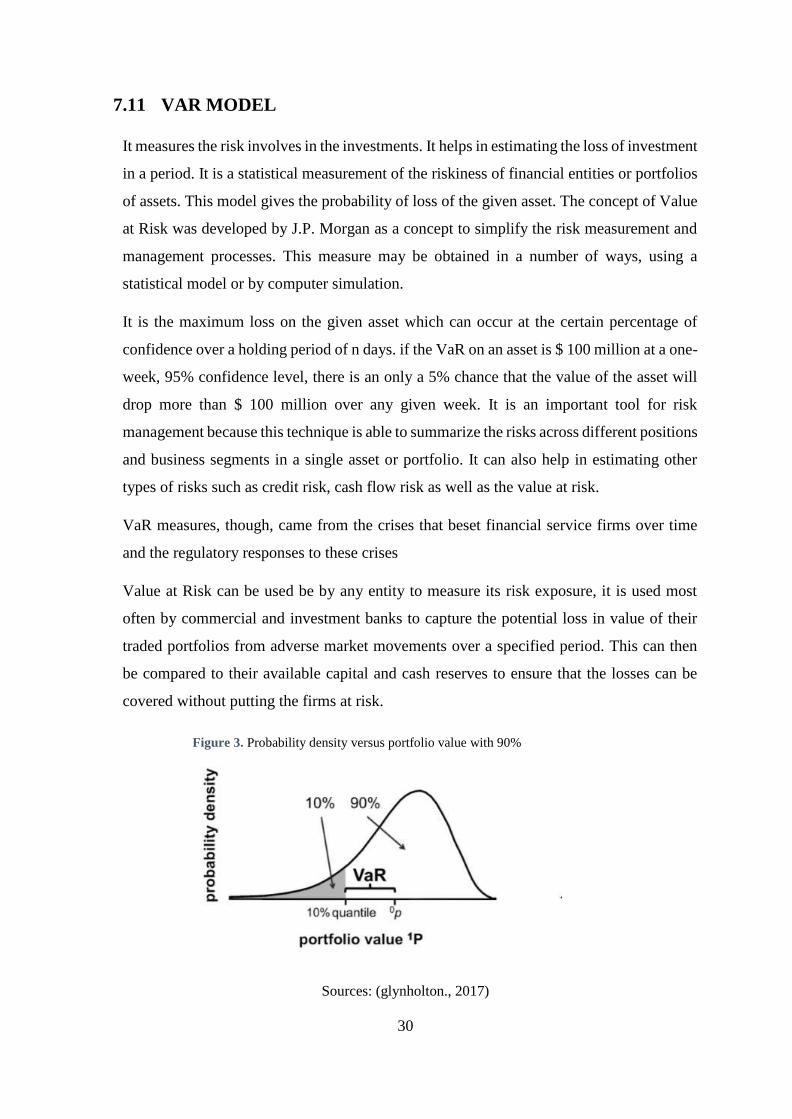
7.11 VAR MODEL
It measures the risk involves in the investments. It helps in estimating the loss of investment
in a period. It is a statistical measurement of the riskiness of financial entities or portfolios
of assets. This model gives the probability of loss of the given asset. The concept of Value
at Risk was developed by J.P. Morgan as a concept to simplify the risk measurement and
management processes. This measure may be obtained in a number of ways, using a
statistical model or by computer simulation.
It is the maximum loss on the given asset which can occur at the certain percentage of
confidence over a holding period of n days. if the VaR on an asset is $ 100 million at a one-
week, 95% confidence level, there is an only a 5% chance that the value of the asset will
drop more than $ 100 million over any given week. It is an important tool for risk
management because this technique is able to summarize the risks across different positions
and business segments in a single asset or portfolio. It can also help in estimating other
types of risks such as credit risk, cash flow risk as well as the value at risk.
VaR measures, though, came from the crises that beset financial service firms over time
and the regulatory responses to these crises
Value at Risk can be used be by any entity to measure its risk exposure, it is used most
often by commercial and investment banks to capture the potential loss in value of their
traded portfolios from adverse market movements over a specified period. This can then
be compared to their available capital and cash reserves to ensure that the losses can be
covered without putting the firms at risk.
Sources: (glynholton., 2017)
Figure 3. Probability density versus portfolio value with 90%
confidence in portfolio
Page 41
31
The Fig.3 shows that in case 90% VaR i.e., 90% confidence in the portfolio.
VAR have two main parameters
1. Horizon
2. Confidence Level
There are three main approaches of calculating VaR
• Variance-Covariance approach,
• Historical simulation
• Monte Carlo simulation
Variance approach- In this method, it is assumed that the returns on risk factors are normally
distributed, the correlations between risk factors are constant. The daily Value at Risk is a
function of the standard deviation and the desired confidence level. To measure the standard
deviation of each risk factor is the historical data is used.
Historical Stimulation- This model calculates potential losses using actual returns in the risk
factors from historical data. The rare events and crashes can be included
In the results. As the risk factor returns used for revaluing the portfolio are actual past
movements, the correlations in the calculation are also actual past correlations. They capture
the dynamic nature of correlation as well as scenarios when the usual correlation
relationships break down.
Monte Carlo simulation method- It is similar to historical stimulation but instead of using
historical changes, a distribution that adequately describes price changes are used. After
simulating price changes or changes in risk factors, hypothetical profits and losses are
calculated. Finally, VaR is calculated as a percentile corresponding to the chosen confidence
level. This method is capable of finding the behaviour in the complex products.
Page 42
32
Limitation
• VaR is dependent on the underlying assumptions used by the model, such as normality
and liquid markets.
• Using historical data sometime doesn’t help in predicting future risk.
Page 43
33
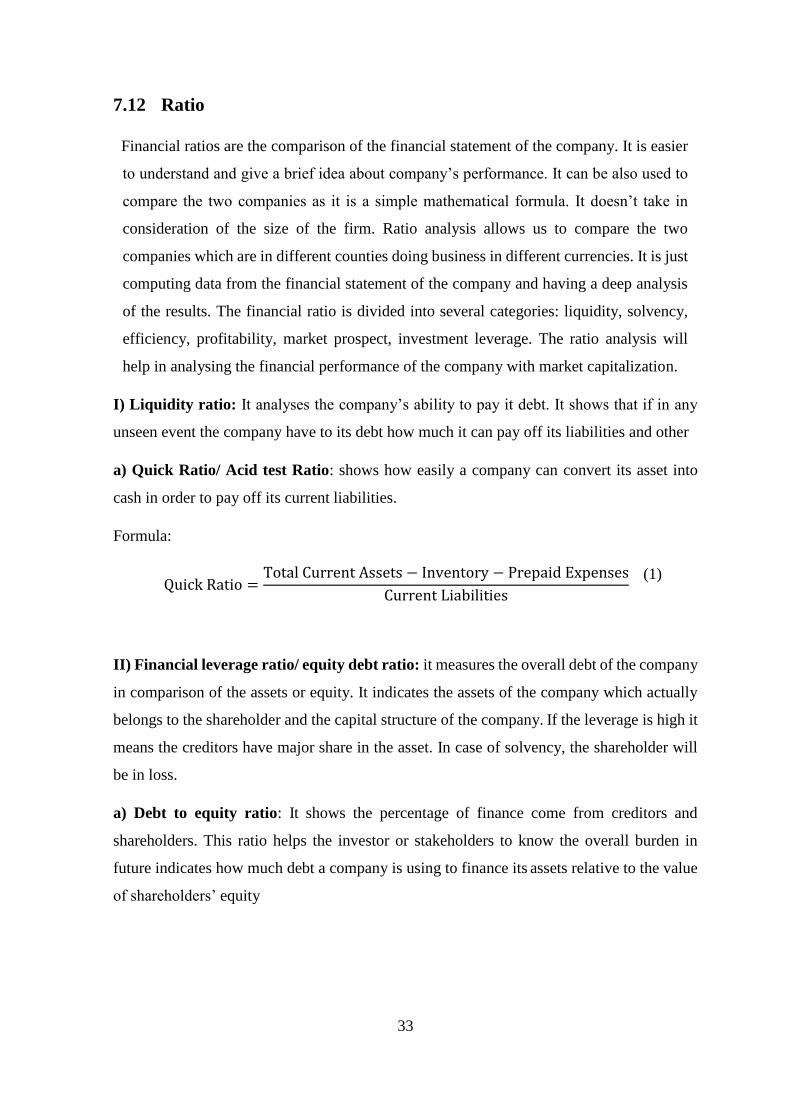
7.12 Ratio
Financial ratios are the comparison of the financial statement of the company. It is easier
to understand and give a brief idea about company’s performance. It can be also used to
compare the two companies as it is a simple mathematical formula. It doesn’t take in
consideration of the size of the firm. Ratio analysis allows us to compare the two
companies which are in different counties doing business in different currencies. It is just
computing data from the financial statement of the company and having a deep analysis
of the results. The financial ratio is divided into several categories: liquidity, solvency,
efficiency, profitability, market prospect, investment leverage. The ratio analysis will
help in analysing the financial performance of the company with market capitalization.
I) Liquidity ratio: It analyses the company’s ability to pay it debt. It shows that if in any
unseen event the company have to its debt how much it can pay off its liabilities and other
a) Quick Ratio/ Acid test Ratio: shows how easily a company can convert its asset into
cash in order to pay off its current liabilities.
Formula:
Quick Ratio =
Total Current Assets − Inventory − Prepaid Expenses
Current Liabilities
(1)
II) Financial leverage ratio/ equity debt ratio: it measures the overall debt of the company
in comparison of the assets or equity. It indicates the assets of the company which actually
belongs to the shareholder and the capital structure of the company. If the leverage is high it
means the creditors have major share in the asset. In case of solvency, the shareholder will
be in loss.
a) Debt to equity ratio: It shows the percentage of finance come from creditors and
shareholders. This ratio helps the investor or stakeholders to know the overall burden in
future indicates how much debt a company is using to finance its assets relative to the value
of shareholders’ equity
Page 44
34
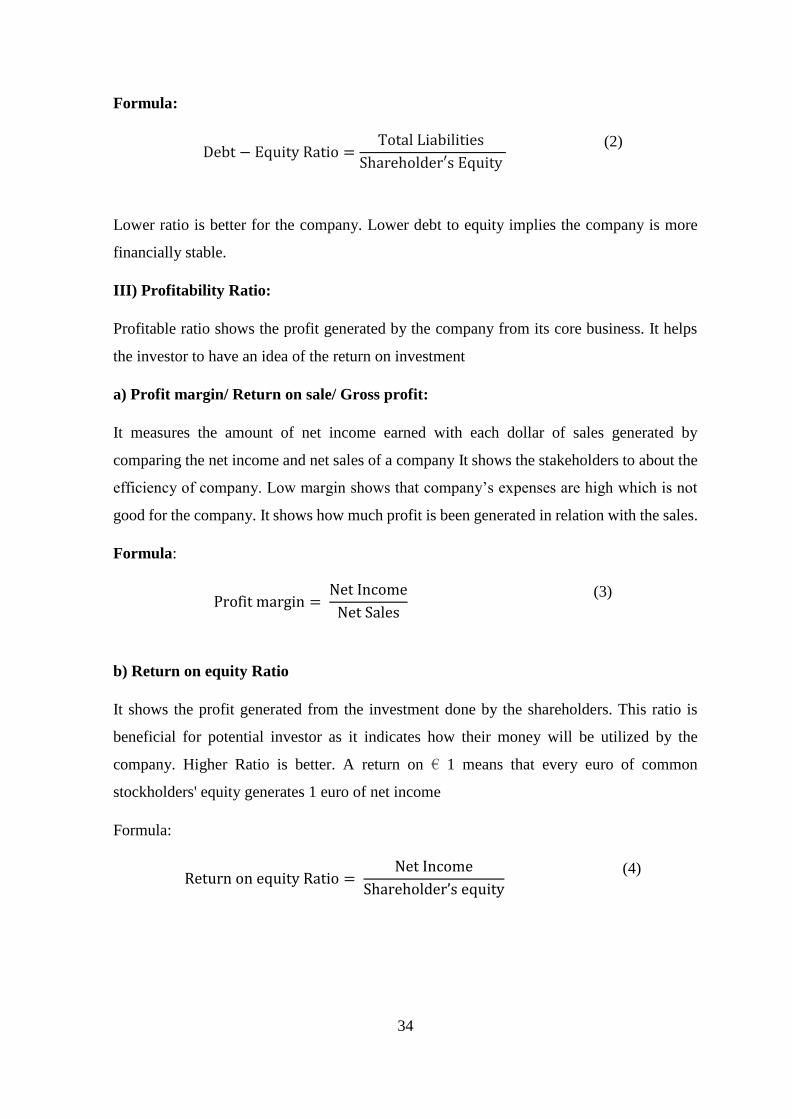
Formula:
Debt − Equity Ratio =
Total Liabilities
Shareholder′s Equity
(2)
Lower ratio is better for the company. Lower debt to equity implies the company is more
financially stable.
III) Profitability Ratio:
Profitable ratio shows the profit generated by the company from its core business. It helps
the investor to have an idea of the return on investment
a) Profit margin/ Return on sale/ Gross profit:
It measures the amount of net income earned with each dollar of sales generated by
comparing the net income and net sales of a company It shows the stakeholders to about the
efficiency of company. Low margin shows that company’s expenses are high which is not
good for the company. It shows how much profit is been generated in relation with the sales.
Formula:
Profit margin =
Net Income
Net Sales
(3)
b) Return on equity Ratio
It shows the profit generated from the investment done by the shareholders. This ratio is
beneficial for potential investor as it indicates how their money will be utilized by the
company. Higher Ratio is better. A return on € 1 means that every euro of common
stockholders' equity generates 1 euro of net income
Formula:
Return on equity Ratio =
Net Income
Shareholder’s equity
(4)
Page 45
35
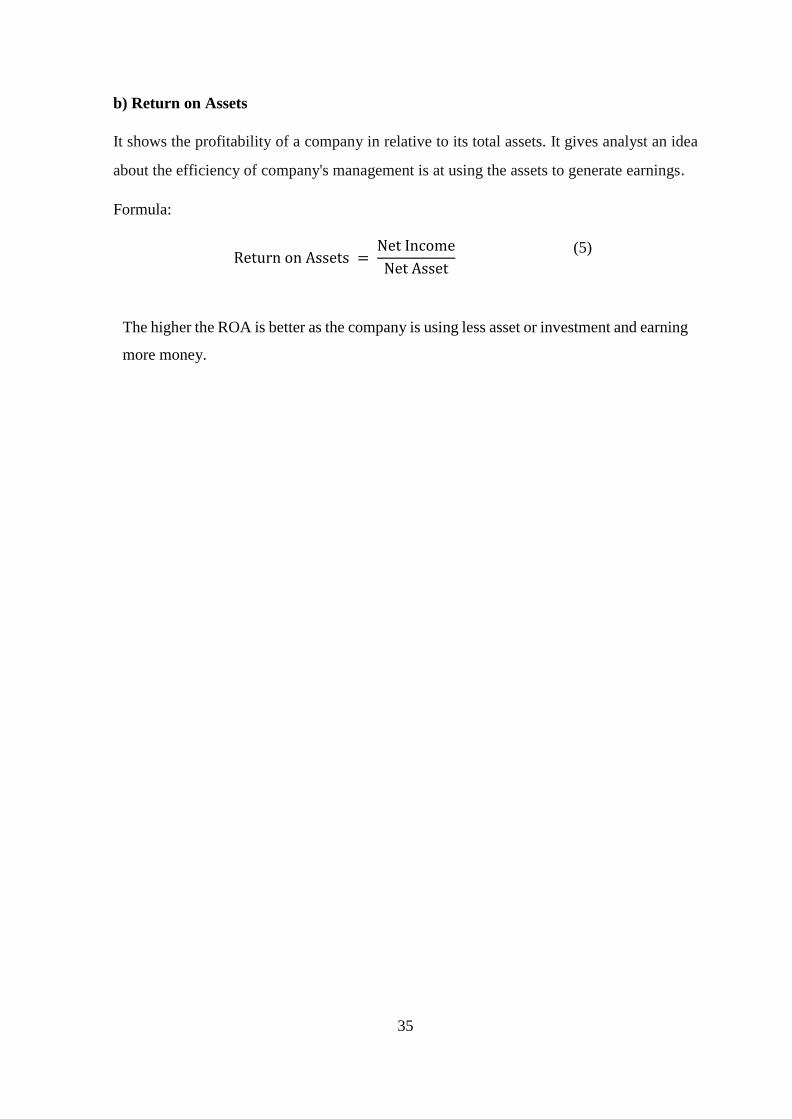
b) Return on Assets
It shows the profitability of a company in relative to its total assets. It gives analyst an idea
about the efficiency of company's management is at using the assets to generate earnings.
Formula:
Return on Assets =
Net Income
Net Asset
(5)
The higher the ROA is better as the company is using less asset or investment and earning
more money.
Page 46
36
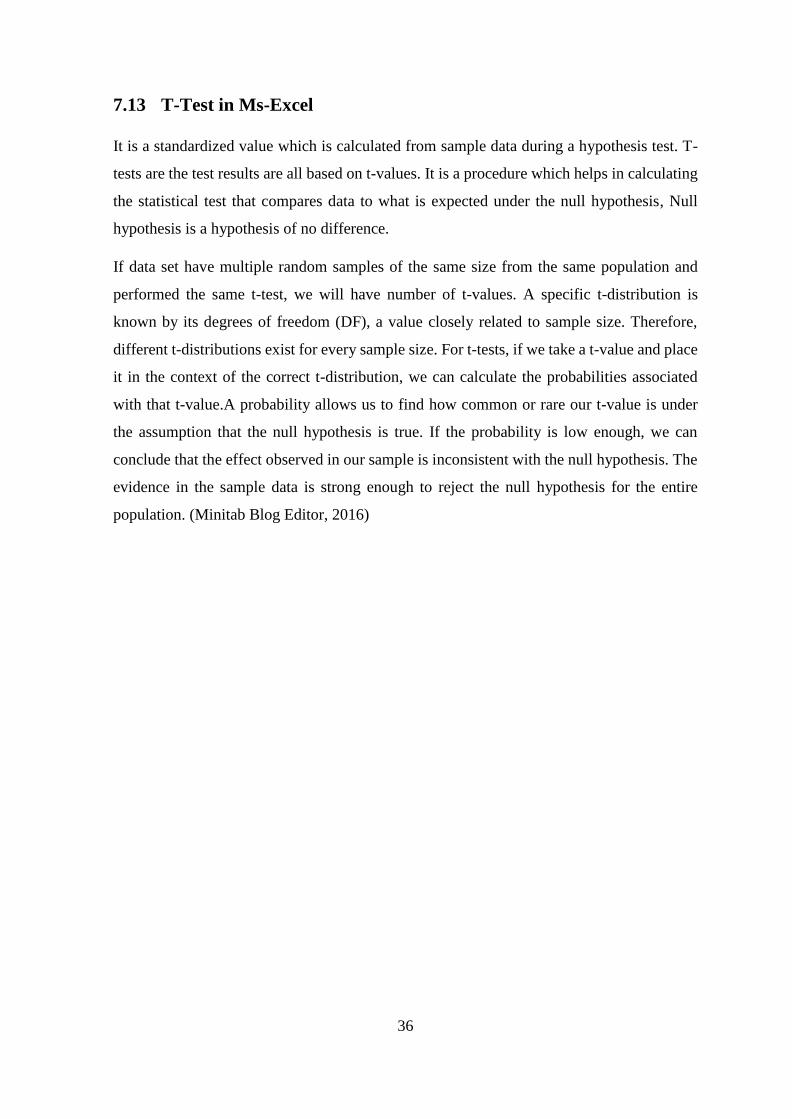
7.13 T-Test in Ms-Excel
It is a standardized value which is calculated from sample data during a hypothesis test. T-
tests are the test results are all based on t-values. It is a procedure which helps in calculating
the statistical test that compares data to what is expected under the null hypothesis, Null
hypothesis is a hypothesis of no difference.
If data set have multiple random samples of the same size from the same population and
performed the same t-test, we will have number of t-values. A specific t-distribution is
known by its degrees of freedom (DF), a value closely related to sample size. Therefore,
different t-distributions exist for every sample size. For t-tests, if we take a t-value and place
it in the context of the correct t-distribution, we can calculate the probabilities associated
with that t-value.A probability allows us to find how common or rare our t-value is under
the assumption that the null hypothesis is true. If the probability is low enough, we can
conclude that the effect observed in our sample is inconsistent with the null hypothesis. The
evidence in the sample data is strong enough to reject the null hypothesis for the entire
population. (Minitab Blog Editor, 2016)
Page 47
37
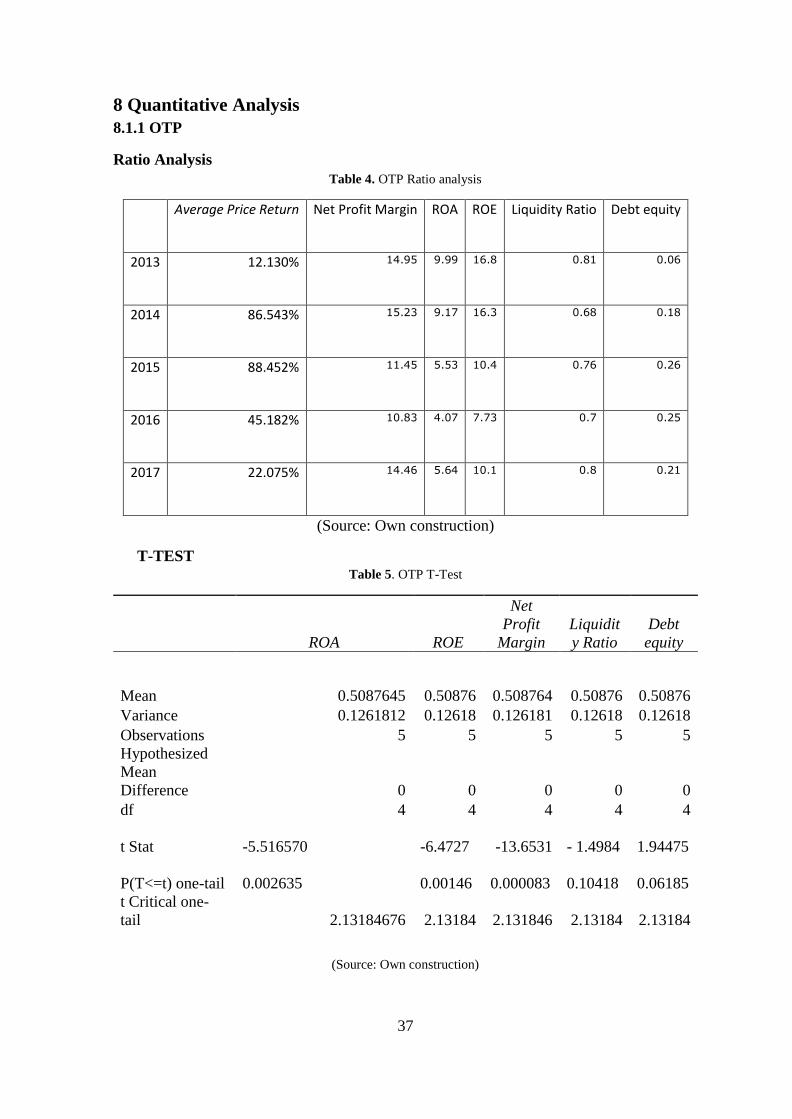
8 Quantitative Analysis
8.1.1 OTP
Ratio Analysis
Table 4. OTP Ratio analysis
Average Price Return Net Profit Margin ROA ROE Liquidity Ratio Debt equity
2013 12.130% 14.95 9.99 16.8 0.81 0.06
2014 86.543% 15.23 9.17 16.3 0.68 0.18
2015 88.452% 11.45 5.53 10.4 0.76 0.26
2016 45.182% 10.83 4.07 7.73 0.7 0.25
2017 22.075% 14.46 5.64 10.1 0.8 0.21
(Source: Own construction)
T-TEST Table 5. OTP T-Test
ROA ROE
Net
Profit
Margin
Liquidit
y Ratio
Debt
equity
Mean 0.5087645 0.50876 0.508764 0.50876 0.50876
Variance 0.1261812 0.12618 0.126181 0.12618 0.12618
Observations 5 5 5 5 5
Hypothesized
Mean
Difference 0 0 0 0 0
df 4 4 4 4 4
t Stat
-5.516570 -6.4727 -13.6531 - 1.4984
1.94475
P(T<=t) one-tail
0.002635
0.00146
0.000083
0.10418
0.06185
t Critical one-
tail 2.13184676 2.13184 2.131846 2.13184 2.13184
(Source: Own construction)
Page 48
38
The above results are derived from Excel using Data analysis, Since the p value is set at 0.05,
we can see that the P(T<=t) one-tail value is for the ROE (0.002), ROA (0.0014),
Net Profit Margin ratio (0.000083) is smaller than the p-value(0.05) to reject the null
hypothesis, Moreover, the t-value is smaller than the t-critical value, for ROE , ROA, Net
Profit Margin ratio reject the null hypothesis
Page 49
39
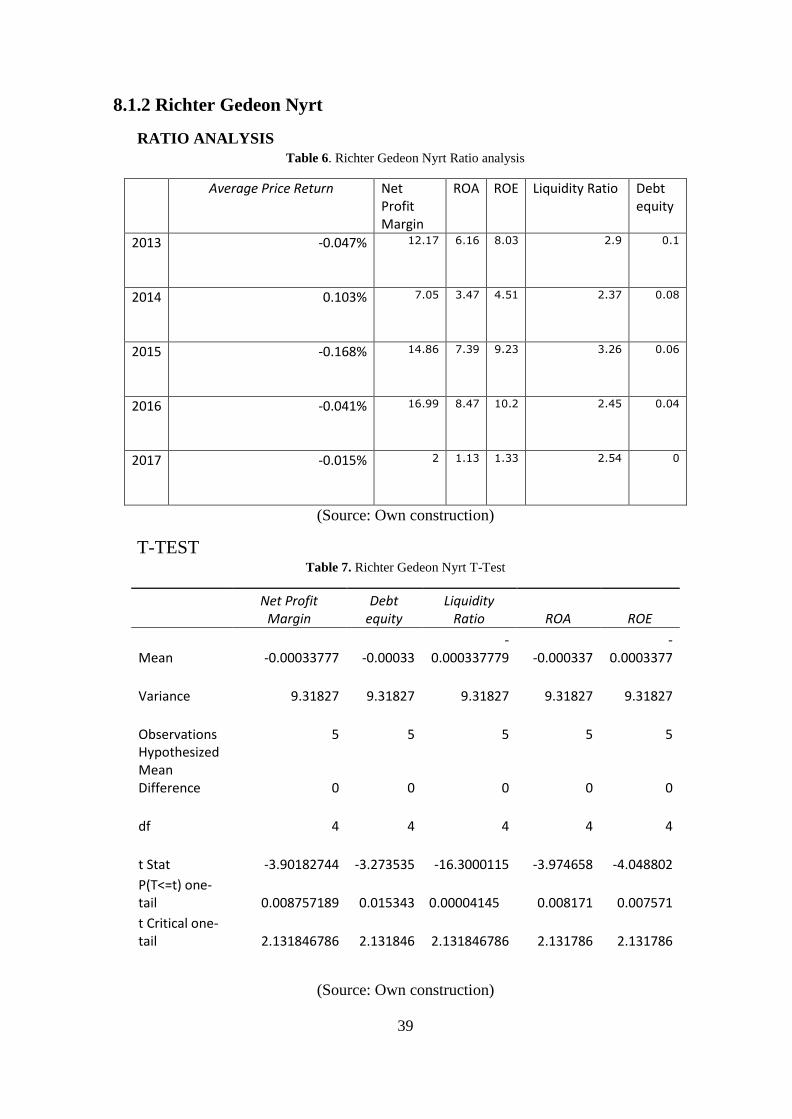
8.1.2 Richter Gedeon Nyrt
RATIO ANALYSIS
Table 6. Richter Gedeon Nyrt Ratio analysis
Average Price Return Net
Profit Margin
ROA ROE Liquidity Ratio Debt equity
2013 -0.047% 12.17 6.16 8.03 2.9 0.1
2014 0.103% 7.05 3.47 4.51 2.37 0.08
2015 -0.168% 14.86 7.39 9.23 3.26 0.06
2016 -0.041% 16.99 8.47 10.2 2.45 0.04
2017 -0.015% 2 1.13 1.33 2.54 0
(Source: Own construction)
T-TEST Table 7. Richter Gedeon Nyrt T-Test
Net Profit
Margin Debt
equity Liquidity
Ratio ROA ROE
Mean -0.00033777 -0.00033 -
0.000337779 -0.000337 -
0.0003377
Variance 9.31827 9.31827 9.31827 9.31827 9.31827
Observations 5 5 5 5 5 Hypothesized Mean Difference 0 0 0 0 0
df 4 4 4 4 4
t Stat -3.90182744 -3.273535 -16.3000115 -3.974658 -4.048802
P(T<=t) one-tail 0.008757189 0.015343
0.00004145 0.008171 0.007571
t Critical one-tail 2.131846786 2.131846 2.131846786 2.131786 2.131786
(Source: Own construction)
Page 50
40
The above results are derived from Excel using Data analysis, Since the p value is set at 0.05,
we can see that the P(T<=t) one-tail value is for all the ratio is smaller than the p-value to
reject the null hypothesis,
ROE (0.0075), Net profit (0.008), ROA (0.0081), Liquidity (0.00004), Debt Equity (0.01)
Moreover, the t-value is smaller than the t-critical value, for all the ratio reject the null
hypothesis
Page 51
41
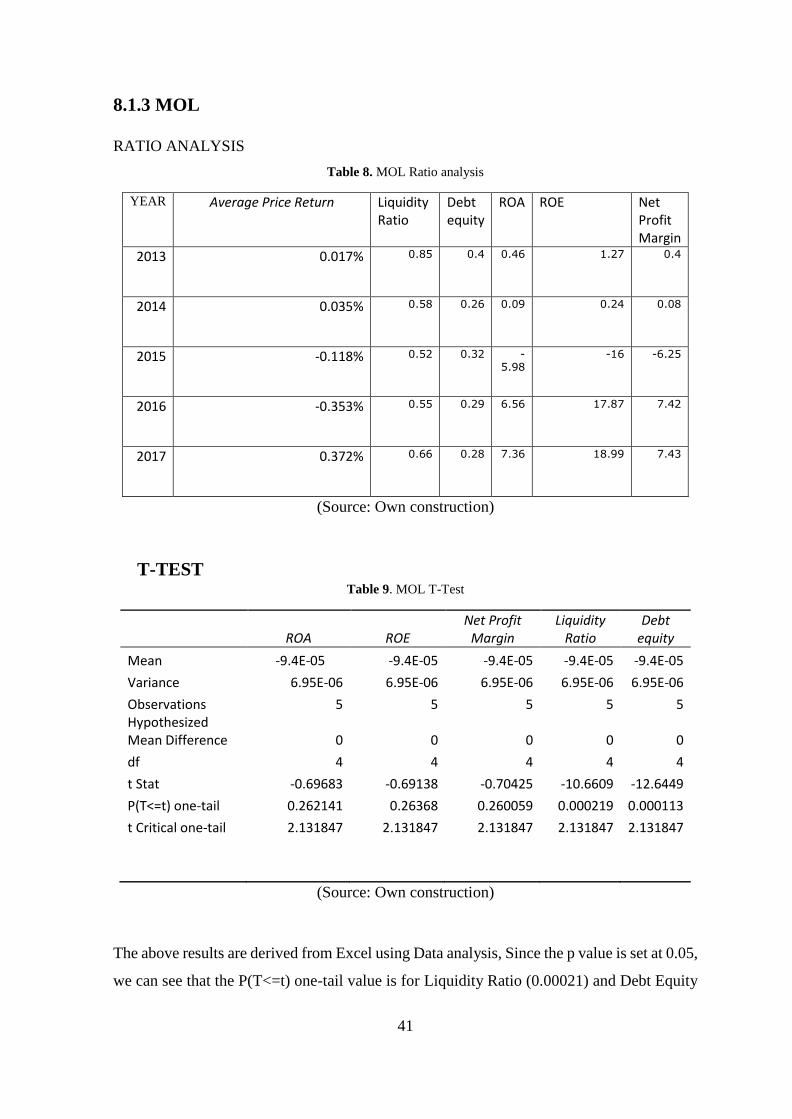
8.1.3 MOL
RATIO ANALYSIS
Table 8. MOL Ratio analysis
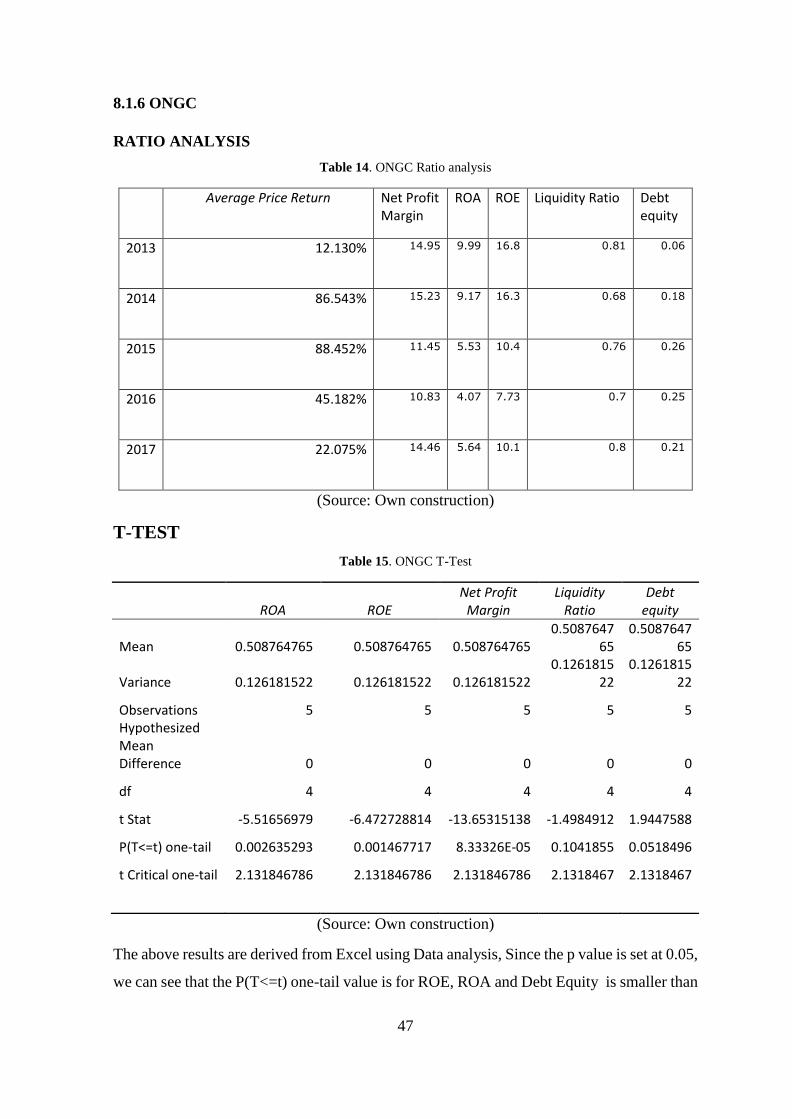
YEAR Average Price Return Liquidity Ratio
Debt equity
ROA ROE Net Profit Margin
2013 0.017% 0.85 0.4 0.46 1.27 0.4
2014 0.035% 0.58 0.26 0.09 0.24 0.08
2015 -0.118% 0.52 0.32 -5.98
-16 -6.25
2016 -0.353% 0.55 0.29 6.56 17.87 7.42
2017 0.372% 0.66 0.28 7.36 18.99 7.43
(Source: Own construction)
T-TEST Table 9. MOL T-Test
ROA ROE Net Profit
Margin Liquidity
Ratio Debt
equity
Mean -9.4E-05 -9.4E-05 -9.4E-05 -9.4E-05 -9.4E-05
Variance 6.95E-06 6.95E-06 6.95E-06 6.95E-06 6.95E-06
Observations 5 5 5 5 5 Hypothesized Mean Difference 0 0 0 0 0
df 4 4 4 4 4
t Stat -0.69683 -0.69138 -0.70425 -10.6609 -12.6449
P(T<=t) one-tail 0.262141 0.26368 0.260059 0.000219 0.000113
t Critical one-tail 2.131847 2.131847 2.131847 2.131847 2.131847
(Source: Own construction)
The above results are derived from Excel using Data analysis, Since the p value is set at 0.05,
we can see that the P(T<=t) one-tail value is for Liquidity Ratio (0.00021) and Debt Equity
Page 52
42
Ratio (0.00011) is smaller than the p-value to reject the null hypothesis for them, Moreover,
the t-value is smaller than the t-critical value, for Liquidity Ratio and Debt Equity Ratio
reject the null hypothesis
Page 53
43
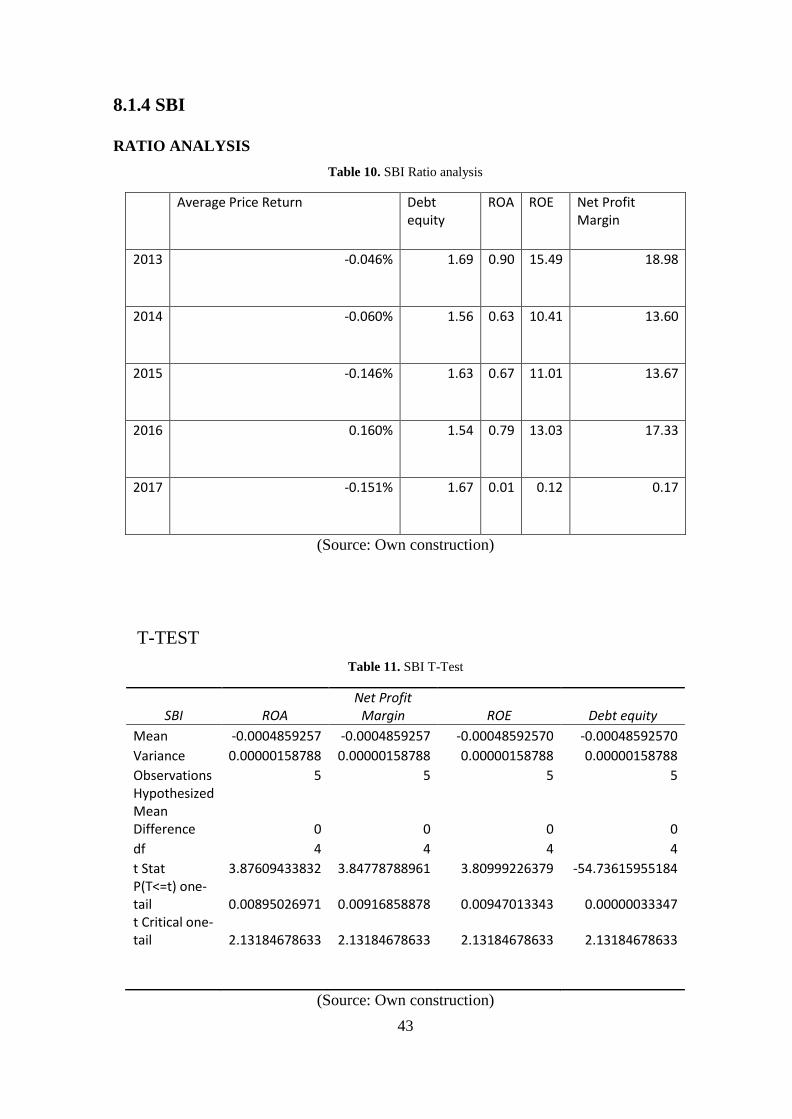
8.1.4 SBI
RATIO ANALYSIS
Table 10. SBI Ratio analysis
Average Price Return Debt
equity ROA ROE Net Profit
Margin
2013 -0.046% 1.69 0.90 15.49 18.98
2014 -0.060% 1.56 0.63 10.41 13.60
2015 -0.146% 1.63 0.67 11.01 13.67
2016 0.160% 1.54 0.79 13.03 17.33
2017 -0.151% 1.67 0.01 0.12 0.17
(Source: Own construction)
T-TEST
Table 11. SBI T-Test
SBI ROA Net Profit
Margin ROE Debt equity
Mean -0.0004859257 -0.0004859257 -0.00048592570 -0.00048592570
Variance 0.00000158788 0.00000158788 0.00000158788 0.00000158788
Observations 5 5 5 5 Hypothesized Mean Difference 0 0 0 0
df 4 4 4 4
t Stat 3.87609433832 3.84778788961 3.80999226379 -54.73615955184 P(T<=t) one-tail 0.00895026971 0.00916858878 0.00947013343 0.00000033347 t Critical one-tail 2.13184678633 2.13184678633 2.13184678633 2.13184678633
(Source: Own construction)
Page 54
44
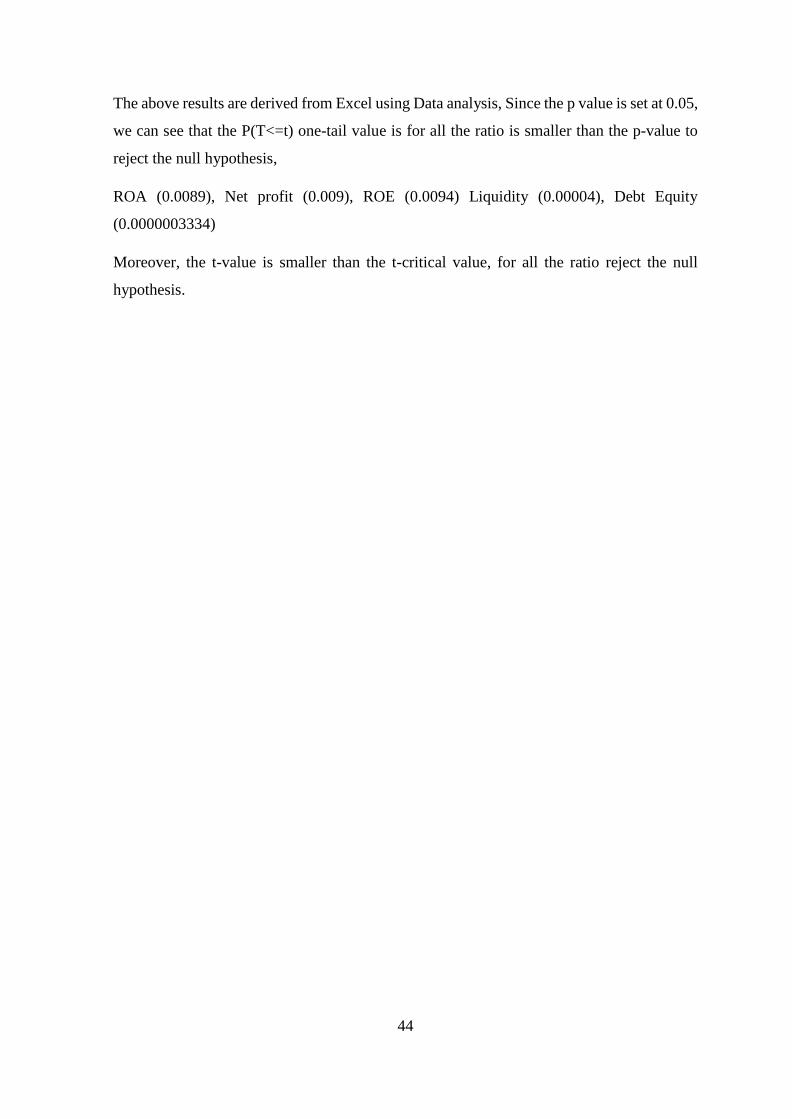
The above results are derived from Excel using Data analysis, Since the p value is set at 0.05,
we can see that the P(T<=t) one-tail value is for all the ratio is smaller than the p-value to
reject the null hypothesis,
ROA (0.0089), Net profit (0.009), ROE (0.0094) Liquidity (0.00004), Debt Equity
(0.0000003334)
Moreover, the t-value is smaller than the t-critical value, for all the ratio reject the null
hypothesis.
Page 55
45
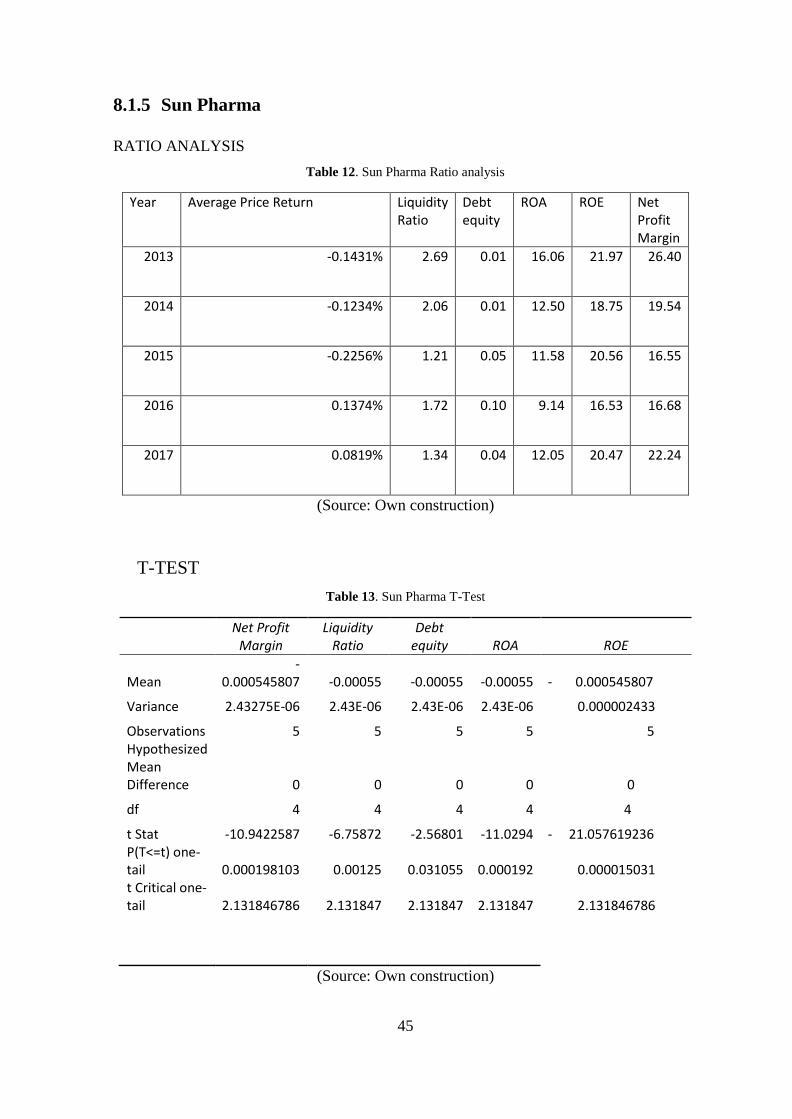
8.1.5 Sun Pharma
RATIO ANALYSIS
Table 12. Sun Pharma Ratio analysis
Year Average Price Return Liquidity Ratio
Debt equity
ROA ROE Net Profit Margin
2013 -0.1431% 2.69 0.01 16.06 21.97 26.40
2014 -0.1234% 2.06 0.01 12.50 18.75 19.54
2015 -0.2256% 1.21 0.05 11.58 20.56 16.55
2016 0.1374% 1.72 0.10 9.14 16.53 16.68
2017 0.0819% 1.34 0.04 12.05 20.47 22.24
(Source: Own construction)
T-TEST
Table 13. Sun Pharma T-Test
Net Profit
Margin Liquidity
Ratio Debt
equity ROA ROE
Mean -
0.000545807 -0.00055 -0.00055 -0.00055 - 0.000545807
Variance 2.43275E-06 2.43E-06 2.43E-06 2.43E-06 0.000002433
Observations 5 5 5 5 5 Hypothesized Mean Difference 0 0 0 0 0
df 4 4 4 4 4
t Stat -10.9422587 -6.75872 -2.56801 -11.0294 - 21.057619236 P(T<=t) one-tail 0.000198103 0.00125 0.031055 0.000192 0.000015031 t Critical one-tail 2.131846786 2.131847 2.131847 2.131847 2.131846786
(Source: Own construction)
Page 56
46
The above results are derived from Excel using Data analysis, Since the p value is set at 0.05,
we can see that the P(T<=t) one-tail value is for all the ratio for Sun Pharma is smaller than
the p-value to reject the null hypothesis,
ROA (0.000192), Net profit (0.000198103), ROE (0.000015031) Liquidity (0.00125), Debt
Equity (0.031055)
Moreover, the t-value is smaller than the t-critical value, for all the ratio reject the null
hypothesis.
Page 57
47
8.1.6 ONGC
RATIO ANALYSIS
Table 14. ONGC Ratio analysis
Average Price Return Net Profit
Margin ROA ROE Liquidity Ratio Debt
equity
2013 12.130% 14.95 9.99 16.8 0.81 0.06
2014 86.543% 15.23 9.17 16.3 0.68 0.18
2015 88.452% 11.45 5.53 10.4 0.76 0.26
2016 45.182% 10.83 4.07 7.73 0.7 0.25
2017 22.075% 14.46 5.64 10.1 0.8 0.21
(Source: Own construction)
T-TEST
Table 15. ONGC T-Test
ROA ROE Net Profit
Margin Liquidity
Ratio Debt
equity
Mean 0.508764765 0.508764765 0.508764765 0.5087647
65 0.5087647
65
Variance 0.126181522 0.126181522 0.126181522 0.1261815
22 0.1261815
22
Observations 5 5 5 5 5 Hypothesized Mean Difference 0 0 0 0 0
df 4 4 4 4 4
t Stat -5.51656979 -6.472728814 -13.65315138 -1.4984912 1.9447588
P(T<=t) one-tail 0.002635293 0.001467717 8.33326E-05 0.1041855 0.0518496
t Critical one-tail 2.131846786 2.131846786 2.131846786 2.1318467 2.1318467
(Source: Own construction)
The above results are derived from Excel using Data analysis, Since the p value is set at 0.05,
we can see that the P(T<=t) one-tail value is for ROE, ROA and Debt Equity is smaller than
Page 58
48
the p-value to reject the null hypothesis, Moreover, the t-value is smaller than the t-critical
value, for ROE, ROA and Debt Equity reject the null hypothesis,
From analyses of taken company we accept our Hypothesis H1: There is significant
relationship between taken companies financial ratios and their stock market price.
Page 59
49
VAR ANALYSIS
8.2.1 HUNGARIAN COMPANIES’ PORTFOLIO
Var analysis measure of the risk of loss for investments. In this analysis portfolio of the stock
prices of Hungarian company (MOL, OTP Bank, Richter Gedeon Nyrt) are analysed.
1january 2018-31march 2018 stock prices is used.
Here it is assumed investor decided to invest 900 euro (300euro in each company) or
281,250.00 Hungarian forints.
Data analysis is done on excel. Using data of 3months. 1 huf= 0.0032 euro
Table 16. Frequency of Hungarians companies Portfolio
Bin
Frequency Cumulative
% -29.12 1 1.67% -20.75 5 10.00% -12.39 3 15.00%
-4.03 15 40.00% 4.33 17 68.33%
12.69 15 93.33% 21.06 1 95.00%
More 3 100.00%
(Source: Own construction)
Page 60
50
Fig.4 . Histogram to show the frequency
(Source: Own construction)
Var 95%= -22.63 euro
Interpretation: histogram is calculated using a series of period of return i.e.,
𝑉𝐴𝑅 = LN(P0 − P1) ∗ portfolio investment
(9)
In worst scenario loss will incur on the portfolio based on the model at 95% of confidence
is -22.63Euro. (In the extreme left corner on the bottom of the histogram highlighted by
dotted line).1
Total portfolio=sum of three investments each day period of return
95% var= =PERCENTILE.EXC (array of total portfolio return,5%).
1 As the stock market price of Hungarian company is in ft in order to analyses the data the Total portfolio is
converted into euro.
12.69 21.06 Mo
4.33
-29.12 -20.75 -12.39 -4.03
Bin
0.00%
20.00%
Frequency
Cumulative 40.00%
60.00%
10
80.00%
14
12
100.00%
16
120.00%
18
Histogram
Figure 4. Histogram Hungarians companies Portfolio
Page 61
51
8.2.2 Indian Companies’ Portfolio
Var analysis measure of the risk of loss for investments. In this analysis portfolio of the stock
prices of Indian company (ONGC, SBI, Sun Pharma) are analysed. 1january 2018-31march
2018 stock prices are used.
Here it is assumed investor decided to invest 900 euro (300euro in each company) or
Rs. 75000
Data analysis is done on excel. Using data of 3months. Rs. 1= 0.012euro
Table 17. Frequency of Indian companies Portfolio
Bin Frequency Cumulative
%
-31.62 1 1.67%
-23.5 1 3.33%
-15.38 6 13.33%
-7.27 11 31.67%
0.85 16 58.33%
8.97 15 83.33%
17.08 4 90.00%
More 6 100.00% (Source: Own Construction)
Page 62
52
(Source: Own construction)
Var 95%= -22.4768 euro
Interpretation: histogram is calculated using a series of period of return i.e.,
=LN(P0-P1) *portfolio investment
In worst scenario loss will incur on the portfolio based on the model at 95% of confidence
is - 22.4768 Euro. (In the extreme left corner on the bottom of the histogram highlighted by
dotted line).
Total portfolio=sum of three investments each day period of return. 95% var
=PERCENTILE.EXC (array of total portfolio return,5%).
As the stock market price of Indian company is in India rupee in order to analyse the data
the Total portfolio is converted into euro. It is concluded that both the portfolio has in
significant difference in their risk, hence we reject our Hypothesis. (H2: Risk involved
investing by portfolio of taken Indian companies of Bombay Stock Exchange is higher than
investing by portfolio of taken Hungarian companies of Budapest Stock Exchange.)
Histogram 18 120.00
% 16
100.00% 14
80.00%
10 60.00%
40.00%
Frequency
Cumulative %
20.00%
0.00% -31.62-23.50-15.38 -7.27 0.85 8.97 17.08
More
Figure 5. Histogram of Indian Companies Portfolio
Page 63
53
8.2.3 BUX VAR
In order to have analysis of stock exchange I have done VAR analyses (Historical
Stimulation) on index of both stock exchange i.e., BUX (for Budapest stock exchange)
Prices of indices were taken i.e., 1 January 2017-31 December 2017.
VAR =PERCENTILE (array,5%)
Var 95%=0.0218
Table 18. Frequency of BUX
Bin Frequency Cumulative %
-0.025 1 0.40%
-0.021 2 1.20%
-0.017 4 2.80%
-0.012 8 6.00%
-0.008 13 11.20%
-0.004 38 26.40%
0.000 44 44.00%
0.005 60 68.00%
0.009 50 88.00%
0.013 19 95.60%
0.018 8 98.80%
0.022 2 99.60%
0.026 0 99.60%
0.031 0 99.60%
0.035 0 99.60%
More 1 100.00%
(Source: Own construction)
Page 64
54
Figure 6. Histogram of BUX
(Source: Own construction)
In worst scenario loss will incur on the portfolio based on the model at 95% of confidence
is Var 95%=0.0218. (In the extreme left corner on the bottom of the histogram highlighted
by dotted line).
0.00%
20.00%
40.00%
60.00%
80.00%
100.00%
120.00%
0
10
20
30
40
50
60
70
-0.0
25
39
05
57
-0.0
21
08
45
96
-0.0
16
77
86
35
-0.0
12
47
26
73
-0.0
08
16
67
12
-0.0
03
86
07
51
0.0
00
44
52
11
0.0
04
75
11
72
0.0
09
05
71
33
0.0
13
36
30
94
0.0
17
66
90
56
0.0
21
97
50
17
0.0
26
28
09
78
0.0
30
58
69
39
0.0
34
89
29
01
Mo
re
Fre
qu
en
cy
Bin
BUX
Frequency
Cumulative %
Page 65
55
8.2.4 SENSEX VAR
In order to have analysis of stock exchange I have done VAR analyses (Historical
Stimulation) on index of both stock exchange i.e., SENSEX (for Bombay stock exchange)
Prices of indices were taken i.e., 1 January 2017-31 December 2017.
VAR =PERCENTILE (array,5%)
Var 95%=0.085
Table 19. Frequency of Sensex
Bin Frequency Cumulative %
-0.01402 1 0.40%
-0.01193 2 1.21%
-0.00983 6 3.64%
-0.00773 8 6.88%
-0.00564 14 12.55%
-0.00354 15 18.62%
-0.00145 29 30.36%
0.000647 42 47.37%
0.002742 45 65.59%
0.004837 25 75.71%
0.006933 22 84.62%
0.009028 19 92.31%
0.011123 12 97.17%
0.013218 3 98.38%
0.015314 2 99.19%
More 2 100.00%
(Source: Own construction)
Page 66
56
Figure 7. Histogram of Sensex
(Source: Own construction)
The above analysis indicates that Sensex is riskier than BUX. As the greater VaR 95%
confidence is riskier.
In worst scenario loss will incur on the portfolio based on the model at 95% of confidence
is Var 95%=0.085. (In the extreme left corner on the bottom of the histogram highlighted by
dotted line).
It is concluded that both the portfolio has in significant difference in their risk, hence we
accept our Hypothesis. (H3: Risk involved in investing in investing in SENSEX (Index of
Bombay stock exchange) is higher than investing in BUX (Index of Budapest Stock
Exchange)
0.00%
20.00%
40.00%
60.00%
80.00%
100.00%
120.00%
0
5
10
15
20
25
30
35
40
45
50-0
.01
40
20
37
7
-0.0
11
92
50
81
-0.0
09
82
97
85
-0.0
07
73
44
89
-0.0
05
63
91
93
-0.0
03
54
38
97
-0.0
01
44
86
02
0.0
00
64
66
94
0.0
02
74
19
9
0.0
04
83
72
86
0.0
06
93
25
82
0.0
09
02
78
78
0.0
11
12
31
74
0.0
13
21
84
7
0.0
15
31
37
66
Mo
re
Fre
qu
en
cy
Bin
SENSEX
Frequency
Cumulative %
Page 67
57
9. Conclusion
Both India and Hungary are developing countries. By surface comparison of the market
capitalization and the market size of Bombay stock exchange with Budapest stock exchange,
it might seem that the former is stronger as it is more liquid and is the world’s 3rd largest
stock exchange on investor’s basis. Due to high economic growth and large market size,
Bombay stock exchange have large volume of trade, traded on the exchange.
Unfortunately, Budapest stock exchange have not fully recovered yet from the global crises
which is also one of the main reasons that its economic growth is slower than the Bombay
stock exchange. However, this is compensated by the fact that Hungary is a member of
European Union and this provides the companies listed in Budapest stock exchange, highly
competitive advantages to have easy trade with other countries. The VaR analysis at 95%
confidence for Hungarian company portfolio was -22.63 Euro and for Indian company
portfolio was -22.4768 Euro. Thus, it can be concluded that the risk associated on investment
in Oil, Banking and Pharmaceutical industries of India and Hungary do not have significant
difference. This value also shows that presently both the markets are financially stable.
Despite of large market size and high economic growth, the hypothesis of Bombay stock
exchange being less risky than Budapest stock exchange in Oil, Banking and Pharmaceutical
industries is not true.
Financial results have become an important indicator for business valuation. The Average
Price Return have the significant influence on the Ratios represents the aggregate value of a
company or stock. The purpose of this study is to analyse the relationship between the
Financial Ratio and the Average Price Return of the chosen companies from the two Stock
Exchanges. From T-test we have proved that all the Hypothesis of this study is correct there
is significant relationship between the Ratio and Prices, Analysis of Ratio and Prices is
beneficial for the investor to take decision of investment for both the market
The analysis of each company provided further insight. Richter Gedeon Nyrt have sufficient
current assets to cover its liabilities and its debt ratio shows that presently the company is
always below the threshold which is good for the company.However, the profit margin ROA,
ROE has decreased from previous years. The return on equity has increased which indicates
that the money of shareholders is efficiently used by the Richter Gedeon Nyrt.
The current ratio and quick ratio of Sun Pharma is more than ideal ratio which indicates that
the company have ability to pay-off its current debt with its current asset without selling its
Page 68
58
long-term asset in order to have smooth functioning of daily operations of business. The
Debt-equity ratio show that the sun pharma is lower which is beneficial for the company as
it is important for a company to receive payment from its debtor in order to have smooth
functioning of business. Therefore, from the Ratio analysis of Sun Pharma, it can be
concluded that the company is in good financial position.
Mol, it has improving from previous years its Liquidity ratio But still less than the ideal ratio.
However, the overall liquidity ratio of company is less than the ideal ratio. This shows
company does have sufficient current asset to pay off its debts. Though the efficiency ratio
and financial ratio have reached to its ideal ratio but still has not reached to the same level
as in 2015. The current ratio of is Mol lower than ONGC, still it is aligned with the ideal
ratio but the quick ratio is less than 1 which is not beneficial for the company. The financial
ratio is according to the ideal ratio which reflects that the company is less risky. ONGC is
using its funds wisely which was concluded by calculating its profit ratios.
Financial ratio of the OTP improved in 2016 but the in 2017 it decreased again which created
a negative impact on the good will of the company. On the other hand, State Bank of India
debt equity ratio is high shows that it doesn’t have sufficient current asset to pay off its
debts.in 2017 has been improved from previous year. Net profit margin for SBI have good
but in 2017 OTP was better. The ROE, ROA of OTP is better than SBI.
From the analysis we accept
➢ H1: There is significant relationship between taken companies financial ratios and
their stock market price.
➢ H3: Risk involved in investing in investing in SENSEX (Index of Bombay stock
exchange) is higher than investing in BUX (Index of Budapest Stock Exchange).
And we reject
➢ H2: Risk involved investing by portfolio of taken Indian companies of Bombay Stock
Exchange is higher than investing by portfolio of taken Hungarian companies of
Budapest Stock Exchange.
Page 69
59
References BENCHMARKING. (2017, 03). World Travel & Tourism. Retrieved from www.wttc.org:
https://www.wttc.org/-/media/files/reports/benchmark-reports/country-reports-
2017/india.pdf
BET. (2019). A BÉT piacfejlesztési programja kis és közepes tőkeértékű részvényekre.
Retrieved from Budapest Stock Exchange Zrt: https://bet.hu/Kibocsatok/BET-
elemzesek/A-BET-piacfejlesztesi-programja-kis-es-kozepes-tokeerteku-
reszvenyekre
Bombay Stock Exchange. (2019, 03). Bombay Stock Exchange (BSE) Overview. Retrieved
from Bombay Stock Exchange: https://www.stockmarketclock.com/exchanges/bse-
bombay#national-statistics
Dr. Mohammad Abdelkarim Yousef Almumani. (April 2018). An Empirical Study on
Effect of Profitability Ratios & Market Value Ratios on Market Capitalization of
Commercial Banks in Jordan. International Journal of Business and Social Science,
Vol. 9 No. 4 .
Duca, G. (2017). the relationship between the stock market and the economy: experience
from international financial markets. Bank of Valletta Review, No.36 .
Economics .T. (2019). Hungary Gross External Debt. Retrieved from
https://tradingeconomics.com/: https://tradingeconomics.com/hungary/external-
debt
GAUTAMI, D. S., & KALYAN, D. N. (2018). A Comparative Study on Risk & Return
Analysis of Selected Stocks in India. International Journal of Management and
Economics, 1730-1736.
glynholton. (2017, 10 10). https://www.glynholton.com/. Retrieved from
https://www.glynholton.com/: https://www.glynholton.com/blog/risk-
measurement/var_measure/
Jaya, M. &. (2012). A Study On The Relationship Of Market Capitalization And Macro
Economic Factors (With Special Reference To Indian Information Technology
Industry). Zenith International Journal Of Business Economics & Management
Research.
Keith Chauvin, M. H. (1993). Advertising R&D Expenditures and the Market Value of the
Firm. Financial Management. 128-140.
ko, K. (2009). Multiple Regression Model for Market Capitalization. Journal of Global
Business Issues, 21: 16-20.
ksh. (2019, 04 23). Hungarian Central Statistical Office. Retrieved from
http://www.ksh.hu: http://www.ksh.hu/gyorstajekoztatok/#/en/home
LAI Ping-fu (Brian), C. K.-y. (2016). Relationships Between Stock Returns and Corporate
Financial Ratios Based on a Statistical Analysis of Corporate Data from the Hong
Kong Stock Market. Public Finance Quarterly.
Page 70
60
Li*, X. (2015). Research on Financial Risk Management Based on VAR Model, . The
Open Cybernetics & Systemics Journal, 9, 1849-1852.
Linda. (2019). essay.uk. Retrieved from http://www.essay.uk.com/:
http://www.essay.uk.com/essays/finance/essays-the-state-bank-of-india-sbi-
products/
Lo, S.-F. (2013). Which stock exchanges are more attractive?The competition analysis of
listing and trading performance. Economic Modelling, 501– 509.
MacKenzie, C. (2015). Summarizing risk using risk measures and risk indices. Risk
Analysis,, 34(12), 2143-2162,.
Masoud, N. M. (2003). The Impact of Stock Market Performance upon Economic Growth.
International Journal of Economics and Financial Issues, Vol. 3, Issue 4, 788 -
798.
Meri, E., Kamışlı', M., & Temizel, F. (November 2017). Interactions among Stock Price
and Financial Ratios: The Case of Turkish. Applied Economics and Finance, Vol.
4, No. 6;.
Minitab Blog Editor. (2016, 12 20). Understanding t-Tests: t-values and t-distributions.
Retrieved from https://blog.minitab.com: https://blog.minitab.com/blog/adventures-
in-statistics-2/understanding-t-tests-t-values-and-t-distributions
molgroup. (2019). MOL. Retrieved from https://molgroup.info: https://molgroup.info/en/
MUSALLAM, S. R. (2018). Exploring the Relationship between Financial Ratios and
Market Stock Returns. Eurasian Journal of Business and Economics, 101-116.
OEC. (2017). OEC - India (IND) Exports, Imports, and Trade Partners. Retrieved from
https://atlas.media.mit.edu: https://atlas.media.mit.edu/en/profile/country/ind/
Oil and Natural Gas Corporation Limited. (2019). Oil and Natural Gas Corporation
Limited. Retrieved from www.ongcindia.com:
https://www.ongcindia.com/wps/wcm/connect/en/home/
Omran, M., & Ragab, A. (2004). Linear versus non-linear relationships between financial
ratios and stock returns: empirical evidence from Egyptian firms. Review of
Accounting and Finance, 84-102.
OTP. (2019). OTP Bank. Retrieved from www.otpbank.hu:
https://www.otpbank.hu/portal/en/Investor_relations
Prasad, H. &. (2015). An Empirical Study on Effect of Profitability and Market Value
Ratios on Market Capitalization of Infrastructural Companies In India.GJRA-
Global Journal for Research Analyses. Volume 4( Issue 5) 95-97.
Ramona Birăua, J. T. (2015). Modelling S&P Bombay Stock Exchange BANKEX Index
Volatility Patterns Using GARCH Model. Procedia Economics and Finance 32,
520 – 525.
Page 71
61
Richter. (2019). richter.hu. Retrieved from www.richter.hu: https://www.richter.hu/hu-
HU/Befektetok/jelentesek/Pages/default.aspx
Shah., K. a. (2009). Expanding The Role Of Marketing: From Customer Equity To Market
Capitalization. . Journal of Marketing, 73.6: 119-136.
sunpharma. (2019). sunpharma. Retrieved from www.sunpharma.com:
http://www.sunpharma.com/
Vinay Kaura. (n.d.). Portfolio Optimisation Using Value at Risk.
worldbank. (2019). Listed domestic companies. Retrieved from https://data.worldbank.org:
https://data.worldbank.org/indicator/CM.MKT.LDOM.NO
Yahoo Finance. (n.d.). Retrieved from https://finance.yahoo.com/?guccounter=1
Page 72
62
Appendix Hungarian VaR model working
Date Prices Period retu eriod retu eriod retu eriod retu eriod retu Period return PORTFOLIO
(yyymmdd) otp mol Richter otp mol Richter otp mol Richter Total portfolio euro
total % of return
Mar 29, 20
11,420.00 2,772.00 5,305.00 1.41% 1.09% 0.76% 1322.77 1020.14 709.56 3052.47 9.77 3.26%
Mar 28, 20
11,260.00 2,742.00 5,265.00 -0.62% -2.95% -1.69% -581.01 -2762.51 -1589.02 -4932.54 -15.78 -5.26%
Mar 27, 20
11,330.00 2,824.00 5,355.00 -0.18% 0.07% 2.94% -165.34 66.42 2753.63 2654.71 8.50 2.83%
Mar 26, 20
11,350.00 2,822.00 5,200.00 0.44% 0.07% 0.77% 413.91 66.47 723.94 1204.32 3.85 1.28%
Mar 23, 20
11,300.00 2,820.00 5,160.00 -0.88% -0.57% -2.68% -826.00 -530.41 -2509.71 -3866.12 -12.37 -4.12%
Mar 22, 20
11,400.00 2,836.00 5,300.00 -1.65% -3.87% -2.33% -1549.62 -3631.16 -2185.41 -7366.19 -23.57 -7.86%
Mar 21, 20
11,590.00 2,948.00 5,425.00 1.22% 1.92% -1.55% 1139.34 1798.00 -1457.51 1479.83 4.74 1.58%
Mar 20, 20
11,450.00 2,892.00 5,510.00 1.23% -0.28% 1.19% 1153.35 -258.98 1112.52 2006.89 6.42 2.14%
Mar 19, 20
11,310.00 2,900.00 5,445.00 -3.65% -3.79% -2.27% -3418.35 -3552.52 -2127.87 -9098.74 -29.12 -9.71%
Mar 14, 20
11,730.00 3,012.00 5,570.00 2.07% 0.27% -1.51% 1938.05 249.34 -1419.85 767.54 2.46 0.82%
Mar 13, 20
11,490.00 3,004.00 5,655.00 -0.26% -0.33% -0.18% -244.46 -311.57 -165.64 -721.66 -2.31 -0.77%
Mar 12, 20
11,520.00 3,014.00 5,665.00 1.49% 1.20% 0.09% 1393.77 1126.52 82.78 2603.07 8.33 2.78%
Mar 09, 20
11,350.00 2,978.00 5,660.00 -0.70% -0.87% -1.14% -658.48 -814.95 -1070.50 -2543.92 -8.14 -2.71%
Mar 08, 20
11,430.00 3,004.00 5,725.00 0.79% 2.15% 0.44% 741.11 2018.92 410.29 3170.32 10.15 3.38%
Mar 07, 20
11,340.00 2,940.00 5,700.00 1.06% 2.20% -3.02% 997.35 2063.36 -2834.99 225.72 0.72 0.24%
Mar 06, 20
11,220.00 2,876.00 5,875.00 1.35% 3.76% 4.70% 1261.80 3520.60 4410.66 9193.06 29.42 9.81%
Mar 05, 20
11,070.00 2,770.00 5,605.00 -0.18% 1.90% 1.80% -169.22 1776.66 1687.71 3295.15 10.54 3.51%
Mar 02, 20
11,090.00 2,718.00 5,505.00 -1.96% -3.26% -2.33% -1841.58 -3054.02 -2188.16 -7083.75 -22.67 -7.56%
Mar 01, 20
11,310.00 2,808.00 5,635.00 -1.67% -0.28% -0.80% -1561.85 -266.71 -745.70 -2574.26 -8.24 -2.75%
Feb 28, 20
11,500.00 2,816.00 5,680.00 -0.35% -0.57% -2.09% -325.52 -531.16 -1960.00 -2816.69 -9.01 -3.00%
Feb 27, 20
11,540.00 2,832.00 5,800.00 0.35% 1.14% -4.71% 325.52 1065.35 -4420.01 -3029.14 -9.69 -3.23%
Feb 26, 20
11,500.00 2,800.00 6,080.00 1.58% 1.08% 0.83% 1479.00 1009.88 774.16 3263.04 10.44 3.48%
Feb 23, 20
11,320.00 2,770.00 6,030.00 -1.49% -1.29% -0.25% -1397.44 -1210.56 -232.92 -2840.92 -9.09 -3.03%
Feb 22, 20
11,490.00 2,806.00 6,045.00 -0.87% -1.35% -0.58% -812.40 -1261.08 -541.24 -2614.72 -8.37 -2.79%
Feb 21, 20
11,590.00 2,844.00 6,080.00 1.57% -1.19% 3.01% 1467.42 -1114.13 2817.41 3170.69 10.15 3.38%
Feb 20, 20
11,410.00 2,878.00 5,900.00 -1.65% -0.62% 0.00% -1548.28 -584.52 0.00 -2132.79 -6.82 -2.27%
Feb 19, 20
11,600.00 2,896.00 5,900.00 -1.28% 0.97% -0.76% -1204.51 910.83 -712.33 -1006.01 -3.22 -1.07%
Feb 16, 20
11,750.00 2,868.00 5,945.00 2.59% 0.00% 2.99% 2424.70 0.00 2801.10 5225.81 16.72 5.57%
Feb 15, 20
11,450.00 2,868.00 5,770.00 -1.13% -1.04% 4.43% -1058.41 -975.56 4152.58 2118.61 6.78 2.26%
Feb 14, 20
11,580.00 2,898.00 5,520.00 -0.17% 0.07% 0.36% -161.78 64.72 340.29 243.24 0.78 0.26%
Feb 13, 20
11,600.00 2,896.00 5,500.00 1.74% -0.28% -1.80% 1630.48 -258.62 -1689.23 -317.38 -1.02 -0.34%
Feb 12, 20
11,400.00 2,904.00 5,600.00 1.77% 1.60% -6.65% 1659.34 1496.91 -6233.41 -3077.17 -9.85 -3.28%
Feb 09, 20
11,200.00 2,858.00 5,985.00 0.72% -1.11% -6.78% 672.05 -1043.85 -6358.37 -6730.17 -21.54 -7.18%
Feb 08, 20
11,120.00 2,890.00 6,405.00 -2.31% -3.13% -1.86% -2166.76 -2937.91 -1740.19 -6844.86 -21.90 -7.30%
Feb 07, 20
11,380.00 2,982.00 6,525.00 3.40% 1.08% 3.19% 3183.95 1011.47 2992.66 7188.09 23.00 7.67%
Feb 06, 20
11,000.00 2,950.00 6,320.00 -3.40% -2.68% -1.26% -3183.95 -2508.51 -1179.26 -6871.72 -21.99 -7.33%
Feb 05, 20
11,380.00 3,030.00 6,400.00 -0.70% -0.33% -0.08% -656.75 -308.90 -73.21 -1038.86 -3.32 -1.11%
Feb 02, 20
11,460.00 3,040.00 6,405.00 -0.87% -1.31% -0.23% -814.51 -1225.51 -219.30 -2259.32 -7.23 -2.41%
Feb 01, 20
11,560.00 3,080.00 6,420.00 -0.26% 0.85% -0.08% -242.98 794.76 -72.99 478.79 1.53 0.51%
Jan 31, 20
11,590.00 3,054.00 6,425.00 1.65% 0.59% -0.39% 1549.62 554.19 -364.08 1739.73 5.57 1.86%
Page 73
63
Jan 30, 20
11,400.00 3,036.00 6,450.00 -1.39% -2.09% -0.70% -1306.64 -1955.74 -651.80 -3914.18 -12.53 -4.18%
Jan 29, 20
11,560.00 3,100.00 6,495.00 0.35% -1.22% -2.36% 324.96 -1142.21 -2211.02 -3028.27 -9.69 -3.23%
Jan 26, 20
11,520.00 3,138.00 6,650.00 1.66% 0.83% 0.08% 1559.12 780.00 70.52 2409.64 7.71 2.57%
Jan 25, 20
11,330.00 3,112.00 6,645.00 -1.75% -1.85% -0.38% -1640.46 -1731.19 -352.05 -3723.69 -11.92 -3.97%
Jan 24, 20
11,530.00 3,170.00 6,670.00 -1.72% -0.94% -1.56% -1612.25 -883.05 -1464.33 -3959.63 -12.67 -4.22%
Jan 23, 20
11,730.00 3,200.00 6,775.00 3.29% 0.13% -0.07% 3087.37 117.26 -69.16 3135.47 10.03 3.34%
Jan 22, 20
11,350.00 3,196.00 6,780.00 3.41% 3.11% 1.19% 3192.51 2919.68 1112.77 7224.97 23.12 7.71%
Jan 19, 20
10,970.00 3,098.00 6,700.00 0.55% 2.09% 0.15% 514.17 1957.02 140.03 2611.22 8.36 2.79%
Jan 18, 20
10,910.00 3,034.00 6,690.00 -0.27% 0.60% 0.22% -257.44 557.85 210.44 510.85 1.63 0.54%
Jan 17, 20
10,940.00 3,016.00 6,675.00 -0.36% 0.20% -0.37% -342.15 186.69 -350.47 -505.93 -1.62 -0.54%
Jan 16, 20
10,980.00 3,010.00 6,700.00 1.10% -0.20% -0.52% 1030.23 -186.69 -488.46 355.08 1.14 0.38%
Jan 15, 20
10,860.00 3,016.00 6,735.00 -0.64% -0.92% -0.59% -602.34 -866.34 -555.15 -2023.83 -6.48 -2.16%
Jan 12, 20
10,930.00 3,044.00 6,775.00 -0.09% 0.66% 0.67% -85.73 618.00 624.77 1157.04 3.70 1.23%
Jan 11, 20
10,940.00 3,024.00 6,730.00 1.38% -0.20% -0.44% 1294.31 -185.83 -416.98 691.51 2.21 0.74%
Jan 10, 20
10,790.00 3,030.00 6,760.00 -0.55% -1.70% 0.89% -519.87 -1595.26 835.82 -1279.32 -4.09 -1.36%
Jan 09, 20
10,850.00 3,082.00 6,700.00 -1.10% -0.26% -0.74% -1031.17 -243.03 -697.03 -1971.24 -6.31 -2.10%
Jan 08, 20
10,970.00 3,090.00 6,750.00 0.27% 0.32% 0.22% 256.73 303.89 208.57 769.19 2.46 0.82%
Jan 05, 20
10,940.00 3,080.00 6,735.00 -0.18% 0.59% 0.97% -171.23 549.50 909.18 1287.45 4.12 1.37%
Jan 04, 20
10,960.00 3,062.00 6,670.00 1.10% 0.52% -0.52% 1032.12 491.16 -490.66 1032.63 3.30 1.10%
Jan 03, 20
10,840.00 3,046.00 6,705.00 0.37% 0.59% 0.52% 346.58 555.65 490.66 1392.88 4.46 1.49%
Page 74
64
India var model working
Date
(yyymmdd)
Prices
SBI
ONGC SUN PHARMA
Period return
SBI
Period return
ONGC
Period return
SUN PHARMA
Period return eriod retu
SBI ONGC
Period return
SUN PHARMA
PORTFOLIO
Total portfolio
euro
total % of
4/2/2018 246.3 180 507.799988 -1.53% 1.23% 2.47% -382.7636142 307.4378 618.0535174 542.7276766 6.5127321 2.17%
3/28/2018 250.1 177.8 495.399994 -1.49% -1.01% -1.97% -372.0675789 -251.821 -492.1962835 -1116.085095 -13.393021
-4.46%
3/27/2018 253.85 179.6 505.25 3.00% 0.53% 0.35% 749.7562921 132.591 86.74110313 969.088355 11.62906 3.88%
3/26/2018 246.35 178.65 503.5 4.89% 0.79% 0.34% 1221.783789 196.6846 84.55255351 1503.020979 18.036252 6.01%
3/23/2018 234.6 177.25 501.799988 -2.94% -0.81% -1.22% -735.0382275 -203.681 -304.5357786 -1243.255005 -14.91906 -4.97%
3/22/2018 241.6 178.7 507.950012 -2.49% 1.84% 0.64% -623.3708372 458.858 160.470601 -4.042225061 -0.0485067
-0.02%
3/21/2018 247.7 175.45 504.700012 -0.62% 0.77% -0.82% -155.9521115 193.1051 -204.7268077 -167.5738268 -2.0108859
-0.67%
3/20/2018 249.25 174.1 508.850006 0.46% -1.43% 2.18% 115.612349 -356.436 543.8511958 303.0275221 3.6363303 1.21%
3/19/2018 248.1 176.6 497.899994 -1.80% -0.45% -1.08% -449.3829697 -112.993 -269.6787086 -832.054526 -9.9846543
-3.33%
3/16/2018 252.6 177.4 503.299988 -0.59% -2.28% -2.67% -148.0170067 -571.215 -666.5772173 -1385.809665 -16.629716
-5.54%
3/15/2018 254.1 181.5 516.900024 -1.13% 0.50% -0.78% -283.7042739 124.2745 -195.1153065 -354.5450929 -4.2545411
-1.42%
3/14/2018 257 180.6 520.950012 0.82% -1.54% -0.37% 205.1199263 -384.621 -93.40490497 -272.9063012 -3.2748756
-1.09%
3/13/2018 254.9 183.4 522.900024 0.81% -0.14% 2.02% 201.8709147 -34.0553 504.6779599 672.4935624 8.0699227 2.69%
3/12/2018 252.85 183.65 512.450012 -0.12% 2.20% 1.11% -29.64308648 550.5315 277.1685981 798.0569975 9.576684 3.19%
3/9/2018 253.15 179.65 506.799988 -1.41% -0.28% -1.68% -353.0168524 -69.4831 -420.6730004 -843.1729459 -10.118075
-3.37%
3/8/2018 256.75 180.15 515.400024 4.01% -0.44% -1.86% 1003.313636 -110.773 -466.1332539 426.407144 5.1168857 1.71%
3/7/2018 246.65 180.95 525.099976 -3.92% -2.35% -1.25% -978.9590314 -587.138 -312.2692035 -1878.366504 -22.540398
-7.51%
3/6/2018 256.5 185.25 531.700012 -2.81% -0.13% -2.99% -701.5632546 -33.7154 -748.0509991 -1483.3297 -17.799956
-5.93%
3/5/2018 263.8 185.5 547.849976 0.47% -2.16% 2.47% 118.7425104 -539.949 616.7438145 195.5369313 2.3464432 0.78%
3/1/2018 262.55 189.55 534.5 -2.33% 0.56% -0.16% -583.5021266 138.8713 -39.72408272 -484.3549368 -5.8122592
-1.94%
2/28/2018 268.75 188.5 535.349976 0.35% 0.05% -1.77% 88.52977486 13.26691 -442.0410465 -340.2443568 -4.0829323
-1.36%
2/27/2018 267.8 188.4 544.900024 -2.56% -1.24% -2.04% -640.5301209 -309.908 -510.893739 -1461.332357 -17.535988
-5.85%
2/26/2018 274.75 190.75 556.150024 -0.49% 0.39% -2.49% -122.5386846 98.48995 -623.7278083 -647.7765428 -7.7733185
-2.59%
2/23/2018 276.1 190 570.200012 1.28% 2.02% 5.04% 318.9399849 505.0681 1261.110933 2085.119004 25.021428 8.34%
2/22/2018 272.6 186.2 542.150024 -0.18% -2.07% 3.26% -45.81272942 -518.223 815.5200371 251.4839996 3.017808 1.01%
2/21/2018 273.1 190.1 524.75 1.27% 1.64% -6.39% 317.8312729 411.0416 -1598.571624 -869.6987463 -10.436385
-3.48%
2/20/2018 269.65 187 559.400024 0.74% 1.10% -0.61% 186.1166278 275.5779 -153.7074122 307.9870854 3.695845 1.23%
2/19/2018 267.65 184.95 562.849976 -1.52% -0.89% -2.17% -380.0597895 -222.045 -542.6176777 -1144.72293 -13.736675
-4.58%
2/16/2018 271.75 186.6 575.200012 -2.58% -0.96% -0.36% -644.7874588 -240 -88.94052414 -973.7282261 -11.684739
-3.89%
2/15/2018 278.85 188.4 577.25 0.74% 1.36% 0.49% 184.471099 340.685 121.5591511 646.7152819 7.7605834 2.59%
2/14/2018 276.8 185.85 574.450012 -4.14% -2.65% -2.56% -1034.997639 -663.697 -640.177794 -2338.872473 -28.06647 -9.36%
2/12/2018 288.5 190.85 589.349976 -2.70% 1.64% 1.14% -675.3696808 409.413 285.8372435 19.88056235 0.2385667 0.08%
2/9/2018 296.4 187.75 582.650024 -1.69% -0.43% -0.13% -422.3582891 -106.299 -32.15985903 -560.8168724 -6.7298025
-2.24%
2/8/2018 301.45 188.55 583.400024 2.93% -0.66% 6.13% 732.1300566 -165.192 1533.030816 2099.969313 25.199632 8.40%
2/7/2018 292.75 189.8 548.700012 0.43% 2.21% -0.58% 106.9749172 552.6938 -145.3761999 514.2925592 6.1715107 2.06%
2/6/2018 291.5 185.65 551.900024 -2.10% -1.71% -0.94% -526.1575635 -427.248 -234.4450004 -1187.85088 -14.254211
-4.75%
2/5/2018 297.7 188.85 557.099976 0.27% -1.89% 1.07% 67.27366925 -472.082 268.4416498 -136.3667612 -1.6364011
-0.55%
2/2/2018 296.9 192.45 551.150024 -2.87% -1.37% -0.92% -717.9507627 -341.898 -230.2696381 -1290.118257 -15.481419
-5.16%
2/1/2018 305.55 195.1 556.25 -2.33% -4.14% -4.07% -582.268932 -1035.41 -1017.222763 -2634.901282 -31.618815
-10.54%
1/31/2018 312.75 203.35 579.349976 -0.03% -0.22% -2.04% -7.992806897 -55.2618 -510.4184629 -573.673111 -6.8840773
-2.29%
1/30/2018 312.85 203.8 591.299988 0.56% -0.56% 0.72% 140.2359608 -140.672 180.3376974 179.9012382 2.1588149 0.72%
1/29/2018 311.1 204.95 587.049988 -0.66% -1.60% 1.09% -164.1966655 -399.331 271.8920398 -291.6358441 -3.4996301
-1.17%
1/25/2018 313.15 208.25 580.700012 -5.09% -1.07% -0.93% -1272.351603 -268.659 -231.4022373 -1772.413142 -21.268958
-7.09%
1/24/2018 329.5 210.5 586.099976 3.55% 1.60% 1.37% 888.1242791 401.0628 343.588999 1632.776117 19.593313 6.53%
1/23/2018 318 207.15 578.099976 3.76% 3.54% 0.31% 941.240523 884.3955 77.96212382 1903.598129 22.843178 7.61%
1/22/2018 306.25 199.95 576.299988 -0.91% 3.23% 0.75% -227.5318854 806.8279 187.233656 766.5296319 9.1983556 3.07%
1/19/2018 309.05 193.6 572 2.06% -0.23% -0.74% 514.8913711 -58.0417 -185.0650733 271.7846118 3.2614153 1.09%
1/18/2018 302.75 194.05 576.25 -1.18% -0.82% -1.22% -295.5219081 -205.286 -306.1428454 -806.9508714 -9.6834105
-3.23%
1/17/2018 306.35 195.65 583.349976 3.39% -0.74% 0.90% 846.5549074 -184.598 226.0121389 887.968881 10.655627 3.55%
1/16/2018 296.15 197.1 578.099976 -2.04% 0.28% 0.29% -509.7106758 69.85944 73.62292025 -366.2283188 -4.3947398
-1.46%
1/15/2018 302.25 196.55 576.400024 0.15% -1.86% -1.35% 37.24957306 -466.243 -338.1766914 -767.1700888 - -3.07%
Page 75
65
9.2060411
1/12/2018 301.8 200.25 584.25 -0.07% 1.26% -0.71% -16.56277006 314.0745 -176.9514024 120.56031 1.4467237 0.48%
1/11/2018 302 197.75 588.400024 0.32% 0.20% 0.47% 78.76733312 50.61935 117.1161755 246.502862 2.9580343 0.99%
1/10/2018 301.05 197.35 585.650024 -1.06% 0.23% -0.20% -264.3351954 57.07193 -51.17067885 -258.4339408 -3.1012073
-1.03%
1/9/2018 304.25 196.9 586.849976 -0.46% -0.13% -0.87% -114.7726244 -31.7219 -216.324562 -362.8190543 -4.3538287
-1.45%
1/8/2018 305.65 197.15 591.950012 -0.18% -0.28% 2.26% -44.94713923 -69.6471 563.7896682 449.1954012 5.3903448 1.80%
1/5/2018 306.2 197.7 578.75 -0.60% -0.83% -0.39% -150.5886523 -207.785 -97.00378629 -455.3771617 -5.4645259
-1.82%
1/4/2018 308.05 199.35 581 1.70% 2.88% 2.04% 425.6103817 718.7887 510.7762977 1655.175404 19.862105 6.62%
1/3/2018 302.85 193.7 569.25 -0.02% -1.66% -0.39% -4.126124648 -415.983 -98.61945728 -518.7285634 -6.2247428
-2.07%
1/2/2018 302.9 196.95 571.5 -1.36% 2.34% -0.37% -340.1965867 584.3342 -91.69410524 152.4434865 1.8293218 0.61%
1/1/2018 307.05 192.4 573.599976 #DIV/0! #DIV/0! #DIV/0! #DIV/0! #DIV/0! #DIV/0! #DIV/0! #DIV/0! #DIV/0!