Page 1
Polymer / Sepiolite Clay
Nanocomposites
A THESIS SUBMITTED TO THE UNIVERSITY OF LONDON
FOR THE DEGREE OF DOCTOR OF PHILOSOPHY
February 2009
By
Emiliano Bilotti
School of Engineering and Materials Science
Queen Mary, University of London
Mile End Road, London E1 4NS
Page 2
Declaration
I declare that the work presented in this thesis is performed entirely by myself during
the course of my PhD studies at Queen Mary, University of London and has not been
submitted for a degree at this or any other university.
Emiliano Bilotti
2
Page 3
Acknowledgements
First of all, I would like to thank my supervisor Prof. Ton Peijs for giving me the
opportunity to carry out this PhD study in his group but also for his support, trust and
sense of humour. Secondly, I would like to thank Dr. Hartmut Fischer for his co-
supervision, for his hospitality at TNO but especially for his constant encouragement
and support throughout this study.
The vast majority of the experiments have been carried out at Queen Mary, Materials
Department, in a unique friendly atmosphere. I wish to thank all the group members
and support staff for many fruitful discussions and suggestions and more importantly
for their friendship. Thanks are especially given to Paola Ciselli, Chris Reynolds,
Hua Deng, Rui Zhang, Zhujuan Wang, Nattakan Soykeabkaew but also to Jianmin
Zhang, Saharman Gea, Antonio Scherillo, Manuela Russo, Giuseppe Viola, Marc
Simonet, Jia Ma, Luca Achilli, Dhanushka Hapuarachchi, Shuangwu Li, Wei Wang
and Chris Morgan. I would like to acknowledge Wenrui Zhang, Dun Lu, Michael
Dollinger, Franck Quero for direct cooperation and assistance with the experimental
work.
I wish to thank Monisha Phillips for her constant and valuable help, Zofia Luklinska
and Mick Wills for support on SEM and TEM and Vince Ford, Danny Neighbour
and Bill Godwin for manufacturing several experimental equipments.
I would like to thank Dr. Asa Barber for discussion, encouragement and support with
the SPM and Prof. Paul Smith and Prof. Bela Pukanszky for their critical comments
and suggestions. Prof. Philippe Dubois, Dr. Emmanuel Duquesne and Dr. Gaelle
Deshayes are kindly acknowledged for their hospitality at the University of Mons-
Hainaut and their guidance for the polymerisation of PA6/Sep hybrids.
3
Page 4
Acknowledgements
Dr. Wim Brass and Dr. Kristina Kvashnina are thanked for the help and support with
WAXS experiments at the ESRF synchrotron facility.
Finally I would like to thank Claudio Bilotti for the experimental work on
electrospinning but even more for his constant enthusiasm and encouragement.
Inoltre, vorrei esprimere la più sincera gratitudine alla mia famiglia per il costante
supporto dimostrato durante questi anni. Un pensiero speciale va alla persona che più
mi è stata vicina in questa lunga avventura: Lydia. Grazie di cuore. Gli anni del PhD
sono stati la metafora della vita passata insieme fino ad oggi. Dalla nostra prima
conoscenza, con l’inizio del dottorato, all’amore durante il prosieguo fino al nostro
matrimonio celebrato pochi giorni fa.
4
Page 5
Abstract
In the last two decades, polymer-clay nanocomposites have attracted great interests
because of the remarkable enhancements in mechanical and physical properties with
minute amount of nano-filler, promising to eliminate the typical compromise that
exists between properties and processability of composite materials. Despite the
expectations created by nano-clays in the academic and industrial communities, their
success has so far been limited. The reasons can be ascribed to the poor dispersion of
nano-clays in polymer matrices, to the often weak interfacial interaction with
polymers, and to the lack of control of nano-clay orientation.
In this thesis, all the aspects above will be tackled, studying the potential of sepiolite,
a nano-clay with a peculiar needle-like shape, in two thermoplastic polymers:
polypropylene (PP) and polyamide 6 (PA6). After an extensive literature survey, the
experimental part of the thesis starts with the characterisation of sepiolite (Chapter
5). The dimensions of the nano-filler are evaluated, as well as the specific surface
area, the thermal properties and the stiffness of individual nano-needles with novel
nano-mechanical tests. Chapter 6 deals with improving the dispersion and interaction
of nano-clay in PP, by employing three compatibilisers and by surface
functionalisation of the clay. In order to align the fibrous nano-filler, thin
PP/sepiolite tapes are prepared by solid-state drawing (Chapter 7). It is shown that in
these oriented nanocomposite tapes, small amounts of clay (<2.5wt%) are able to
improve the mechanical performances, due to a better reinforcement efficiency of the
nanofiller and to a higher orientation induced crystallinity, but also the thermal
resistance and barrier properties. Finally (Chapter 8-9), PA6/sepiolite
nanocomposites were prepared both by melt compounding and in situ
5
Page 6
Abstract
polymerisation. Sepiolite is well dispersed in PA6 without any need of
compatibilisers or clay surface functionalisation. The simple and environmentally
friendly melt-compounding process turns out to be as efficient as the in situ
polymerisation route for what concerns the dispersion state of nano-filler, making it a
good candidate for industrial and commercial applications. In conclusion, sepiolite
shows promising credentials as nanofiller for thermoplastic polymers (i.e. PA6), and
in particular for oriented tapes, ultimately creating a 1D nanocomposite reinforced by
a 1D nanofiller.
6
Page 7
Table of Contents
List of Tables 12
List of Figures 14
1. Introduction 1.1 Nanoclay Composites - The present 25
1.2 Nanocomposites in Nature 27
1.3 Scope of the Thesis 30
1.4 References 30
PART 1: LITERATURE SURVEY
2. Clays and Clay Minerals 2.1 Introduction 33
2.2 Nomenclature of Clay Minerals 34
2.3 Sepiolite Clay 38
2.4 References 42
3. Polymer-Clay Nanocomposites 3.1 Introduction 43
3.2 Preparation of Polymer-Clay Nanocomposites 48
3.2.1 Solution Processing 48
3.2.2 In-Situ Polymerisation 48
3.2.3 Melt Processing 50
3.2.4 Template Synthesis 59
3.3 Properties of Polymer-Clay Nanocomposites 60
3.3.1 Crystallisation 60
3.3.2 Mechanical Properties 65
3.3.3 Barrier Properties 71
7
Page 8
Table of Contents
3.3.4 Fire Retardancy 74
3.4 References 76
4. Needle-like Clay Nanocomposites 4.1 Introduction - The importance of shape 86
4.2 Preparation of needle-like clay nanocomposites 88
4.2.1 In-situ polymerisation 88
4.2.2 Melt compounding 93
4.3 Properties of needle-like clay nanocomposites 94
4.3.1 Crystallisation 94
4.3.2 Mechanical Properties 96
4.3.3 Rheology 99
4.4 References 102
PART 2: EXPERIMENTAL RESULTS AND DISCUSSION
5. Sepiolite Nanoclay in Polymer Composites 5.1 Introduction 106
5.2 Experimental 107
5.2.1 Materials 107
5.2.2 Characterisation Techniques 107
5.3 Results and Discussion 108
5.3.1 Morphological Analysis 108
5.3.2 B.E.T. Measurements 112
5.3.3 Thermal Properties 115
5.3.4 Mechanical Properties. Nano-Bending Tests 117
5.3.5 Micromechanical Models 120
5.4 Conclusions 130
5.5 References 130
8
Page 9
Table of Contents
6. Polypropylene / Sepiolite Nanocomposites 6.1 Introduction 134
6.2 Experimental 135
6.2.1 Materials 135
6.2.2 Nanocomposites Preparation 135
6.2.2 Nanocomposites Characterisation 136
6.3 Results and Discussion 138
6.3.1 Morphological Analysis 138
6.3.2 Crystal Structure and Crystallisation Behaviour 140
6.3.4 Rheological Behaviour 145
6.3.5 Thermal Behaviour 147
6.3.3 Mechanical Properties 150
6.3.6 Micromechanical Models 153
6.4 Conclusions 161
6.5 References 162
7. Oriented PP / Sepiolite Composite Tapes 7.1 Introduction 165
7.2 Experimental 165
7.2.1 Materials 165
7.2.2 Composite Tapes Preparation 166
7.2.3 Composite Tapes Characterisation 167
7.3 Results and Discussion 168
7.3.1 Morphology of Tapes 168
7.3.2 PP and Sepiolite Orientation 170
7.3.3 Mechanical Properties 178
7.3.4 Thermal Analysis 185
7.4 Conclusions 187
7.5 References 188
9
Page 10
Table of Contents
8. Polyamide 6 / Sepiolite Nanocomposites 8.1 Introduction 190
8.2 Experimental 191
8.2.1 Materials 191
8.2.2 Nanocomposites Preparation 191
8.2.3 Nanocomposites Characterisation 191
8.3 Results and Discussion 193
8.3.1 Morphological Analysis 193
8.3.2 Non-Isothermal Crystallisation 195
8.3.3 WAXS – PA6 Crystal Structure 198
8.3.4 Thermo Gravimetric Analysis 203
8.3.5 Mechanical Properties 204
8.3.6 Micromechanical Models 207
8.4 Conclusions 213
8.5 References 214
9. In-Situ Polymerised Polyamide 6 / Sepiolite Nanocomposites 9.1 Introduction 217
9.2 Experimental 217
9.2.1 Materials 217
9.2.2 Masterbatches Preparation - Polymerisation 218
9.2.3 Masterbatches Dilution - Melt Compounding 219
9.2.4 Nanocomposites Characterisation 219
9.3 Results and Discussion 221
9.3.1 Gel Permeation Chromatography 221
9.3.2 TGA 223
9.3.3 Morphological Analysis 226
9.3.4 Crystallisation Behaviour 228
9.3.5 Mechanical Properties 229
9.3.6 Dynamic Mechanical Analysis 233
9.4 Conclusions 236
10
Page 11
Table of Contents
9.5 References 237
10. Conclusions and Future Work
10.1 Summary 239
10.2 Future Work 242
10.3 References 245
List of Author’s Publications 247
11
Page 12
List of Tables
1.1 Examples of commercial ventures in polymer/clay nanocomposites 26
2.1 Classification of clay minerals. From [1] 37
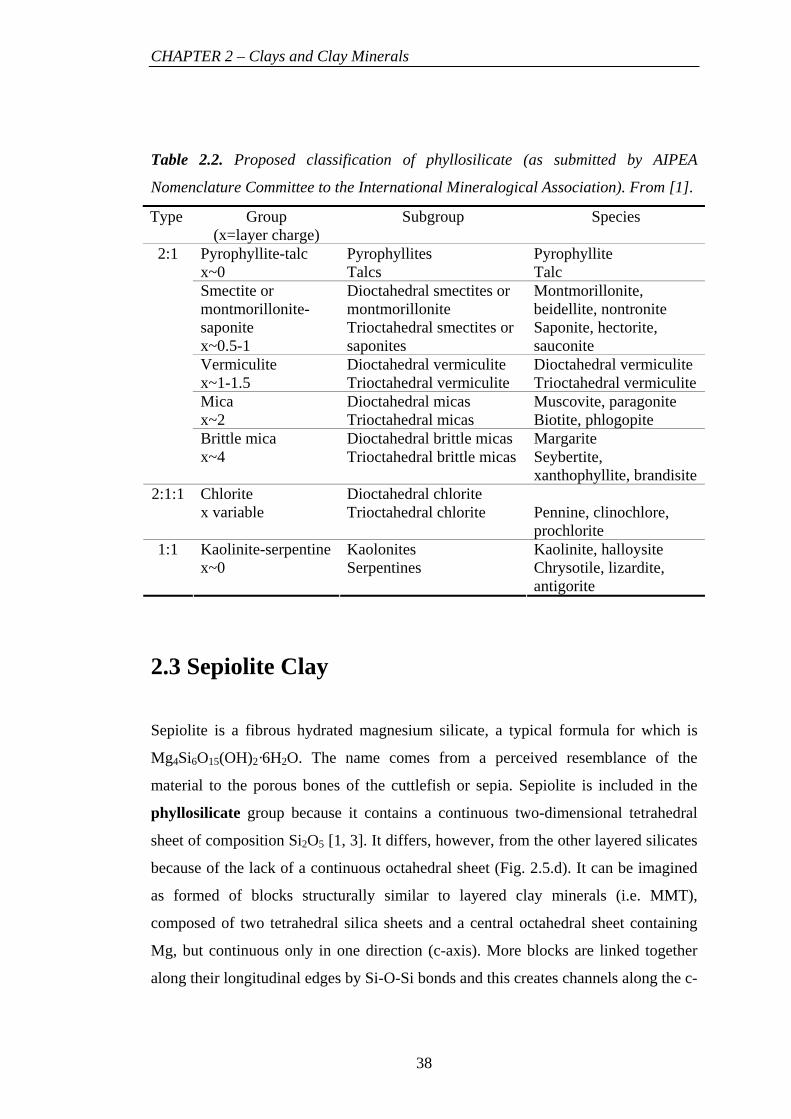
2.2 Proposed classification of phyllosilicate (as submitted by AIPEA
Nomenclature Committee to the International Mineralogical
Association). From [1] 38
2.3 Sepiolite physic-chemical properties on the basis of common
industrial applications 40
3.1 WAXS peak intensity and young’s modulus for nanocomposites
obtained by in-situ polymerisation, catalysed with different acids.
From [83] 65
3.2 Effect of PP-MA on the young’s modulus of PP-based
nanocomposites. From [54] 67
3.3 Effect of PP-MA on the yield stress of PP-based nanocomposites
[54] 69
3.4 Effect of PP-MA on the strain at break of PP-based
nanocomposites. From [54] 70
4.1 Mechanical properties of in-situ polymerised PE/palygorskite
nanocomposites [7] 97
4.2 Mechanical properties of rubbery epoxy/palygorskite
nanocomposites [9] 98
5.1 Volume of N2 gas adsorbed on sepiolite clay at different pressures 113
5.2 Weight losses of sepiolite clays 117
5.3 Results of the nano-bending tests 119
5.4 Shape factors ζ, for fibre-like and platelet-like reinforcement [16] 126
6.1 Compositions of PP/sepiolite nanocomposites 136
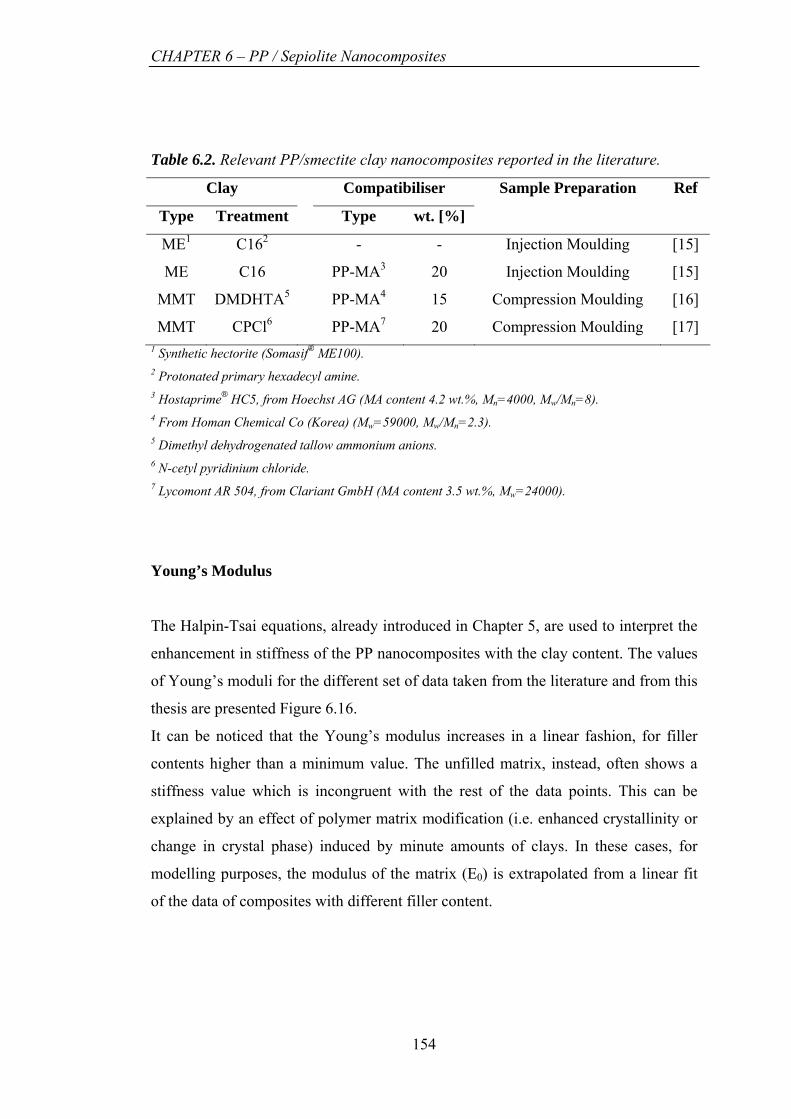
6.2 Relevant PP/smectite clay nanocomposites reported in the literature 154
8.1 Filler content of nanocomposites samples as obtained from TGA 204
8.2 Relevant PA6/clay nanocomposites reported in the literature 208
12
Page 13
List of Tables
9.1 GPC results of molecular weight averages (Mw and Mn) and
polydispersity (Mw/Mn) of the commercial PA6, the two in-situ
masterbatches, and the nanocomposites obtained after dilution of
the masterbatches with commercial PA6. Samples are run in
duplicates 222
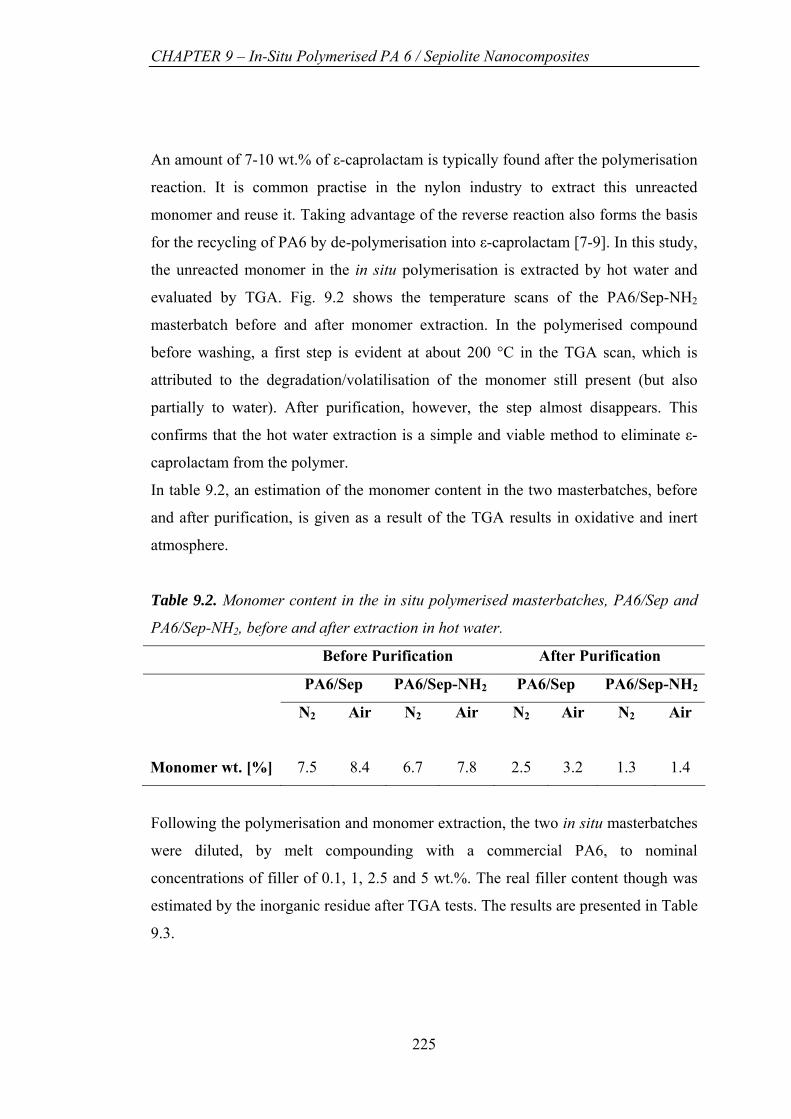
9.2 Monomer content in the in-situ polymerised masterbatches,
PA6/Sep and PA6/Sep-NH2, before and after extraction in hot water 225
9.3 Filler content of the different nanocomposites, calculated by the
residue of inorganic phase after TGA tests 226
9.4 Summary of the crystallinity and temperature of crystallisation of
the In-situ PA6 nanocomposites 229
13
Page 14
List of Figures
1.1 Wilson's Double Core premium tennis ball, with technology Air D-
Fense, by InMat [3] 26
1.2 Hierarchical structure of bones: a) cortical and cancellous bone; b)
osteons with Haversian systems; c) lamellae; d) collagen fibre
assemblies of collagen fibrils; e) bone mineral crystals, collagen
molecules and non-collagenous proteins. From [4] 28
1.3 Structural hierarchy of the gecko adhesive system. (A)
Macrostructure: ventral view of a tokay gecko (G. gecko) climbing
vertical glass. (B) Mesostructure: ventral view of the foot, with
adhesive lamellae (scansors) visible as overlapping pads. Note the
clean appearance of the adhesive surface. (C) Microstructure:
proximal portion of a single lamella, with individual setae in an array
visible. (D and E) Nanostructure: single seta with branched structure at
upper right, terminating in hundreds of spatular tips [6]. 29
2.1 Electron microscope micrographs of different clays: a) kaolinite, b)
montmorillonite, c) halloysite and d) sepiolite. 34
2.2 Tetrahedral sheet 34
2.3 Octahedral sheet 35
2.4 Proposed crystallographic structures for: a) kaolinite, b) smectite and
c) chlorite. From [1] 36
2.5 Structure of sepiolite clays: a) SEM picture of natural sepiolite, b)
Schematic representation of a single sepiolite fibre, c) TEM picture
representing a single nanofibre cross-section and d) suggested
mineralogical structure. 39
3.1 Schematic representation of modification of platelet-like nano-clays
by cation-exchange reaction with surfactant molecules. From [10] 44
3.2 Interlayer structures of intercalated surfactant molecules into the nano-
clays galleries. From [11] 45
14
Page 15
List of Figures
3.3 Alkyl chain aggregation model. As the chains length increase the
structure changes from liquid-like to liquid crystalline-like. From [11] 45
3.4 In situ SAXS-WAXS experiments during melting/recrystallisation.
The appearance of a small angle reflection after polymer melting
shows partial re-agglomeration of the clays. From [10] 46
3.5 Representation of the possible morphology arising from the interaction
of nanoclays and polymer: a) non-intercalated, conventional micro-
composite; b) intercalated nanocomposite and c) exfoliated
nanocomposite. From [4] 47
3.6 Representation of the swelling of nanoclays by ε-caprolactam and its
ring-opening polymerisation. From [5] 49
3.7 Schematic representation of melt-intercalation processing. From [5] 51
3.8 polymerVSh∆ , and as a function of the gallery height
, for a polymer and a layered silicate modified with
octadecylammonium group. Reproduced from [36]
chainVSh∆ VSh∆
0hh −
52
3.9 Variation of free energy per unit area, as a function of the
gallery height , for a polymer and a layered silicate modified
with octadecylammonium group. Curves are calculated for different
values of interaction energies ε
Vfh∆
0hh −
sp,sa between polymer and silicates,
supposing the interaction between polymer and tethered chains, εsa=0.
Curves I, IIa, IIb, III correspond to εsp,sa values of 0, -4, -8, -12 mJ/m2.
Reproduced from [36] 53
3.10 Representation of the “slurry” melt-compounding process. From [44] 55
3.11 Intercalation of maleic anhydride molecules into the clays galleries.
From [52] 57
3.12 Intercalation and successive exfoliation process of clays by melt-
compounding with PP-MA. From [5] 58
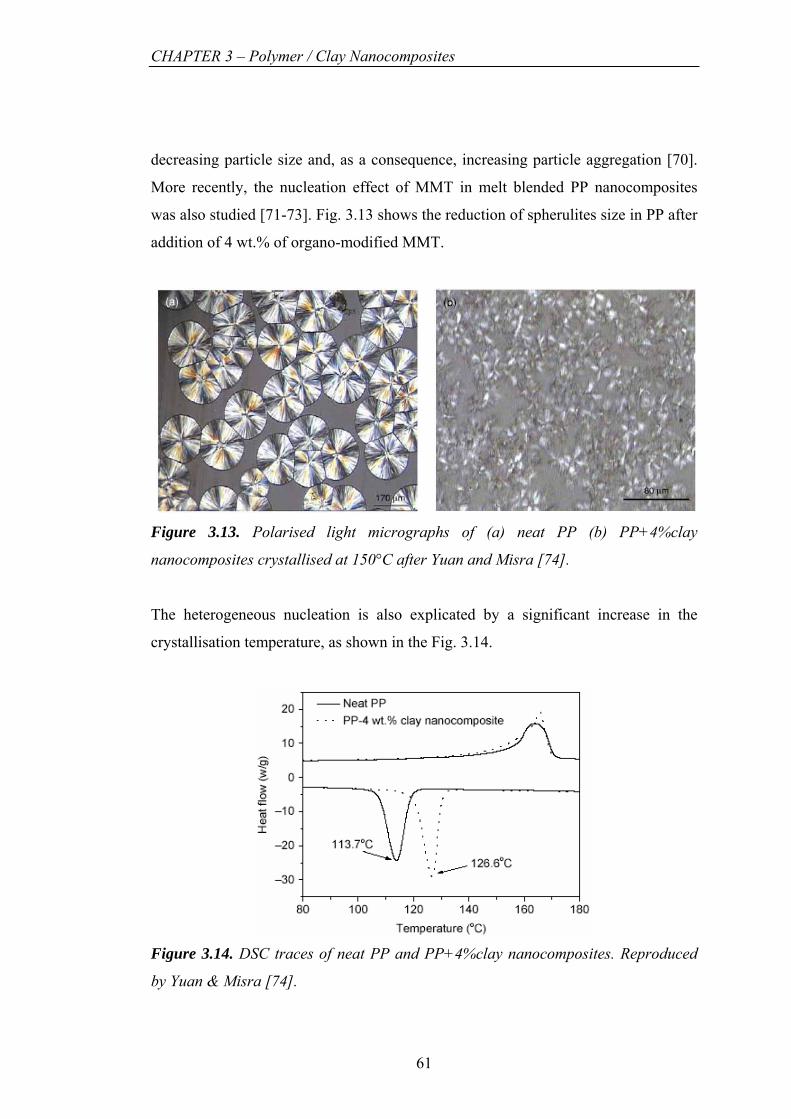
3.13 Polarised light micrographs of (a) neat PP (b) PP+4%clay
nanocomposites crystallised at 150°C after Yuan and Misra [73] 61
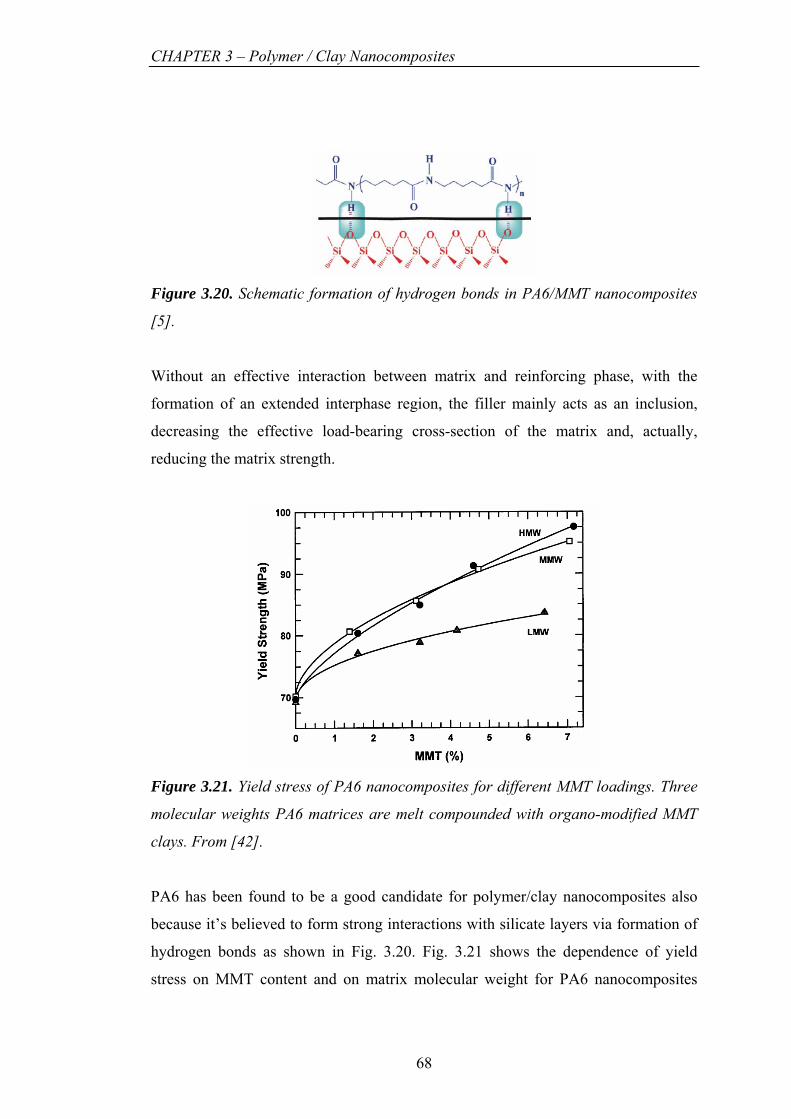
3.14 DSC traces of neat PP and PP+4%clay nanocomposites. Reproduced 61
15
Page 16
List of Figures
by Yuan & Misra [73]
3.15 Hydrogen bonding in the α and γ crystalline forms of nylon 6 as seen
from end and side-view of each crystal. Closed and open circles
represent chain axes projecting out of and into the page, respectively.
From [76] 62
3.16 TEM pictures showing the crystalline morphology of a) PA6 and b)
nanocomposites with 2.5 wt.% of clays. Reproduced by Shen et al.
[81] 63
3.17 WAXS spectra of PA6 nanocomposites compared with pure PA6 (a) at
the surface and (b) in the bulk of injection moulded bars. PA2 and
PA3 refer to two different organo-modified MMT with the second
highly swollen. Reproduced by Varlot et al. [82] 64
3.18 Tensile modulus, measured at 120°C, of nanocomposites based on
MMT (● NCH) and Saponite (■ NCHP) clays at different loadings.
From [75] 66
3.19 Effect of clay content on tensile modulus of PA6-organomodified
MMT nanocomposites obtained by melt compounding. From [34] 66
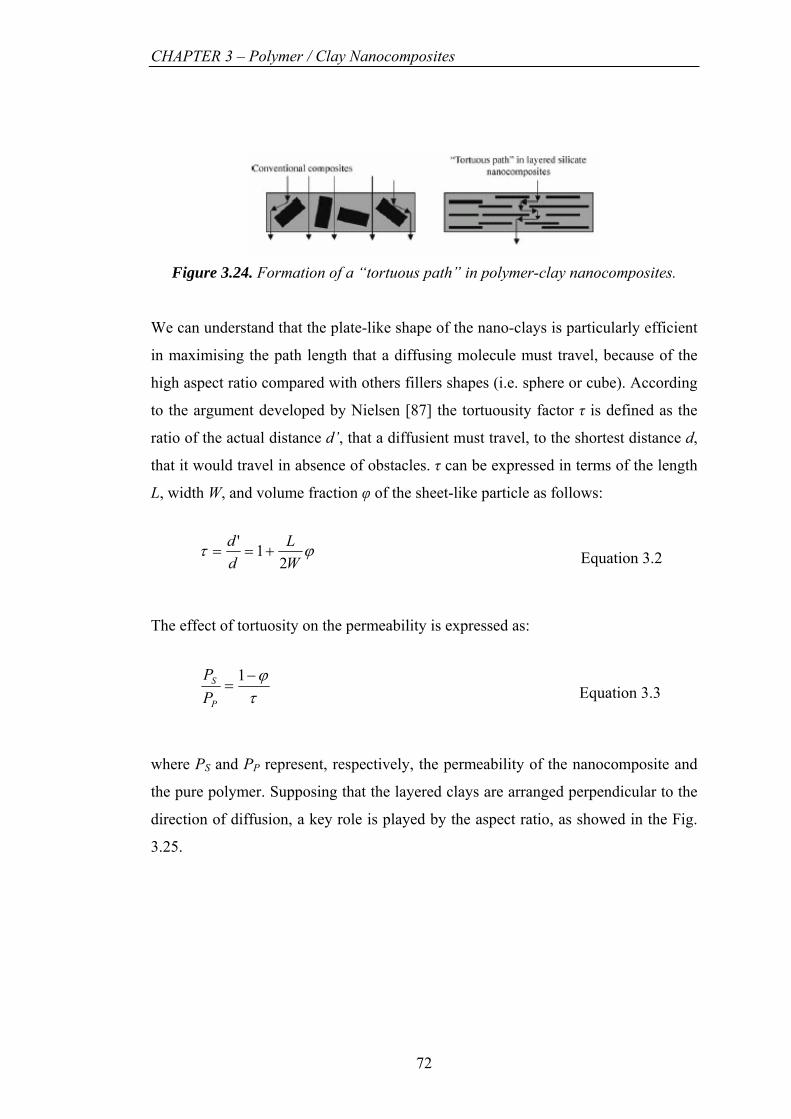
3.20 Schematic formation of hydrogen bonds in PA6/MMT
nanocomposites [5] 68
3.21 Yield stress of PA6 nanocomposites for different MMT loadings.
Three molecular weights PA6 matrices are melt compounded with
organo-modified MMT clays. From [41] 68
3.22 Effect of clay content on Tensile Strength of co-intercalated PP/MMT
nanocomposites. From [57] 70
3.23 Elongation at break of three MW PA6 nanocomposites for different
MMT loadings, tested at crosshead spead of (a) 0.51 cm/min and (b)
5.1 cm/min. From [41] 71
3.24 Formation of a “tortuous path” in polymer-clay nanocomposites 72
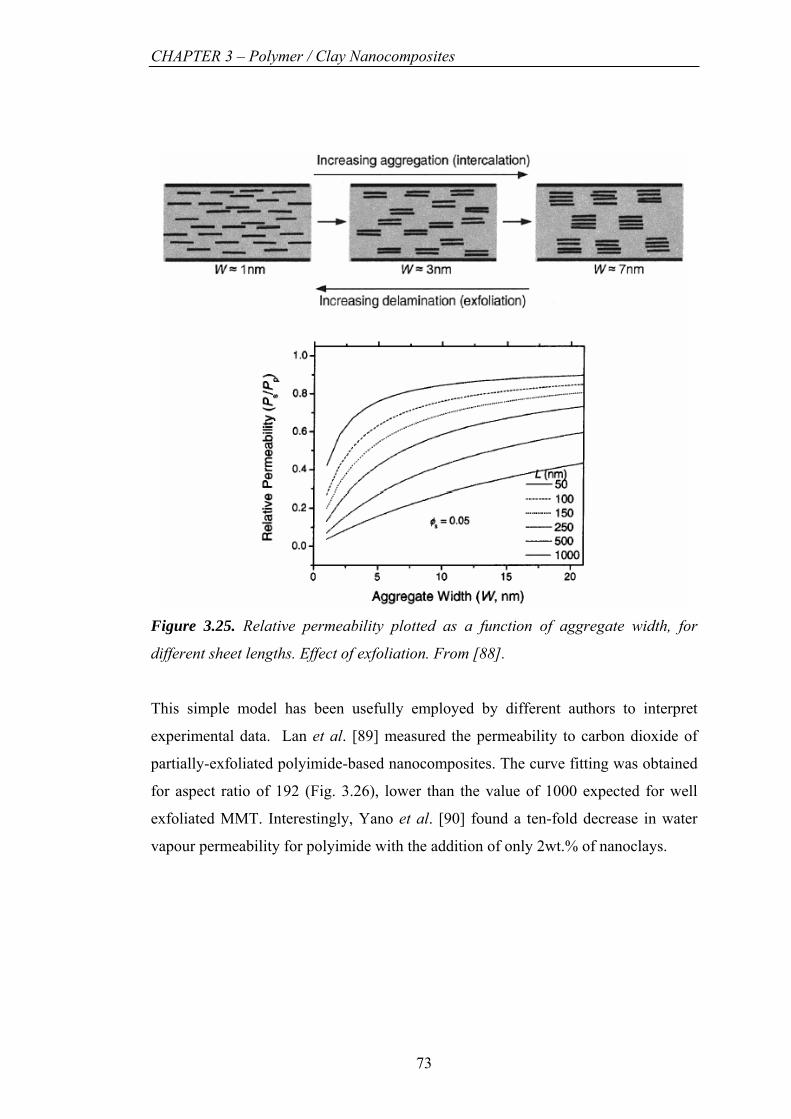
3.25 Effect of exfoliation. Relative permeability plotted as a function of
aggregates width, for different sheet lengths. From [87] 73
3.26 Relative permeability for different loading of MMT clays. The best
16
Page 17
List of Figures
fitting is for aspect ratio 192, much lower that 2000 expected for
completely exfoliated MMT platelets. From [87] 74
3.27 Heat release rate of PA6 and PA6/silicate nanocomposites (5 wt.%).
Reproduced from [89] 74
3.28 Residues of combustion of: (a) EVA with 5 phr organoclays; (b) EVA
with 5 phr MWCNTs; (c) EVA with 2.5 phr pure MWCNTs and 2.5
phr organoclays. From [92] 75
4.1 Surface area to volume ratio (A/V) as a function of the aspect ratio
(l/d) of cylindrical particles. Reproduced from [1] 86
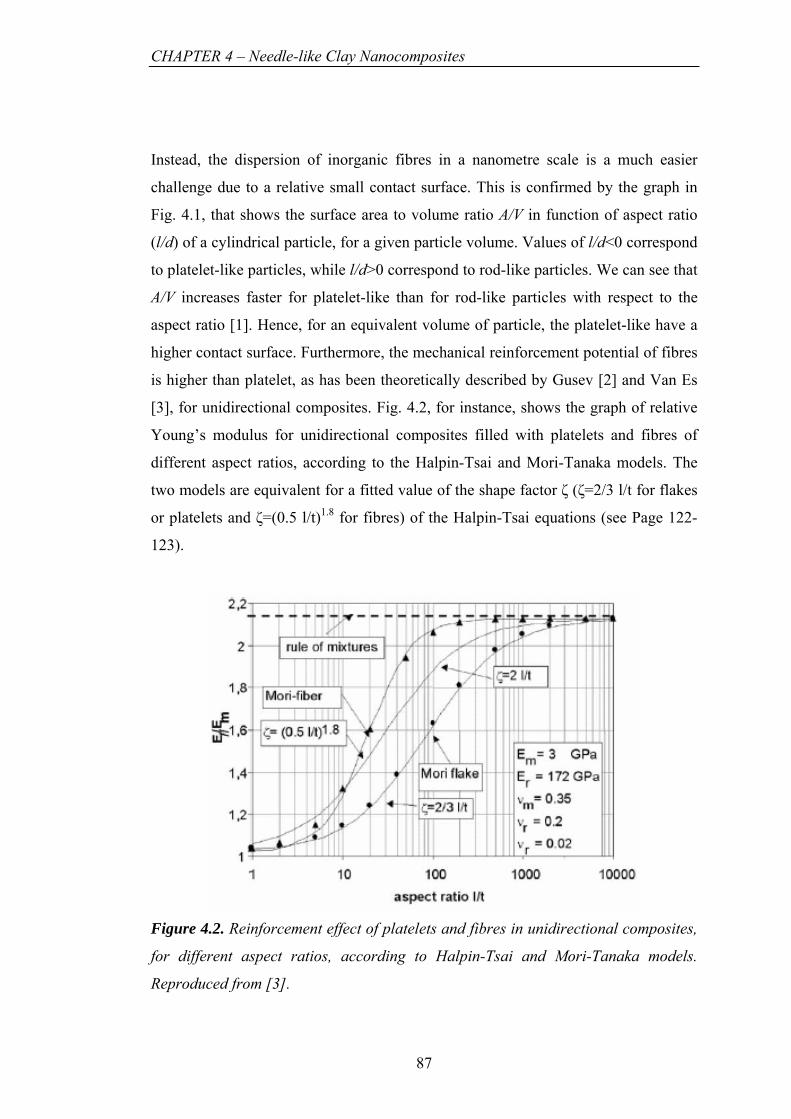
4.2 Reinforcement effect of platelets and fibres in unidirectional
composites, for different aspect ratios, according to Halpin-Tsai and
Mori-Tanaka models. Reproduced from [3] 87
4.3 SEM micrographs of PA6/attapulgite nanocomposites obtained by in-
situ polymerisation. The pictures refer to filler concentration of: a) 2
wt.% and b) 5 wt.% (right). From [4] 88
4.4 TEM picture of boehmite stabilised in n-propanol. Reproduced from
[6] 89
4.5 TEM pictures of PA6/boehmite nanocomposites, obtained by in-situ
polymerisation, referring to (a) 7.5 wt.% and (b) 9 wt.% of filler. From
[6] 90
4.6 TEM pictures of two different concentrations of Ti-modified
boehmite/PA6 nanocomposites: 7 wt.% (left) and 15 wt.% (right).
From [5] 90
4.7 TEM picture of sepiolite in epoxy matrix. From [8] 91
4.8 TEM pictures of elastomer/sepiolite nanocomposites containing 5phr
of clays. From [10] 92
4.9 TEM picture of PP/org-attapulgite nanocomposites with 5 wt.% filler
content [18] 94
4.10 Avrami’s plot for (a) neat PP and PP/ATP nanocomposites: (b)
PP/ATP 1 wt.%, (c) PP/ATP 3 wt.% and (c) PP/ATP 5 wt.%, at three
different crystallisation temperatures [21] 96
17
Page 18
List of Figures
4.11 Young’s modulus and yield stress for PP/Org-ATP nanocomposites in
function of the filler content [19] 97
4.12 Small amplitude strain sweep (A) and frequency sweep (B-D) at 260
°C for neat PA6 (a) and PA6 nanocomposites with Attapulgite content
of: (b) 2 wt.%, (c) 3 wt.%, (d) 4 wt.% and (e) 5 wt.%. From [4] 100
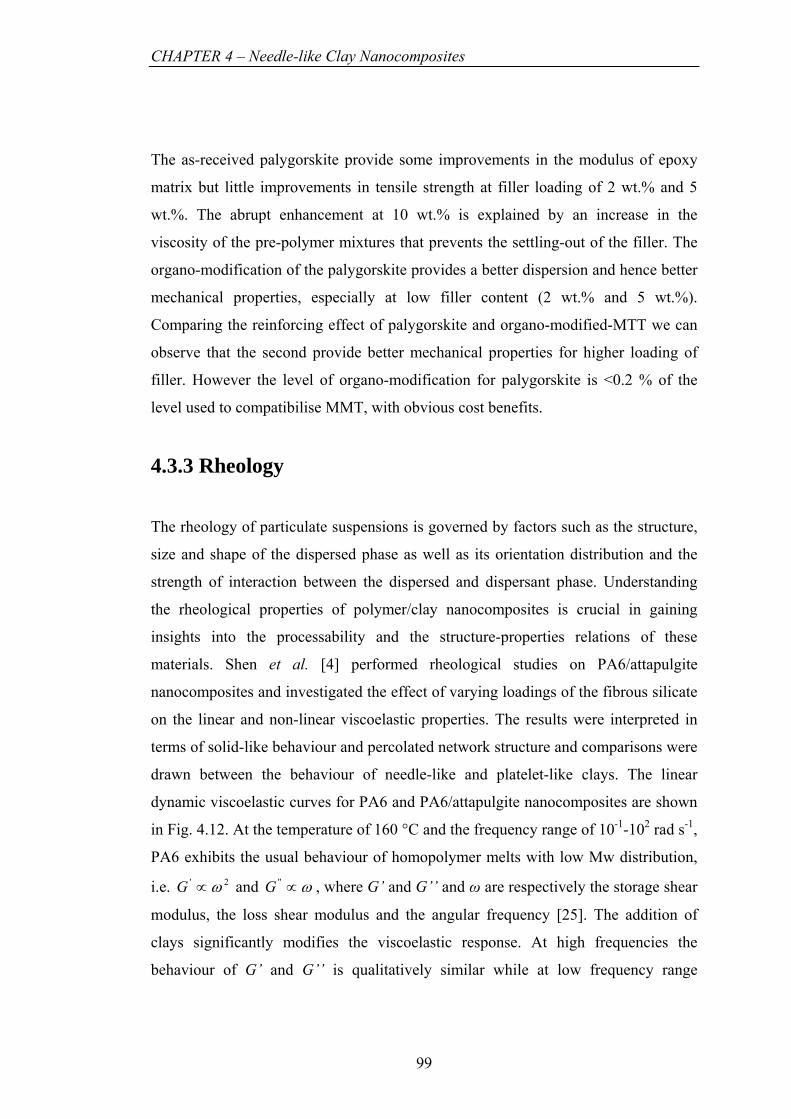
4.13 Schematic description of the polymer/needle-like clay percolating
structure. From [22] 101
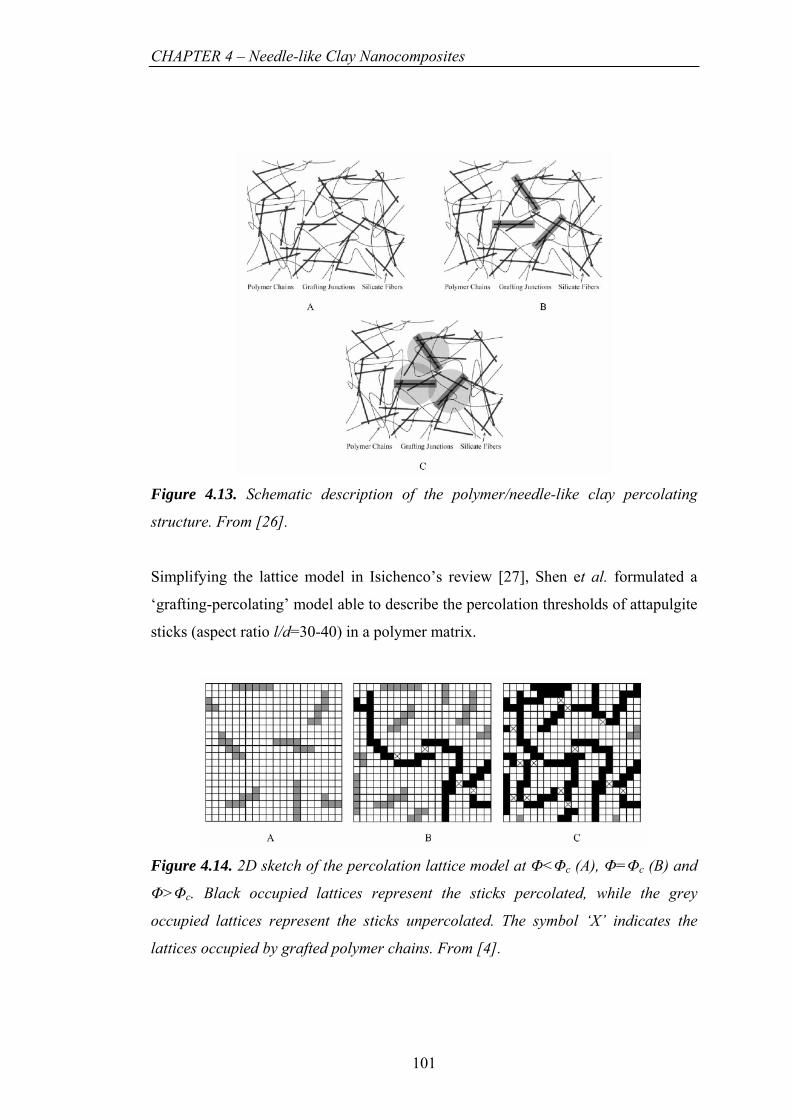
4.14 2D sketch of the percolation lattice model at Φ<Φc (A), Φ=Φc (B) and
Φ>Φc. Black occupied lattices represent the sticks percolated, while
the grey occupied lattices represent the sticks unpercolated. The
symbol ‘X’ indicates the lattices occupied by grafted polymer chains.
From [4] 101
5.1 SEM micrograph of sepiolite clays dispersed on a porous substrate 109
5.2 TEM micrograph of sepiolite on carbon-coated copper grids 109
5.3 TEM micrographs of sepiolite clays on carbon coated TEM grids.
Distribution of: a) lengths and b) diameters. Black arrows underline
single fibres measurements 110
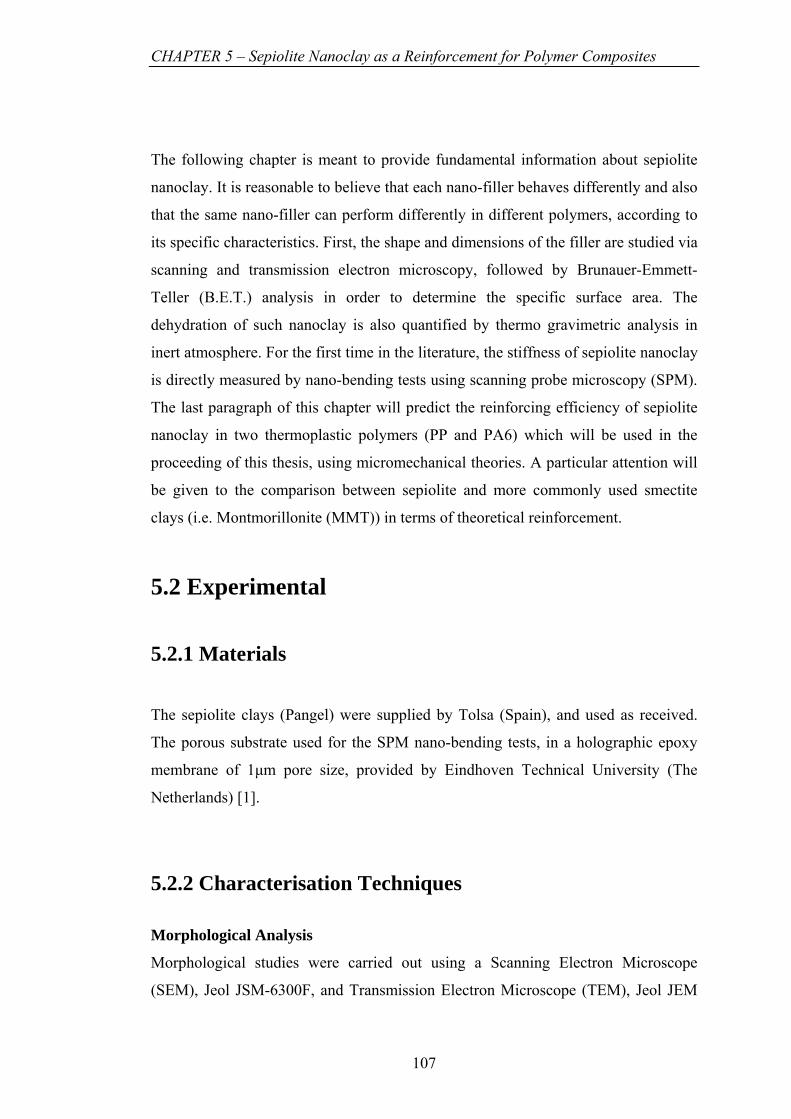
5.4 Distributions of: a) sepiolite lengths and b) sepiolite diameters 111
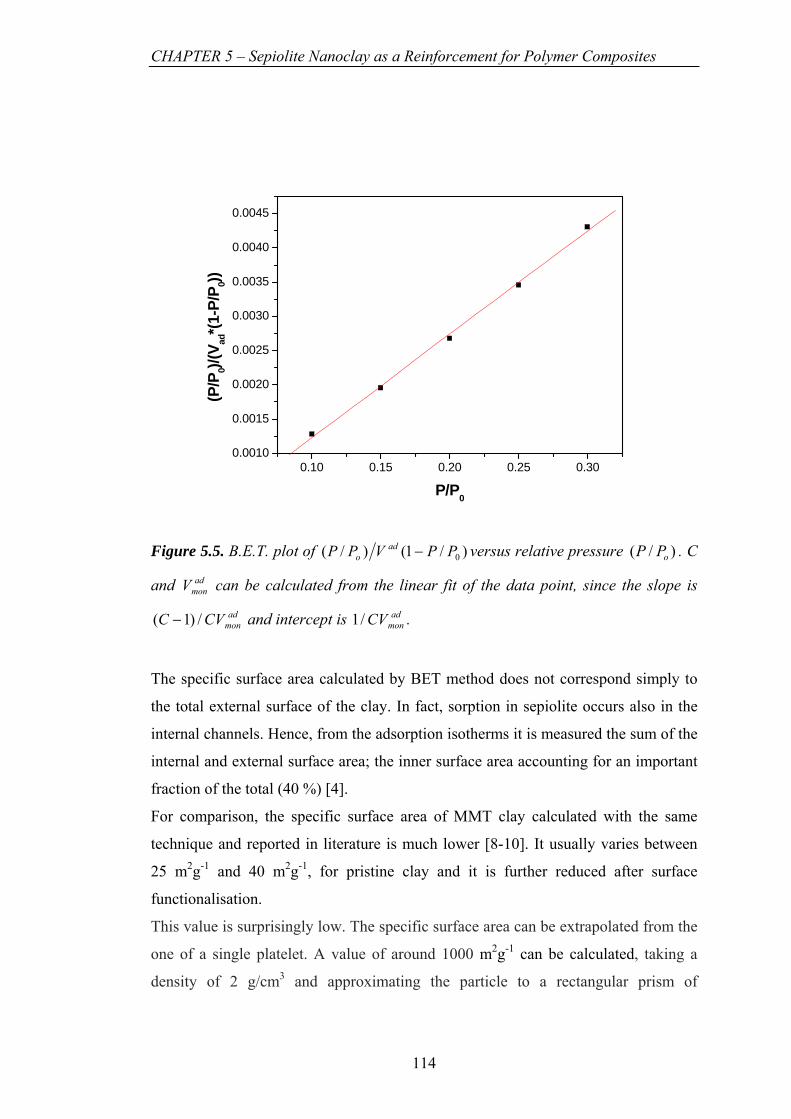
5.5 B.E.T. plot of )/1()/( 0PPVPP ado − versus relative pressure .
C and can be calculated from the linear fit of the data point, since
the slope is and intercept is
)/( oPP
admonV
admonCVC /)1( − ad
monCV/1 114
5.6 Dehydration of sepiolite clays under temperature scan. The dashed
lines represent the temperature window at which clays are typically
subjected during composites preparation (extrusion and compression
moulding) 116
5.7 Schematic representation of SPM bending test of sepiolite nano-fibres
suspended on porous substrate 118
5.8 SPM tests: a) image of a sepiolite nanoclay laying on the substrate and
b) typical force-displacement curve 118
5.9 Schematic illustration of the concept of the shear lag model: a)
18
Page 19
List of Figures
unstressed and stressed system and b) variation of the shear stress and
strain in the matrix in function of the radial position. From [25] 120
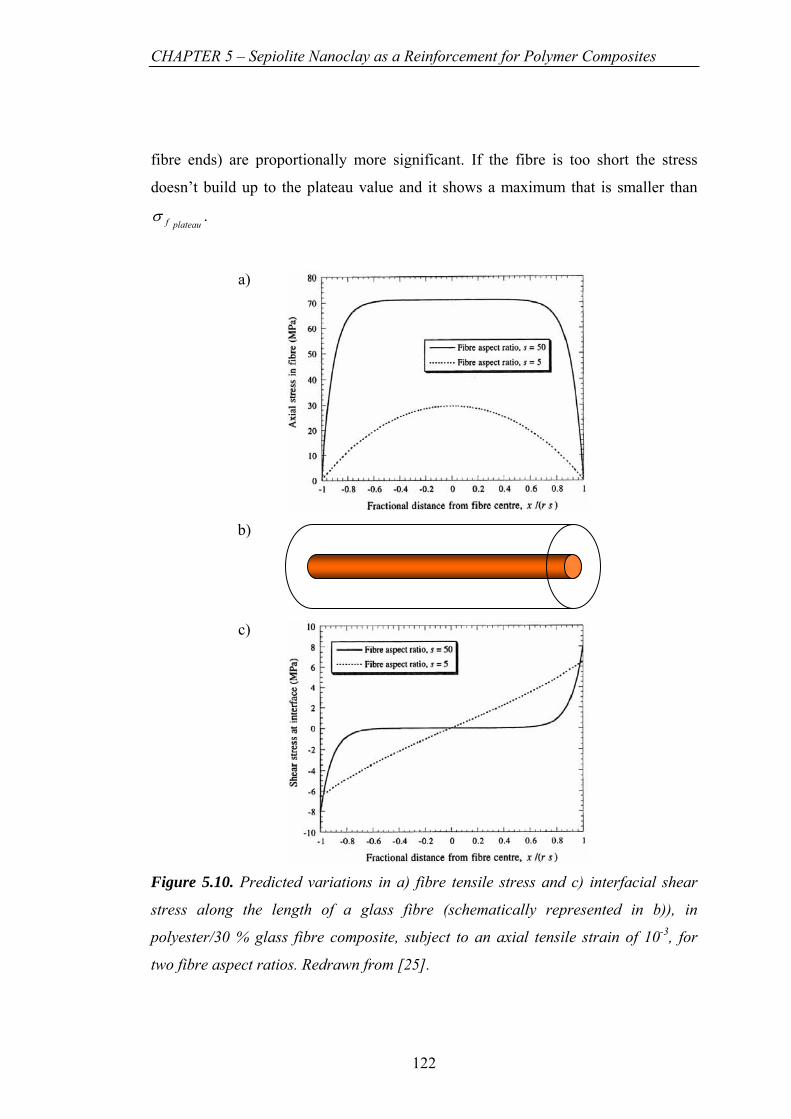
5.10 Predicted variations in a) fibre tensile stress and c) interfacial shear
stress along the length of a glass fibre (schematically represented in
b)), in polyester/30 % glass fibre composite, subject to an axial tensile
strain of 10-3, for two fibre aspect ratios. Redrawn from [25] 122
5.11 Critical aspect ratios in function of the sepiolite vol.% for two polymer
composites (solid lines). The dashed horizontal lines represent the
average aspect ratio (middle) and the lowest and highest values of the
aspect ratio distribution (bottom and top), measured from TEM
micrographs 124
5.12 Principal directions of composites relative to the ones of oriented
fillers 126
5.13 Reinforcement of 5 vol.% of fibre-like and platelet-like filler,
unidirectionally oriented (1D) in two polymer composites. The dashed
vertical line shows the average sepiolite aspect ratio 128
5.14 Reinforcement of 5 vol.% of 3D randomly oriented fibre-like and
platelet-like fillers in PP matrix. The dashed line shows the average
sepiolite aspect ratio 129
6.1 SEM micrographs of: a) PP+2.5%Sep; b) PP+PP-g-MA+2.5%Sep; c)
PP+PP-acid+2.5%Sep; d) PP+1%Sep-sil and e) PP+5%Sep-sil. White
circles underline sepiolite clusters. A significant improvement in the
dispersion of sepiolite in PP matrix is evident with the use of PP-PEO
and Sep-sil, where no agglomerates of nanoclay are found in
nanocomposites at 2.5 wt.% filler load 139
6.2 TEM picture of: a) sepiolite dispersion on TEM grids b) sepiolite in
PP matrix after compounding. A reduction in fibre length is evident in
the processed nanocomposites as a consequence of melt blending in
mini-extruder 140
6.3 X-ray diffraction spectra of: a) PP+Sep; b) PP+PP-g-MA+Sep; c)
PP+PP-acid+Sep; d) PP+Sep-sil nanocomposites at different
19
Page 20
List of Figures
concentrations of filler, compared with virgin PP and pure sepiolite 141
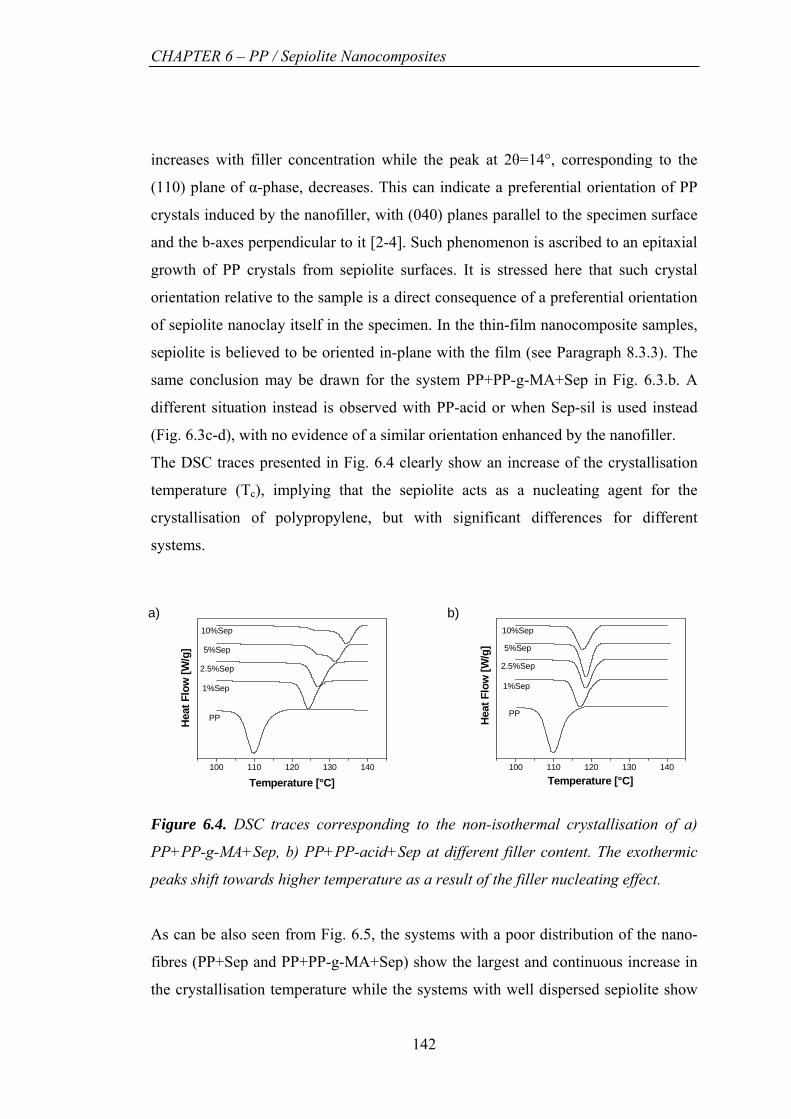
6.4 DSC traces corresponding to the non-isothermal crystallisation of a)
PP+PP-g-MA+Sep, b) PP+PP-acid+Sep at different filler content. The
exothermic peaks shift towards higher temperature as a result of the
filler nucleating effect 142
6.5 Onset Temperatures of starting crystallisation in function of the filler
concentration for: ■ PP+Sep; ○ PP+PP-g-MA+Sep; PP+PP-
acid+Sep; PP+Sep-sil. A larger and continuous increase in the
crystallisation temperature is observed for PP+Sep and PP+PP-g-
MA+Sep while a limiting concentration of crystallisation nuclei is
reached at 1 wt.% of filler for PP+PP-acid+Sep and PP+Sep-sil 143
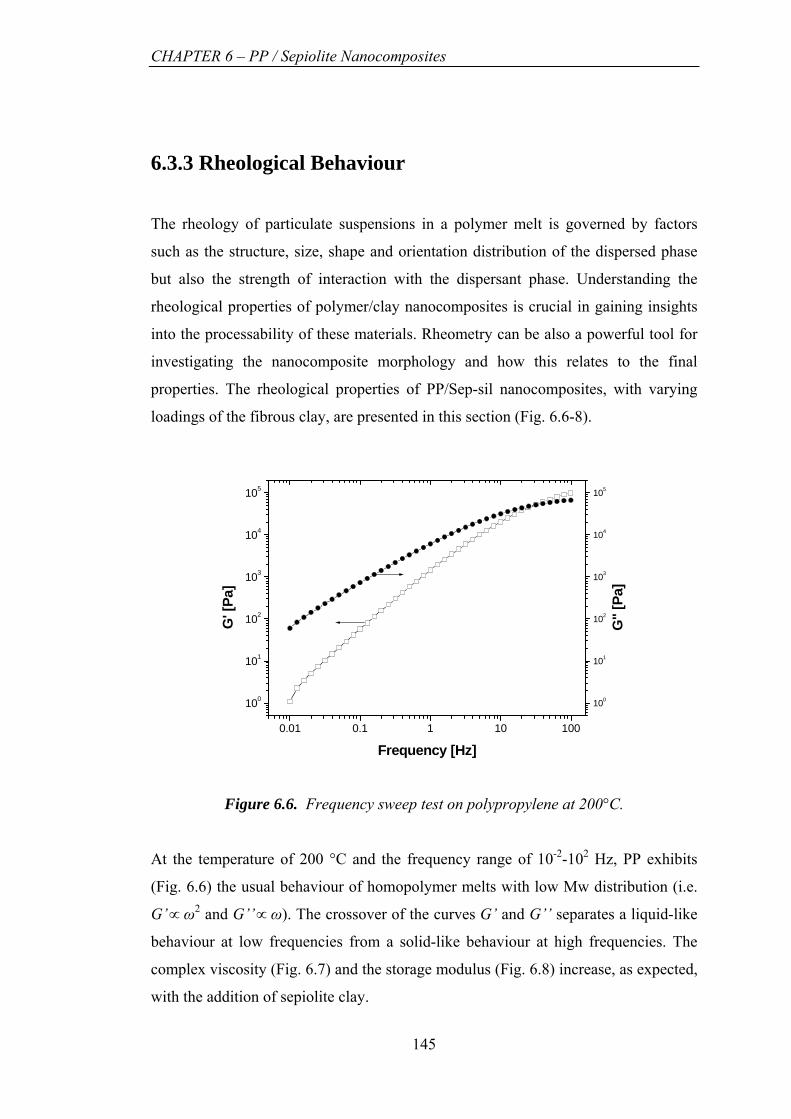
6.6 Frequency sweep test on polypropylene at 200°C 145
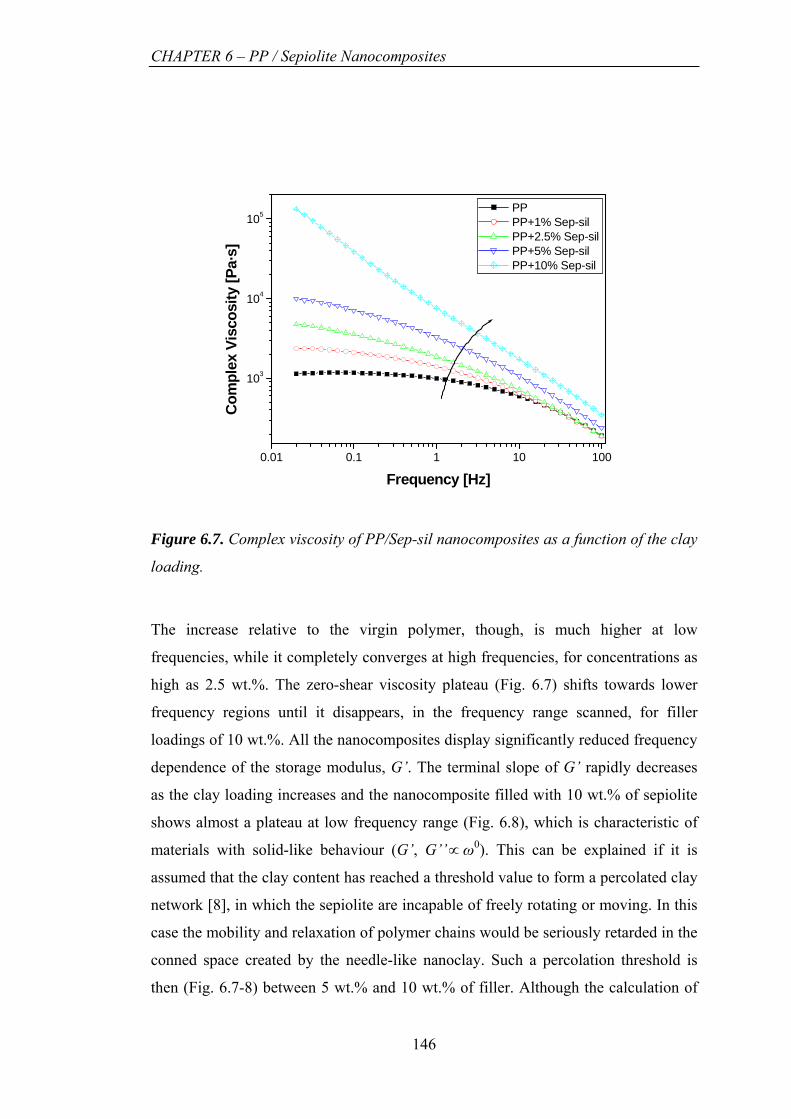
6.7 Complex viscosity of PP/Sep-sil nanocomposites in function of the
clay loading 146
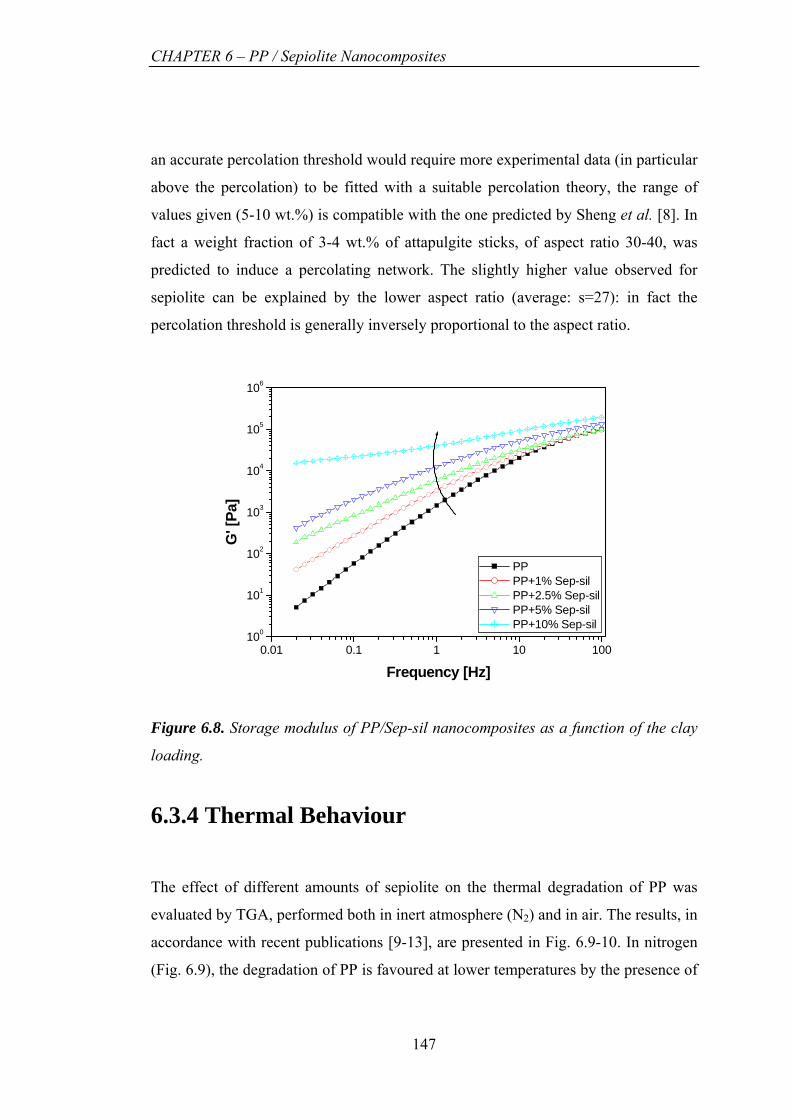
6.8 Storage modulus of PP/Sep-sil nanocomposites in function of the clay
loading 147
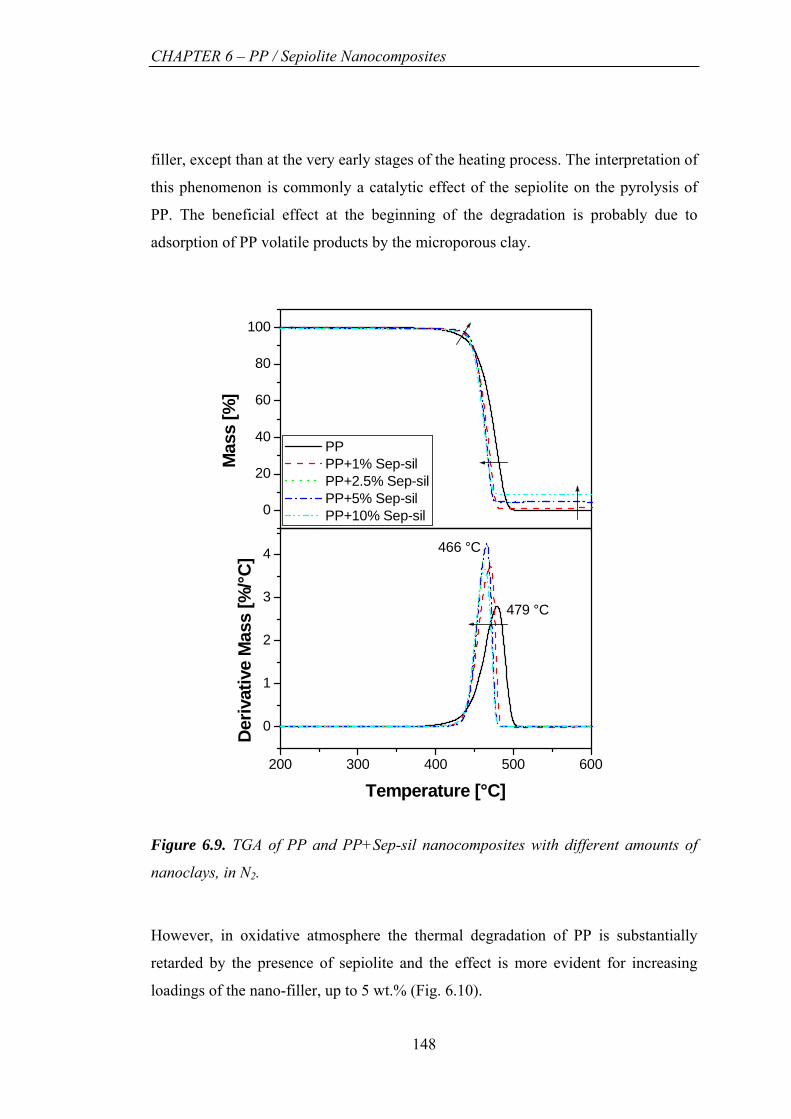
6.9 TGA of PP and PP+Sep-sil nanocomposites with different amounts of
nanoclays, in N2 148
6.10 TGA of PP and PP+Sep-sil nanocomposites with different amounts of
nanoclays, in air 149
6.11 Stress-strain curves of different nanocomposites with 1 wt.% of
sepiolite 150
6.12 Stress-strain curves of different nanocomposites with 5 wt.% of
sepiolite 151
6.13 Young’s modulus of PP nanocomposites at different filler loadings 151
6.14 Yield stress of PP nanocomposites at different filler loadings 152
6.15 Strain at break of PP nanocomposites at different filler loadings. While
nanocomposites with pristine clay and with PP-g-MA undergo a clear
embrittlement, the use of PP-acid and Sep-sil preserves ductility even
at filler concentrations above 5 wt.% 153
6.16 Young’s modulus of PP/clay nanocomposites in function of the filler
20
Page 21
List of Figures
wt.% 155
6.17 Relative Young’s modulus versus filler vol.%. The lines are prediction
from the Halpin-Tsai equations for PP/Sep nanocomposites (fibre-like
filler; solid line) and PP/smectite clay nanocomposites (plate-like
filler; dotted line), using true filler aspect ratios (s) as a fitting
parameter. In the graph the prediction for fibre-like and plate-like filler
for s ∞→ , corresponding to the rule of mixtures, are also included.
The abbreviations ‘1D’ and ‘2D’ stand for uniaxially oriented and 2D
in-plane randomly distributed filler, respectively 156
6.18 Tensile yield stress of PP/clay nanocomposites in function of the filler
vol.% 159
6.19 The natural logarithm of relative tensile stress of PP/clay
nanocomposites in function of the filler volume percent. From the
linear fit of the experimental data, the parameter B can be extracted 160
7.1 Schematic illustration of nanocomposite tape preparation. A
rectangular specimen is cut from a 100 µm thick compression moulded
film and drawn in the solid state to a tape of the desired draw ratio 166
7.2 SEM micrographs, at different magnifications, of the lateral surface
of: a-b) PP tapes, c-d) PP+1%Sep tapes and e-f) PP+10%Sep, after
ductile failure. A white circle indicates sepiolite agglomerations 169
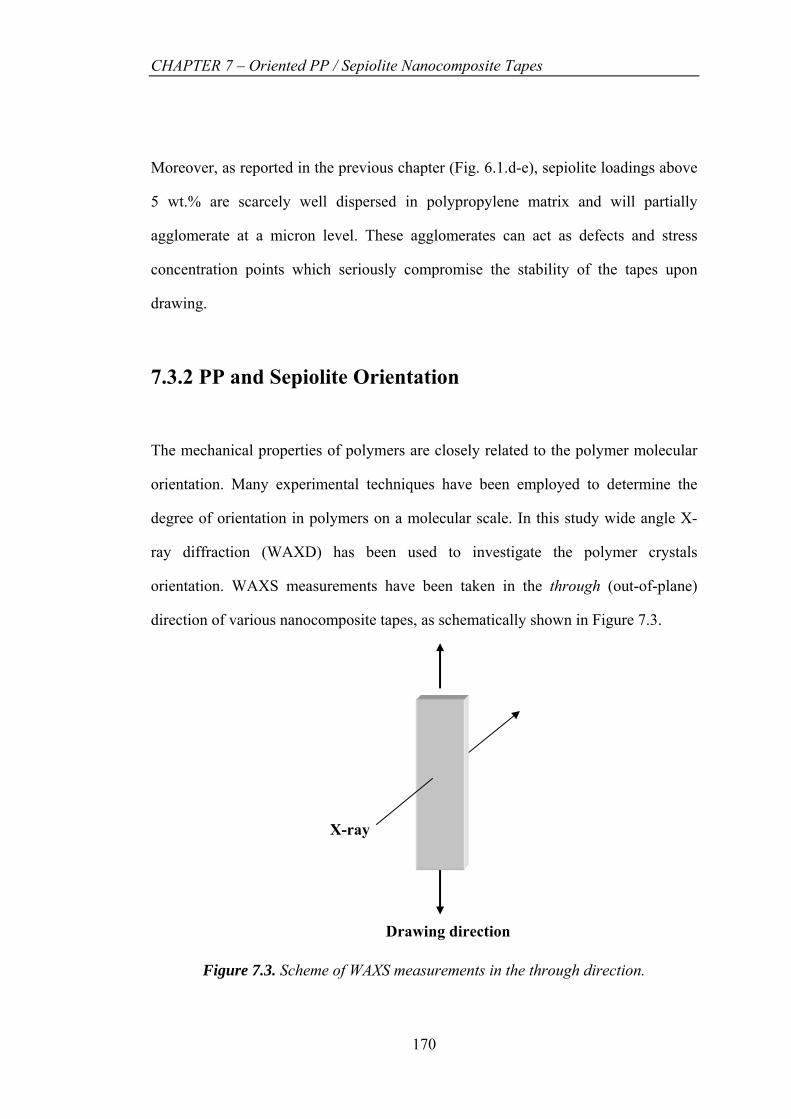
7.3 Scheme of WAXS measurements in the through direction 170
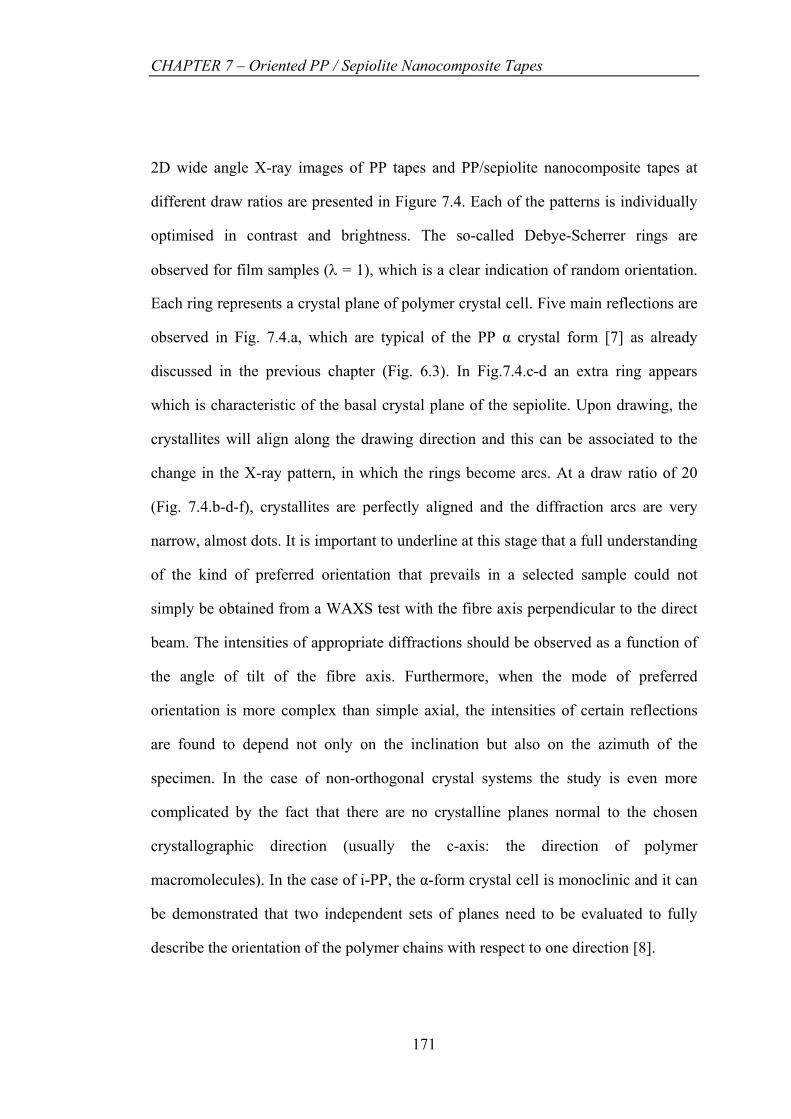
7.4 2D WAXS patterns of: a-b) PP, c-d) PP+5%Sep and e-f) PP+10%Sep
tapes, at λ=1 (left column) and λ=20 (right column), respectively.
Black arrows indicate the main reflection planes of PP and of sepiolite
clays 172
7.5 X-ray intensity (integrated along the 2θ axis) versus the Azimuth angle
for a) PP sample and b) PP+5%Sep tapes at λ=1, 7 and 20. Solid line
represents Gaussian fitting of the data points 174
7.6 Hermans’ orientation factor as a function of draw ratio λ, relative to
PP tapes with different concentrations of sepiolite 176
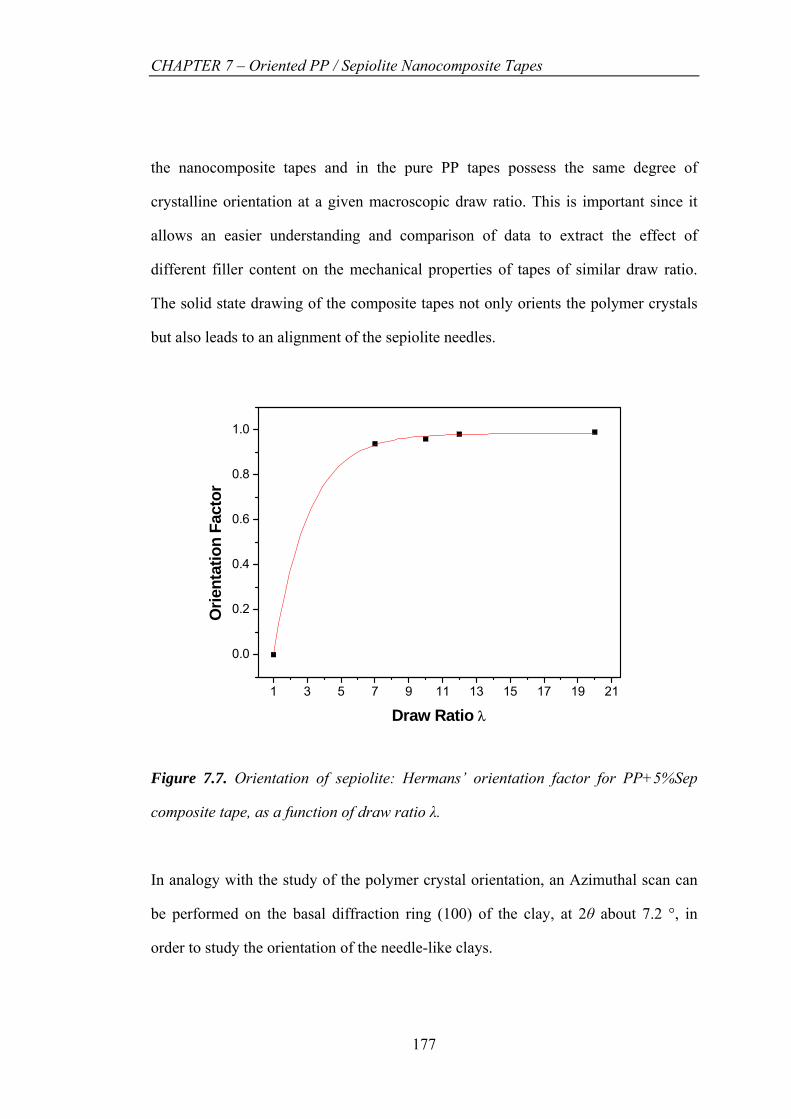
7.7 Hermans’ orientation factor for PP+5%Sep composite tape, as a
21
Page 22
List of Figures
function of draw ratio λ 177
7.8 Stress-strain curves of PP tapes of different draw ratios 178
7.9 Young’s modulus of nanocomposites tapes at different draw ratios.
The dotted lines are Halpin-Tsai predictions of PP tapes filled with 2.5
wt.% sepiolite, completely aligned in the direction of the tape, at three
aspect ratios: s=12, which was found to fit the isotropic samples (Fig.
6.15), s=27, which is the average aspect ratio of sepiolite nanofibres
(5.3.1), and s , which corresponds to the upper bound of the rule
of mixtures
∞→
179
7.10 Young’s modulus of nanocomposite tapes of λ=9, 16 and 20, as a
function of sepiolite filler content 181
7.11 Ultimate tensile strength of nanocomposites tapes in function of λ 181
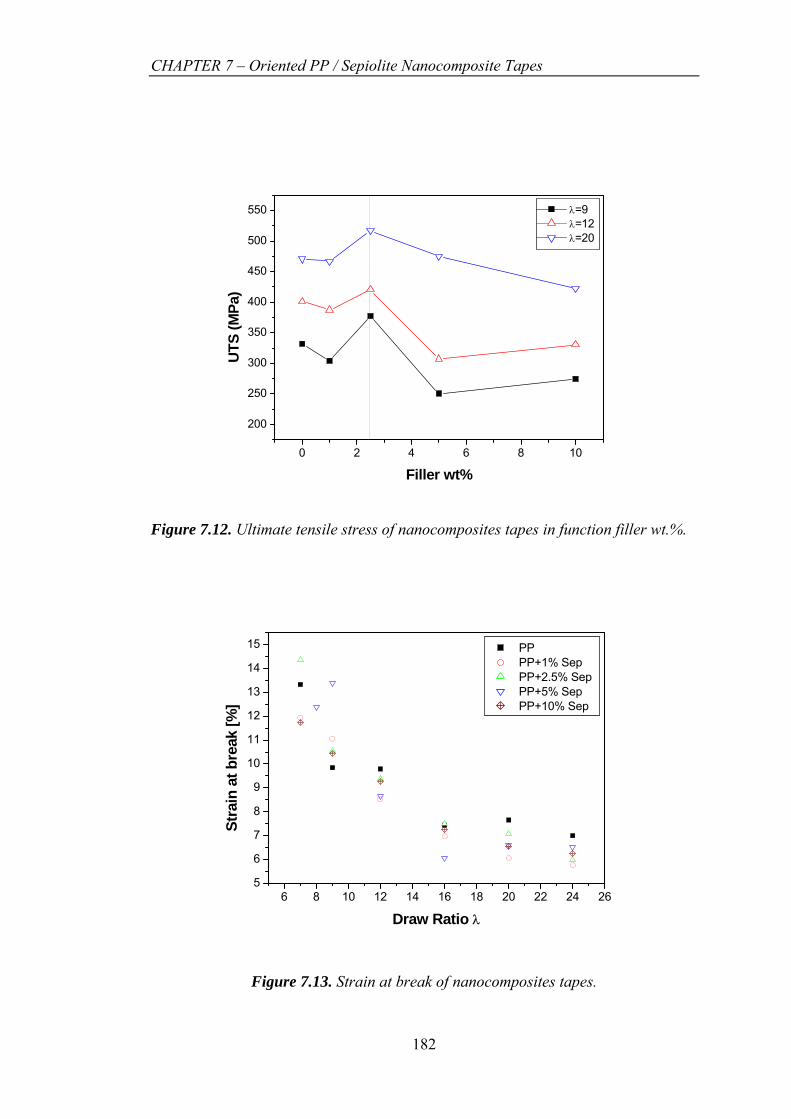
7.12 Ultimate tensile stress of nanocomposites tapes in function filler wt.%. 182
7.13 Strain at break of nanocomposites tapes 182
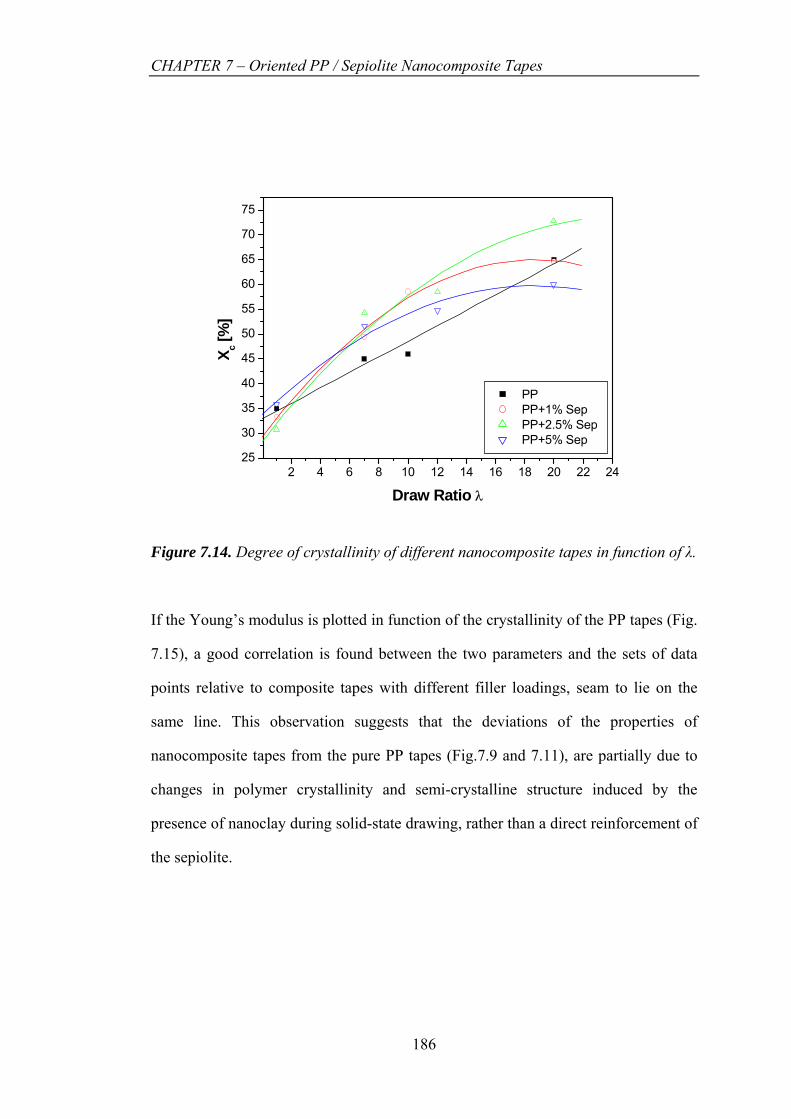
7.14 Degree of crystallinity of different nanocomposite tapes in function of
λ 186
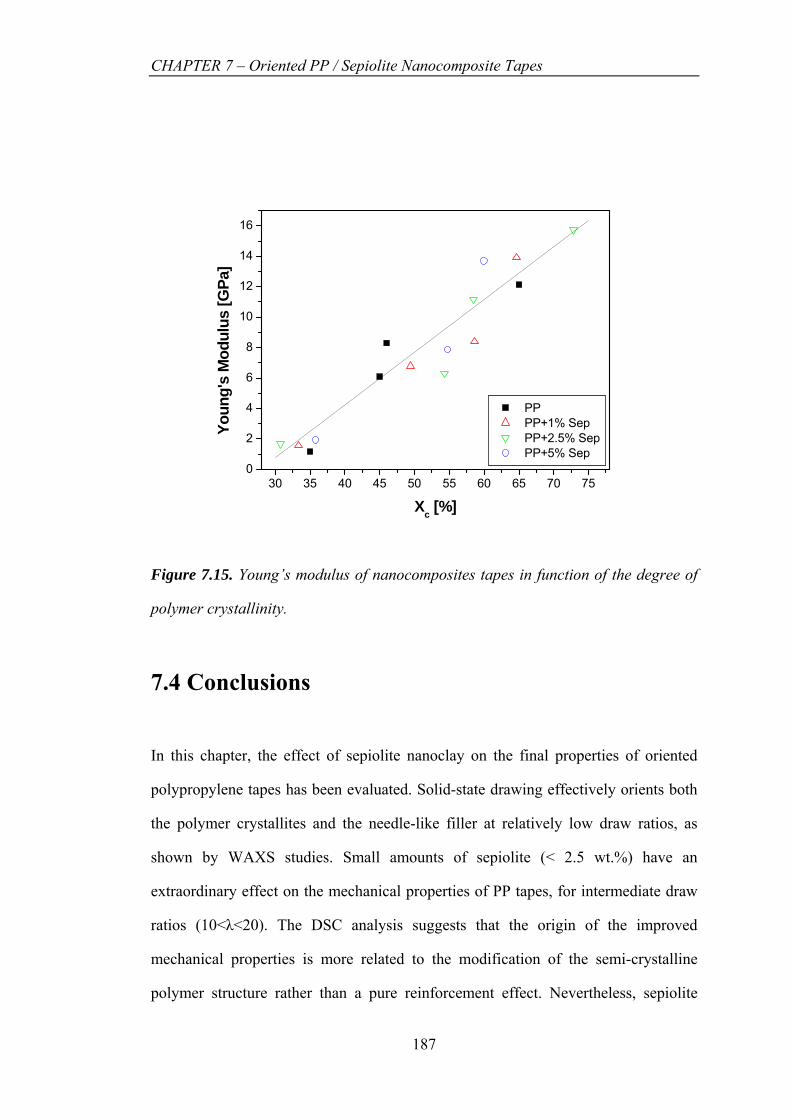
7.15 Young’s modulus of nanocomposites tapes in function of the degree of
polymer crystallinity 187
8.1 SEM micrographs of: a)-b) PP+1%Sep, c)-d) PP+2.5%Sep, e)-f)
PP+5%Sep, at magnification of 5000 and 10000 times respectively. A
good dispersion of sepiolite nanoclays is evident even at relative high
filler content 193
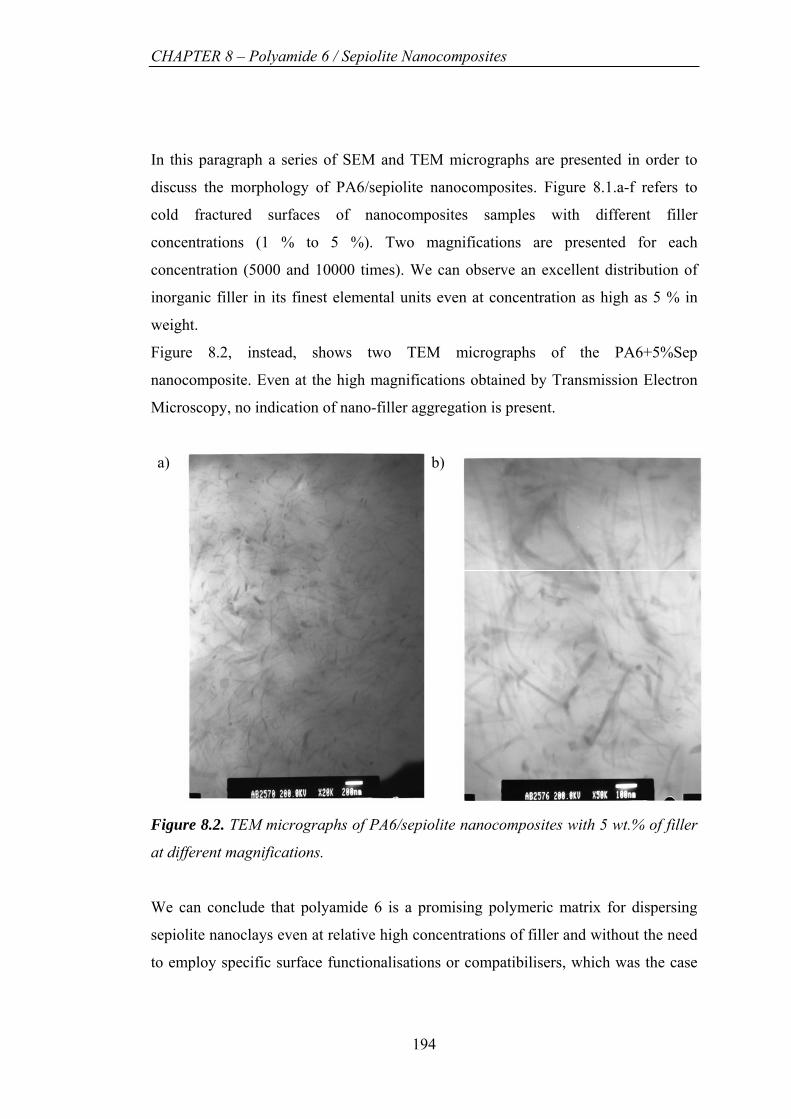
8.2 TEM micrographs of PA6/sepiolite nanocomposites with 5 wt.% of
filler at different magnifications 194
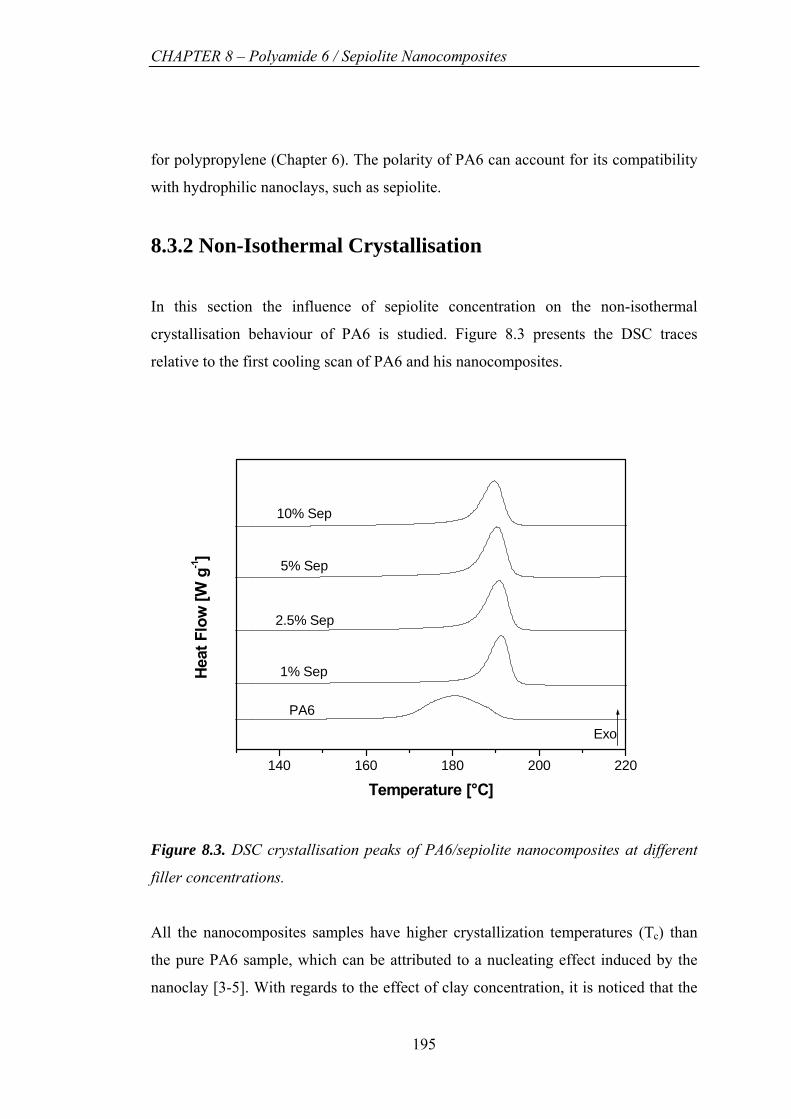
8.3 DSC crystallisation peaks of PA6/sepiolite nanocomposites at
different filler concentrations 195
8.4 DSC melting peaks of PA6/sepiolite nanocomposites at different filler
concentrations 196
8.5 Amount of crystalline phase for PA6/sepiolite nanocomposites. The
heat of fusion for the completely crystalline PA6 is taken as 240 J/g
[3]. Virgin PA6 is presented, for comparison, as open circle, while full
22
Page 23
List of Figures
squares refers to processed samples 197
8.6 Scheme of WAXS measurements in the through direction 198
8.7 WAXS through view: a) PA6, b) PA6+1%Sep, c) PA6+5%Sep. White
arrows show the principal diffraction rings with the corresponding
crystal planes 199
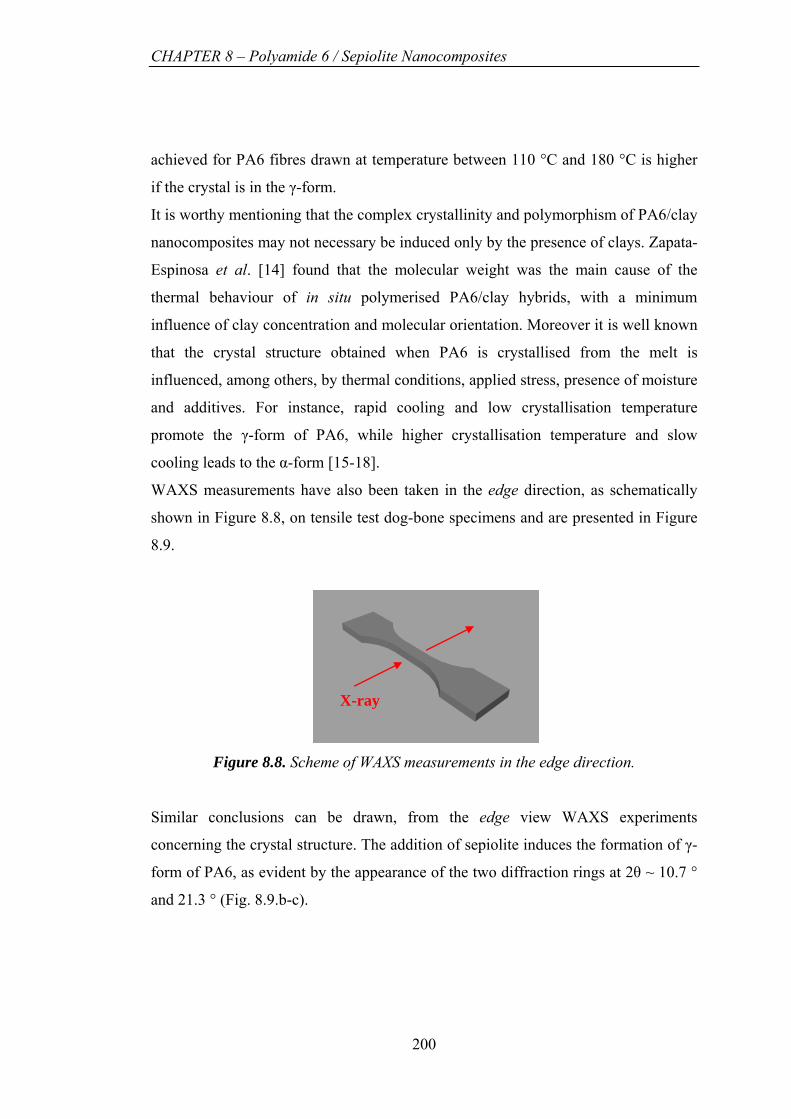
8.8 Scheme of WAXS measurements in the edge direction 200
8.9 WAXS, edge view: a) PA6, b) PA6+1%Sep and c) PA6+5%Sep.
White arrows shows orientation of sepiolite, as can be seen from the
diffraction at 2θ ~ 7.2 °. 201
8.10 Schematic 3D image of a nanocomposite tensile test specimen where
the nanofiller is aligned in-plane. Sepiolite nano-fibres are represented
in red and are not in scale with the specimen dimensions. The real
length of sepiolite clay is about 4000 times smaller than in the picture 202
8.11 TGA of PA6/Sep nanocomposites, in inert atmosphere (N2) 203
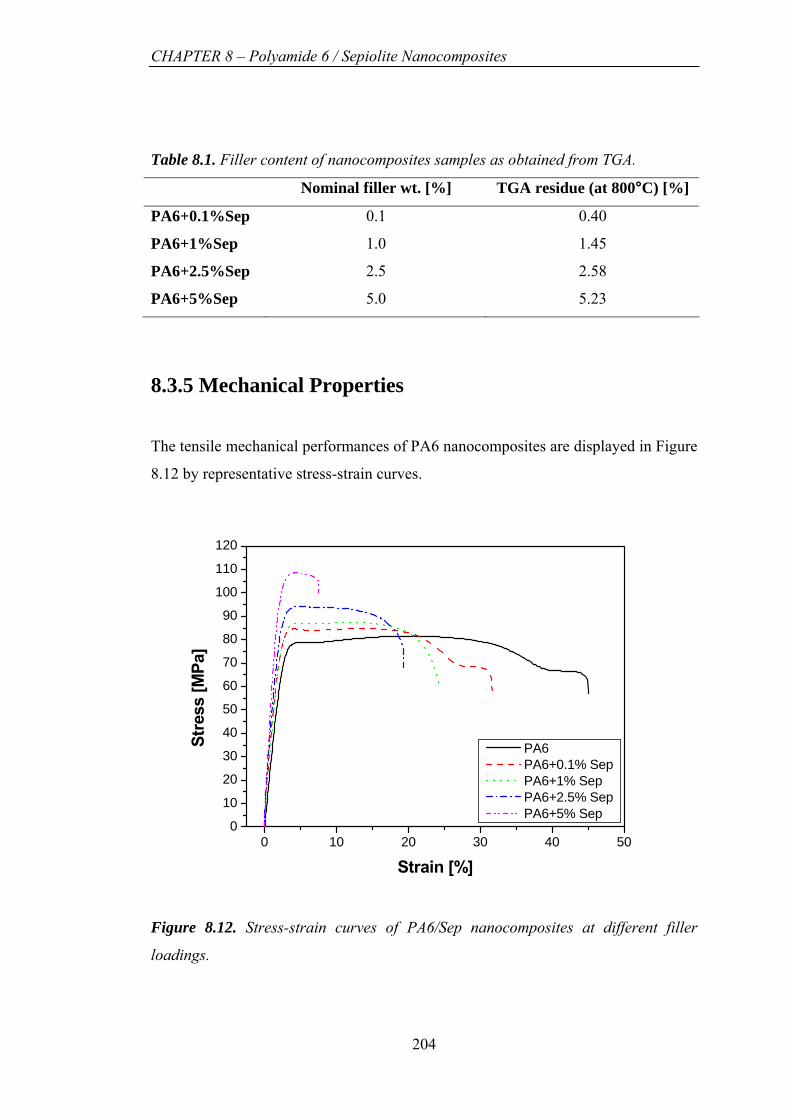
8.12 Stress-strain curves of PA6/Sep nanocomposites at different filler
loadings 204
8.13 Young’s modulus of PA6/sepiolite nanocomposites in function of the
filler loading 205
8.14 Ultimate tensile stress of PA6/sepiolite nanocomposites in function of
the filler loading 205
8.15 Strain at break for PA6/sepiolite nanocomposites in function of the
filler loading 207
8.16 Relative Young’s modulus versus filler vol.%. The lines are prediction
from the Halpin-Tsai equations for 2D randomly oriented PA6/Sep
nanocomposites (fibre-like filler; solid line) and uniaxially (1D)
oriented PA6/MMT nanocomposites (plate-like filler; dotted line),
using true filler aspect ratios (s) as a fitting parameter. The condition
corresponds to the upper bound predictions of the rule of
mixtures
∞→s
209
8.17 Tensile stress of PA6/clay nanocomposites in function of the filler
vol.% 211
23
Page 24
List of Figures
8.18 The natural logarithm of relative tensile stress of PA6/Sep and
PA6/MMT nanocomposites in function of the filler vol.%. From the
linear fit of the experimental data, the parameter B can be extracted 212
9.1 TGA of In-situ PA6/Sep-NH2 masterbatch as produced and after three
successive extractions in formic acid (from bottom to top) 223
9.2 TGA in inert atmosphere (N2) of In-Situ PA6/20%Sep-NH2
masterbatch, before (solid line) and after (broken line) purification in
hot distilled water 224
9.3 SEM micrographs of: a)-b) In-situ PA6+5%Sep and c)-d) In-situ
PA6+5%Sep-NH2, at magnifications respectively of 10000 (left
column) and 50000 times (right column) 227
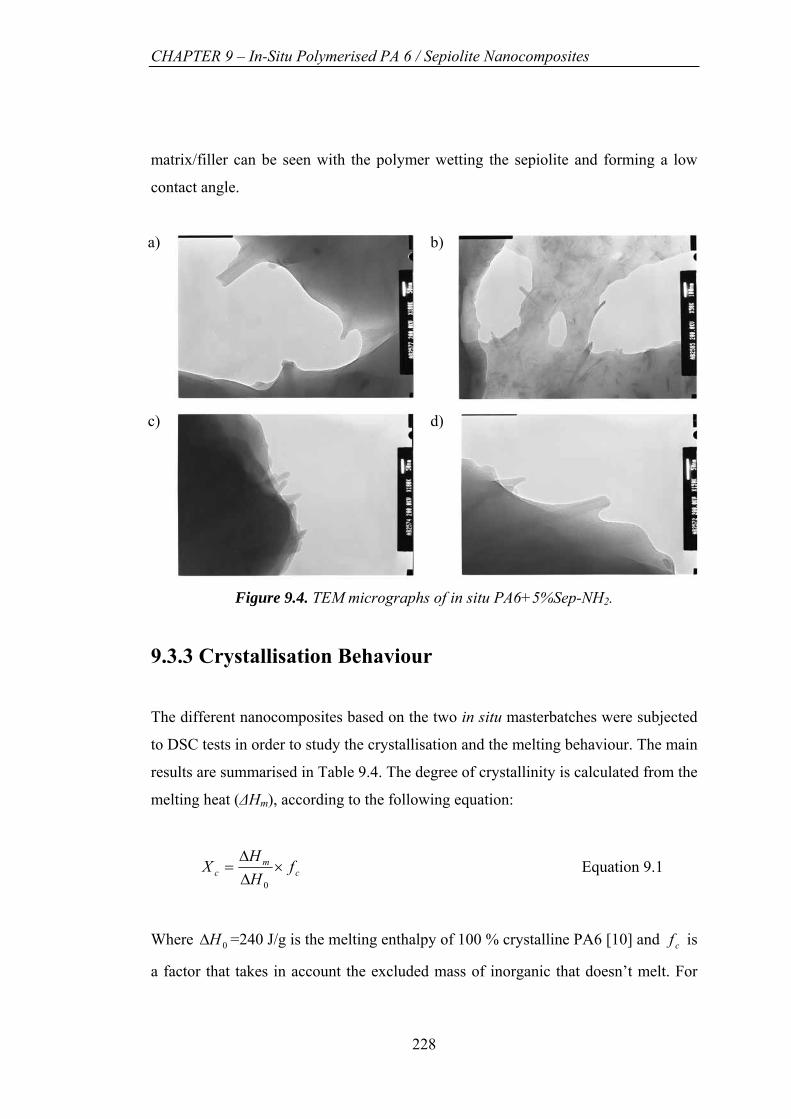
9.4 TEM micrographs of In-situ PA6+5%Sep-NH2 228
9.5 Stress-strain curves of: a) In-situ PA6/Sep and b) In-situ PA6/Sep-NH2
nanocomposites, at different nominal filler loadings 230
9.6 Elastic Moduli for In-Situ PA6/Sep and PA6/Sep-NH2
nanocomposites at different filler loadings 231
9.7 Ultimate tensile stress for In-situ PA6/Sep and PA6/Sep-NH2
nanocomposites at different filler loadings 231
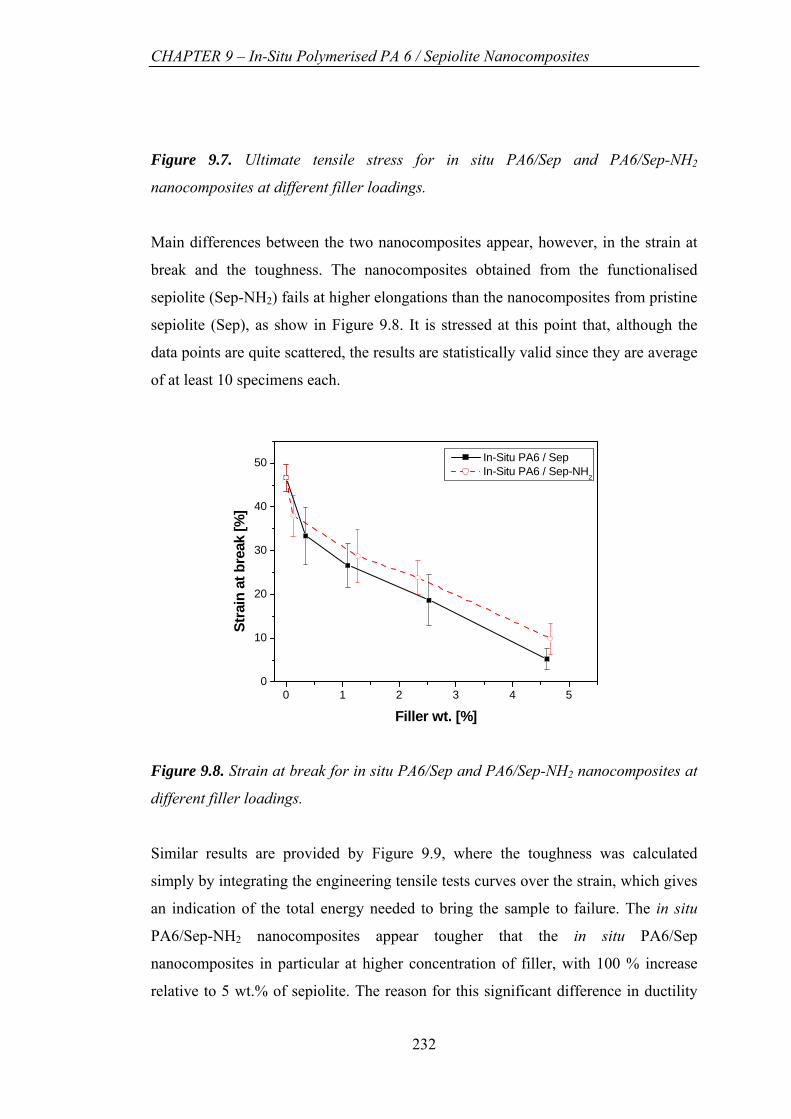
9.8 Strain at break for In-Situ PA6/Sep and PA6/Sep-NH2 nanocomposites
at different filler loadings 232
9.9 Toughness of In-situ PA6 / Sep and PA6 / Sep-NH2 nanocomposites at
different filler loadings, calculated from the integration of the
engineering tensile tests curves over the strain 233
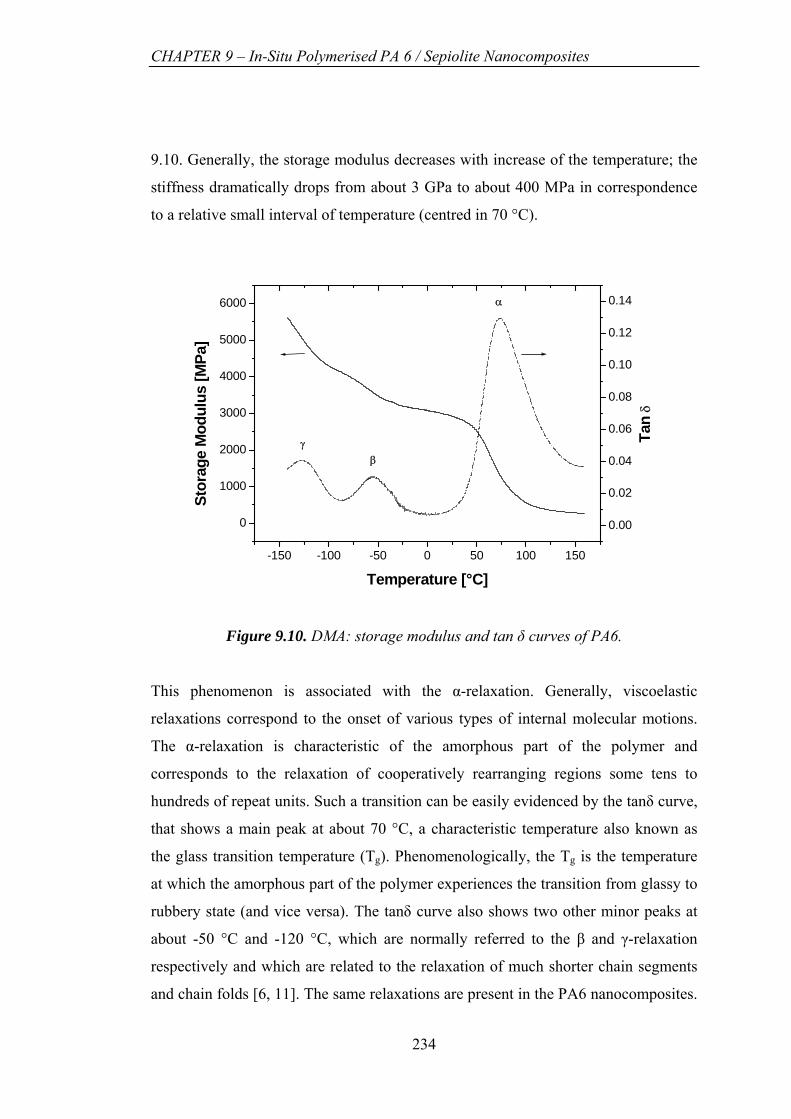
9.10 DMA: storage modulus and tan δ curves of PA6 234
9.11 Tg of In-situ PA6/Sep and In-situ PA6/Sep-NH2 nanocomposites vs.
filler loadings 235
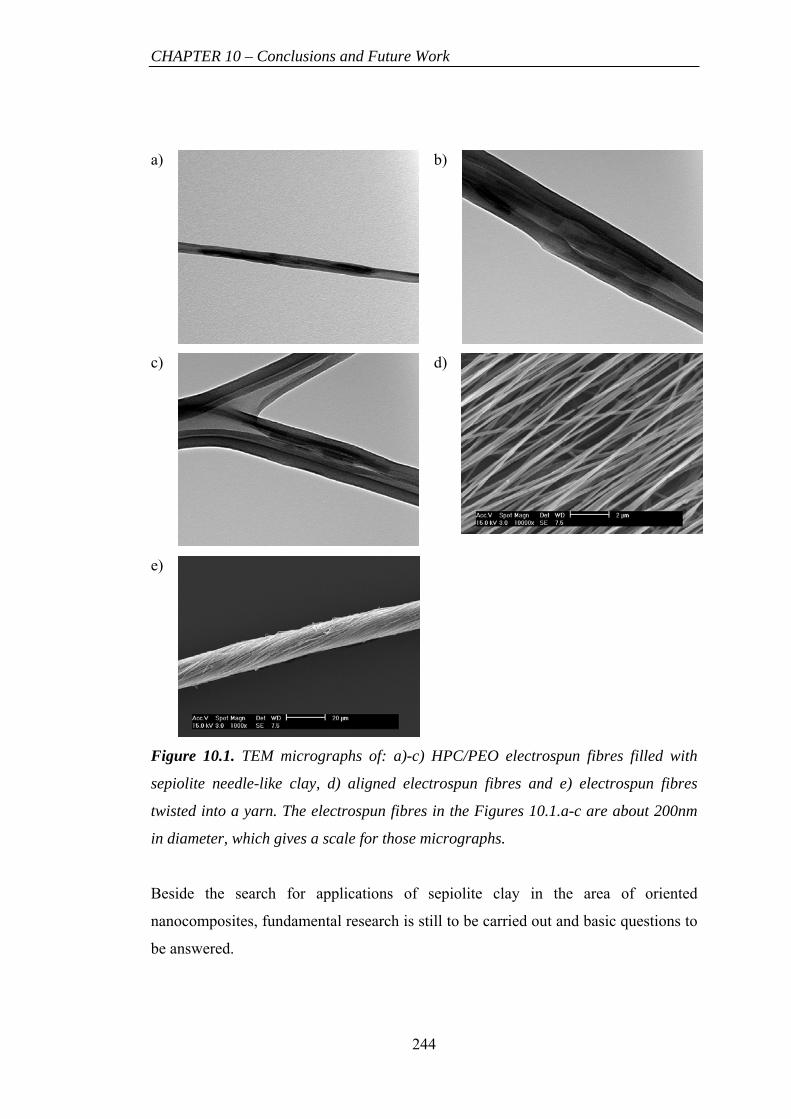
10.1 TEM micrographs of: a)-c) HPC/PEO electrospun fibres filled with
sepiolite needle-like clay, d) aligned electrospun fibres and e)
electrospun fibres twisted into a yarn 244
24
Page 25
1 Introduction
1.1 Nanoclay Composites - The present
In recent years polymer/clay nanocomposites have attracted great interest in
academia and not exclusively. Important enterprises are currently racing to
commercialise nanoclays thermoplastic composites in particular focusing on
automotive parts and packaging. The attractiveness of this new class of material lays
on the large improvements in the mechanical and thermal properties, as well as gas
barrier and flame resistance, provided by only small amounts of nanometre-size clays
homogeneously dispersed in a polymeric matrix. The first commercial
nanocomposites product was an engine cover-belt developed by Japan’s Ube
Industries after being licensed the patented in situ polymerised PA6/Clay
nanocomposites (NCH) technology by Toyota Research Centre, following the
pioneering work done about one decade ago [1-2]. Compared with unfilled nylon 6,
Ube's NCH was claimed to have 68% higher tensile modulus and 126% higher
flexural modulus, along with a reduction in oxygen permeability of 50%. More
recently, Bayer AG (Germany) announced the development of nylon 6
nanocomposites for transparent barrier film packaging. The enhancement in barrier
properties is the key of another application of nanocomposite. Wilson's Double Core
premium tennis ball (Fig.1.1), officially selected for the 2002 Davis Cup, is said to
retain its original air pressure and extend the life time of tennis balls. This is due to
25
Page 26
CHAPTER 1 – Introduction
the presence of a flexible and very thin (10-50µm) nanocomposite barrier coating
(called Air D-Fense, by InMat) that covers the inner core and that inhibits air
permeation through the walls of the ball by a factor of two.
Figure 1.1. Wilson's Double Core premium tennis ball, with technology Air D-Fense,
by InMat [3].
The nanocomposite coating consists of well exfoliated vermiculite nano-clays,
oriented along the radial direction of the ball and embedded in a matrix of butyl
rubber. These platelets act as multi-layer barriers to the diffusion of air and accounts
for the better performances of the tennis balls.
For what concerns the investigations of other properties it is worth to mention the
announcement of a consortium of government and industry scientists, formed by The
National Institute of Standards and Technology (NIST) in Gaithersburg, Md. (USA),
to explore nanocomposites' potential for reducing the flammability of thermoplastics.
In Table 1.1 a series of commercial ventures in polymer-clay nanocomposites are
presented.
26
Page 27
CHAPTER 1 – Introduction
Table 1.1. Examples of commercial ventures in polymer/clay nanocomposites. UBE Nylon6 Toyota timing belt cover, engine manifold cover
Nylon6 Film for packaging
Nylon6/66, 12 Fuel system components
BAYER PLASTICS Nylon6 Film for meat packaging
Nylon6 coating for paper board juice container
PC/ABS Flame retardant computer and monitor housings
FORSTER CORP. Nylon 12 nanocomposites used in catheter tubing
GM Polyolefin TPO for step on Astro vans to replace talc filled materials
UNITIKA Nylon6 automotive parts (Mitsubishi engine cover)
EVOH, Polylactic acid nanocomposites (various automotive uses)
WILSON SPORTING Tennis balls (butyl rubber/nanoclay coating from InMat)
HONEYWELL Nylon6 for food packaging
U.S. ARMY MRE food tray (EVOH)
KABLEWERK EUPEN EVA flame retardant cable coating
TNO Polyacrylate binding system for ceramic moulds
MITSUBISHI Polypropylene nanocomposites for automotive parts
TRITON SYSTEM Polyurethane bladder for athletic shoes
Polyolefin packaging film for food and pharmaceutical packaging
NANOCOR MXD-6 Nylon for barrier food packaging
1.2 Nanocomposites in Nature
If we are just appreciating the properties that nano-fillers as nanoclays can guarantee,
Mother Nature already commonly uses nanocomposites and nano-scale design,
obtaining materials with extraordinary properties. The best way to understand what
might be the potentiality of nanocomposites is simply to observe Nature.
A very common example is the structure of bones. A bone has a complex
arrangement of materials and structures at different length-scales, which work in
synergy to perform diverse mechanical, biological and chemical functions, such as:
structural support, protection and storage of healing cells, and mineral ion
homeostasis. The structure of bone can be described as a hierarchical organisation
27
Page 28
CHAPTER 1 – Introduction
[4]. The different levels of this structure are: (1) the macrostructure: cancellous and
cortical bone; (2) the microstructure (from 10 to 500 µm): Haversian systems,
osteons, single trabeculae; (3) the sub-microstructure (1–10 µm): lamellae; (4) the
nanostructure (from a few hundred nanometres to 1 µm): fibrillar collagen and
embedded mineral; and (5) the sub nanostructure (below a few hundred nanometres):
molecular structure of constituent elements, such as mineral, collagen, and non-
collagenous organic proteins (Fig.1.2). The structure is made more complex by the
3D arrangement and orientations of the different components.
Figure 1.2. Hierarchical structure of bones: a) cortical and cancellous bone; b)
osteons with Haversian systems; c) lamellae; d) collagen fibre assemblies of
collagen fibrils; e) bone mineral crystals, collagen molecules and non-collagenous
proteins. From [4].
Another example of a hierarchically designed material, which is composed by
fundamental units on the nanometre scale, and that can achieve amazing
performances is the Gecko toe pads. Over 2000 years ago, Aristotle [5-6] commented
on the capacity of geckos to “run up and down a tree in any way, even with the head
downwards”. Although some mechanisms on how the Gecko can climb vertical flat
surfaces so easily are still not perfectly understood, we know that the reason lays on
28
Page 29
CHAPTER 1 – Introduction
the hierarchical structure of its toe pads that effectively functions as a smart adhesive
[6]. The adhesive lamellae on the toe pad are composed by micro-scale arrays of
setae (Fig.1.3.B-C) and each seta presents hundreds of nano-scale spatular tips at its
end (Fig.1.3.D-E). The result of this peculiar design is that the gecko’s toe: a)
attaches strongly with minimal preload, b) detaches quickly and easily [7], c) sticks
to nearly every material, d) does not “stay dirty” [8] or e) self-adhere, and 7) is non-
sticky by default.
Figure 1.3. Structural hierarchy of the gecko adhesive system. (A) Macrostructure:
ventral view of a tokay gecko (G. gecko) climbing vertical glass. (B) Mesostructure:
ventral view of the foot, with adhesive lamellae (scansors) visible as overlapping
pads. Note the clean appearance of the adhesive surface. (C) Microstructure:
proximal portion of a single lamella, with individual setae in an array visible. (D and
E) Nanostructure: single seta with branched structure at upper right, terminating in
hundreds of spatular tips [6].
29
Page 30
CHAPTER 1 – Introduction
1.3 Scope of the Thesis
Most of the literature in the field of Polymer/Clay nanocomposites is focused on
platelet-like clays, commonly smectite clays such as Montmorillonite. Few works
have instead been dedicated to fibre-like clays particles. Because of the peculiar
shape, these nano-fillers are believed to be good candidates for the preparation of
nanocomposites materials. In fact the dispersion of needle-like clays, compared to
platelet-like clays, is favoured by the relatively small contact surface area.
Furthermore the reinforcement efficiency of fibres is higher than platelet for uniaxial
composites.
The focus of this research is the investigation of sepiolite, a natural needle-like clay,
as a reinforcement for thermoplastic polymers. Two polymer matrices will be taken
in consideration: polypropylene (PP) and polyamide 6 (PA6).
Particular emphasis will be given to the nanocomposites preparation, improvements
in the inorganic filler dispersion, interphase compatibility and, not least,
nanocomposites characterisation and structure-properties relationship. Whenever
possible, the polymer/sepiolite nanocomposites prepared will be compared and
benchmarked with the more widely studied smectite clays nanocomposites from the
scientific literature, throughout this thesis.
1.4 References
1. Okada A, Kawasumi M, Usuki A, Kojima Y, Kurauchi T, Kamigaito O. Synthesis
and properties of nylon-6/clay hybrids. In: Schaefer DW, Mark JE, editors. Polymer
based molecular composites. MRS Symposium Proceedings, Pittsburgh, vol. 171;
1990. p. 45–50.
2. Usuki, A.; Kawasumi, M.; Kojima, Y.; Okada, A.; Kurauchi, T.; Kamigaito, O. J
Mater Res 1993, 8, 1174.
3. http://www.wilsonsports.com.au/tennis/doublecore.html
30
Page 31
CHAPTER 1 – Introduction
4. J. Rho, L. Kuhn-Spearing, P. Zioupos. Mechanical properties and the hierarchical
structure of bone. Medical Engineering & Physics. 20, 2 (1998) 92-102.
5. Aristotle (350 B.C.E., 1918) Historia animalium translated by Thompson, D'A-W.
Clarendon .Press, Oxford.
6. K. Autumn. Properties, Principles, and Parameters of the Gecko Adhesive System.
From: Biological Adhesives (ed. by AM. Smith and JA. Callow) 63 Springer-Verlag
Be& Heidelberg 2006.
7. K. Autumn, A. Peattie. Mechanisms of adhesion in geckos. Int. Comp Bio 42
(2002) 1081-1090.
8. W. Hansen, K. Autumn. Evidence for self-cleaning in gecko setae. PNAS, (2005)
102385-389.
31
Page 32
PART 1: Literature Survey
32
Page 33
2 Clays and Clay Minerals
2.1 Introduction
The term clay has often been defined operationally. According to Grim [1, 2] “the
term clay implies a natural, earthy, fine-grained material which develops plasticity
when mixed with a limited amount of water. By plasticity is meant the property of
the moistened material to be deformed under the application of pressure, with the
deformed shape being retained when the deforming pressure is removed”.
Clays are the main constituents of the fine-grained sedimentary rocks as mudstones
and shales in marine sediments and in soils and are the results of weathering and
secondary sedimentary processes with only a few examples of clays forming in
primary igneous or metamorphic environments.
In geology, the term clay includes particles <2 µm in size; the morphology of the
clay-mineral components being a distinctive property of a particular clay. For
instance, kaolinite usually shows hexagonal flake-shaped unites with a ratio of areal
diameter to thickness (aspect ratio) of 2-25:1, while most of smectite mineral
particles have an irregular flake shape but with a much higher aspect ratio, 100-
300:1. Halloysite minerals show an elongated tubular shape, while the family of
attapulgite/sepiolite/palygorskite are characterised by a peculiar elongated lath or
fibre-shape.
33
Page 34
CHAPTER 2 – Clays and Clay Minerals
a) b)
c)
d)
Figure 2.1. Electron microscope micrographs of different clays: a) kaolinite, b)
montmorillonite, c) halloysite and d) sepiolite.
2.2 Nomenclature of Clay Minerals
Clay minerals belong to the family of phyllosilicates (or layered silicate). The
fundamental building units of phyllosilicates (and then of clay minerals) are
tetrahedral and octahedral sheets. Tetrahedral sheets are composed of individual
tetrahedrons, in which a silicon atom (but also Al3+, Fe3+, etc) is equidistant from
four oxygens, or hydroxyls if needed to balance the structure. They are arranged in a
hexagonal pattern with the basal oxygens linked and the apical oxygens pointing
up/down and taking part in the adjacent octahedral sheet.
Figure 2.2. Tetrahedral sheet
34
Page 35
CHAPTER 2 – Clays and Clay Minerals
Octahedral sheets are composed of individual octahedrons that share edges
composed of oxygen and hydroxyl anion groups coordinated by cations like Al, Mg,
Fe3+ and Fe2+, etc.
Figure 2.3. Octahedral sheet
According to the valence of the cation we can distinguish di-octahedral or tri-
octahedral sheet, which structure resemble respectively the minerals Gibbsite
Al(OH)3 and Brucite Mg(OH)2. When we have a trivalent cation (i.e. Al3+), in order
to maintain electric neutrality, the cation to oxygen ratio is 1:3. This leaves every
third site empty, meaning only 2 out of 3 sites are occupied. This arrangement is
called di-octahedral or Gibbsite-like sheet. Instead, when we have a divalent cation
(i.e. Mg2+) occupying the edge sharing hexagonal sheet the cation to oxygen ratio is
1:2 and every lattice site is filled. This arrangement is called tri-octahedral or
Brucite-like sheet.
The main criterion of classification of phyllosilicates is determined by the way the
different tetrahedral, di- and tri-octahedral sheets are packed together. The structure
of kaolinite, for instance, is composed by one silica tetrahedral sheet and one alumina
octahedral (1:1) sheet combined to form a layer unit, in which the apical oxygens of
the tetrahedral sheet are also part of the octahedral sheet (Fig. 2.4.a). Smectite is
composed of units made up of two silica tetrahedral sheets with a central alumina
octahedral sheet (2:1) (Fig. 2.4.b). The structure of chlorite, instead, can be imagined
as consisting of alternating smectite-like layers and a brucite-like tri-octahedral sheet
(Fig. 2.4.c).
In clay minerals, except for kaolinite, a certain number of cations are replaced by
ions of lower valence. So Si3+ in the tetrahedral sheet can be replaced by Al2+, while
Al2+ in the octahedral sheet may be replaced by Li+, Mg2+, Fe2+, Fe3+, Zn2+, etc.
35
Page 36
CHAPTER 2 – Clays and Clay Minerals
These isomorphous substitutions, along with the presence of vacancies, account for a
negative charged surface of the clays layers. The net negative charge, often denoted
as CEC (Cation Exchange Capacity) and expressed as mequiv/100 g, are
counterbalanced by alkali and alkaline earth cations situated inside the galleries
(defined as the space between two layer units).
a)
b)
c)
Figure 2.4. Proposed crystallographic structures for: a) kaolinite, b) smectite and c)
chlorite. From [1].
In the case of tetrahedrally substituted layered silicates, the negative charge is located
on the surface of silicate layers, and hence, it is more ready for interaction (for
instance with polymers) compared with octahedrally substituted material. The
interlayer charge can create a bonding between different layers also relatively strong
36
Page 37
CHAPTER 2 – Clays and Clay Minerals
that are closely packed and difficult to exfoliate. In montmorillonite (MMT), on the
other hand, the ions are exchangeable, the distance between the layers can thereby
increase and the material can swell (denoted as swelling clay minerals). Two
different classifications of clay minerals are presented in Table 2.1-2.2.
Table 2.1. Classification of clay minerals. From [1].
I. Amorphous Allophane group
II. Crystalline A. Two-layer type (sheet structures composed of units of one layer of silica
tetrahedrons and one layer of alumina octahedrons. 1. Equidimensional
Kaolinite group Kaolinite, Nacrite, etc.
2. Elongate Halloysite group
B. Three-layer types (sheet structures composed of two layers of silica tetrahedrons and one central di-octahedral or tri-octahedral layer)
1. Expanding lattice a. Equidimensional
Montmorillonite group Montmorillonite, sauconite, etc. Vermiculite
b. Elongate Montmorillonite group Nontronite, Saponite, hectorite
2. Nonexpanding lattice Illite group
C. Regular mixed-layer types (ordered stacking of alternate layers of different types)
Chlorite D. Chain-structure type (hornblende-like chains of silica tetrahedrons linked
together by octahedral groups of oxygens and hydroxyls containing Al and Mg atoms)
Attapulgite Sepiolite Palygorskite
37
Page 38
CHAPTER 2 – Clays and Clay Minerals
Table 2.2. Proposed classification of phyllosilicate (as submitted by AIPEA
Nomenclature Committee to the International Mineralogical Association). From [1].
Type Group (x=layer charge)
Subgroup Species
Pyrophyllites Pyrophyllite Pyrophyllite-talc x~0 Talcs Talc
Dioctahedral smectites or montmorillonite
Montmorillonite, beidellite, nontronite
Smectite or montmorillonite-saponite x~0.5-1
Trioctahedral smectites or saponites
Saponite, hectorite, sauconite
Dioctahedral vermiculite Dioctahedral vermiculite Vermiculite x~1-1.5 Trioctahedral vermiculite Trioctahedral vermiculite
Dioctahedral micas Muscovite, paragonite Mica x~2 Trioctahedral micas Biotite, phlogopite
Dioctahedral brittle micas Margarite
2:1
Brittle mica x~4 Trioctahedral brittle micas Seybertite,
xanthophyllite, brandisite Dioctahedral chlorite 2:1:1 Chlorite
x variable Trioctahedral chlorite Pennine, clinochlore, prochlorite
Kaolonites Kaolinite, halloysite 1:1 Kaolinite-serpentine x~0 Serpentines Chrysotile, lizardite,
antigorite
2.3 Sepiolite Clay
Sepiolite is a fibrous hydrated magnesium silicate, a typical formula for which is
Mg4Si6O15(OH)2·6H2O. The name comes from a perceived resemblance of the
material to the porous bones of the cuttlefish or sepia. Sepiolite is included in the
phyllosilicate group because it contains a continuous two-dimensional tetrahedral
sheet of composition Si O [1, 3]. It differs, however, from the other layered silicates
because of the lack of a continuous octahedral sheet (Fig. 2.5.d). 2 5
It can be imagined
as formed of blocks structurally similar to layered clay minerals (i.e. MMT),
composed of two tetrahedral silica sheets and a central octahedral sheet containing
Mg, but continuous only in one direction (c-axis). More blocks are linked together
along their longitudinal edges by Si-O-Si bonds and this creates channels along the c-
38
Page 39
CHAPTER 2 – Clays and Clay Minerals
axis (Fig. 2.5.b-d). Moreover, because of the covalent link between different blocks,
sepiolite has been described as a non-swellable clay. Due to the discontinuity of the
external silica sheets, a significant number of silanol groups (SiOH) are situated at
the edges of this mineral.
a)
b)
c)
d)
Figure 2.5. Structure of sepiolite clays: a) SEM picture of natural sepiolite, b)
schematic representation of a single sepiolite fibre, c) TEM picture representing a
single nanofibre cross-section and d) suggested mineralogical structure.
Sepiolite is composed by elemental particles with needle-like of fibre-like shape. The
dimensions of the a single sepiolite fibre vary between 0.2-4µm in length, 10-30nm
in width and 5-10nm in thickness, with open channels of dimensions 3.6 Å x 10.6 Å
running along the axis of the particle (Fig. 2.5.a-b). These particles are arranged
forming loosely packed and porous aggregates with an extensive capillary network
which explains the high porosity. Sepiolite has the highest surface area of all the clay
minerals, about 300 m2/g and a high sorption capacity. There are three sorption sites:
(a) oxygen ions on the tetrahedral sheet, (b) a small amount of cation-exchange sites
(0.1-0.6 mequiv/100 g) and (c) the already mentioned SiOH groups. Adsorption is
also influenced by the size, shape and polarity of the molecules involved. Neither
large molecules nor those of low polarity can penetrate the channels though they can
39
Page 40
CHAPTER 2 – Clays and Clay Minerals
be adsorbed on the external surface, which accounts for about 50-60 % of the total
surface area [4, 5]. The SiOH groups act as neutral sorption sites for suitable for
organic species. Apart from the outstanding sorptive capacity, sepiolite is also known
for its colloidal properties. When dispersed in a liquid, it forms a structure of
randomly intermeshed elongated particles, which is maintained by secondary bonds.
This structure is stable even in systems with high salt concentrations, condition that
produces the flocculation of other clay’s suspensions, as bentonite. Sepiolite provides
a pseudoplastic and thixotropic behaviour which make it a valuable material in
multiple applications to improve processability, application or handling of the final
product. Common industrial applications of sepiolite are listed in Table 2.3.
Table 2.3. Sepiolite physic-chemical properties on the basis of common industrial
applications.
Application Characteristic
Cat and pet litters Light weight, high liquid absorption, odour control.
Industrial absorbents High liquid absorption, mechanical strength in wet
conditions, non-flammability, chemical inertness.
Carrier for chemicals Absorption of active chemicals and easiness and
effectiveness in delivering them.
Bitumens Control of rheological properties in heat application
systems, improving fire resistance.
Rheological additives Stability, pseudo-plasticity and thixotropy in paints,
adhesives, mastics and sealants.
Health and Safety
The use of nanoparticles has recently raised several health issues. It is then
fundamental to understand the risks in handling sepiolite and using it as a nanofiller
for polymeric matrices. The health and safety assessments of the sepiolite used
(River Tajo basin, Madrid, Spain) supplied by Tolsa (Spain), including
40
Page 41
CHAPTER 2 – Clays and Clay Minerals
epidemiological, in vitro and in vivo studies, didn’t show any health hazards [6].
Sepiolite is even registered by the EU as an additive for animal feed [7, 8]. However
if there were any risks, they would be expected to be associated with inhalation
through the respiratory system. In this respect, an aspect of concern can be the
similarity of sepiolite morphology with asbestos, a notorious carcinogen. Sepiolite
particles are fibrous at a microscopic level with an average length of 1-2 µm, while
asbestos fibres have a much longer particle length, even of millimetres. Only fibres
with a length longer than 5 µm are considered a possible health hazard, although they
also need to meet other conditions, for example, biopersistence in biological tissues
for very long periods. The two minerals (asbestos and sepiolite) are also quite easy to
distinguish (i.e. XRD) and they are not usually contaminated by each other. In fact
they have a completely different geological origin. Most of sepiolite clay (including
the one employed in this thesis) has a sedimentary geological origin. They have been
formed, around 15 M years ago, by chemical precipitation in shallow lakes in periods
of arid climate when the concentration of elements (Si, Mg, Al mainly) were
suitable. These conditions are quite rare and this is one of the reasons why there are
so few commercial sepiolite deposits in the world. On the contrary, asbestos are
originated in conditions of higher pressure and temperature that produce well
crystallised and very long particles. In fact, the conditions for the formation of
sedimentary sepiolite are not compatible with the formation of asbestos and therefore
sepiolite cannot occur along with asbestos. There is other sepiolite type, very rare,
that is formed in hydrothermal conditions and whose particles have a longer length.
This sepiolite type could be contaminated with asbestos since the conditions for the
formation of this particular sepiolite are compatible with the formation of asbestos.
Sepiolite Costs
It is not easy to give an exact indication of the price of nanoclays because these
products are still mostly under development, especially if specific modifications are
required. Also, the price will definitely depend on the final customer (application
area, potential consumption, etc.). According to recent reports [9], the current price
41
Page 42
CHAPTER 2 – Clays and Clay Minerals
of nanoclays based on organically modified montmorillonite varies between 5 and 18
€/kg and it is expected go down to 3-8 €/kg in the next decade. Conventional fillers
are much cheaper, but also vary greatly depending on the mineral and grade.
Concerning sepiolite-based products, the current price ranges between 0.7 €/Kg to 2
€/kg, depending on the type of product and whether it is modified or not. The target
price for sepiolite as a nanoclay is in the range of 3-4 €/kg [10].
2.4 References 1. R.E. Grim, Clay Mineralogy. 1968, New York: McGraw–Hill.
2. R.E. Grim, Applied Clay Mineralogy. 1962, New York: McGraw–Hill.
3. http://www.ima-mineralogy.org.
4. E. Galan, Properties and applications of palygorskite-sepiolite clays. Clay
Minerals, 1996. 31(4): p. 443-453.
5. A.J. Aznar, E. Gutierrez, P. Diaz, A. Alvarez, and G. Poncelet, Silica from
sepiolite: Preparation, textural properties, and use as support to catalysts.
Microporous Materials, 1996. 6(2): p. 105-114.
6. http://www.hse.gov.uk/lau/lacs/37-2.htm.
7. P. Suáreza, M.C. Quintana, and L. Hernández, Determination of bioavailable
fluoride from sepiolite by “in vivo” digestibility assays. Food and Chemical
Toxicology, 2008. 46(2): p. 490-493.
8. http://www.tolsa.com.
9. http://www.nanoroadmap.it.
10. Private communication with Tolsa.
42
Page 43
3 Polymer / Clay Nanocomposites
3.1 Introduction
Although the intercalation chemistry of polymers mixed with appropriately modified
natural layered silicates or synthetic layered silicates has long been known [1-3],
recent findings have attracted a lot of interest and more and more research in the field
of polymer-clay nanocomposites [4-6]. Very important has been the pioneering work
carried out by Toyota Central Research Laboratories on Nylon 6-Montmorillonite
(MMT) nanocomposites. They obtained encouraging enhancements in mechanical
properties along with heat distortion temperature and decrease in permeability, with
only few weight percentage content of MMT, by an in situ-polymerisation method
[7, 8]. Melt-processing studies on polymer-clays nanocomposites followed and Vaia
and Giannelis have been among the first and most proliferous authors in the field [9].
Melt-processing is of particular interest in prospective of the industrial applications
of nanocomposites, but many problems and limitations still have to be overcome. In
fact, the simple mixture of layer-silicates with polymer melts doesn’t guarantee to
obtain nanocomposites. Actually it’s not often the case and a lot of literature
accounts for the difficulties of this task. The fundamental concept of nanocomposites
is based on the high aspect ratios and large interfaces provided by nano-fillers and
hence a substantial reinforcement obtained at small loadings, given that a perfect
dispersion of individual clays in a polymeric matrix is achieved. On the other hand,
43
Page 44
CHAPTER 3 – Polymer / Clay Nanocomposites
the peculiarity of nano-fillers of having very high specific surface areas and small
dimensions simultaneously leads to a preference for agglomeration in micrometric
stacks or bundles due to Van der Waals interactions, ionic interaction and/or
hydrogen bonds. In this eventuality a traditional micro-composite would be obtained,
with poor interactions between the organic and inorganic phase. The situation is even
more challenging if the dispersing matrix is hydrophobic as it is for many important
classes of polymers. In this case the intrinsic hydrophilic nature of layered silicates
doesn’t allow a good exfoliation and dispersion because of lack of thermodynamic
driving forces. Different strategies have been pursued. A first approach takes to the
modification of clay surfaces, mainly by ion-exchange reaction with cationic
surfactants including primary, secondary, tertiary, and quaternary alkyl-ammonium
or alkyl-phosphonium cations (Fig. 3.1). These surfactants are able to intercalate into
the inter-layers galleries, swelling the clays and, at the same time, bearing a long
aliphatic tail compatible with hydrophobic polymers or, eventually, functional groups
able to react with a polymer or initiate a polymerisation reaction.
Figure 3.1. Schematic representation of modification of platelet-like nano-clays by
cation-exchange reaction with surfactant molecules. From [10].
The effect is to help the accessibility of polymer molecules in the clay inter-layers,
by increasing the clay basal distance, and the compatibility of the clays with the
polymer matrix. Because of the importance of the intercalating surfactants, a lot of
studies focused in understanding the inter-layer structure of organo-modified
44
Page 45
CHAPTER 3 – Polymer / Clay Nanocomposites
silicates. Traditionally, based almost exclusively on WAXS analysis, the organic
chains were thought to lay either parallel to the clay, forming lateral mono- or bi-
layers, or, depending on the packing density and the chain length along with the
temperature, radiate away from the silicate surface forming extended mono or even
bimolecular tiled paraffin-like arrangement (Fig. 3.2). Such idealised structure is
based almost on all-trans conformation adopted by the alkyl chains.
Figure 3.2. Interlayer structures of intercalated surfactant molecules into the nano-
clays galleries. From [11].
Successive studies [11] based on FTIR, found the intercalated chains existing in
more complicated structures, contemplating the presence of ‘gauche’ conformations.
As the interlayer packing density or the chains length decreases (or the temperature
increases), the intercalated chains adopt a more disordered, liquid-like structure (Fig.
3.3).
Figure 3.3. Alkyl chain aggregation model. As the chain length increases the
structure changes from liquid-like to liquid crystalline-like. From [11].
45
Page 46
CHAPTER 3 – Polymer / Clay Nanocomposites
However, the extensive use of organo-modified nano-clays in the literature has not
always given the wished results and the natural tendency to agglomeration has either
been difficult to overcome or led to thermodynamically unstable composites.
Polypropylene (PP) or polyethylene (PE)-based nanocomposites, for instance, for
which good levels of exfoliation had been claimed when processed with high shear
forces apparatus, undergo (partial) re-agglomeration of the nano-clays.
Figure 3.4. In situ SAXS-WAXS experiments during melting/recrystallisation. The
appearance of a small angle reflection after polymer melting shows partial re-
agglomeration of the clays. From [10].
Fig. 3.4 shows small angle and wide angle X-ray diffraction (SAXS and WAXS)
patterns of an isotactic polypropylene (iPP) nanocomposite during a
melting/crystallisation temperature cycle. Partial re-agglomeration is demonstrated
by the appearance of a small angle reflection when the nanocomposite melts and the
system evolves towards a thermodynamically more stable configuration.
We can understand that the ability to control the dispersion of nano-fillers in a
polymeric phase is the key issue that affects the performances of the final material
and the possibility itself to obtain nanocomposite. Depending on the thermodynamic
driving forces and the interfacial interactions between polymer matrix and nano-
clays, three main different structures can be distinguished:
46
Page 47
CHAPTER 3 – Polymer / Clay Nanocomposites
I. Conventional micro-composites
Polymer chains are not able to enter into the interlayer space of the clays, which
preserve their agglomerated stacked structure, due to low affinity of the organic and
inorganic phases and poor interface properties. In this case we can not expect
properties far from those of conventional filled composites.
II. Intercalated nanocomposites
Polymer chains enter into the silicates interlayers and wet the clays with few polymer
layers. Hence the basal distance increase but the clays are still found in an ordered
stacked manner.
III. Exfoliated nanocomposites
Single nano-clays are completely and randomly dispersed into a continuous polymer
matrix. The distance between clays depends only from the filler loading and not from
any attractive forces.
Figure 3.5. Representation of the possible morphology arising from the interaction
of nanoclays and polymer: a) non-intercalated, conventional micro-composite; b)
intercalated nanocomposite and c) exfoliated nanocomposite. From [4].
47
Page 48
CHAPTER 3 – Polymer / Clay Nanocomposites
3.2 Preparation of Polymer-Clay Nanocomposites
Several strategies have been considered to prepare polymer-clay nanocomposites.
We can distinguish four main groups: solution processing, in situ polymerisation,
melt processing and template synthesis.
3.2.1 Solution Processing
Solution processing is based on a solvent system in which the polymer is soluble and,
at the same time, the nano-clays are able to swell. In general, the clays are first
swollen in a solvent to form a homogeneous suspension in which the soluble polymer
is successively added. The process ends with the evaporation of the solvent or the
precipitation of the mixture, trapping the polymer chains intercalated into the inter-
layers of the clays. Polymer intercalation from solution involves a large number of
solvent molecules to be desorbed from the layered silicates in order to host polymer
chains instead. From an energetic point of view, the decrease in conformational
entropy of the confined polymer chains into the clays galleries is compensated by the
gain in translational degree of freedom during desorption of solvent molecules.
This method found extensive applications especially for water-soluble polymers.
Among the most studied there are Poly(vinyl alcohol) (PVOH) [12], Poly(ethylene
oxide) (PEO) [13], Poly(vinyl pyrrolidone) (PVP) [14], Poly(acrylic acid) (PAA)
[15]. Example of non water-soluble polymers are high density Poly(ethylene)
(HDPE) [16], with organo-modified Montmorillonite and a mixture of
Xylene/Benzonitrile as solvent, or Poly(lactide) PLA [17] and Poly(ε-caprolactone)
PCL [18] in hot Chloroform.
3.2.2 In Situ Polymerisation
In situ polymerisation involves the swelling of clays in a liquid monomer, or
monomer solution, which is successively polymerised directly in presence of
48
Page 49
CHAPTER 3 – Polymer / Clay Nanocomposites
49
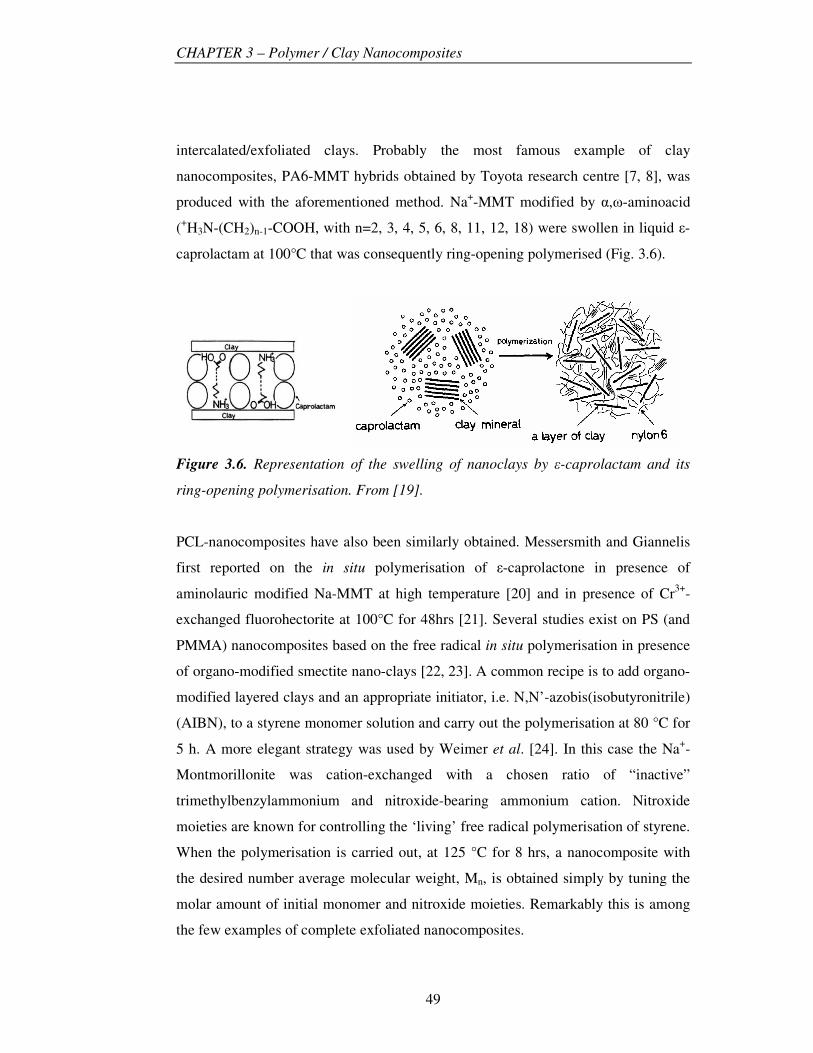
intercalated/exfoliated clays. Probably the most famous example of clay
nanocomposites, PA6-MMT hybrids obtained by Toyota research centre [7, 8], was
produced with the aforementioned method. Na+-MMT modified by �,�-aminoacid
(+H3N-(CH2)n-1-COOH, with n=2, 3, 4, 5, 6, 8, 11, 12, 18) were swollen in liquid �-
caprolactam at 100°C that was consequently ring-opening polymerised (Fig. 3.6).
Figure 3.6. Representation of the swelling of nanoclays by �-caprolactam and its
ring-opening polymerisation. From [19].
PCL-nanocomposites have also been similarly obtained. Messersmith and Giannelis
first reported on the in situ polymerisation of �-caprolactone in presence of
aminolauric modified Na-MMT at high temperature [20] and in presence of Cr3+-
exchanged fluorohectorite at 100°C for 48hrs [21]. Several studies exist on PS (and
PMMA) nanocomposites based on the free radical in situ polymerisation in presence
of organo-modified smectite nano-clays [22, 23]. A common recipe is to add organo-
modified layered clays and an appropriate initiator, i.e. N,N’-azobis(isobutyronitrile)
(AIBN), to a styrene monomer solution and carry out the polymerisation at 80 °C for
5 h. A more elegant strategy was used by Weimer et al. [24]. In this case the Na+-
Montmorillonite was cation-exchanged with a chosen ratio of “inactive”
trimethylbenzylammonium and nitroxide-bearing ammonium cation. Nitroxide
moieties are known for controlling the ‘living’ free radical polymerisation of styrene.
When the polymerisation is carried out, at 125 °C for 8 hrs, a nanocomposite with
the desired number average molecular weight, Mn, is obtained simply by tuning the
molar amount of initial monomer and nitroxide moieties. Remarkably this is among
the few examples of complete exfoliated nanocomposites.
Page 50
CHAPTER 3 – Polymer / Clay Nanocomposites
The first to use in situ polymerisation for the preparation of PP-clay nanocomposites
was Tudor et al. [25]. The process can be schematised in a first step in which a
synthetic hectorite was treated with methylaluminoxane “MAO”, in order to remove
the acidic protons, followed by the intercalation of soluble metallocene catalyst
([Zr(η-C5H5)2Me(THF)]+), that was then able to initiate the coordination
polymerisation of PP. With a similar approach, in situ HDPE-nanocomposites were
obtained using palladium–based [26, 27] or titanium-based Ziegler-Natta catalysts
[28-30]. Next to the thermoplastic polymers aforementioned cited, in situ
polymerisation has been widely used also thermoset and elastomer/clay
nanocomposites systems. Messersmith and Giannelis [31] first reported studies of
different curing agents and curing conditions for the formation of nanocomposites
based on di-glycidyl ether of bisphenol A (DGEBA) in presence modified-
montmorillonite. A DGEBA derivative (Epon 828), cured with a polyether diamine
(Jeffamine D2000) instead formed the rubber-epoxy matrix of nanocomposite as
reported by Lan and Pinnavia [32]. The montmorillonite used were modified with n-
octylamine and n-octadecylamine and, depending on the alkyl chain length, an
intercalated (n-octyl) or exfoliated (n-octadecyl) nanocomposites were obtained.
Finally the synthesis of intercalated nanocomposites based on elastomeric
polyurethane is mentioned [33]. An organo-modified montmorillonite is swollen in a
polyol such as ethylene glycol, polyethylene glycol or glycerol propoxylate and then
cross-linked with methylene diphenyl diisocyanate.
3.2.3 Melt Processing
If the previous two methods were firstly adopted to obtain nanocomposites, melt
processing is certainly the method most interesting from an application and
economical point of view. In fact solution processing involves abundant use of
solvents, expensive and “environmentally unfriendly”, while in situ polymerisation is
often difficult to control. Melt processing involves annealing a mixture of polymer
and nanoclays, statically or under shear, above the softening temperature of the
polymer. The process is schematised in Fig. 3.7. A multitude of micro/nano-
50
Page 51
CHAPTER 3 – Polymer / Clay Nanocomposites
composites produced by melt processing can be found in literature and most of the
main polymers have been used as dispersant phase for layered silicates. PS was first
studied [6, 30] with different types of clays and different organo-modifications, but
also PA6 [34], PP [35], EPDM [36], just to cite a few.
Figure 3.7. Schematic representation of melt-intercalation processing. From [37].
The morphologies found were claimed to be intercalated and, much less often, as
exfoliated. But, if polymer intercalation from solution processing has been justified
by a translational entropic gain of the solvent molecules balancing the polymer chain
entropic loss due to inter-layers confinement, how can we explain the same
phenomenon during melt processing? In fact, cations exchanged surfactants
molecules are tethered to the layered silicates inter-layer surfaces; hence they can not
gain any translational entropy. Moreover the silicate layers are relatively large (~ 1
µm) and unaltered during intercalation so their small translational entropy can not
contribute substantially to the hybrids formation. A first theoretical model that
explained the polymer melt intercalation in organically-modified layered silicates
was developed by Vaia and Giannelis [37, 38]. The simple mean-field lattice-based
model contemplated all the possible equilibrium states already observed
experimentally, namely immiscible, intercalated and exfoliated polymer-nanoclays.
Let’s consider an initial state in which a pair of silicate layers, distant h0 from each
other, with the inter-layer gallery completely filled by end-tethered surfactant chains,
is immersed in a polymer melt. Polymer chains will intercalate the organo-modified
clays, and then increase the inter-layer spacing up to h, if the process is
thermodynamically favourable in terms of Helmholts free energy:
51
Page 52
CHAPTER 3 – Polymer / Clay Nanocomposites
STEhFhFF ∆−∆=−=∆ )()( 0 Equation 3.1
Composed by an internal energy contribution E∆ , associated with the establishment
of new intermolecular interactions, and an entropy contribution , associated with
the configurational changes of the various constituents. The entropic change
S∆
S∆ of
the system arises from the contributions of the confined polymer chains in the inter-
layer and the tethered chains. In fact, although the tethered chains do not gain
translational freedom, they do gain configurational freedom as the gallery height
increases.
Figure 3.8. , and as a function of the gallery height polymer
VSh∆ chainVSh∆ VSh∆ 0hh − ,
for a polymer and a layered silicate modified with octadecylammonium. Reproduced
from [37].
The overall entropy change per area of the system represented in the Fig. 3.8 might
be qualitatively divided into two regions. For a gallery height less than a critical
value hc the total entropy change is near zero. Here the penalty for polymer
confinement is compensated by the entropy gain coming from the layers separation.
For h>hc, instead, the overall entropy change is negative and the nanocomposite
52
Page 53
CHAPTER 3 – Polymer / Clay Nanocomposites
formation is entropically unfavourable. Since the total entropy change is anyway
small, favourable interactions ( E∆ ), especially between polymer chain and silicate
layers, are expected to provide the driving force for polymer intercalation. The
interplay of entropic and energetic contributions can be interpreted by free energy
curves as in figure below.
Figure 3.9. Variation of free energy per unit area, as a function of the gallery
height , for a polymer and a layered silicate modified with octadecylammonium
group. Curves are calculated for different values of interaction energies ε
Vfh∆
0hh −
sp,sa
between polymer and silicates, supposing the interaction between polymer and
tethered chains, εsa=0. Curves I, IIa, IIb, III correspond to εsp,sa values of 0, -4, -8, -
12 mJ/m2. Reproduced from [37].
The free energy curves, shown in Fig. 3.9, can be grouped into three types. Type I is
positive for all gallery heights and hence polymer intercalation is unfavourable.
Curves of type II a-b present one or more minimum so intercalation is favourable to
certain discrete gallery heights. For type III the curve continually decreases with
gallery height, possibly leading to silicates exfoliation. However for h>h∞ (h∞ is the
53
Page 54
CHAPTER 3 – Polymer / Clay Nanocomposites
fully extended length of the tethered chain) the entropic contribution of the tethered
chains is minimal and the penalty of polymer confinement dominates (Fig. 3.8). In
this case exfoliation requires strong favourable energetic interactions. We can
conclude that the mean-field lattice model developed by Vaia and Giannelis
describes, in first approximation, the polymer melt intercalation process in
nanocomposites. Up to a certain gallery height, the entropic penalty to confine
polymer chains can be compensated by conformational freedom of the tethered chain
gained as the layers separate. Complete layer separation (exfoliation) depends,
though, on the establishment of very favourable polymer-clay interactions to
overcome the entropy loss.
Successively, also Balazs et al. [39, 40] studied the interactions between two
surfactant-coated surfaces (layered silicate) and a surrounding polymer melt. Based
on both numerical and analytical self-consistent field (SCF) theories they tried to
draw conclusions on the equilibrium behaviour of the overall mixture. Besides
qualitatively confirming the results of Vaia and Giannelis, Balazs et al. focused on
some aspects important to design polymer-clay nanocomposites. For instance, they
revealed that significantly increasing the length of the surfactants, beyond the typical
value C12- C20, up to polymeric-like values can enhance the thermodynamic stability
of exfoliated hybrids. Moreover, studying the effect of polymer architecture on the
miscibility of polymer/clay mixtures, they found that increasing the extent of
branching at fixed molecular weight yields more miscible structures [41].
After the above brief theoretical background of the polymer melt intercalation, in the
next session we will describe some relevant examples of nanocomposites obtained by
melt processing, based on polypropylene (PP) and polyamide 6 (PA6).
PA6-Clay Nanocomposites
The preparation of nanocomposites based on PA6 has been widely investigated but
mainly limited to the in situ polymerisation method. Liu et al. [34] first melt blended
commercial PA6 with octadecylammonium-exchanged montmorillonite nanoclays in
a twin-screw extruder. WAXS analysis showed an intercalated structure for nanoclay
54
Page 55
CHAPTER 3 – Polymer / Clay Nanocomposites
loadings above 10 wt.% while exfoliation for less than 10 wt.%. DSC tests, along
with WAXS, also stressed a strong influence of exfoliation on the crystallisation of
PA6, with heterophase nucleation effects and the appearance of γ-phase crystals in
addition to the original exclusive α-phase. Fornes et al. [42] have successively
carried out a series of investigations on the melt processing of PA6-nanocomposites.
Comparing three different PA6-matrix molecular weights (Mn=16400, 22000 and
29300 g/mol, respectively referred as LMW, MMW and HMW) they observed a
better exfoliated structure for the HMW PA6 leading to superior mechanical
properties due to the higher shear stress. Low frequency viscosity tests revealed
solid-like, non-Newtonian behaviour for HMW nanocomposites, while Newtonian
plateau for MMW and LMW. Surprisingly, though, capillary data showed lower
viscosity for HMW and MMW composites compared with pure matrix values. The
former phenomenon has been generically addressed by the authors as possibly
caused by “higher clay platelet alignment, smaller particle size and/or PA6 molecular
weight degradation”.
More recently Fornes et al. [43] compared the reinforcement effect of two different
commercial sources of clays: Kunipia-F® from Yamagata, Japan and Cloisite® Na+
from Wyoming, USA, both organo-modified with bis-(hydroxyethyl) methyl
rapeseed ammonium chloride. The first resulted in better exfoliation and better
mechanical properties, due to higher aspect ratio of single platelets, higher CEC and
higher initial basal spacing. The same authors [44] selected a series of organic amine
salts as cation exchangeable surfactants for MMT, and compared their effect on the
final properties of melt compounded PA6-nanocomposites. Three surfactant features
were identified that led to greater extent of exfoliation, higher stiffness and strength:
(1) One long alkyl tail on the ammonium ion rather than two, (2) methyl groups on
the amine rather than 2-hydroxy-ethyl-groups, (3) an equivalent rather than excess
amount surfactant on the clays.
A novel melt-compounding process was reported by Hasegawa et al. [45]. A Na+-
MMT water slurry was blended with PA6 melt in an extruder, followed by removing
of the water from a vent by vacuum (Fig. 3.10). Although WAXS and TEM revealed
55
Page 56
CHAPTER 3 – Polymer / Clay Nanocomposites
exfoliation of the nanoclays in the PA6 matrix, the overall properties weren’t much
different from melt compounding starting from dry clays.
Figure 3.10. Representation of the “slurry” melt-compounding process. From [45].
For polymers that require high melt processing temperature, as PA6, the thermal
stability of the surfactants, usually alkyl ammonium compounds, becomes an
important issue. According to thermo-gravimetric analysis (TGA) these organic
compounds start to breakdown at temperature as low as 180°C in inert atmosphere,
and significant degradation occurs above this temperature [46, 47]. Such degradation
may affect the thermodynamics of polymer intercalation, altering the level of
exfoliation and interfacial bonding, and possibly producing side-reaction with the
polymer matrix. VanderHart et al. [48, 49] estimated, according to solid-state NMR,
that most of the quaternary ammonium on the surface of the clay is decomposed,
during PA6 melt compounding at 240 °C, as a consequence of the combination of
high temperature and mechanical shear. Surprisingly, though, extensive degradation
of the surfactant did not result in poor mixing; in fact the nanocomposites with the
best dispersion of clays also had the most extensively degraded surfactant. However
the instability of the organo-clay can adversely affect the polymer matrix itself.
Fornes et al. [50] demonstrated the degradation of PA6 matrix from a decrease in
molecular weight. The degradation was higher for a higher initial molecular weight
polymer. A significant reduction in number average molecular mass was also notices
56
Page 57
CHAPTER 3 – Polymer / Clay Nanocomposites
by Davis et al. [51], when in situ polymerized PA6-MMT pellets were dried and
injection moulded at 300°C. The suggested degradation pathway was hydrolytic
peptide scission and/or catalytic degradation due to the presence of MMT.
These observations point to the need of more stable surfactants. In this direction goes
the research of Gilman et al. [52] that prepared PA6 nanocomposites based of MMT
modified with trialkylimidazolium cations to obtain high stability at high processing
temperatures.
PP-Clay Nanocomposites
Polypropylene has also been investigated for the preparation of nanocomposites,
especially because of the importance and wide spread use of this commodity
polymer. Differently than for PA6, the lack of polar groups in PP macromolecules
doesn’t allow direct melt intercalation into the silicates galleries; this accounts for the
difficulties in obtaining well exfoliated, PP-based nanocomposites. The general
approach has been to modify the clays surface and/or functionalise the polymeric
matrix.
Figure 3.11. Intercalation of maleic anhydride molecules into the clays galleries.
From [53].
The ability of maleic anhydride to intercalate into the clays galleries (Fig. 3.11) was
demonstrated by Tjong et al. [53]. Vermiculite clays were initially pre-treated with
hydrochloric acid solution followed by addition of maleic anhydride in presence of
acetic acid, to form organo-clays. The absence of WAXS diffraction peaks suggested
the exfoliation of the clays. Beside an effective intercalation agent for clays, maleic
57
Page 58
CHAPTER 3 – Polymer / Clay Nanocomposites
anhydride (MA) is in general a modifying additive for the polyolefins. The melt
interaction of PP oligomers modified with either maleic anhydride (PP-MA) or
hydroxyl group (PP-OH) in octadecylammonium-exchanced MMT was first studied
by Usuki and Kato [35]. An increase in the inter-layer spacing was shown from
WAXS tests as PP-MA or PP-OH were melt compounded with organo-modified
clays. Using a higher ratio of PP-MA/clay also resulted in a better intercalation. The
authors also studied the effect of functionalisation. PP-MA with a lower maleic
anhydride content produced a reduced intercalation, demonstrating that a minimum
level of functionalisation for PP chains is necessary to intercalate silicate layers (Fig.
3.12).
Figure 3.12. Intercalation and successive exfoliation process of clays by melt-
compounding with PP-MA. From [5].
The property of PP-MA to intercalate organo-clays was successively used, by the
same research group, to obtain compatibilised three-component PP/PP-MA/MMT
nanocomposites [54, 55]. The preparation method consisted of a first step in which
the functionalised polymer (PP-MA) was intercalated into stearylammonium-
exchanged clays, followed by melt compounding with virgin PP in a twin-screw
extruder. The morphology of the nanocomposites was characterised by an
intercalated structure, when relatively high concentrations of PP-MA (~20 wt.%)
58
Page 59
CHAPTER 3 – Polymer / Clay Nanocomposites
were used and when the compatibiliser (PP-MA) was sufficiently functionalized
(high polarity). However we have to underline that a higher functionalisation of the
compatibiliser PP-MA is not always the best solution. An excessive number of
carboxylic groups, spread on the PP oligomeric chain, can be deleterious in
decreasing the compatibility with PP matrix and inducing phase separation.
Therefore we can state that obtaining a good dispersion of organo-clays into PP
matrix compatibilised by functionalised oligomers is a compromise between high
polarity of the compatibiliser (meaning higher intercalative capacity) and
compatibility with the polymeric matrix. Manias et al. [56, 57] investigated several
other functionalisations using either random copolymers of PP (with 0.5 mol% of
functionalised comonomer) or di-block copolymers (with 1 mol% of non-PP blocks).
Different functional groups were found to promote the formation of nanocomposites
with organo-modified MMT as the common maleic anhydride but also styrene, p-
methylstyrene, hydroxyl-containing styrene and methylmethacrylate. Moreover the
same authors reported that the modification of octadecylammonium-exchanged
MMT with a semi-fluorinated alkyltrichlorosilane was directly miscible with neat
PP. Interestingly Liu and Wu [58] reported the preparation of PP-MMT
nanocomposites by a grafting/melt intercalation method. The original approach
consisted in using two intercalating agents: hexadecylammonium cations and
epoxypropylmethacrylate, an unsaturated monomer that can be tethered to the PP via
a grafting reaction. When the co-intercalated clays were blended with PP in a twin-
screw extruder an improvement in dispersion was observed because of the larger
initial inter-layer distance and stronger interactions caused by the grafting reaction.
3.2.4 Template Synthesis
A final method reported for the preparation of polymer-clay nanocomposites is the
template synthesis. The general idea is similar to the in situ polymerisation method,
with the difference that this time clays are synthesised in presence of a polymer
solution. Corrado and Xu [59] succeeded to synthesise hectorite clays in presence of
water-soluble polymers as PVP, hydroxylpropylmethylcellulose (HPMC),
59
Page 60
CHAPTER 3 – Polymer / Clay Nanocomposites
Poly(acrylonitrile) (PAN), Poly(dimethyldiallylammonium) (PDDA), and
Polyaniline (PANI). The synthesis consists in the hydrothermal crystallisation of
silica sol, magnesium hydroxide sol, lithium fluoride and polymer in water and
reflux for 48hrs. Limitations of this method are in the incorporation of large amounts
of polymer (with an upper limit of 86 wt.% for PAN-hectorite system) and the length
of synthetic clays that, at best, is about one-third of the natural counterpart.
3.3 Properties of Polymer-Clay Nanocomposites
3.3.1 Crystallisation
The crystallinity of polymers can be dramatically modified by the presence of
layered silicates and if this is the case one has to be cautious when assessing the
correlation between microstructure and properties of polymer-clay nanocomposites.
The dispersed clay particles often act as heterogeneous nucleating agents for the
polymers, significantly reducing the spherulites size and increasing the overall
crystallinity. This effect is usually more pronounced for very low loading levels.
Above certain loadings, nanoclays may hinder the polymer mobility and then
obstacle the chains folding and the growth of well developed lamellar crystals [60].
According to the literature, enhanced crystallisation was observed for different
polymers such as PP [61, 62], PA6 [63, 64], PE [65], PET [66], etc. In some cases, a
reduction in PEO crystallisation has been reported in presence of Na+-MMT [67],
explained by the strong interactions between PEO chains and the surface of Na+,
promoting non-crystalline PEO coordination.
The effect of different particulate fillers to act as nucleating agents for polypropylene
has long been studied because of the importance of this polymer and the wide-spread
use of filled-PP for different applications. The very strong nucleating effect of talc,
for example, has been widely demonstrated [68, 69]. The influence of other fillers is
often not so clear. CaCO3, for instance, has been frequently classified as an inactive
filler. However, significant increase of nucleating effect of CaCO3 was noticed with
60
Page 61
CHAPTER 3 – Polymer / Clay Nanocomposites
decreasing particle size and, as a consequence, increasing particle aggregation [70].
More recently, the nucleation effect of MMT in melt blended PP nanocomposites
was also studied [71-73]. Fig. 3.13 shows the reduction of spherulites size in PP after
addition of 4 wt.% of organo-modified MMT.
Figure 3.13. Polarised light micrographs of (a) neat PP (b) PP+4%clay
nanocomposites crystallised at 150°C after Yuan and Misra [74].
The heterogeneous nucleation is also explicated by a significant increase in the
crystallisation temperature, as shown in the Fig. 3.14.
Figure 3.14. DSC traces of neat PP and PP+4%clay nanocomposites. Reproduced
by Yuan & Misra [74].
61
Page 62
CHAPTER 3 – Polymer / Clay Nanocomposites
Pozsgay et al [71] demonstrated that the ability of MMT to nucleate isotactic-PP
(iPP) depends on the organo-treatment of clay and they attributed this effect to the
alteration of interlayer MMT distance rather than to the modification of the clay
surface tension. They concluded that the nucleation occurs not on the surfaces but
rather in the interlayers of clay particles and that the nucleating effect is due to the
collapsed MMT galleries of 1nm distance. In confirmation to that hypothesis
Svoboda et al. [72] found an increase in crystallisation temperatures in PP-
MA/MMT systems containing clay tactoids but not in systems with well dispersed
MMT clays. Apart from changing the overall crystallinity and crystallisation rate, the
presence of nano-fillers can also modify the crystal structure of semi-crystalline
polymers, stabilising a metastable phase and inducing polymorphism. A typical
example is the stabilisation of γ-phase in PA6 with the addition of clays, as was
shown in early studies [34, 75]. This is important since the crystalline structure can
affect physical and mechanical properties.
Figure 3.15. Hydrogen bonding in the α and γ crystalline forms of nylon 6 as seen
from end and side-view of each crystal. Closed and open circles represent chain axes
projecting out of and into the page, respectively. From [77].
62
Page 63
CHAPTER 3 – Polymer / Clay Nanocomposites
Some properties of PA6 based nanocomposites [34, 42, 76] may be related to such
crystalline modification rather than the effect of the nano-clay itself. Depending on
the way macromolecules are packed, PA6 can crystallise into two different crystal
forms: α-form or γ-form. In order to maximise the H-bonds in the crystal state,
polyamide chains can adopt either a full-extended or a twisted configuration. As
shown in Fig. 3.15, in the fully extended configuration (α-form), polymer chains are
oriented anti-parallel to each other, in a way that the amide linkage and methylene
units lie in the same plane and the H-bonds occur between adjacent anti-parallel
chains. This structure creates monoclinic crystals. The γ-form, instead, occurs when
H-bonds form between parallel chains and the amide linkage is twisted 60° out of
plane. This structure is described as pseudo-hexagonal. The crystal form that PA6
can assume when crystallised depends on different factors such as thermal
conditions, applied stress, moisture and additives content. For instance, it is known
[78, 79] that crystallisation at temperatures below ~130 °C favours the formation of
only γ-form, while above ~190 °C of only α-form. Both crystal forms are found for
intermediate temperatures. Fast cooling or quenching from the melt produces γ-form
[80], while successive annealing at temperatures above ~190 °C leads to the
conversion of γ-form into α-form [81]. In general we can say that fast cooling and
lower crystallisation temperatures promote the formation of γ-form, and slow cooling
and higher crystallisation temperatures leads to α-form. It seems that conditions that
limit the polymer chain mobility favour the crystallisation of PA6 in the γ-form.
Figure 3.16. TEM pictures showing the crystalline morphology of a) PA6 and b)
nanocomposites with 2.5 wt.% of clays. Reproduced by Shen et al. [82].
63
Page 64
CHAPTER 3 – Polymer / Clay Nanocomposites
As mentioned before, the presence of additives like nanoclays can modify the crystal
structure of PA6, decreasing significantly the crystal size (Fig. 3.16) and promoting
the formation of γ-crystals (Fig. 3.17).
a) b)
Figure 3.17. WAXS spectra of PA6 nanocomposites compared with pure PA6 (a) at
the surface and (b) in the bulk of injection moulded bars. PA2 and PA3 refer to two
different organo-modified MMTs with the second highly swollen. Reproduced by
Varlot et al. [83].
A difference in structure appears between the skin and the core region of injection-
moulded specimens. All samples contain reflections at 2θ ≈ 20 ° and 23.7 °,
corresponding to the α-crystals, and at 2θ ≈ 21.3 °, corresponding to the γ-crystals,
however the skin region is much richer in γ-phase (Fig. 3.17.a) compared to the core
region (Fig. 3.17.b). That might be explained by the high shear stresses and fast
cooling imposed by the injection moulding process especially at the mould surface.
64
Page 65
CHAPTER 3 – Polymer / Clay Nanocomposites
3.3.2 Mechanical Properties
Young’s Modulus
The addition of layered clays in a polymeric matrix has often shown remarkable
increases in Young’s Modulus. Interestingly, that increase is obtained at very low
filler content (<5 wt.%) if the clays are well exfoliated. PA6 nanocomposites
synthesised by in situ polymerisation of ε-caprolactam, show a different level of
exfoliation depending on the nature of the acid used to catalyse the reaction [84].
That is demonstrated by WAXS measurements, with an intensity peak Im that is
inversely related to the extent of exfoliation. For a decrease in Im, an increase in
Young’s modulus was observed, stressing the importance of exfoliation for the
stiffness (Table 3.1).
Table 3.1. WAXS peak intensity and Young’s modulus for nanocomposites obtained
by in situ polymerisation, catalysed with different acids. From [84].
Acid Im Young’s modulus [GPa]
Phosphoric acid 0 2.25
Hydrochloric acid 200 2.05
Isophtalic acid 255 1.74
Benzenesulfonic acid 280 1.74
Acetic acid 555 1.63
Trichloroacetic acid 585 1.67
Supposing that a good exfoliation is obtained, the size of the dispersing particle is,
obviously, of great importance. Fig. 3.18 shows the tensile modulus, measured at 120
°C, of in situ polymerised PA6 nanocomposites based on two different layered clays.
MMT (NCH in Fig. 3.18) gives a better reinforcement compared with Saponite
(NCHP in Fig. 3.18) since it is characterised by a higher aspect ratio [75].
65
Page 66
CHAPTER 3 – Polymer / Clay Nanocomposites
Figure 3.18. Tensile modulus, measured at 120°C, of nanocomposites based on
MMT (● NCH) and Saponite (■ NCHP) clays at different loadings. From [75].
Nanocomposites produced by in situ polymerisation are sometimes difficult to
compare since the polymerisation reaction can result in matrix characterised by a
different average molecular weight and molecular weight distribution. Instead data
relative to melt compounded nanocomposites are easier to interpret. Fig. 3.19 shows
a significant and constant increase in Young’s modulus with nanoclays content up to
10 wt.%, after which the morphology is characterised by an intercalated structure
rather than perfectly exfoliated as for lower filler content.
Figure 3.19. Effect of clay content on tensile modulus of PA6-organomodified MMT
nanocomposites obtained by melt compounding. From [34].
66
Page 67
CHAPTER 3 – Polymer / Clay Nanocomposites
A similar behaviour can be observed for PP based nanocomposites obtained by melt
compounding. In this case a better intercalation/exfoliation is enhanced by the
addition of a higher amount of PP-MA in the three components mixture PP/PP-
MA/MMT [55]. Table 3.2 shows that, as the amount of PP-MA increases also the
modulus increases. It is important to notice that there is a negligible effect of
different amounts of PP-MA on the modulus of the blend PP/PP-MA, so any
difference in the reference matrix can be excluded.
Table 3.2. Effect of PP-MA on the Young’s modulus of PP-based nanocomposites.
From [55].
Sample Filler wt. [%] PP-MA wt. [%] Young’s modulus [MPa]
PP 0 0 780
PP/PP-MA 7 0 7.2 714
PP/PP-MA 22 0 21.6 760
PPCC 6.9 0 830
PPCH 1/1 7.2 7.2 838
PPCH 1/2 7.2 14.4 964
PPCH 1/3 7.2 21.6 1010
Yield Stress and Tensile Strength
An increase in stiffness is not a sufficient proof for efficient reinforcement if not
accompanied by a simultaneous increase in yield stress or ultimate tensile stress,
since the modulus always increases when an inorganic filler is added to a polymer.
We can assume, in first approximation, that reinforcement and composite properties
are determined by factors such as matrix and filler properties, contact surface
(influenced by aspect ratio and extent of exfoliation) and strength of interaction. The
former factor is particularly important for properties of the composite like yield
stress and or ultimate tensile stress.
67
Page 68
CHAPTER 3 – Polymer / Clay Nanocomposites
Figure 3.20. Schematic formation of hydrogen bonds in PA6/MMT nanocomposites
[5].
Without an effective interaction between matrix and reinforcing phase, with the
formation of an extended interphase region, the filler mainly acts as an inclusion,
decreasing the effective load-bearing cross-section of the matrix and, actually,
reducing the matrix strength.
Figure 3.21. Yield stress of PA6 nanocomposites for different MMT loadings. Three
molecular weights PA6 matrices are melt compounded with organo-modified MMT
clays. From [42].
PA6 has been found to be a good candidate for polymer/clay nanocomposites also
because it’s believed to form strong interactions with silicate layers via formation of
hydrogen bonds as shown in Fig. 3.20. Fig. 3.21 shows the dependence of yield
stress on MMT content and on matrix molecular weight for PA6 nanocomposites
68
Page 69
CHAPTER 3 – Polymer / Clay Nanocomposites
obtained by melt compounding [42]. Yield stress increases with MMT content for all
formulations but more pronouncedly for high molecular weight (HMW) PA6; the
increase effect is nearly double at the highest clays content. This can be explained by
a better exfoliation for nanocomposites based on (HMW) PA6.
The results relative to the strength of PP-based nanocomposites are not always that
encouraging, mainly due to poor interfacial interactions between PP and inorganic
fillers. Referring again to the work of Hasegawa et al. [55] we can actually see a
decrease in the yield stress of the nanocomposites, compared with neat PP, for all
formulations except for PPCH 1/2 (weight ratio of nanoclays and PP-MA of 1:2)
(Table 3.3).
Table 3.3. Effect of PP-MA on the yield stress of PP-based nanocomposites [55].
Sample Filler wt. [%] PP-MA wt. [%] Yield Stress [MPa]
PP 0 0 32.5
PP/PP-MA 7 0 7.2 31.4
PP/PP-MA 22 0 21.6 32.6
PPCC 6.9 0 31.9
PPCH 1/1 7.2 7.2 29.5
PPCH 1/2 7.2 14.4 34.6
PPCH 1/3 7.2 21.6 31.7
The co-intercalated PP/MMT nanocomposites studied by Liu and Wu [58] (refer to
Section 3.2.3.2) show a better reinforcement effect. The tensile strength considerably
increases with the MMT content up to a value of 5 wt.%, after which the trend
becomes less pronounced (Fig. 3.22). The strong interfacial interactions shown by
these nanocomposites are probably due to the grafting reaction between the PP
chains and the co-intercalated unsaturated monomer epoxypropylmethacrylate.
69
Page 70
CHAPTER 3 – Polymer / Clay Nanocomposites
Figure 3.22. Effect of clay content on tensile strength of co-intercalated PP/MMT
nanocomposites. From [58].
Strain at Break
The effect of nanofillers on the property of the strain at break has also been studied.
The usual effect for thermoplastic matrices, such as PMMA [85], PS [86], PA6 and
PP is a considerable reduction in the strain at break. Table 3.4 shows the strain at
break for different PP/MMT nanocomposites.
Table 3.4. Effect of PP-MA on the strain at break of PP-based nanocomposites.
From [55].
Sample Filler wt. [%] PP-MA wt. [%] Strain at break [%]
PP 0 0 >150
PP/PP-MA 7 0 7.2 >150
PP/PP-MA 22 0 21.6 40.3
PPCC 6.9 0 105
PPCH 1/1 7.2 7.2 7.5
PPCH 1/2 7.2 14.4 8.6
PPCH 1/3 7.2 21.6 5.6
70
Page 71
CHAPTER 3 – Polymer / Clay Nanocomposites
71
There is a dramatic decrease from values higher than 150 %, for neat PP, down to 5-
8 % for PP/PP-MA/MMT nanocomposites. However, it has to be stressed that the
presence of PP-MA could have an important effect and needs to be better
understood. In fact, if we consider the polymer blend PP/PP-MA, with 22 wt.% of
PP-MA (third entry of Table 3.4), the strain at break is already reduced to 40.3 %.
Fornes et al. [42] reported the properties at failure of PA6/MMT nanocomposites, for
three different molecular weight PA6 and two crosshead speeds. As shown in Fig.
3.23, the strain at break is reduced with MMT content, in particular for the lower
molecular weight matrix (LMW) that, we remember, was characterised by a coarser
dispersion of MMT. The high molecular weight matrix (HMW) seams to preserve
ductility to a certain extent.
a)
b)
Figure 3.23. Elongation at break of three MW PA6 nanocomposites for different
MMT loadings, tested at crosshead speed of (a) 0.51 cm/min and (b) 5.1 cm/min.
From [42].
3.3.3 Barrier Properties
The high aspect ratio of layered silicates has been found to significantly reduce the
gas permeability in exfoliated nanocomposites films, by the creation of a “tortuous
path” (Fig. 3.24) that reduce the diffusiveness of gas molecules.
Page 72
CHAPTER 3 – Polymer / Clay Nanocomposites
Figure 3.24. Formation of a “tortuous path” in polymer-clay nanocomposites.
We can understand that the plate-like shape of the nano-clays is particularly efficient
in maximising the path length that a diffusing molecule must travel, because of the
high aspect ratio compared with others fillers shapes (i.e. sphere or cube). According
to the argument developed by Nielsen [87] the tortuousity factor τ is defined as the
ratio of the actual distance d’, that a diffusient must travel, to the shortest distance d,
that it would travel in absence of obstacles. τ can be expressed in terms of the length
L, width W, and volume fraction φ of the sheet-like particle as follows:
ϕτWL
dd
21'+== Equation 3.2
The effect of tortuosity on the permeability is expressed as:
τϕ−
=1
P
S
PP
Equation 3.3
where PS and PP represent, respectively, the permeability of the nanocomposite and
the pure polymer. Supposing that the layered clays are arranged perpendicular to the
direction of diffusion, a key role is played by the aspect ratio, as showed in the Fig.
3.25.
72
Page 73
CHAPTER 3 – Polymer / Clay Nanocomposites
Figure 3.25. Relative permeability plotted as a function of aggregate width, for
different sheet lengths. Effect of exfoliation. From [88].
This simple model has been usefully employed by different authors to interpret
experimental data. Lan et al. [89] measured the permeability to carbon dioxide of
partially-exfoliated polyimide-based nanocomposites. The curve fitting was obtained
for aspect ratio of 192 (Fig. 3.26), lower than the value of 1000 expected for well
exfoliated MMT. Interestingly, Yano et al. [90] found a ten-fold decrease in water
vapour permeability for polyimide with the addition of only 2wt.% of nanoclays.
73
Page 74
CHAPTER 3 – Polymer / Clay Nanocomposites
Figure 3.26. Relative permeability for different loading of MMT clays. The best
fitting is for aspect ratio 192, much lower than 2000 expected for completely
exfoliated MMT platelets. From [89].
3.3.4 Fire Retardancy
The addition of few weight percentages of nanoclays has showed to be beneficial for
the fire retardancy of different polymer matrices.
Figure 3.27. Heat release rate of PA6 and PA6/silicate nanocomposites (5 wt.%).
Reproduced from [91].
74
Page 75
CHAPTER 3 – Polymer / Clay Nanocomposites
Cone calorimeter is the main bench-scale method to evaluate important parameters in
the fire retardant behaviour of a material such as the heat release rate (HRR), the
peak of HRR, smoke production and CO2 yield. In a typical cone calorimeter
experiment, a sample is exposed to a given heat flux and the heat release rate and the
mass loss rate are recorded as function of time. Gilman et al. first reported detailed
investigations on the flame retardant properties of PA6/layered clays, followed by
studies on nanocomposites based on other polymer matrices [91-93].
a) b)
c)
Figure 3.28. Residues of combustion of: (a) EVA with 5 phr organoclays; (b) EVA
with 5 phr MWCNTs; (c) EVA with 2.5 phr pure MWCNTs and 2.5 phr organoclays.
From [94].
As typical example, Fig. 3.27 shows the HRR plot of PA6 and PA6 nanocomposites
(5 wt.% of MMT), with a reduction of 63 % in HRR peak. The suggested mechanism
of flame retardancy in nanocomposites arises from the formation of a char layer,
obtained through the collapse of intercalated/exfoliated structures, that act as a
barrier both to mass and energy transport. As the fraction of clays increases, the
75
Page 76
CHAPTER 3 – Polymer / Clay Nanocomposites
amount of char increases and the rate at which heat is released decreases. The
morphology of nanocomposites again plays an important role. Good nanoclay
dispersion is certainly precondition for fire retardancy but has been reported that an
intercalated structure can be more effective than a completely exfoliated structure.
Usually also the simple observation of the residues of combustions of a material
gives useful information. From Fig. 4.28 we can see three different compounds of
EVA filled with clays (Fig.4.28.a), MWNTs (Fig.4.28.b) or both the fillers
(Fig.4.28.c), after a cone calorimeter test [94]. The use of both clays and MWNTs
seems to work in synergism leaving a very thick and homogeneous char without
presence of cracks, preventing then by the emission of volatiles.
3.4 References
1. Blumstei.A, S.L. Malhotra, and Watterso.Ac, Polymerization of Monolayers .5.
Tacticity of Insertion Poly(Methyl-Methacrylate). Journal of Polymer Science
Part a-2-Polymer Physics, 1970. 8(9): p. 1599-&.
2. Blumstei.A, K.K. Parikh, S.L. Malhotra, and Blumstei.R, Polymerization of
Monolayers .6. Influence of Nature of Exchangeable Ion on Tacticity of
Insertion Poly(Methyl Methacrylate). Journal of Polymer Science Part a-2-
Polymer Physics, 1971. 9(9): p. 1681-&.
3. B.K.G. Theng, Formation and properties of clay–polymer complexes. 1979,
Amsterdam: Elsevier.
4. M. Alexandre and P. Dubois, Polymer-layered silicate nanocomposites:
preparation, properties and uses of a new class of materials. Materials Science
& Engineering R-Reports, 2000. 28(1-2): p. 1-63.
5. S.S. Ray and M. Okamoto, Polymer/layered silicate nanocomposites: a review
from preparation to processing. Progress in Polymer Science, 2003. 28(11): p.
1539-1641.
6. S.C. Tjong, Structural and mechanical properties of polymer nanocomposites.
Materials Science & Engineering R-Reports, 2006. 53(3-4): p. 73-197.
76
Page 77
CHAPTER 3 – Polymer / Clay Nanocomposites
7. A. Okada, M. Kawasumi, A. Usuki, Y. Kojima, T. Kurauchi, and O.
Kamigaito. Synthesis and properties of nylon-6/clay hybrids. in MRS
Symposium Proceedings. 1990. Pittsburgh.
8. A. Usuki, M. Kawasumi, Y. Kojima, A. Okada, T. Kurauchi, and O.
Kamigaito, Swelling Behavior of Montmorillonite Cation Exchanged for
Omega-Amino Acids by Epsilon-Caprolactam. Journal of Materials Research,
1993. 8(5): p. 1174-1178.
9. R.A. Vaia, H. Ishii, and E.P. Giannelis, Synthesis and Properties of 2-
Dimensional Nanostructures by Direct Intercalation of Polymer Melts in
Layered Silicates. Chemistry of Materials, 1993. 5(12): p. 1694-1696.
10. H. Fischer, Polymer nanocomposites: from fundamental research to specific
applications. Materials Science & Engineering C-Biomimetic and
Supramolecular Systems, 2003. 23(6-8): p. 763-772.
11. R.A. Vaia, R.K. Teukolsky, and E.P. Giannelis, Interlayer Structure and
Molecular Environment of Alkylammonium Layered Silicates. Chemistry of
Materials, 1994. 6(7): p. 1017-1022.
12. D.J. Greenland, Adsorption of poly(vinyl alcohols) by montmorillonite. Journal
of Colloid Science, 1963. 18: p. 647–64.
13. P. Aranda and E. Ruizhitzky, Poly(Ethylene Oxide)-Silicate Intercalation
Materials. Chemistry of Materials, 1992. 4(6): p. 1395-1403.
14. R. Levy and C.W. Francis, Interlayer Adsorption of Polyvinylpyrrolidone on
Montmorillonite. Journal of Colloid and Interface Science, 1975. 50(3): p. 442-
450.
15. J. Billingham, C. Breen, and J. Yarwood, Adsorption of polyamine, polyacrylic
acid and polyethylene glycol on montmorillonite: An in situ study using ATR-
FTIR. Vibrational Spectroscopy, 1997. 14(1): p. 19-34.
16. H.G. Jeon, H.T. Jung, S.W. Lee, and S.D. Hudson, Morphology of
polymer/silicate nanocomposites - High density polyethylene and a nitrile
copolymer. Polymer Bulletin, 1998. 41(1): p. 107-113.
77
Page 78
CHAPTER 3 – Polymer / Clay Nanocomposites
17. N. Ogata, G. Jimenez, H. Kawai, and T. Ogihara, Structure and
thermal/mechanical properties of poly(l-lactide)-clay blend. Journal of Polymer
Science Part B-Polymer Physics, 1997. 35(2): p. 389-396.
18. G. Jimenez, N. Ogata, H. Kawai, and T. Ogihara, Structure and
thermal/mechanical properties of poly(epsilon-caprolactone)-clay blend.
Journal of Applied Polymer Science, 1997. 64(11): p. 2211-2220.
19. A. Usuki, Y. Kojima, M. Kawasumi, A. Okada, Y. Fukushima, T. Kurauchi,
and O. Kamigaito, Synthesis of Nylon 6-Clay Hybrid. Journal of Materials
Research, 1993. 8(5): p. 1179-1184.
20. P.B. Messersmith and E.P. Giannelis, Synthesis and Barrier Properties of
Poly(Epsilon-Caprolactone)-Layered Silicate Nanocomposites. Journal of
Polymer Science Part a-Polymer Chemistry, 1995. 33(7): p. 1047-1057.
21. P.B. Messersmith and E.P. Giannelis, Polymer-Layered Silicate
Nanocomposites - In Situ Intercalative Polymerization of Epsilon-Caprolactone
in Layered Silicates. Chemistry of Materials, 1993. 5(8): p. 1064-1066.
22. A. Akelah and A. Moet, Polymer-clay nanocomposites: Free-radical grafting
of polystyrene on to organophilic montmorillonite interlayers. Journal of
Materials Science, 1996. 31(13): p. 3589-3596.
23. J.G. Doh and I. Cho, Synthesis and properties of polystyrene organoammonium
montmorillonite hybrid. Polymer Bulletin, 1998. 41(5): p. 511-518.
24. M.W. Weimer, H. Chen, E.P. Giannelis, and D.Y. Sogah, Direct synthesis of
dispersed nanocomposites by in situ living free radical polymerization using a
silicate-anchored initiator. Journal of the American Chemical Society, 1999.
121(7): p. 1615-1616.
25. J. Tudor, L. Willington, D. OHare, and B. Royan, Intercalation of catalytically
active metal complexes in phyllosilicates and their application as propene
polymerisation catalysts. Chemical Communications, 1996(17): p. 2031-2032.
26. J.S. Bergman, H. Chen, E.P. Giannelis, M.G. Thomas, and G.W. Coates,
Synthesis and characterization of polyolefin-silicate nanocomposites: a catalyst
intercalation and in situ polymerization approach. Chemical Communications,
1999(21): p. 2179-2180.
78
Page 79
CHAPTER 3 – Polymer / Clay Nanocomposites
27. M. Alexandre, P. Dubois, R. Jerome, M. Garcia-Marti, T. Sun, J.M. Garces,
D.M. Millar, and A. Kuperman, Polyolefin nanocomposites. 1999.
28. P. Dubois, M. Alexandre, F. Hindryckx, and R. Jerome, Polyolefin-based
composites by polymerization-filling technique. Journal of Macromolecular
Science-Reviews in Macromolecular Chemistry and Physics, 1998. C38(3): p.
511-565.
29. M. Alexandre, P. Dubois, T. Sun, J.M. Garces, and R. Jerome, Polyethylene-
layered silicate nanocomposites prepared by the polymerization-filling
technique: synthesis and mechanical properties. Polymer, 2002. 43(8): p. 2123-
2132.
30. Y.H. Jin, H.J. Park, S.S. Im, S.Y. Kwak, and S. Kwak, Polyethylene/clay
nanocomposite by in situ exfoliation of montmorillonite during Ziegler-Natta
polymerization of ethylene. Macromolecular Rapid Communications, 2002.
23(2): p. 135-140.
31. P.B. Messersmith and E.P. Giannelis, Synthesis and Characterization of
Layered Silicate-Epoxy Nanocomposites. Chemistry of Materials, 1994. 6(10):
p. 1719-1725.
32. T. Lan and T.J. Pinnavaia, Clay-Reinforced Epoxy Nanocomposites. Chemistry
of Materials, 1994. 6(12): p. 2216-2219.
33. Z. Wang and T.J. Pinnavaia, Nanolayer reinforcement of elastomeric
polyurethane. Chemistry of Materials, 1998. 10(12): p. 3769-3771.
34. L.M. Liu, Z.N. Qi, and X.G. Zhu, Studies on nylon 6 clay nanocomposites by
melt-intercalation process. Journal of Applied Polymer Science, 1999. 71(7): p.
1133-1138.
35. M. Kato, A. Usuki, and A. Okada, Synthesis of polypropylene oligomer-clay
intercalation compounds. Journal of Applied Polymer Science, 1997. 66(9): p.
1781-1785.
36. A. Usuki, A. Tukigase, and M. Kato, Preparation and properties of EPDM-
clay hybrids. Polymer, 2002. 43(8): p. 2185-2189.
79
Page 80
CHAPTER 3 – Polymer / Clay Nanocomposites
37. R.A. Vaia and E.P. Giannelis, Lattice model of polymer melt intercalation in
organically-modified layered silicates. Macromolecules, 1997. 30(25): p. 7990-
7999.
38. R.A. Vaia and E.P. Giannelis, Polymer melt intercalation in organically-
modified layered silicates: Model predictions and experiment.
Macromolecules, 1997. 30(25): p. 8000-8009.
39. A.C. Balazs, C. Singh, and E. Zhulina, Modeling the interactions between
polymers and clay surfaces through self-consistent field theory.
Macromolecules, 1998. 31(23): p. 8370-8381.
40. A.C. Balazs, C. Singh, E. Zhulina, and Y. Lyatskaya, Modeling the phase
behavior of polymer/clay nanocomposites. Accounts of Chemical Research,
1999. 32(8): p. 651-657.
41. C. Singh and A.C. Balazs, Effect of polymer architecture on the miscibility of
polymer/clay mixtures. Polymer International, 2000. 49(5): p. 469-471.
42. T.D. Fornes, P.J. Yoon, H. Keskkula, and D.R. Paul, Nylon 6 nanocomposites:
the effect of matrix molecular weight. Polymer, 2001. 42(25): p. 9929-9940.
43. T.D. Fornes, D.L. Hunter, and D.R. Paul, Effect of sodium montmorillonite
source on nylon 6/clay nanocomposites. Polymer, 2004. 45(7): p. 2321-2331.
44. T.D. Fornes, P.J. Yoon, D.L. Hunter, H. Keskkula, and D.R. Paul, Effect of
organoclay structure on nylon 6 nanocomposite morphology and properties.
Polymer, 2002. 43(22): p. 5915-5933.
45. N. Hasegawa, H. Okamoto, M. Kato, A. Usuki, and N. Sato, Nylon 6/Na–
montmorillonite nanocomposites prepared by compounding Nylon 6 with Na–
montmorillonite slurry. Polymer, 2003. 44: p. 2933–2937.
46. W. Xie, Z.M. Gao, W.P. Pan, D. Hunter, A. Singh, and R. Vaia, Thermal
degradation chemistry of alkyl quaternary ammonium montmorillonite.
Chemistry of Materials, 2001. 13(9): p. 2979-2990.
47. W. Xie, Z.M. Gao, K.L. Liu, W.P. Pan, R. Vaia, D. Hunter, and A. Singh,
Thermal characterization of organically modified montmorillonite.
Thermochimica Acta, 2001. 367: p. 339-350.
80
Page 81
CHAPTER 3 – Polymer / Clay Nanocomposites
48. D.L. VanderHart, A. Asano, and J.W. Gilman, NMR measurements related to
clay-dispersion quality and organic-modifier stability in nylon-6/clay
nanocomposites. Macromolecules, 2001. 34(12): p. 3819-3822.
49. D.L. Vanderhart, A. Asano, and J.W. Gilman, Solid-state NMR investigation of
paramagnetic nylon-6 clay nanocomposites. 2. Measurement of clay
dispersion, crystal stratification, and stability of organic modifiers. Chemistry
of Materials, 2001. 13(10): p. 3796-3809.
50. T.D. Fornes, P.J. Yoon, and D.R. Paul, Polymer matrix degradation and color
formation in melt processed nylon 6/clay nanocomposites. Polymer, 2003.
44(24): p. 7545-7556.
51. R.D. Davis, J.W. Gilman, and D.L. VanderHart, Processing degradation of
polyamide 6/montmorillonite clay nanocomposites and clay organic modifier.
Polymer Degradation and Stability, 2003. 79(1): p. 111-121.
52. J.W. Gilman, W.H. Awad, R.D. Davis, J. Shields, R.H. Harris, C. Davis, A.B.
Morgan, T.E. Sutto, J. Callahan, P.C. Trulove, and H.C. DeLong,
Polymer/layered silicate nanocomposites from thermally stable
trialkylimidazolium-treated montmorillonite. Chemistry of Materials, 2002.
14(9): p. 3776-3785.
53. S.C. Tjong, Y.Z. Meng, and A.S. Hay, Novel preparation and properties of
polypropylene-vermiculite nanocomposites. Chemistry of Materials, 2002.
14(1): p. 44-51.
54. M. Kawasumi, N. Hasegawa, M. Kato, A. Usuki, and A. Okada, Preparation
and mechanical properties of polypropylene-clay hybrids. Macromolecules,
1997. 30(20): p. 6333-6338.
55. N. Hasegawa, M. Kawasumi, M. Kato, A. Usuki, and A. Okada, Preparation
and mechanical properties of polypropylene-clay hybrids using a maleic
anhydride-modified polypropylene oligomer. Journal of Applied Polymer
Science, 1998. 67(1): p. 87-92.
56. E. Manias, A direct-blending approach for polypropylene/clay nanocomposites
enhances properties. Material Research Society Bulletin 2001. 26: p. 862–3.
81
Page 82
CHAPTER 3 – Polymer / Clay Nanocomposites
57. E. Manias, Polypropylene/silicate nanocomposites: Synthetic routes and
materials properties. Abstracts of Papers of the American Chemical Society,
2000. 219: p. U498-U498.
58. X.H. Liu and Q.J. Wu, PP/clay nanocomposites prepared by grafting-melt
intercalation. Polymer, 2001. 42(25): p. 10013-10019.
59. K.A. Carrado and L.Q. Xu, In situ synthesis of polymer-clay nanocomposites
from silicate gels. Chemistry of Materials, 1998. 10(5): p. 1440-1445.
60. E. Di Maio, S. Iannace, L. Sorrentino, and L. Nicolais, Isothermal
crystallization in PCL/clay nanocomposites investigated with thermal and
rheometric methods. Polymer, 2004. 45(26): p. 8893-8900.
61. P.H. Nam, P. Maiti, M. Okamoto, T. Kotaka, N. Hasegawa, and A. Usuki, A
hierarchical structure and properties of intercalated polypropylene/clay
nanocomposites. Polymer, 2001. 42(23): p. 9633-9640.
62. S. Hambir, N. N. Bulakh, and J.P. Jog, Polypropylene/clay nanocomposites:
Effect of compatibilizer on the thermal crystallization and dynamic mechanical
properties. Polymer Engineering and Science, 2002. 42: p. 1800.
63. T.D. Fornes and D.R. Paul, Crystallization behavior of nylon 6
nanocomposites. Polymer, 2003. 44(14): p. 3945-3961.
64. D.M. Lincoln, R.A. Vaia, and R. Krishnamoorti, Isothermal crystallization of
nylon-6/montmorillonite nanocomposites. Macromolecules, 2004. 37(12): p.
4554-4561.
65. T.G. Gopakumar, J.A. Lee, M. Kontopoulou, and J.S. Parent, Influence of clay
exfoliation on the physical properties of montmorillonite/polyethylene
composites. Polymer, 2002. 43(20): p. 5483-5491.
66. Y.C. Ke, C.F. Long, and Z.N. Qi, Crystallization, properties, and crystal and
nanoscale morphology of PET-clay nanocomposites. Journal of Applied
Polymer Science, 1999. 71(7): p. 1139-1146.
67. K.E. Strawhecker and E. Manias, Crystallization behavior of poly(ethylene
oxide) in the presence of Na plus montmorillonite fillers. Chemistry of
Materials, 2003. 15(4): p. 844-849.
82
Page 83
CHAPTER 3 – Polymer / Clay Nanocomposites
68. J. Menczel and J. Varga, Influence of Nucleating-Agents on Crystallization of
Polypropylene .1. Talc as a Nucleating-Agent. Journal of Thermal Analysis,
1983. 28(1): p. 161-174.
69. M. Fujiyama and T. Wakino, Structures and Properties of Injection Moldings
of Crystallization Nucleator-Added Polypropylenes .1. Structure Property
Relationships. Journal of Applied Polymer Science, 1991. 42(10): p. 2739-
2747.
70. B. Pukanszky and E. Fekete, Aggregation tendency of particulate fillers:
Determination and consequences. Polymers & Polymer Composites, 1998.
6(5): p. 313-322.
71. A. Pozsgay, T. Frater, L. Papp, I. Sajo, and B. Pukanszky, Nucleating effect of
montmorillonite nanoparticles in polypropylene. Journal of Macromolecular
Science-Physics, 2002. B41(4-6): p. 1249-1265.
72. P. Svoboda, C.C. Zeng, H. Wang, L.J. Lee, and D.L. Tomasko, Morphology
and mechanical properties of polypropylene/organoclay nanocomposites.
Journal of Applied Polymer Science, 2002. 85(7): p. 1562-1570.
73. W.B. Xu, M.L. Ge, and P.S. He, Nonisothermal crystallization kinetics of
polypropylene/montmorillonite nanocomposites. Journal of Polymer Science
Part B-Polymer Physics, 2002. 40(5): p. 408-414.
74. Q. Yuan and R.D.K. Misra, Impact fracture behavior of clay-reinforced
polypropylene nanocomposites. Polymer, 2006. 47(12): p. 4421-4433.
75. Y. Kojima, A. Usuki, M. Kawasumi, A. Okada, Y. Fukushima, T. Kurauchi,
and O. Kamigaito, Mechanical-Properties of Nylon 6-Clay Hybrid. Journal of
Materials Research, 1993. 8(5): p. 1185-1189.
76. T.D. Fornes, P.J. Yoon, H. Keskkula, and D.R. Paul, Nylon 6 nanocomposites:
the effect of matrix molecular weight (vol 42, pg 9929, 2001). Polymer, 2002.
43(7): p. 2121-2122.
77. S.M. Aharoni, n-Nylons, their synthesis, structure, and properties. 1997,
Chichester; New York: Wiley. 2259–68.
78. K.H. Illers and Haberkor.H, Melting Behavior, Structure and Crystallinity of 6-
Polyamide. Makromolekulare Chemie, 1971. 142: p. 31-67.
83
Page 84
CHAPTER 3 – Polymer / Clay Nanocomposites
79. G. Gurato, A. Fichera, F.Z. Grandi, R. Zannetti, and P. Canal, Crystallinity and
Polymorphism of 6-Polyamide. Makromolekulare Chemie-Macromolecular
Chemistry and Physics, 1974. 175(3): p. 953-975.
80. N.S. Murthy, S.M. Aharoni, and A.B. Szollosi, Stability of the Gamma-Form
and the Development of the Alpha-Form in Nylon-6. Journal of Polymer
Science Part B-Polymer Physics, 1985. 23(12): p. 2549-2565.
81. M. Kyotani and Mitsuhas.S, Studies on Crystalline Forms of Nylon-6 .2.
Crystallization from Melt. Journal of Polymer Science Part a-2-Polymer
Physics, 1972. 10(8): p. 1497-&.
82. L. Shen, W.C. Tjiu, and T.X. Liu, Nanoindentation and morphological studies
on injection-molded nylon-6 nanocomposites. Polymer, 2005. 46(25): p. 11969-
11977.
83. K. Varlot, E. Reynaud, M.H. Kloppfer, G. Vigier, and J. Varlet, Clay-
reinforced polyamide: Preferential orientation of the montmorillonite sheets
and the polyamide crystalline lamellae. Journal of Polymer Science Part B-
Polymer Physics, 2001. 39(12): p. 1360-1370.
84. Y. Kojima, A. Usuki, M. Kawasumi, A. Okada, T. Kurauchi, and O.
Kamigaito, One-Pot Synthesis of Nylon-6 Clay Hybrid. Journal of Polymer
Science Part a-Polymer Chemistry, 1993. 31(7): p. 1755-1758.
85. D.C. Lee and L.W. Jang, Preparation and characterization of PMMA-clay
hybrid composite by emulsion polymerization. Journal of Applied Polymer
Science, 1996. 61(7): p. 1117-1122.
86. M.W. Noh and D.C. Lee, Synthesis and characterization of PS-clay
nanocomposite by emulsion polymerization. Polymer Bulletin, 1999. 42(5): p.
619-626.
87. L. Nielsen, Platelet particles enhance barrier of polymers by forming tortuous
path. Journal of Macromolecular Science, Part A: Pure and Applied Chemistry
1967. 1: p. 929–42.
88. R.K. Bharadwaj, Modeling the barrier properties of polymer-layered silicate
nanocomposites. Macromolecules, 2001. 34(26): p. 9189-9192.
84
Page 85
CHAPTER 3 – Polymer / Clay Nanocomposites
89. T. Lan, P.D. Kaviratna, and T.J. Pinnavaia, On the Nature of Polyimide Clay
Hybrid Composites. Chemistry of Materials, 1994. 6(5): p. 573-575.
90. K. Yano, A. Usuki, A. Okada, T. Kurauchi, and O. Kamigaito, Synthesis and
Properties of Polyimide Clay Hybrid. Journal of Polymer Science Part a-
Polymer Chemistry, 1993. 31(10): p. 2493-2498.
91. J.W. Gilman, Flammability and thermal stability studies of polymer layered-
silicate (clay) nanocomposites. Applied Clay Science, 1999. 15(1-2): p. 31-49.
92. J.W. Gilman, T. Kashiwagi, and J.D. Lichtenhan, Nanocomposites: A
revolutionary new flame retardant approach. Sampe Journal, 1997. 33(4): p.
40-46.
93. J.W. Gilman, R.H. Harris, J.R. Shields, T. Kashiwagi, and A.B. Morgan, A
study of the flammability reduction mechanism of polystyrene-layered silicate
nanocomposite: layered silicate reinforced carbonaceous char. Polymers for
Advanced Technologies, 2006. 17(4): p. 263-271.
94. G. Beyer, Flame retardancy of nanocomposites based on organoclays and
carbon nanotubes with aluminium trihydrate. Polymers for Advanced
Technologies, 2006. 17(4): p. 218-225.
85
Page 86
4 Needle-like Clay Nanocomposites
4.1 Introduction - The Importance of Shape
Most of the research reported in literature on polymer/clay nanocomposites has been
focusing on platelet-like clays, in general smectite clays such as MMT. The
exfoliation of layered silicates and preparation of homogeneous nanocomposites is
seriously limited by the strong tendency of platelet-like to agglomerate due to their
extended contact surface.
Figure 4.1. Surface area to volume ratio (A/V) as a function of the aspect ratio (l/d)
of cylindrical particles. Reproduced from [1].
86
Page 87
CHAPTER 4 – Needle-like Clay Nanocomposites
Instead, the dispersion of inorganic fibres in a nanometre scale is a much easier
challenge due to a relative small contact surface. This is confirmed by the graph in
Fig. 4.1, that shows the surface area to volume ratio A/V in function of aspect ratio
(l/d) of a cylindrical particle, for a given particle volume. Values of l/d<0 correspond
to platelet-like particles, while l/d>0 correspond to rod-like particles. We can see that
A/V increases faster for platelet-like than for rod-like particles with respect to the
aspect ratio [1]. Hence, for an equivalent volume of particle, the platelet-like have a
higher contact surface. Furthermore, the mechanical reinforcement potential of fibres
is higher than platelet, as has been theoretically described by Gusev [2] and Van Es
[3], for unidirectional composites. Fig. 4.2, for instance, shows the graph of relative
Young’s modulus for unidirectional composites filled with platelets and fibres of
different aspect ratios, according to the Halpin-Tsai and Mori-Tanaka models. The
two models are equivalent for a fitted value of the shape factor ζ (ζ=2/3 l/t for flakes
or platelets and ζ=(0.5 l/t)1.8 for fibres) of the Halpin-Tsai equations (see Page 122-
123).
Figure 4.2. Reinforcement effect of platelets and fibres in unidirectional composites,
for different aspect ratios, according to Halpin-Tsai and Mori-Tanaka models.
Reproduced from [3].
87
Page 88
CHAPTER 4 – Needle-like Clay Nanocomposites
As we can see, the fibres offer a better reinforcement and approach the theoretical
maximum, defined by the simple rule of mixture, faster and for lower values of
aspect ratio. As described in Chapter 3, layer silicates are not only found in the
common platelet-like (or flake-like) shape but also in a fibre-like shape, as apply for
clay minerals such as sepiolite, attapulgite, and palygorskite. The objective of this
chapter is an overview of the literature relative to fibre-like (or needle-like) clay
nanocomposites.
4.2 Preparation methods
The preparation of needle-like clays nanocomposites has followed strategies similar
to the most common platelet-like clays nanocomposites, and can be classified into
the same categories.
4.2.1 In Situ Polymerisation
The in situ polymerisation method, as already stated earlier, involves the dispersion
of the filler into a monomer solution followed by polymerisation of the reaction
mixture.
a) b)
Figure 4.3. SEM micrographs of PA6/attapulgite nanocomposites obtained by in
situ polymerisation. The pictures refer to filler concentration of: a) 2 wt.% and b) 5
wt.% (right). From [4].
88
Page 89
CHAPTER 4 – Needle-like Clay Nanocomposites
The classical PA6 in situ polymerisation method has been recently adopted by
different authors [4-6]. Shen et al. [4] prepared PA6/attapulgite nanocomposites by
in situ polymerisation of the needle-like clays in ε-caprolactam monomer.
Attapulgite was previously pre-modified with cetyltrimethylamonium bromide
(CTAB) and reacted with toluene-2,4-diisocianate (TDI). SEM investigations were
carried out, on formic acid-etched surfaces, to evaluate the dispersion of attapulgite
in PA6 matrix, as shown in Fig. 4.3.
In situ polymerisation was also employed by Ozdilek et al. [6] in order to prepared
PA6/boehmite nanocomposites by hydrolytic polymerisation of ε-caprolactam in
presence of an aqueous boehmite suspension. Boehmite is not classified as a clay
mineral but it is included in this overview for the similarities with the other needle-
like clays. Boehmite, also known as γ-AlOOH, is a needle-like colloidal particle with
sizes in the nanometre scale and high anisotropy, hydrothermally synthesised from
aluminium alkoxide precursors. Fig. 4.4 shows the well defined shape of the
boehmite particles produced.
Figure 4.4. TEM picture of boehmite stabilised in n-propanol. Reproduced from [6].
The in situ polymerisation results into a homogeneous nanocomposite with well
dispersed needle-like particles, as it appears from the TEM pictures in Fig. 4.5. For
filler content below 7.5 wt.%, the boehmite particles are randomly dispersed into
89
Page 90
CHAPTER 4 – Needle-like Clay Nanocomposites
PA6 matrix, whereas at 9 wt.% they seem to show parallel nematic orientation. The
same authors, in a successive publication [5], described the in situ polymerisation of
PA6 in presence of Titanate-modified boehmite.
Figure 4.5. TEM pictures of PA6/boehmite nanocomposites, obtained by in situ
polymerisation, referring to (a) 7.5 wt.% and (b) 9 wt.% of filler. From [6].
With this functionalisation it was possible to obtain a more stable dispersion in ε-
caprolactam and a higher content of the filler without using excessive amount of
water.
Figure 4.6. TEM pictures of two different concentrations of Ti-modified oehmite/PA6
nanocomposites: 7 wt.% (left) and 15 wt.% (right). From [5].
90
Page 91
CHAPTER 4 – Needle-like Clay Nanocomposites
More in details, a dispersion of Ti-modified boehmite needles in n-propanol was
combined with ε-caprolactam to form a homogeneous mixture. When n-propanol
was completely extracted in rotavapor, the solid mixture monomer/filler left was
used for the polymerisation reaction. Morphological investigations by TEM (Fig.
4.6) show that Ti-modified boehmites are homogeneously distributed into PA6
matrix. Some regions of the higher concentrated nanocomposites (15 wt.%) seem to
show a nematic orientation of the needles.
In situ polymerisation was also used, by Du et al. [7], in order to prepare PE-based
nanocomposites. Palygorskite needle-like clays were first activated with the initiator
TiCl4, adsorbed on the clay surface, and then introduced, along with AlR4, hexane
and ethylene under pressure, into a reactor where the polymerisation took place.
Polyethylene chains were generated simultaneously on different activated points of
the palygorskite surface, resulting into a highly entangled “macromolecular comb”.
The so-produced PE/palygorskite nanocomposites were successively melt-blended
with a commercial grade PE and then processed in a twin screw extruder at 220 °C.
Epoxy nanocomposites based on sepiolite clays were reported by Zheng [8].
Different amounts of sepiolite were dispersed in diglycidyl ether of bisphenol A
(DGEBA) at 130 °C, followed by the addition of an hardener (epoxy:hardener =
1:0.875).
Figure 4.7. TEM picture of sepiolite in epoxy matrix. From [8].
91
Page 92
CHAPTER 4 – Needle-like Clay Nanocomposites
The cured epoxy nanocomposites presented a filler dispersion described by the
authors as “tree branched” (Fig. 4.7). More recently, Xue and Pinnavia [9]
systematically studied the effect of palygorskite functionalisation on the preparation
and properties of epoxy-based nanocomposites. The needle-like clays were
stoichiometrically silylated, assuming a density of four silanol sites per square
nanometre of palygorskite, with different reagents such as: γ-
aminopropyltrimethoxysilane (APTMS), N-dodecyltriethoxysilane (DTES) and
1,1,1,3,3,3-hexamethyldisalazane (HMSZ). Modified and not-modified clays were
successively dispersed in DGEBA and cured in order to obtain rubbery or glassy
epoxy nanocomposites. If pristine clays were not well dispersed in epoxy pre-
polymer and tend to sediment before curing, the silylation modification substantially
improved the clay dispersability.
The preparation of elastomer/sepiolite nanocomposites has been reported by
Bokobza et al. [10].
Figure 4.8. TEM pictures of elastomer/sepiolite nanocomposites containing 5phr of
clays. From [10].
Clay particles were dispersed into the monomer, 2-hydroxyethyl acrylate, with a high
shear mixing apparatus for several hours and the mixture was polymerised, under UV
illumination, after addition of 0.05 wt.% of a photo-initiator (Irgacure 819, from
92
Page 93
CHAPTER 4 – Needle-like Clay Nanocomposites
CIBA). The TEM picture in Fig. 4.8, relative to the elastomer/sepiolite
nanocomposite containing 5 phr of clays, shows good sepiolite dispersion.
4.2.2 Melt Compounding
One of the first needle-like particles nanocomposites prepared by melt-compounding
was reported by Souma [11-13]. The author obtained the composite by mixing
Xonotlite with unplasticized PVC in a heating roll. Xonotlite is a needle shaped
calcium silicate and it is synthesized by hydrothermal reaction of Ca(OH)2 and SiO2.
Two techniques were employed to promote the disaggregation of Xonotlite particles.
One was a mechanical atomisation by jet air mill (abbreviated as X(JA)) and other
was the addition of hexamethyl disiloxane (HMDS) directly into the reaction system
(abbreviated as X(HMDS)). In a series of successive publications, Acosta et al. [14-
16] focused on the use of sepiolite as filler for polypropylene. Sepiolite was used
pristine, as received, or previously modified (esterified) with different aliphatic
organic acids, by means of a condensation reaction of the superficial hydroxyl groups
with the acid groups of the reagents. Three sepiolite concentrations (10, 25, 40 wt.%)
were obtained melt-compounding treated and untreated-sepiolite with PP in a
Brabender Plasticorder internal mixer, preheated to 200 °C. The rotor speed was set
at 60 rpm and the mixing time at 15 min. The same authors presented the production
of a hybrid composite in which different amounts of sepiolite were added to a
PP/glass fibre composite [17]. The approach was intended to examine any synergistic
effects of the two fillers and also to partially replace the glass fibres for a cheaper
material, with obvious economic benefits. The binary systems PP/glass fibre (glass
fibre content: 10, 20, 30 wt.%) and PP/sepiolite (sepiolite content: 10, 25, 49 wt.%)
were melt-compounded in a roll mixer at 190 °C, in the needed amounts in order to
obtain ratios of 10/20 and 20/10 wt.% of glass fibre/sepiolite in the final hybrid
composites.
Recently Wang and Sheng [18, 19] reported on the preparation of polypropylene/org-
attapulgite nanocomposites. The needle-like clays were organo-modified by first
reacting with γ-methacryloxypropyl trimethoxysilane followed by a grafting of butyl
93
Page 94
CHAPTER 4 – Needle-like Clay Nanocomposites
acrylate. Varying amount of org-attapulgite clays were then melt-blended with PP in
a mixer apparatus at a temperature of 185 °C and a residence time of 10 min at 32
rpm, to obtain nanocomposites with filler concentration from 1 to 7 wt.%. Fig. 4.9
refers to a 5 wt.% PP/org-attapulgite.
Figure 4.9. TEM picture of PP/org-attapulgite nanocomposites with 5 wt.% filler
content [19]. Although no scale bar appears in the micrograph, the diameter of the
attapulgite is estimated at 40nm.
4.3 Properties of Needle-like Clay Nanocomposites
4.3.1 Crystallisation
It is well known that the presence of inorganic particles can dramatically change the
crystallisation behaviour of polymers. In order to understand the relation between
structure and physical and mechanical properties of nanocomposites materials it is
extremely important to evaluate the crystallinity and the crystallisation.
Acosta et al. [16] first studied the crystallisation kinetic of PP composites containing
Sepiolite surface-treated with isobutyric acid. The authors conducted both isothermal
and non-isothermal kinetics studies. For the isothermal crystallisations the samples
94
Page 95
CHAPTER 4 – Needle-like Clay Nanocomposites
were heated to 473 K, held at that temperature for 5 min, in order to minimize the
effect of thermal history, and successively cooled down and held at three different
crystallisation temperatures (399 K, 401 K and 403 K); the results were interpreted
with the Avrami’s equation [20-22], which describes the crystallisation kinetics and
can be written as:
)()())1ln(ln( tnLnKLnX t +=−− Equation 4.1
Where Xt is the progressive volume fraction transformed into crystal until the time t,
K a scaling factor and n the Avrami constant. The constant n gives insight into the
nucleation process (homogeneous/heterogeneous) and the shape of the growing
crystal (rod/disc/sphere/sheaf).
Non-isothermal crystallisations were carried out at three different cooling rates (10, 5
and 2.5 K/min) and studied in terms of the Harnish and Muschik’s method. The
above kinetics studies concluded that sepiolite treated with isobutyric acid acted as
nucleating agent for polypropylene, increasing both crystallinity ratio and rate
(evaluated by Avrami’s values K). Moreover the needle-like clays induced the
formation of a second ordered PP structure, claimed to derive from an interphase on
the particle periphery and demonstrated by the graphic representation of the
Avrami’s equation, which showed two well-defined slopes. Wang and Sheng [23,
24] studied the isothermal and non-isothermal crystallisation of PP/org-attapulgite
nanocomposites prepared by melt compounding and already described in session
4.2.2. Four crystallisation temperatures (121, 122, 123 and 124 °C) were chosen for
the isothermal crystallisation tests and the results explained in terms of the Avrami’s
equation and Hoffman’s theory (Fig. 4.10). Org-attapulgite particles incorporated in
PP matrix acted as heterogeneous nuclei, dramatically increasing the crystallisation
rate, with values of Avrami’s exponent n increased from 2.39-2.81 to 4.24-4.93.
Only minor effects were found on the equilibrium melting temperature and degree of
crystallinity. Polarised optical microscopy observations revealed that the spherulites
size decrease and the number increase with attapulgite content.
95
Page 96
CHAPTER 4 – Needle-like Clay Nanocomposites
Figure 4.10. Avrami’s plot for (a) neat PP and PP/ATP nanocomposites: (b)
PP/ATP 1 wt.%, (c) PP/ATP 3 wt.% and (c) PP/ATP 5 wt.%, at three different
crystallisation temperatures [24].
4.3.2 Mechanical Properties
The mechanical properties of polymeric materials have been shown to be remarkably
improved when nanocomposites are formed with low filler content. Wang and Sheng
[19] have recently investigated the tensile properties of PP/attapulgite produced by
melt-compounding. Both pristine and organo-modified attapulgite clays were used as
nano-fillers in PP matrix. The Young’s modulus and yield stress of nanocomposites
with different filler content is presented in Fig. 4.11. All samples show an increased
modulus, though the enhancement of the org-attapulgite is much larger than that of
pristine attapulgite.
96
Page 97
CHAPTER 4 – Needle-like Clay Nanocomposites
a) b)
Figure 4.11. Young’s modulus and yield stress for PP/Org-ATP nanocomposites in
function of the filler content [19].
The presence of any amount of non-modified attapulgite decrease the yield stress of
nanocomposites compared to the neat PP, meaning weak interfacial interactions
matrix/filler. The yield stress of PP/org-attapulgite nanocomposites, however, shows
a maximum increase of 13 %, compared to neat PP, relative to a 3 wt.% content of
clays. Unfortunately the properties at break are not presented by the authors and can
not be commented on. The properties of PE/palygorskite nanocomposites prepared
by Du et al. [7] via an in situ polymerisation method are shown in the Table 4.1.
Table 4.1. Mechanical properties of in situ polymerised PE/palygorskite
nanocomposites [7].
Sample Filler wt.
[%]
Tensile strength
[MPa]
Elongation at break
[%]
Impact strength
[kJ/m2]
PE 0 31.4 180.2 50.7
PB1 1 38.1 172.1 82.9
PB2 1.7 32.3 170.2 70.9
PB3 2.2 26.1 166.7 60.2
PB4 3.3 22.4 160.8 42.8
Interestingly, the tensile strength is significantly enhanced with just 1 wt.% of
palygorskite needle-like clays without the trade-off of a reduced ductility. In fact the
97
Page 98
CHAPTER 4 – Needle-like Clay Nanocomposites
elongation at break for that concentration was only limitedly reduced while the
impact strength remarkably increased. Xue and Pinnavia [9] have studied the
mechanical properties of epoxy polymers reinforced by different modified-
palygorskite and the results are presented in Table 4.2.
Table 4.2. Mechanical properties of rubbery epoxy/palygorskite nanocomposites [9].
Nano-particle and
nano-particle loading [%]
Tensile strength
[MPa]
Tensile modulus
[MPa]
Tensile elongation
[%]
None 0.62 (6.8 %) 2.8 (5.0%) 25.0 (8.0%)
Palygorskite
2 0.71 (8.2 %) 4.4 (7.7 %) 25.3 (9.2 %)
5 0.74 (8.5 %) 4.0 (6.9 %) 20.7 (8.9 %)
10 1.32 (7.3 %) 5.0 (6.4 %) 28.1 (9.0 %)
APTMS-Palygorskite
2 0.81 (4.7 %) 4.7 (7.0 %) 24.0 (10.3 %)
5 0.89 (5.5 %) 3.5 (6.0 %) 28.4 (8.8 %)
10 1.03 (9.2 %) 4.4 (7.3 %) 21.8 (9.8 %)
DTES-Palygorskite
2 1.18 (2.3 %) 4.7 (5.2 %) 30.9 (2.6 %)
5 0.98 (4.2 %) 3.5 (9.1 %) 30.8 (5.5 %)
10 1.47 (6.3 %) 6.2 (8.4 %) 26.0 (7.7 %)
HMSZ-Palygorskite
2 0.97 (5.0 %) 4.8 (3.8 %) 24.3 (8.1 %)
5 1.00 (7.2 %) 5.4 (6.0 %) 21.1 (6.0 %)
10 1.35 (6.4 %) 6.7 (9.5 %) 21.2 (13.4 %)
Organo-MMT/Epoxy
0 ~0.5 ~2.6 -
2 ~0.8 ~5.5 -
5 ~1.5 ~7.5 -
10 ~3.3 ~13 -
Numbers in parentheses are the relative standard deviation.
98
Page 99
CHAPTER 4 – Needle-like Clay Nanocomposites
The as-received palygorskite provide some improvements in the modulus of epoxy
matrix but little improvements in tensile strength at filler loading of 2 wt.% and 5
wt.%. The abrupt enhancement at 10 wt.% is explained by an increase in the
viscosity of the pre-polymer mixtures that prevents the settling-out of the filler. The
organo-modification of the palygorskite provides a better dispersion and hence better
mechanical properties, especially at low filler content (2 wt.% and 5 wt.%).
Comparing the reinforcing effect of palygorskite and organo-modified-MTT we can
observe that the second provide better mechanical properties for higher loading of
filler. However the level of organo-modification for palygorskite is <0.2 % of the
level used to compatibilise MMT, with obvious cost benefits.
4.3.3 Rheology
The rheology of particulate suspensions is governed by factors such as the structure,
size and shape of the dispersed phase as well as its orientation distribution and the
strength of interaction between the dispersed and dispersant phase. Understanding
the rheological properties of polymer/clay nanocomposites is crucial in gaining
insights into the processability and the structure-properties relations of these
materials. Shen et al. [4] performed rheological studies on PA6/attapulgite
nanocomposites and investigated the effect of varying loadings of the fibrous silicate
on the linear and non-linear viscoelastic properties. The results were interpreted in
terms of solid-like behaviour and percolated network structure and comparisons were
drawn between the behaviour of needle-like and platelet-like clays. The linear
dynamic viscoelastic curves for PA6 and PA6/attapulgite nanocomposites are shown
in Fig. 4.12. At the temperature of 160 °C and the frequency range of 10-1-102 rad s-1,
PA6 exhibits the usual behaviour of homopolymer melts with low Mw distribution,
i.e. and , where G’ and G’’ and ω are respectively the storage shear
modulus, the loss shear modulus and the angular frequency [25]. The addition of
clays significantly modifies the viscoelastic response. At high frequencies the
behaviour of G’ and G’’ is qualitatively similar while at low frequency range
2' ω∝G ω∝''G
99
Page 100
CHAPTER 4 – Needle-like Clay Nanocomposites
PA6/attapulgite nanocomposites have higher G’, G’’ and viscosity when compared
with PA6 and show a monotonic increase with clay content. Moreover all the
nanocomposites display significantly reduced frequency dependence. Especially at
low frequency range, G’ and G’’ becomes almost independent from the frequency,
which is characteristic of materials with solid-like behaviour, i.e.
and .
0' ω∝G0'' ω∝G
Figure 4.12. Small amplitude strain sweep (A) and frequency sweep (B-D) at 260 °C
for neat PA6 (a) and PA6 nanocomposites with attapulgite content of: (b) 2 wt.%, (c)
3 wt.%, (d) 4 wt.% and (e) 5 wt.%. From [4].
The above frequency dependence of G’ and G’’ is similar to that observed by
Krishnamoorti and Giannelis [26] for PCL-MMT nanocomposites, explained by the
formation of a percolated structure of the dispersed nanoclays in the polymer matrix
(Fig. 4.13).
100
Page 101
CHAPTER 4 – Needle-like Clay Nanocomposites
Figure 4.13. Schematic description of the polymer/needle-like clay percolating
structure. From [26].
Simplifying the lattice model in Isichenco’s review [27], Shen et al. formulated a
‘grafting-percolating’ model able to describe the percolation thresholds of attapulgite
sticks (aspect ratio l/d=30-40) in a polymer matrix.
Figure 4.14. 2D sketch of the percolation lattice model at Φ<Φc (A), Φ=Φc (B) and
Φ>Φc. Black occupied lattices represent the sticks percolated, while the grey
occupied lattices represent the sticks unpercolated. The symbol ‘X’ indicates the
lattices occupied by grafted polymer chains. From [4].
101
Page 102
CHAPTER 4 – Needle-like Clay Nanocomposites
Applying a Monte Carlo simulation to the 3D lattice model (Fig. 4.14), the authors
were able to predict a percolation occurring at a volume fraction of attapulgite Φc of
0.02, or, alternatively, a weight fraction of 3-4 wt.%.
4.4 References
1. H. Fischer, Polymer nanocomposites: from fundamental research to specific
applications. Materials Science & Engineering C-Biomimetic and
Supramolecular Systems, 2003. 23(6-8): p. 763-772.
2. A.A. Gusev, Numerical identification of the potential of whisker- and platelet-
filled polymers. Macromolecules, 2001. 34(9): p. 3081-3093.
3. M. Van Es, Polymer-Clay nanocomposites-the importance of particle
dimensions. 2001, TU Delft: Delft.
4. L. Shen, Y.J. Lin, Q.G. Du, W. Zhong, and Y.L. Yang, Preparation and
rheology of polyamide-6/attapulgite nanocomposites and studies on their
percolated structure. Polymer, 2005. 46(15): p. 5758-5766.
5. C. Ozdilek, K. Kazimierczak, and S.J. Picken, Preparation and
characterization of titanate-modified Boehmite-polyamide-6 nanocomposites.
Polymer, 2005. 46(16): p. 6025-6034.
6. C. Ozdilek, K. Kazimierczak, D. van der Beek, and S.J. Picken, Preparation
and properties of polyamide-6-boehmite nanocomposites. Polymer, 2004.
45(15): p. 5207-5214.
7. Z.J. Du, J.F. Rong, W. Zhang, Z.H. Jing, and H.Q. Li,
Polyethylene/palygorskite nanocomposites with macromolecular comb
structure via in situ polymerization. Journal of Materials Science, 2003. 38(24):
p. 4863-4868.
8. Y. Zheng and Y. Zheng, Study on Sepiolite-Reinforced Polymeric
Nanocomposites. Journal of Applied Polymer Science, 2006. 99: p. 2163-2166.
9. S.Q. Xue, M. Reinholdt, and T.J. Pinnavaia, Palygorskite as an epoxy polymer
reinforcement agent. Polymer, 2006. 47(10): p. 3344-3350.
102
Page 103
CHAPTER 4 – Needle-like Clay Nanocomposites
10. L. Bokobza, A. Burr, G. Garnaud, M.Y. Perrin, and S. Pagnotta, Fibre
reinforcement of elastomers: nanocomposites based on sepiolite and
poly(hydroxyethyl acrylate). Polymer International, 2004. 53(8): p. 1060-1065.
11. I. Souma and M. Serizawa, Studies on the Pyrolysis of the Pvc-Xonotlite
Composite System. Journal of Fire & Flammability, 1979. 10(3): p. 199-206.
12. I. Souma and H. Wakano, Studies on the Combustion of the Pvc-Xonotlite
Composite System. Journal of Fire & Flammability, 1979. 10(2): p. 129-139.
13. I. Souma, Dynamic Mechanical-Properties of Polyvinyl Chloride)-Xonotlite
Composite System. Journal of Applied Polymer Science, 1982. 27(5): p. 1523-
1532.
14. J.L. Acosta, M.C. Ojeda, E. Morales, and A. Linares, Morphological,
Structural, and Interfacial Changes Produced in Composites on the Basis of
Polypropylene and Surface-Treated Sepiolite with Organic-Acids .1. Surface-
Treatment and Characterization of the Sepiolites. Journal of Applied Polymer
Science, 1986. 31(7): p. 2351-2359.
15. J.L. Acosta, M.C. Ojeda, E. Morales, and A. Linares, Morphological,
Structural, and Interfacial Changes Produced in Composites on the Basis of
Polypropylene and Surface-Treated Sepiolite with Organic-Acids .2. Thermal-
Properties. Journal of Applied Polymer Science, 1986. 31(6): p. 1869-1878.
16. J.L. Acosta, M.C. Ojeda, E. Morales, and A. Linares, Morphological,
Structural, and Interfacial Changes Produced in Composites on the Basis of
Polypropylene and Surface-Treated Sepiolite with Organic-Acids .3.
Isothermal and Nonisothermal Crystallization. Journal of Applied Polymer
Science, 1986. 32(3): p. 4119-4126.
17. J.L. Acosta, E. Morales, M.C. Ojeda, and A. Linares, Effect of Addition of
Sepiolite on the Mechanical-Properties of Glass-Fiber Reinforced
Polypropylene. Angewandte Makromolekulare Chemie, 1986. 138: p. 103-110.
18. L.H. Wang and J. Sheng, Graft polymerization and characterization of butyl
acrylate onto silane-modified attapulgite. Journal of Macromolecular Science-
Pure and Applied Chemistry, 2003. A40(11): p. 1135-1146.
103
Page 104
CHAPTER 4 – Needle-like Clay Nanocomposites
19. L.H. Wang and J. Sheng, Preparation and properties of polypropylene/org-
attapulgite nanocomposites. Polymer, 2005. 46(16): p. 6243-6249.
20. M. Avrami, Kinetics of phase change. III: granulation, phase change and
microstructures. Journal of Chemical Physics, 1941. 9: p. 177.
21. M. Avrami, Kinetics of phase change. II: transformation-time relations for
random distribution of nuclei. Journal of Chemical Physics, 1940. 8: p. 212.
22. M. Avrami, Kinetics of phase change. I: General Theory. Journal of Chemical
Physics, 1939. 7: p. 103.
23. L.H. Wang, J. Sheng, and S.Z. Wu, Isothermal crystallization kinetics of
polypropylene/attapulgite nanocomposites. Journal of Macromolecular
Science-Physics, 2004. B43(5): p. 935-946.
24. L.H. Wang and J. Sheng, Nonisothermal crystallization kinetics of
polypropylene/attapulgite nanocomposites. Journal of Macromolecular
Science-Physics, 2005. B44(1): p. 31-42.
25. C.W. Macosko, Rheology: principles, measurements and applications. 1994,
New York: Wiley-VCH.
26. R. Krishnamoorti and E.P. Giannelis, Rheology of end-tethered polymer
layered silicate nanocomposites. Macromolecules, 1997. 30(14): p. 4097-4102.
27. M.B. Isichenko, Percolation, Statistical Topography, and Transport in
Random-Media. Reviews of Modern Physics, 1992. 64(4): p. 961-1043.
104
Page 105
PART 2: Experimental Results and
Discussion
105
Page 106
5 The Potential of Sepiolite Nanoclay
as a Reinforcement for Polymer
Composites
5.1 Introduction
Numerous publications are already available on polymer/clay nanocomposites (as
shown in Chapter 3 and 4), though most of it deals with smectite clays (i.e. MMT).
The main originality of this PhD thesis, with respect to the existing literature, is to
study sepiolite clay as nanofiller for polymer nanocomposites and to draw
comparisons with the commonly studied smectite clays (Chapter 5, 6, 8). This
comparison is interesting because of the intrinsic shape difference between the two
clays (needle-like shape for sepiolite and platelet-like shape for smectite clays),
which is expected to be particularly important in oriented structures. In fact, few are
the works on oriented polymer/clay nanocomposites and Chapter 7 represents an
important contribution to this research area. Another open question in the scientific
community is the effect of polymer/clay interphase in the final nanocomposite
mechanical properties. Chapter 9 will try to give an answer to this, by preparing
model nanocomposites via in-situ polymerisation.
106
Page 107
CHAPTER 5 – Sepiolite Nanoclay as a Reinforcement for Polymer Composites
The following chapter is meant to provide fundamental information about sepiolite
nanoclay. It is reasonable to believe that each nano-filler behaves differently and also
that the same nano-filler can perform differently in different polymers, according to
its specific characteristics. First, the shape and dimensions of the filler are studied via
scanning and transmission electron microscopy, followed by Brunauer-Emmett-
Teller (B.E.T.) analysis in order to determine the specific surface area. The
dehydration of such nanoclay is also quantified by thermo gravimetric analysis in
inert atmosphere. For the first time in the literature, the stiffness of sepiolite nanoclay
is directly measured by nano-bending tests using scanning probe microscopy (SPM).
The last paragraph of this chapter will predict the reinforcing efficiency of sepiolite
nanoclay in two thermoplastic polymers (PP and PA6) which will be used in the
proceeding of this thesis, using micromechanical theories. A particular attention will
be given to the comparison between sepiolite and more commonly used smectite
clays (i.e. Montmorillonite (MMT)) in terms of theoretical reinforcement.
5.2 Experimental
5.2.1 Materials
The sepiolite clays (Pangel) were supplied by Tolsa (Spain), and used as received.
The porous substrate used for the SPM nano-bending tests, in a holographic epoxy
membrane of 1µm pore size, provided by Eindhoven Technical University (The
Netherlands) [1].
5.2.2 Characterisation Techniques Morphological Analysis
Morphological studies were carried out using a Scanning Electron Microscope
(SEM), Jeol JSM-6300F, and Transmission Electron Microscope (TEM), Jeol JEM
107
Page 108
CHAPTER 5 – Sepiolite Nanoclay as a Reinforcement for Polymer Composites
2010 TEM. The samples were prepared by deposition of a sepiolite water suspension
on a metal substrate, followed by gold coating (for the SEM), or directly on carbon
coated TEM copper grids (Agar Scientific).
BET
The equipment used for the specific surface area characterisation is a Micromeritics
Gemini 2360, working in multipoint BET mode. Powder samples were dried over
night in an oven at 80 °C, followed by a treatment (degassing) at 200 °C under
vacuum for 2 hours prior to analysis, using VacPrep060. The tests are performed at
-197 °C (in a liquid nitrogen bath).
TGA
Thermo Gravimetric Analyses (TGA) were performed with a TA instrument Q500
on about 10mg samples. The tests were performed at a scanning rate of 20 K/min up
to 1000 °C, under inert atmosphere (N2) conditions.
Scanning Probe Microscopy
The instrument used is an NTegra (NT-MDT, Russia) operating with a closed-loop
system to minimize piezo drift during measurements. Force-displacement curves and
images were obtained using standard SPM probes (Nanosensors, Switzerland, spring
constant ~ 2 Nm-1).
5.3 Results and Discussion
5.3.1 Morphological Analysis Sepiolite appears as a very fine powder at naked eyes. Only an investigation at
electron microscope can reveal us more about the nature of the constituent
elementary particles. Fig. 5.1 shows an SEM micrograph of sepiolite clays deposited
on a porous substrate.
108
Page 109
CHAPTER 5 – Sepiolite Nanoclay as a Reinforcement for Polymer Composites
Figure 5.1. SEM micrograph of sepiolite clays dispersed on a porous substrate.
Some agglomerates of several microns can be observed, constituted by smaller
needle-like shaped particles. The fibrous nature of this clay can be easier
distinguished in the TEM picture in Fig. 5.2.
Figure 5.2. TEM micrograph of sepiolite on carbon-coated copper grids.
The sample can be considered to be very homogeneous although few impurities are
present. These appear as darker spots of irregular plate-like shape, probably been
different smectite clays.
109
Page 110
CHAPTER 5 – Sepiolite Nanoclay as a Reinforcement for Polymer Composites
At higher magnifications (Fig. 5.3a-b) we can notice that individual needles are quite
regular in diameter but have a wider range of lengths.
a)
b)
Figure 5.3. TEM micrographs of sepiolite clays on carbon coated TEM grids.
Distribution of: a) lengths and b) diameters. Black arrows underline single fibres
measurements.
Applying a statistical approach on a significant number of pictures, the dimensions of
the needles can be derived after post-processing with Image Pro® software (Fig.5.4)
110
Page 111
CHAPTER 5 – Sepiolite Nanoclay as a Reinforcement for Polymer Composites
a)
500 1000 1500 20000
10
20
30
40
50
60
70
Freq
uenc
y
Sepiolite Length [nm]
b)
10 15 20 25 30 35 40 45 500
10
20
30
40
50
Freq
uenc
y
Sepiolite Diameter (nm)
Figure 5.4. Distributions of: a) sepiolite lengths and b) sepiolite diameters.
111
Page 112
CHAPTER 5 – Sepiolite Nanoclay as a Reinforcement for Polymer Composites
The length of the nano-fibres varies between 200nm and 2µm, with an average of
about 650nm while the diameter varies between 15nm and 35nm, with an average of
24nm. The nanofiller average aspect ratio s (L/D) is then 27 but it ranges between 10
and 130.
In comparison, montmorillonite is a platelet-like clay with about 1nm thickness and
up to few microns width. The aspect ratio should be higher than 1000 but it is usually
in the range of 100-1000 because stacks of few intercalated plates are often found
rather than individual particles.
5.3.2 B.E.T. Measurements
The acronym B.E.T. (derived from the authors of the equation Brunauer, Emmett and
Teller) describes a technique that allows determining the specific surface area of a
solid sample [2]. Such parameter, usually expressed in m2/g, is extremely important
in fields like catalysis, for instance, where the reactivity depends on the surface area
of a given catalyst. In this study, it is important to know the surface area of sepiolite
to estimate the extension of the interface matrix/filler in polymer/clay
nanocomposite.
The determination of the specific surface area by B.E.T is based on the adsorption of
a gas on to the surface of a solid sample. An adsorptive (nitrogen in this case) is
admitted to the solid in controlled increments. After each dose of adsorptive, the
pressure is allowed to equilibrate and the quantity of gas adsorbed is calculated. The
gas volume adsorbed at each pressure (and at one constant temperature) defines an
adsorption isotherm. The specific surface area is determined by the quantity of gas
required to form a monolayer over the external surface of the sample, which can be
calculated by fitting the adsorption isotherms with the BET equation [3]. The BET
model describes reasonably well adsorption for relative pressures P/P0 between 0.05
and 0.35, and then the fitting is limited to such interval of pressure. In Table 5.1, the
values relative to a series of isotherms are reported.
112
Page 113
CHAPTER 5 – Sepiolite Nanoclay as a Reinforcement for Polymer Composites
Table 5.1. Volume of N2 gas adsorbed on sepiolite clay at different pressures.
Relative Pressure, P/P0 Pressure [mmHg] Vol. adsorbed [cm3g-1 at STP]
0.0999 77.57 86.424
0.1498 116.39 89.980
0.1998 155.21 93.173
0.2498 194.05 96.246
0.2998 232.85 99.379
The BET equation assumes the form:
admon
admon
ado
CVCPP
CVPPVPP )1(/1
)/1(/ 0
0
−+=
− Equation 5.1
Where C is a constant and is the volume of gas required to get one complete
monolayer. If we plot
admonV
)/1(/
0PPVPP
ado
− versus , a straight line can be fitted, with
slope and intercept .
oPP /
admonCVC /)1( − ad
monCV/1
From the slope and intercept C and can be determined. From the linear fitting of
the BET plot in Fig. 5.5, the values obtained are C=-52.884 and =67.452. The
specific surface area can then be simply calculated by
admonV
admonV
g
Aad
montotalBET V
NVS
σ=, Equation 5.2
Where N is Avogadro’s number (6.022E+23), σA is the cross sectional area of N2
molecules (0.162 nm2) and Vg is molar volume of adsorbed gas (17.3 cm3mol-1) at
STP. It can then be calculated that the specific surface area of sepiolite clay is 300
m2g-1, in good accordance with the literature [4-7].
113
Page 114
CHAPTER 5 – Sepiolite Nanoclay as a Reinforcement for Polymer Composites
0.10 0.15 0.20 0.25 0.300.0010
0.0015
0.0020
0.0025
0.0030
0.0035
0.0040
0.0045
(P/P
0)/(V
ad*(
1-P/
P 0))
P/P0
Figure 5.5. B.E.T. plot of )/1()/( 0PPVPP ad
o − versus relative pressure C
and can be calculated from the linear fit of the data point, since the slope is
and intercept is .
)/( oPP .
admonV
admonCVC /)1( − ad
monCV/1
The specific surface area calculated by BET method does not correspond simply to
the total external surface of the clay. In fact, sorption in sepiolite occurs also in the
internal channels. Hence, from the adsorption isotherms it is measured the sum of the
internal and external surface area; the inner surface area accounting for an important
fraction of the total (40 %) [4].
For comparison, the specific surface area of MMT clay calculated with the same
technique and reported in literature is much lower [8-10]. It usually varies between
25 m2g-1 and 40 m2g-1, for pristine clay and it is further reduced after surface
functionalisation.
This value is surprisingly low. The specific surface area can be extrapolated from the
one of a single platelet. A value of around 1000 m2g-1 can be calculated, taking a
density of 2 g/cm3 and approximating the particle to a rectangular prism of
114
Page 115
CHAPTER 5 – Sepiolite Nanoclay as a Reinforcement for Polymer Composites
1µmx1µmx1nm. The same calculations applied to the sepiolite, considering a
cylinder of 24 nm diameter and 650 nm length, give a specific surface of 100 m2g-1,
which is not far from the experimental value once the contribution of the internal
porosity is excluded. The low specific surface area measured for MMT can be
attributed to the denser structure, in which stacks of platelets are collapsed on each
other, effectively reducing the total accessible surfaces. In fact, it is believed that
BET measures only the external specific surface area, while the total specific surface
area, in the case of completely exfoliated clays, has been quantified in 658 m2g-1,
from TEM micrographs analysis [11]. The observation above is believed to be an
indication of the difficulties in separating individual platelet-like clays (i.e. MMT)
rather than fibre-like clays (i.e. sepiolite). Therefore sepiolite should be
comparatively easier to disperse.
5.3.3 Thermal Properties
As already mentioned one the most important characteristics of sepiolite clay,
already exploited in industrial applications, is their excellent adsorptive properties.
This is mainly due to the high specific surface area, high porosity and surface activity
of such clay.
In this section we are interested in studying the desorption of molecules, like water,
inevitably present on sepiolite. The dehydratation process of sepiolite was studied by
thermogravimetric analysis (TGA), in which the clays are subjected to a temperature
scan up to 1000 °C, at the rate of 20 K/min, in inhert atmosphere, with a flow rate of
nitrogen gas of 40 ml/min. Fig. 5.6 clearly shows four main weight losses attributed
respectively, for ascending temperature, to the release of adsorbed and zeolitic water,
the release of the first structural water, the release of the second structural water and
the dehydroxylation of the Mg-OH groups (Table 5.2) [12].
115
Page 116
CHAPTER 5 – Sepiolite Nanoclay as a Reinforcement for Polymer Composites
0 200 400 600 800 1000
80
85
90
95
100
3.3%
2.6%
3.5%
10.3%
Wei
ght [
%]
Temperature [°C]
Figure 5.6. Dehydration of sepiolite clays under temperature scan. The dashed lines
represent the temperature window at which clays are typically subjected during
composites preparation (extrusion and compression moulding).
The water adsorbed on external surfaces and the zeolitic water from the nanoporous
tunnels is removed at relatively low temperatures. The elimination of coordinated,
structural water starts when the zeolitic water is lost and ends when dehydroxylation
begins. Folding of the sepiolite crystals occurs when some structural water has been
removed. This process, reversible for temperature below 350 °C, becomes
irreversible once all the structural water molecules are removed and partial
dehydroxylation has occurred, forming an anhydride form. Finally, the remaining
Mg-OH hydroxyl groups are released at ~850 °C.
116
Page 117
CHAPTER 5 – Sepiolite Nanoclay as a Reinforcement for Polymer Composites
Table 5.2. Weight losses of sepiolite clays.
1st weight loss 2nd weight loss 3rd weight loss 4th weight loss
Amount 10.3 % 3.5 % 2.6 % 3.3 %
Physical
phenomenon
Adsorbed and
zeolitic water
First structural
water
Second structural
water
dehydroxylation
of the Mg-OH
It is important to notice, at this stage, that the temperature range at which the clays
will be subjected to for all the future nanocomposites preparation is between 200 °C
to 260 °C. At these temperatures the dehydration is completely reversible and there
are no structural changes in the sepiolite nanoclay [13].
5.3.4 Mechanical Properties and Nano-Bending Tests
One of the prerequisites for using a nano-filler as a reinforcement for polymeric
materials is the necessity of a good mechanical performance of the filler itself. Direct
experimental observations of the mechanical properties of individual nanoclays are
non trivial due to the difficulties in performing nanometre-scale tests and, to the best
of the author’s knowledge, computer simulations [14] and bulk measurements [15]
are the sole approaches being used so far to estimate such information.
The stiffness of nanoclays is assigned by some authors to be around 170 GPa, relying
on the properties of a perfect mica crystal, whose crystal structure resembles that of
MMT [16, 17]. Theoretical calculations contemplate even higher values [18].
In this section, a direct measurement of the mechanical properties of single sepiolite
nanoclays is performed via scanning probe microscopy (SPM). SPM has been chosen
for these experiments because of the possibility of controlling very accurately the
deflection of a sample, via the z-piezo displacement, as a function of an applied
force. A schematic of the experimental test, which can be described as nano-bending,
in analogy with similar works in the literature [19-24], is presented in Figure 5.7.
117
Page 118
CHAPTER 5 – Sepiolite Nanoclay as a Reinforcement for Polymer Composites
Figure 5.7. Schematic representation of SPM bending test of sepiolite nano-fibres
suspended on porous substrate.
Sepiolite nano-fibres, lying over the substrate pores, are first located using the SPM
in tapping-mode. The SPM cantilever is then brought into contact with the nano-fibre
at the midpoint along its suspended length, the operating mode is switched from
tapping to contact mode and finally a force-deflection (F-D) curve is obtained setting
an appropriate z-piezo scanner range (i.e. 50 nm down and back 200 nm up). An x-y
closed-loop feedback piezo-scanner is employed in order to have an accurate and
reliable positioning of the cantilever.
a) b)
-50 0 50 100 150 200-2.0
-1.8
-1.6
-1.4
-1.2
-1.0
Def
lect
ion
[nA]
Heigth [nm]
Figure 5.8. SPM tests: a) image of a sepiolite nanoclay laying on the substrate and
b) typical force-displacement curve.
118
Page 119
CHAPTER 5 – Sepiolite Nanoclay as a Reinforcement for Polymer Composites
Fig. 5.8 shows the SEM image of sepiolite clays laying on the substrate and a typical
F-D curve relative to the bending test performed on the fibre itself.
The slope of the curve is directly related to the elastic modulus of the nano-clay.
Supposing it is a simply supported beam and behaves within the limits of small
deformation theory
δIFLE48
2
= Equation 5.3
Where F is the force applied, L the free length of the sepiolite, δ the deflection at the
midpoint of the length and I the moment of inertia, which for a circular cross section
is
64
4DI π= Equation 5.4
Where D is the diameter of the cross section. The bending test results of four
different sepiolite fibres are presented in Table 1.
Table 5.3. Results of the nano-bending tests.
Fibre Diameter [nm] Length [nm] Elastic modulus [GPa]
1 50 1155 171
2 50 900 215
3 80 900 166
4 80 900 267
The importance of accurate measurements of the fibres dimensions, in particular of
the cross-section area should be stressed. In fact, small variations in fibre dimensions
give rise to a significant change in the values of stiffness. The values of elastic
moduli reported in Table 5.3 are affected by an uncertainty of about 20 % and more
tests are needed to make the results statistically more solid.
119
Page 120
CHAPTER 5 – Sepiolite Nanoclay as a Reinforcement for Polymer Composites
5.3.5 Micromechanical Models
This chapter has dealt so far with gaining basic knowledge on sepiolite nanoclay
fibres. The motivation was to understand and predict the properties that such
nanofillers can impart to polymer matrices, when forming a nanocomposite.
Traditional micromechanical models can provide substantial understanding toward
this purpose, and in particular the theory of short fibre reinforced composites.
Shear Lag Model
Among the most widely used short fibre composite models is the shear lag model in
which a cylindrical inclusion (fibre), surrounded by a matrix, is oriented parallel to
the external load direction. In such system the tensile stress is transferred from the
matrix to the fibre by interfacial shear stresses, supposing a perfect filler/matrix
interface (Fig. 5.9).
a) b)
Figure 5.9. Schematic illustration of the concept of the shear lag model: a)
unstressed and stressed system and b) variation of the shear stress and strain in the
matrix as a function of the radial position. From [25].
120
Page 121
CHAPTER 5 – Sepiolite Nanoclay as a Reinforcement for Polymer Composites
The variation of the axial stress and the interfacial shear stress along the fibre length,
, can be expressed as [25] x
⎥⎦
⎤⎢⎣
⎡⎟⎠⎞
⎜⎝⎛−= )(sec)/(cosh1 nshrnx
rnxE ff εσ Equation 5.5
and
( )nshr
nxEnfi secsinh
2⎟⎠⎞
⎜⎝⎛=
ετ Equation 5.6
where is the fibre elastic modulus, fE ε is the strain of the matrix (which is
supposed to be equal to the overall strain of the composite), is the axial distance
from the fibre midpoint,
x
r is the fibre radius, is the fibre aspect ratio (L/D) and
is a dimensionless constant given by
s n
⎥⎥⎦
⎤
⎢⎢⎣
⎡
+=
)/1ln()1(2
fEE
nmf
m
ν Equation 5.7
where mν is the Poisson’s ratio of the matrix and is the volume fraction of filler in
the composite. If equations 5.5 and 5.6 are plotted as a function of , it can be
observed that the tensile stress is zero at the fibre ends and assumes a maximum
value in the centre. Vice versa the shear stress at the interface is a maximum at the
ends and zero in the centre. If the fibre is long enough, the tensile stress can build up
until a plateau value,
f
x
plateaufσ , at which the strain in the fibre is equal to the strain in
the matrix and approximately equal to the composite itself (isostrain condition). The
longer the fibre the higher is the fraction of the applied load that the fibre can
withstand. The reinforcing efficiency, instead, decreases as the fibre length is
reduced since the contribution of the parts of the fibre which are not fully loaded (the
121
Page 122
CHAPTER 5 – Sepiolite Nanoclay as a Reinforcement for Polymer Composites
fibre ends) are proportionally more significant. If the fibre is too short the stress
doesn’t build up to the plateau value and it shows a maximum that is smaller than
plateaufσ .
a)
b)
c)
Figure 5.10. Predicted variations in a) fibre tensile stress and c) interfacial shear
stress along the length of a glass fibre (schematically represented in b)), in
polyester/30 % glass fibre composite, subject to an axial tensile strain of 10-3, for
two fibre aspect ratios. Redrawn from [25].
122
Page 123
CHAPTER 5 – Sepiolite Nanoclay as a Reinforcement for Polymer Composites
It comes natural to define a critical length, , which is the minimum length for
which the maximum of tensile stress at the midpoint of the fibre closely approaches
the value of
cL
plateaufσ . This critical length depends on the elastic constants of fibre
and matrix but also from the diameter of the fibre itself, and that is why it is better to
define a critical aspect ratio . It can be demonstrated [25] that the critical aspect
ratio is approximately equal to
cs
nsc
3≈ Equation 5.8
with , defined in Equation 5.7, which becomes bigger when the fibre volume
fraction increases and the ratio of fibre and matrix elastic constants decreases.
n
In figure 5.9, the critical aspect ratios of fibres, of the same elastic constant as
sepiolite, in two polymer matrices (PP and PA6) are plotted as function of the filler
vol.%. For the calculation of the following values have been used: n
fE = 200 GPa; = 1.35 GPa; = 3 GPa; PPmE
6PAmEPPmν = 0.35 and
6PAmν = 0.40.
The dashed horizontal lines in Fig. 5.11 represent the distribution of aspect ratios
measured from TEM micrographs in Section 5.3.1. The average aspect ratio line
( =27) lies above the curve representing the critical aspect ratios for PA6/Sep
composite for different filler vol.%, which guarantees an efficient reinforcement of
sepiolite nanoclay in PA6, according to the shear-lag model. The same is not valid
for softer matrices as PP. In fact the theoretical aspect ratio required for PP/Sep is
always higher than the average sepiolite aspect ratio, in the filler vol.% range
investigated. This means that, in average, the filler will only carry a smaller fraction
of the load applied to the composite. Nonetheless, as seen before (5.3.1), the
distribution of dimensions of the nanofiller is quite broad especially for what
concerns the length, which can assume values up to few microns. Hence, the aspect
cs
123
Page 124
CHAPTER 5 – Sepiolite Nanoclay as a Reinforcement for Polymer Composites
ratio can be over 100. In conclusion, for PP/Sep composite, only the higher end of
the filler aspect ratio distribution is able to efficiently reinforce the polymer matrix.
0 2 4 6 8 100
102030405060708090
100110120130
PA6/Sep
PP/Sep
Crit
ical
asp
ect r
atio
, sc
Filler Vol. [%]
Figure 5.11. Critical aspect ratios as a function of the sepiolite vol.% for two
polymer composites (solid lines). The dashed horizontal lines represent the average
aspect ratio (middle) and the lowest and highest values of the aspect ratio
distribution (bottom and top), measured from TEM micrographs.
Halpin-Tsai Model
Another very popular composite theory is expressed by the Halpin-Tsai equations.
The advantage of such model is the possibility of predicting with a simple expression
all the elastic constants of composite materials as a function of the aspect ratio of the
filler, along, obviously, with the constituent properties and the volume fractions of
the two phases. The model will also be employed to compare the theoretical
reinforcement of fibre-like and platelet-like fillers, in order to relate sepiolite with the
more commonly used smectite clays (i.e. Montmorillonite).
The Halpin-Tsai equation can be written as
124
Page 125
CHAPTER 5 – Sepiolite Nanoclay as a Reinforcement for Polymer Composites
f
f
m
c
EE
ηϕζηϕ−
+=
11
Equation 5.9
where:
⎟⎟⎠
⎞⎜⎜⎝
⎛+
⎟⎟⎠
⎞⎜⎜⎝
⎛−
=
ζη
m
f
m
f
EEEE
1 Equation 5.10
In this formula the following parameters can be identified:
Ec = composite elastic modulus
Em = matrix modulus
Ef = filler modulus
φf = volume fraction of the filler
ζ = shape factor
It should be stressed that the Halpin-Tsai set of equations was initially developed for
(and it is usually used with) fibre reinforced composites. However it can be adapted
to different filler shapes by choosing a suitable shape factor ζ. The parameter ζ can
be found by fitting experimental data. In this study, though, it will be taken from the
scientific literature.
Van Es [16], in his PhD thesis, proposed different shape factors for fibre-like and
platelet-like reinforcements (Table 5.4), by comparing the Halpin-Tsai equation with
the Mori-Tanaka theory. The last assumes spheroidal filler, which can then
intrinsically contemplate different shapes, by changing the dimensions along the
three principal axes.
125
Page 126
CHAPTER 5 – Sepiolite Nanoclay as a Reinforcement for Polymer Composites
Table 5.4. Shape factors ζ, for fibre-like and platelet-like reinforcement, relative to
the elastic moduli E11, E22, E33, along the principal directions 1, 2, 3 as in Fig. 5.12.
From [16].
Fibre Platelet
E11 ζ=(0.5s)1.8 ζ=2/3s
E22 ζ=2 ζ=2/3s
E33 ζ=2 ζ=2
The parameter s, defined already in the previous section, is the aspect ratio of the
filler. It is generally defined as the ratio of the longest and shorter dimension. It will
be then the ratio of the length over the diameter, for fibres, and the ratio of width
over the thickness for platelets. The principal directions 1, 2 and 3 of the composite
are related to ones of the two oriented fillers, are exemplified in Fig. 5.12.
3311
22
Figure 5.12. Principal directions of composites relative to the ones of oriented
fillers.
For unidirectionally oriented material (in the direction of the fibre length or in the
plane of the platelet), it can be stated that
E= E11 Equation 5.11
126
Page 127
CHAPTER 5 – Sepiolite Nanoclay as a Reinforcement for Polymer Composites
The calculation of the moduli of a composite with randomly oriented fillers, instead,
would need the application of orientation-averaging mathematical transformations to
the unidirectional case, which is rather cumbersome to use. However, an
approximated solution, inspired by the laminate theory [25], can instead be used.
For a 2D random isotropic material, the modulus of the composite can be written as
)(625.0)(375.0 //2 ⊥− ⋅+⋅≈ EEE randomD Equation 5.12
For a random 3D isotropic material, according to the shape of the filler, the modulus
of the composite can be written as [16]
)(816.0)(184.0 //3 ⊥−− ⋅+⋅≈ EEE FibrerandomD Equation 5.13
or
)(51.0)(49.0 //3 ⊥−− ⋅+⋅≈ EEE PlateletrandomD Equation 5.14
//E and are the elastic moduli of the composite in the longitudinal direction (for
the fibre is E
⊥E
11 and for the platelet is E11 or E22) and in the transverse direction (E33)
respectively and they coincide with highest and lowest value.
Assuming that the elastic modulus of sepiolite is about 200 GPa (Paragraph 5.3.4),
the elastic modulus of PP and PA6 are respectively 1.3 GPa and 3 GPa and the filler
volume fraction is fixed at 5 vol.%, the plots in figure 5.13 and 5.14 can be
generated. Figure 5.13 compares the reinforcing effect of fibre-like and platelet-like
fillers, unidirectionally oriented and of different aspect ratios, in two polymer
matrices: PP and PA6.
127
Page 128
CHAPTER 5 – Sepiolite Nanoclay as a Reinforcement for Polymer Composites
1 10 100 1000 10000 100000
1
2
3
4
5
6
7
8
9
10
rule of mixtures
rule of mixtures
Fibre Platelet
PA6
PP
E c/E
m
Aspect ratio, s
Figure 5.13. Reinforcement of 5 vol.% of fibre-like and platelet-like filler,
unidirectionally oriented (1D) in two polymer composites. The dashed vertical line
shows the average sepiolite aspect ratio. Arrows show the smallest aspect ratio
necessary to reach theoretical reinforcement (rule of mixtures).
Both fillers, for aspect ratios sufficiently high, have the same ultimate reinforcement,
reaching the same plateau which corresponds to the rule of mixtures (dashed lines).
The plateau relative to PP based composites is higher than the one relative to PA6
based composites for the simple reason that for the same filler the reinforcing effect
is proportionally more for a softer matrix than for a stiffer matrix (PP has lower
elastic modulus than PA6).
An interesting feature lies in the difference between the two filler shapes for the
same matrix. Fibre-like fillers approach maximum reinforcement already for aspect
ratios of 100, while platelet-like fillers need aspect ratios higher than 2000. It can be
concluded then that, in the unidirectional case, fibres are more effective than
128
Page 129
CHAPTER 5 – Sepiolite Nanoclay as a Reinforcement for Polymer Composites
platelets. This is however different for the situation of randomly distributed fillers
(Fig. 5.12).
1 10 100 1000 10000 100000
1.0
1.5
2.0
2.5
3.0
3.5
4.0
4.5
5.0
Fibre Platelet
E c/Em
Aspect ratio, s
Figure 5.14. Reinforcement of 5 vol.% of 3D randomly oriented fibre-like and
platelet-like fillers in PP matrix. The dashed line shows the average sepiolite aspect
ratio. Arrows show the smallest aspect ratio necessary to reach theoretical
reinforcement (rule of mixtures).
Figure 5.14 shows the reinforcement of 3D randomly oriented fibre-like and platelet-
like fillers, of different aspect ratios, in PP matrix. The observation that fibre fillers
reach the maximum reinforcement for aspect ratios much smaller than those
necessary in the case of platelet filler still holds. This effect is also more prominent
since randomly distributed platelets need an aspect ratio of 10000. However the
plateau relative to platelet fillers is twice as high as for fibres filler. It can therefore
be concluded that, in the case of randomly oriented filler, platelets are more effective
than fibres.
129
Page 130
CHAPTER 5 – Sepiolite Nanoclay as a Reinforcement for Polymer Composites
5.4 Conclusions
This chapter gives an overview of some important properties of sepiolite, the filler
which will be used throughout the rest of this thesis. Sepiolite clay is shown to be
composed of elementary particles, which peculiar shape resembles that of rigid
needles. Average dimensions are 650 nm in length and 24 nm in diameter, with a
mean aspect ratio (L/D) of 27, but ranging between 10 and 130. The specific surface
area of such clay reaches 300 m2g-1, which is partially due to the internal porosity
created by channels running through the entire length of the nano-needle. Sepiolite
has high adsorptive capacity and a particular great affinity to water molecules.
Adsorbed water normally accounts for 10-15 % of the total weight of the clay. Upon
heating to temperatures of about 300 °C, such water can be reversibly desorbed. At
temperatures higher than 350 °C, instead, also the structural water is removed and
sepiolite undergoes irreversible dehydroxylation and crystal folding. For the first
time in literature, the mechanical properties of nanoclays have been evaluated via
nano-bending tests on individual sepiolite particles. The elastic modulus of sepiolite
was found to be about 200 GPa. Finally the reinforcement of sepiolite, in two
thermoplastic matrices (PP and PA6), is predicted by means of the shear-lag model
and the Halpin-Tsai equations. Sepiolite was also compared with more frequently
used smectite clays (i.e. montmorillonite), which showed that sepiolite is expected to
give a more effective reinforcement in unidirectionally oriented composites. Vice
versa platelet-like clays should provide a higher reinforcement in the case of 3D
random composites.
5.5 References
1. J.C.A. Van der Werf, Monodisperse Holographic Membranes, in Chemistry
and Chemical Engineering. 2006, Eindhoven Technical University: Eindhoven,
The Netherlands.
130
Page 131
CHAPTER 5 – Sepiolite Nanoclay as a Reinforcement for Polymer Composites
2. S. Brunauer, P.H. Emmett, and E. Teller, Absorption of gases and
multimolecular layers. Journal of Americal Chemical Society, 1938. 60: p. 309.
3. H.J. Butt, K. Graf, and M. Kappl, Physics and Chemistry of Interfaces. 2003,
Weinheim: Wiley-VCH.
4. A.J. Aznar, E. Gutierrez, P. Diaz, A. Alvarez, and G. Poncelet, Silica from
sepiolite: Preparation, textural properties, and use as support to catalysts.
Microporous Materials, 1996. 6(2): p. 105-114.
5. M. Radojevic, V. Jovic, and D. Vitorovic, Study of sepiolite from Goles
(Kosovo, Yugoslavia). I. Sorption capacity. Journal of the Serbian Chemical
Society, 2002. 67(7): p. 489-497.
6. J.L. Bonilla, J.D.D. Lopezgonzalez, A. Ramirezsaenz, F. Rodriguezreinoso,
and C. Valenzuelacalahorro, Activation of a Sepiolite with Dilute-Solutions of
Hno3 and Subsequent Heat-Treatments .2. Determination of Surface Acid
Centers. Clay Minerals, 1981. 16(2): p. 173-179.
7. J.D.L. Gonzalez, A.R. Saenz, F.R. Reinoso, C.V. Calahorro, and L.Z. Herrera,
Activation of a Sepiolite with Diluted Hno3 Solutions Followed by Thermic
Treatment - Study of the Specific Surface. Clay Minerals, 1981. 16(1): p. 103-
113.
8. P. Praus, M. Turicova, S. Studentova, and M. Rits, Study of
cetyltrimethylammonium and cetylpyridinium adsorption on montmorillonite.
Journal of Colloid and Interface Science, 2006. 304: p. 29-36.
9. S. Miao, Z. Liu, B. Han, H. Yang, Z. Miao, and Z. Sun, Synthesis and
characterization of ZnS-montmorillonite nanocomposites and their application
for degrading eosin B. Journal of Colloid and Interface Science, 2006. 301: p.
116–122.
10. K. Boukerma, J.Y. Piquemal, M.M. Chehimi, M. Mravčáková, M. Omastová,
and P. Beaunier, Synthesis and interfacial properties of
montmorillonite/polypyrrole nanocomposites Polymer, 2006. 47(2): p. 569-576.
11. B. Chen and J.R.G. Evans, Preferential intercalation of clay in polymer-clay
nanocomposites. Journal of Physical Chemistry B, 2004. 108: p. 14986-14990.
131
Page 132
CHAPTER 5 – Sepiolite Nanoclay as a Reinforcement for Polymer Composites
12. W.X. Kuang, G.A. Facey, and C. Detellier, Dehydration and rehydration of
palygorskite and the influence of water on the nanopores. Clays and Clay
Minerals, 2004. 52(5): p. 635-642.
13. E. Galan, Properties and applications of palygorskite-sepiolite clays. Clay
Minerals, 1996. 31(4): p. 443-453.
14. S. Grigoras, A.A. Gusev, S. Santos, and U.W. Suter, Evaluation of the elastic
constants of nanoparticles from atomistic simulations. Polymer, 2002. 43(2): p.
489-494.
15. A. Kelly, Strong Solids. 1973, Oxford: Clarendon Press.
16. M. Van Es, Polymer-Clay nanocomposites-the importance of particle
dimensions. 2001, TU Delft: Delft.
17. D. Shia, C.Y. Hui, S.D. Burnside, and E.P. Giannelis, An interface model for
the prediction of Young's modulus of layered silicate-elastomer
nanocomposites. Polymer Composites, 1998. 19(5): p. 608-617.
18. O.L. Manevitch and G.C. Rutledge, Elastic properties of a single lamella of
montmorillonite by molecular dynamics simulation. Journal of Physical
Chemistry B, 2004. 108(4): p. 1428-1435.
19. A.H. Barber, S.R. Cohen, and H.D. Wagner, Measurement of carbon nanotube-
polymer interfacial strength. Applied Physics Letters, 2003. 82(23): p. 4140-
4142.
20. A.H. Barber, S.R. Cohen, A. Eitan, L.S. Schadler, and H.D. Wagner, Fracture
transitions at a carbon-nanotube/polymer interface. Advanced Materials, 2006.
18(1): p. 83-87.
21. Q.H. Xiong, N. Duarte, S. Tadigadapa, and P.C. Eklund, Force-deflection
spectroscopy: A new method to determine the Young's modulus of
nanofilaments. Nano Letters, 2006. 6(9): p. 1904-1909.
22. E.W. Wong, P.E. Sheehan, and C.M. Lieber, Nanobeam mechanics: Elasticity,
strength, and toughness of nanorods and nanotubes. Science, 1997. 277(5334):
p. 1971-1975.
23. J.P. Salvetat, A.J. Kulik, J.M. Bonard, G.A.D. Briggs, T. Stockli, K. Metenier,
S. Bonnamy, F. Beguin, N.A. Burnham, and L. Forro, Elastic modulus of
132
Page 133
CHAPTER 5 – Sepiolite Nanoclay as a Reinforcement for Polymer Composites
ordered and disordered multiwalled carbon nanotubes. Advanced Materials,
1999. 11(2): p. 161-165.
24. J.P. Salvetat, G.A.D. Briggs, J.M. Bonard, R.R. Bacsa, A.J. Kulik, T. Stockli,
N.A. Burnham, and L. Forro, Elastic and shear moduli of single-walled carbon
nanotube ropes. Physical Review Letters, 1999. 82(5): p. 944-947.
25. D. Hull and T.W. Clyne, An introduction to composite materials. Second ed.
1996, Cambridge: Cambridge University Press.
133
Page 134
6 Polypropylene / Sepiolite
Nanocomposites
6.1 Introduction
Polypropylene/sepiolite nanocomposites were prepared by melt compounding in a
mini-extruder apparatus. The dispersion of sepiolite in PP has been improved either
by the use of surface modification of the clay (silanisation) or by use of
functionalised polymers. The often used maleic anhydride modified polypropylene
(PP-g-MA) is compared with a custom-made functionalised polymer, PP-acid, in
respect to the filler dispersion and filler reinforcement efficiency. For that purpose,
morphological and mechanical studies are carried out by means of SEM, TEM and
mechanical tensile tests. In addition, the nanocomposites are characterised by WAXS
and DSC techniques in order to assess the effect of the nanofiller on the crystalline
structure of the PP matrix. The use of PP-PEO and the clay surface modification
resulted in a better nanofiller dispersion compared to traditional PP-g-MA modified
systems. Sepiolite acts as nucleating agent for the crystallisation of PP and seems to
lead to an orientation of the α-phase crystals.
134
Page 135
CHAPTER 6 – PP / Sepiolite Nanocomposites
6.2 Experimental
6.2.1 Materials
The i-PP used was Moplen® HP500H with melt flow index MFI 1.8 g/10min (at 230
°C/2.16 Kg). The pristine sepiolite Pangel® were supplied by Tolsa (Spain), and
used as received or surface modified with alkyl-silane at TNO (The Netherland). The
two fillers above will be referred to as Sep and Sep-sil, respectively, in the
proceedings of this chapter. The PP-g-MA used is a commercial grade VINBOND®
P series (VB100; 1% grafted MA; MFI 6.0 g/min at 230 °C/2.16 Kg; Mw=151
kg/mol) from Vin Enterprise Ltd. PP-acid is a customer-made product from Baker
Petrolite. This is a carboxylic acid terminated PP, of Mn=1200 gmol-1 and with an
acid number of 30.
6.2.2 Nanocomposites Preparation
Nanocomposites were prepared by a two-steps blending process in a mini twin-screw
extruder DSM Micro 15 at 200 °C for 10 min at 200 rpm. First, sepiolite clays (Sep
or Sep-sil) were mixed with the functionalised polymer (1:1 weight ratio) and/or PP
homopolymer to make a masterbatch at 10 wt.% of filler, which was subsequently
diluted with neat PP homopolymer to obtain nanofiller concentrations of 1 wt.%, 2.5
wt.% and 5 wt.%. The composition of materials studied is listed in Table 6.1.
135
Page 136
CHAPTER 6 – PP / Sepiolite Nanocomposites
Table 6.1. Compositions of PP/sepiolite nanocomposites.
Sepiolite
(Sep or Sep-sil)
wt. [%]
PP-acid
wt. [%]
PP-g-MA
wt. [%]
PP+1%Sep 1 - -
PP+2.5%Sep 2.5 - -
PP+5%Sep 5 - -
PP+PP-acid+1%Sep 1 1 -
PP+PP-acid+2.5%Sep 2.5 2.5 -
PP+PP-acid+5%Sep 5 5 -
PP+PP-g-MA+1%Sep 1 - 1
PP+PP-g-MA+2.5%Sep 2.5 - 2.5
PP+PP-g-MA+5%Sep 5 - 5
PP+1%Sep-sil 1 - -
PP+2.5%Sep-sil 2.5 - -
PP+5%Sep-sil 5 - -
6.2.3 Nanocomposites Characterisation
Morphological Analysis
Morphological studies were carried out using Scanning Electron Microscopy (SEM)
analysis (Jeol JSM-6300F) on gold-coated, cold fractured surfaces and Transmission
Electron Microscopy (TEM) analysis (Jeol JEM 2010 TEM) on ultra-thin samples
obtained by a microtome.
X-ray
Wide Angle X-ray Scattering (WAXS) spectra were recorded with a Siemens
Diffractometer D5000, where the X-ray beam was Ni-filtered CuKα (λ=1.5405 Ǻ)
and radiation operated at 40 kV with a filament current of 40 mA. Corresponding
136
Page 137
CHAPTER 6 – PP / Sepiolite Nanocomposites
data were collected from 5 to 30 ° at a scanning rate of 0.01 °/min. The samples
analyzed were films of thickness 100 µm, hot pressed at 220 °C for 10 min.
DSC
Non-isothermal crystallization analyses were performed with a Differential Scanning
Calorimeter (DSC) TA Q1000. All samples (2.0±0.1 mg) were firstly heated to 220
°C and kept at that temperature for 5 min to remove any thermal history and then
cooled at a rate of 10 K/min.
Tensile Tests
Tensile tests were conducted in a universal testing machine (Instron 5584), equipped
with a 1 kN load cell, standard grips and Merlin software, according to the standard
ASTM D-638. The test specimens were dog-bone shaped with a length of 60 mm and
a thickness of 1 mm, according to the type V dimensions indicated by the same
standard. Specimens were obtained by compression moulding at 220 °C for 10min.
Rheology
The rheology measurements were performed on a controlled strain rheometer
(Advanced Rheometer, AR 2000) equipped with an environmental chamber and
parallel plates geometry (25 mm diameter). The specimens were disk-shaped (1.5
mm thickness and 25 mm diameter) and were tested at 200 °C. The measurements
were conducted over a frequency range of 0.01–100 Hz at the shear strain of 0.5 %,
within the linear viscoelastic region.
TGA
The thermal stability of PP/sepiolite nanocomposites was estimated by thermo
gravimetric analysis on a TA Q500. About 10 mg of sample was cut off from tensile
test specimens and tested both in air and nitrogen atmosphere. After equilibration at
30 °C, the samples were heated up to 1000 °C at a rate of 20 K/min.
137
Page 138
CHAPTER 6 – PP / Sepiolite Nanocomposites
6.3 Results and Discussion
6.3.1 Morphological Analysis
The dispersion of the nanofiller in the polymer matrix is a crucial aspect for the
performances of nanocomposites. SEM pictures of cold fractured surfaces of
different nanocomposite systems are shown in Fig. 6.1 and will be discussed in
particular concerning the influence of the different functionalised polymers and filler
surface modification on the sepiolite dispersion. Fig. 6.1.a shows a micrograph of
PP+Sep nanocomposite with filler concentration of 2.5 wt.%. The system is
characterised by micrometer sized clusters of sepiolite which will act as inclusions in
a nearly filler-free polymeric matrix. Only minor improvements in dispersion can be
observed in case PP-g-MA is employed as surface-active polymer (Fig. 6.1.b).
Sepiolite nanofibres are again mainly found in the form of clusters, which are
inhomogeneously distributed within the polymer matrix. Instead the morphology of
nanocomposites shown in Fig. 6.1.c appears significantly different. In this system the
use of PP-PEO leads to much finer filler dispersion in the polymeric matrix, where
aggregates of sepiolite are no longer evident. The silane coated sepiolite (Sep-sil),
without the use of any functionalised polymers in the blend, shows an intermediate
behaviour. Sep-sil at low filler content (1 wt.%) can be nicely dispersed in PP (Fig.
6.1.d), while at concentration of 5 wt.% is already found agglomerated.
138
Page 139
CHAPTER 6 – PP / Sepiolite Nanocomposites
a) b)
c) d)
e)
Figure 6.1. SEM micrographs of: a) PP+2.5%Sep; b) PP+PP-g-MA+2.5%Sep; c)
PP+PP-acid+2.5%Sep; d) PP+1%Sep-sil and e) PP+5%Sep-sil. White circles
underline sepiolite clusters. A significant improvement in the dispersion of sepiolite
in PP matrix is evident with the use of PP-PEO and Sep-sil, where no agglomerates
of nanoclay are found in nanocomposites at 2.5 wt.% filler load.
The morphology of the nanocomposites has also been investigated by TEM. This
analysis, besides confirming the SEM observations, underlines a characteristic
139
Page 140
CHAPTER 6 – PP / Sepiolite Nanocomposites
fracturing of the sepiolite fibres as a consequence of the mechanical stress during the
compounding process.
a) b)
Figure 6.2. TEM picture of: a) sepiolite dispersion on TEM grids b) sepiolite in PP
matrix after compounding. A reduction in fibre length is evident in the processed
nanocomposites as a consequence of melt blending in mini-extruder.
As can be seen in Fig. 6.2.a-b, a reduction of fibre length is evident in the processed
nanocomposites compared with the original sepiolite. The length of the fibres is
reduced although a quantification of such reduction is difficult to make. In fact
Fig.6.2.a is a 2D picture (sepiolite dispersed on TEM grids) and shows the real
dimensions, while Fig.6.2.b is a slice of a 3D composite in which sepiolite fibres are
randomly distributed in all directions and therefore the length observed is only a
projection on the plane of the microtome cut.
6.3.2 Crystal Structure and Crystallisation Behaviour
Figures 6.3.a-d show the WAXS patterns of sepiolite, PP and nanocomposites at
different filler concentrations. We can see that the sepiolite spectra has a prominent
peak at 2θ=7.2° which corresponds to the primary diffraction of the (100) crystalline
plane. The pattern of pure PP shows five main peaks, in the 2θ range of 10-30°,
140
Page 141
CHAPTER 6 – PP / Sepiolite Nanocomposites
characteristic of the monoclinic α-form [1]. For PP+Sep nanocomposites (Fig. 6.3.a)
we can observe that, except the reflection at 2θ=7.2°, enhanced for higher filler
content, which is typical of sepiolite, the same peaks of pure polymer are observed,
suggesting that mainly α-form is present. In particular there is no evidence of
reflections at 2θ=16°, which corresponds to the (300) plane of the β-phase, and at
2θ=20.3° corresponding to the characteristic (117) plane of the γ–phase.
5 10 15 20 25 30
a) PP+Sep
5%
2.5%
1%
PP
Sep
Inte
nsity
2 θ
5 10 15 20 25 30
b)
5%
2.5%
1%
PP
Sep
PP+PP-g-MA+Sep
Inte
nsity
2 θ
5 10 15 20 25 30
c) PP+PP-acid+Sep
5%
2.5%
1%
PP
Sep
Inte
nsity
2 θ
5 10 15 20 25 30
d) PP+Sep-sil
5%
2.5%
1%
PP
Sep
Inte
nsity
2 θ
Figure 6.3. X-ray diffraction spectra of: a) PP+Sep; b) PP+PP-g-MA+Sep; c)
PP+PP-acid+Sep; d) PP+Sep-sil nanocomposites at different concentrations of
filler, compared with virgin PP and pure sepiolite.
An interesting feature lies in the relative intensities of α-phase reflections. The
intensity of the peak at 2θ=17°, which corresponds to the (040) plane of α-phase,
141
Page 142
CHAPTER 6 – PP / Sepiolite Nanocomposites
increases with filler concentration while the peak at 2θ=14°, corresponding to the
(110) plane of α-phase, decreases. This can indicate a preferential orientation of PP
crystals induced by the nanofiller, with (040) planes parallel to the specimen surface
and the b-axes perpendicular to it [2-4]. Such phenomenon is ascribed to an epitaxial
growth of PP crystals from sepiolite surfaces. It is stressed here that such crystal
orientation relative to the sample is a direct consequence of a preferential orientation
of sepiolite nanoclay itself in the specimen. In the thin-film nanocomposite samples,
sepiolite is believed to be oriented in-plane with the film (see Paragraph 8.3.3). The
same conclusion may be drawn for the system PP+PP-g-MA+Sep in Fig. 6.3.b. A
different situation instead is observed with PP-acid or when Sep-sil is used instead
(Fig. 6.3c-d), with no evidence of a similar orientation enhanced by the nanofiller.
The DSC traces presented in Fig. 6.4 clearly show an increase of the crystallisation
temperature (Tc), implying that the sepiolite acts as a nucleating agent for the
crystallisation of polypropylene, but with significant differences for different
systems.
100 110 120 130 140
a)10%Sep
5%Sep
2.5%Sep
1%Sep
PP
Hea
t Flo
w [W
/g]
Temperature [°C]
100 110 120 130 140
b)10%Sep
5%Sep
2.5%Sep
1%Sep
PP
H
eat F
low
[W/g
]
Temperature [°C]
Figure 6.4. DSC traces corresponding to the non-isothermal crystallisation of a)
PP+PP-g-MA+Sep, b) PP+PP-acid+Sep at different filler content. The exothermic
peaks shift towards higher temperature as a result of the filler nucleating effect.
As can be also seen from Fig. 6.5, the systems with a poor distribution of the nano-
fibres (PP+Sep and PP+PP-g-MA+Sep) show the largest and continuous increase in
the crystallisation temperature while the systems with well dispersed sepiolite show
142
Page 143
CHAPTER 6 – PP / Sepiolite Nanocomposites
only a small effect and a limiting concentration of crystallisation nuclei is reached at
little sepiolite content after which no significant changes in Tc are observed.
From both WAXS and DSC experiments, it was observed so far in the paragraph that
there is a substantial difference in crystallisation activity between the systems that
present a good dispersion of sepiolite in PP and those characterised by agglomeration
of the filler.
0 2 4 6 8 10
110
115
120
125
130
135
PP+Sep PP+PP-g-MA+Sep PP+PP-acid+Sep PP+Sep-sil
T c ons
et [C
]
Filler [wt%]
Figure 6.5. Onset Temperatures of starting crystallisation in function of the filler
concentration for: ■ PP+Sep; ○ PP+PP-g-MA+Sep; PP+PP-acid+Sep;
PP+Sep-sil. A larger and continuous increase in the crystallisation temperature is
observed for PP+Sep and PP+PP-g-MA+Sep while a limiting concentration of
crystallisation nuclei is reached at 1 wt.% of filler for PP+PP-acid+Sep and
PP+Sep-sil.
According to some literature [5-7] any filler, including sepiolite, can nucleate PP on
its surface or at the connecting lines of two particles. In this case, the decrease of
nucleating efficiency coupled with a better dispersion of the particles seems to be a
143
Page 144
CHAPTER 6 – PP / Sepiolite Nanocomposites
strong indication for the second mechanism, i.e. that aggregates are the predominant
nucleating sites. But the sepiolite nucleation can be explained more simply by the
surface nature of the nanofiller and by the modification of its surface energy in
presence of a compatibiliser. Fillers have high-energy surfaces and can adsorb the
polymer preferentially along their crystal structure, acting as heterogeneous nuclei
for polymer crystals. When the filler surface is covered by an organic substance, the
surface free energy is decreased. This results, on one hand, in a reduction of
sepiolite-sepiolite inter-particle attraction and hence in a better nanoclay dispersion
but, on the other hand, on a reduced nucleating efficiency. This effect depends
specifically from the organic substance covering the inorganic surface. The two
functionalised polymers used in this chapter are then expected to be adsorbed on the
sepiolite in a peculiar way and influence differently the polymer nucleation. For
instance, PP-g-MA has comparably a low degree of functionalisation and the
molecular weight of the PP block in PP-g-MA is much higher than in the case of PP-
acid accounting for a weaker tendency to segregate to the filler surface. The
difference with Sep-sil is even more striking since in this case the alkyl-silane
coating is partially covalently bonded on the sepiolite surface.
Summarising, sepiolite nanoclay acts as an efficient nucleating agent for PP, which
affect both the onset of crystallisation temperature (PP starts crystallising at lower
temperatures) and the epitaxial crystal growth of PP on the sepiolite surface. The two
phenomena are closely connected and the last is the consequence of the former since
if there is heterogeneous nucleation of PP induced by the nanoclay this seems to
develop with an epitaxial growth of PP crystals on sepiolite surface. Moreover it was
demonstrated that such crystallisation activity can be altered by changing the surface
energy of the clay (i.e. by organo-modifying the clay surface), which has direct
impact on the sepiolite dispersability in PP.
144
Page 145
CHAPTER 6 – PP / Sepiolite Nanocomposites
6.3.3 Rheological Behaviour
The rheology of particulate suspensions in a polymer melt is governed by factors
such as the structure, size, shape and orientation distribution of the dispersed phase
but also the strength of interaction with the dispersant phase. Understanding the
rheological properties of polymer/clay nanocomposites is crucial in gaining insights
into the processability of these materials. Rheometry can be also a powerful tool for
investigating the nanocomposite morphology and how this relates to the final
properties. The rheological properties of PP/Sep-sil nanocomposites, with varying
loadings of the fibrous clay, are presented in this section (Fig. 6.6-8).
0.01 0.1 1 10 100
100
101
102
103
104
105
Frequency [Hz]
G' [
Pa]
100
101
102
103
104
105
G''
[Pa]
Figure 6.6. Frequency sweep test on polypropylene at 200°C.
At the temperature of 200 °C and the frequency range of 10-2-102 Hz, PP exhibits
(Fig. 6.6) the usual behaviour of homopolymer melts with low Mw distribution (i.e.
G’∝ω2 and G’’ ω). The crossover of the curves G’ and G’’ separates a liquid-like
behaviour at low frequencies from a solid-like behaviour at high frequencies. The
complex viscosity (Fig. 6.7) and the storage modulus (Fig. 6.8) increase, as expected,
with the addition of sepiolite clay.
∝
145
Page 146
CHAPTER 6 – PP / Sepiolite Nanocomposites
0.01 0.1 1 10 100
103
104
105
Com
plex
Vis
cosi
ty [P
a·s]
Frequency [Hz]
PP PP+1% Sep-sil PP+2.5% Sep-sil PP+5% Sep-sil PP+10% Sep-sil
Figure 6.7. Complex viscosity of PP/Sep-sil nanocomposites as a function of the clay
loading.
The increase relative to the virgin polymer, though, is much higher at low
frequencies, while it completely converges at high frequencies, for concentrations as
high as 2.5 wt.%. The zero-shear viscosity plateau (Fig. 6.7) shifts towards lower
frequency regions until it disappears, in the frequency range scanned, for filler
loadings of 10 wt.%. All the nanocomposites display significantly reduced frequency
dependence of the storage modulus, G’. The terminal slope of G’ rapidly decreases
as the clay loading increases and the nanocomposite filled with 10 wt.% of sepiolite
shows almost a plateau at low frequency range (Fig. 6.8), which is characteristic of
materials with solid-like behaviour (G’, G’’∝ω0). This can be explained if it is
assumed that the clay content has reached a threshold value to form a percolated clay
network [8], in which the sepiolite are incapable of freely rotating or moving. In this
case the mobility and relaxation of polymer chains would be seriously retarded in the
conned space created by the needle-like nanoclay. Such a percolation threshold is
then (Fig. 6.7-8) between 5 wt.% and 10 wt.% of filler. Although the calculation of
146
Page 147
CHAPTER 6 – PP / Sepiolite Nanocomposites
an accurate percolation threshold would require more experimental data (in particular
above the percolation) to be fitted with a suitable percolation theory, the range of
values given (5-10 wt.%) is compatible with the one predicted by Sheng et al. [8]. In
fact a weight fraction of 3-4 wt.% of attapulgite sticks, of aspect ratio 30-40, was
predicted to induce a percolating network. The slightly higher value observed for
sepiolite can be explained by the lower aspect ratio (average: s=27): in fact the
percolation threshold is generally inversely proportional to the aspect ratio.
0.01 0.1 1 10 100100
101
102
103
104
105
106
G' [
Pa]
Frequency [Hz]
PP PP+1% Sep-sil PP+2.5% Sep-sil PP+5% Sep-sil PP+10% Sep-sil
Figure 6.8. Storage modulus of PP/Sep-sil nanocomposites as a function of the clay
loading.
6.3.4 Thermal Behaviour
The effect of different amounts of sepiolite on the thermal degradation of PP was
evaluated by TGA, performed both in inert atmosphere (N2) and in air. The results, in
accordance with recent publications [9-13], are presented in Fig. 6.9-10. In nitrogen
(Fig. 6.9), the degradation of PP is favoured at lower temperatures by the presence of
147
Page 148
CHAPTER 6 – PP / Sepiolite Nanocomposites
filler, except than at the very early stages of the heating process. The interpretation of
this phenomenon is commonly a catalytic effect of the sepiolite on the pyrolysis of
PP. The beneficial effect at the beginning of the degradation is probably due to
adsorption of PP volatile products by the microporous clay.
200 300 400 500 600
0
1
2
3
4
0
20
40
60
80
100
466 °C
479 °C
Der
ivat
ive
Mas
s [%
/°C]
Temperature [°C]
Mas
s [%
]
PP PP+1% Sep-sil PP+2.5% Sep-sil PP+5% Sep-sil PP+10% Sep-sil
Figure 6.9. TGA of PP and PP+Sep-sil nanocomposites with different amounts of
nanoclays, in N2.
However, in oxidative atmosphere the thermal degradation of PP is substantially
retarded by the presence of sepiolite and the effect is more evident for increasing
loadings of the nano-filler, up to 5 wt.% (Fig. 6.10).
148
Page 149
CHAPTER 6 – PP / Sepiolite Nanocomposites
0
20
40
60
80
100
200 300 400 500 600
0.0
0.3
0.6
0.9
1.2
1.5
1.8
Mas
s [%
]
PP PP+1% Sep-sil PP+2.5% Sep-sil PP+5% Sep-sil PP+10% Sep-sil
459 °C
399 °C
Der
ivat
ive
Mas
s [%
/°C]
Temperature [°C]
Figure 6.10. TGA of PP and PP+Sep-sil nanocomposites with different amounts of
nanoclays, in air.
The onset temperature of starting degradation is very similar among different
samples, while the temperature relative to the maximum degradation rate (peak of the
derivative of mass loss: Tmax) of PP/sepiolite nanocomposite, with 5 wt.% of filler, is
increased by 60 °C compared with the pure polymer. This can be explained, in
analogy with platelet-like nanoclays [14], with a barrier effect induced by the
sepiolite to the diffusion of oxygen. As the decomposition and volatilisation of PP
proceeds, the condensed phase is progressively enriched in inorganic phase,
149
Page 150
CHAPTER 6 – PP / Sepiolite Nanocomposites
preventing further diffusion of oxygen and thus retarding the degradation. The
previous explanation is strengthened by the fact that the Tmax in air of the PP/sepiolite
nanocomposite with 5 wt.% of filler is very close to the Tmax in inert atmosphere,
while these values differ by 80 °C for pure PP. In other words, the degradation
process of PP/sepiolite nanocomposites in oxidative atmosphere is shifted towards
degradation in inert atmosphere, because of the shielding effect induced by the
sepiolite.
6.3.5 Mechanical Properties
The mechanical behaviour of the different nanocomposites is displayed in Fig. 6.11-
12 by representative stress-strain curves.
0.0 0.1 0.2 2 4 6 8 10
0
10
20
30
40
PP PP+1% Sep PP+PP-g-MA+1% Sep PP+PP-acid+1% Sep PP+1% Sep-sil
Stre
ss [M
Pa]
Strain
Figure 6.11. Stress-strain curves of different nanocomposites with 1 wt.% of sepiolite.
150
Page 151
CHAPTER 6 – PP / Sepiolite Nanocomposites
0.0 0.2 2 4 6 8 10
0
10
20
30
40
PP PP+5% Sep PP+PP-g-MA+5% Sep PP+PP-acid+5% Sep PP+5% Sep-sil
Stre
ss [M
Pa]
Strain
Figure 6.12. Stress-strain curves of different nanocomposites with 5 wt.% of sepiolite.
As expected, an increase in Young’s modulus is observed for all nanocomposite
systems investigated (Fig. 6.13).
0 1 2 3 4 5 61300
1400
1500
1600
1700
1800
1900
2000
2100
2200
2300
PP+Sep PP+PP-g-MA+Sep PP+PP-acid+Sep PP+Sep-sil
Youn
g's
Mod
ulus
[MPa
]
Filler wt. [%]
Figure 6.13. Young’s modulus of PP nanocomposites at different filler loadings.
151
Page 152
CHAPTER 6 – PP / Sepiolite Nanocomposites
Analogously, an enhancement in yield stress can be noticed in Fig. 6.14, with the
better performance for PP/Sep-sil nanocomposites.
0 1 2 3 4 5 627
28
29
30
31
32
33
34
35
36
37
PP+Sep PP+PP-g-MA+Sep PP+PP-acid+Sep PP+Sep-sil
Yiel
d St
ress
[MPa
]
Filler wt. [%]
Figure 6.14. Yield stress of PP nanocomposites at different filler loadings.
More interesting is the comparison of the strain at break for the different systems, as
shown in Fig. 6.15. While nanocomposites without pristine clay or with PP-g-MA
are dramatically embrittled at sepiolite concentrations as low as 2.5 wt.%, the use of
PP-acid and Sep-sil preserves the ductile nature of the polymer matrix, that undergo
yielding with necking stabilization and cold drawing even at filler concentrations
above 5 wt.%.
From the tensile tests presented in this paragraph, it appears that the nanocomposites
made by alkyl-silane functionalised sepiolite give the best mechanical performances,
in particular for what concern the yield stress.
152
Page 153
CHAPTER 6 – PP / Sepiolite Nanocomposites
0 1 2 3 4 5 6
0
200
400
600
800
1000 PP+Sep PP+PP-g-MA+Sep PP+PP-acid+Sep PP+Sep-sil
Stra
in a
t bre
ak [%
]
Filler wt. [%]
Figure 6.15. Strain at break of PP nanocomposites at different filler loadings. While
nanocomposites with pristine clay and with PP-g-MA undergo a clear embrittlement,
the use of PP-acid and Sep-sil preserves ductility even at filler concentrations above
5 wt.%.
6.3.6 Micromechanical Models
The results of the tensile tests, relative to PP/Sep-sil and PP/PP-acid/Sep
nanocomposites, shown in the paragraph before will be benchmarked with relevant
results from the scientific literature and interpreted in terms of the micromechanical
models of Halpin-Tsai and Pukanszky, for what concerns, respectively, the Young’s
modulus and yield stress.
Table 6.2 gives some comparative information about PP/clay nanocomposites
reported in the literature, among the most cited and influential in the field [15-17]. In
particular there are two sets of data relative to synthetic hectorite nanocomposites
modified with protonated primary hexadecyl amines. They differ in the use of PP-
MA as a compatibiliser with the PP matrix [15]. Other two sets of data from more
recent publications [16, 17] on PP/MMT nanocomposites are also included.
153
Page 154
CHAPTER 6 – PP / Sepiolite Nanocomposites
Table 6.2. Relevant PP/smectite clay nanocomposites reported in the literature.
Clay Compatibiliser Sample Preparation Ref
Type Treatment Type wt. [%]
ME1 C162 - - Injection Moulding [15]
ME C16 PP-MA3 20 Injection Moulding [15]
MMT DMDHTA5 PP-MA4 15 Compression Moulding [16]
MMT CPCl6 PP-MA7 20 Compression Moulding [17] 1 Synthetic hectorite (Somasif® ME100). 2 Protonated primary hexadecyl amine. 3 Hostaprime® HC5, from Hoechst AG (MA content 4.2 wt.%, Mn=4000, Mw/Mn=8). 4 From Homan Chemical Co (Korea) (Mw=59000, Mw/Mn=2.3). 5 Dimethyl dehydrogenated tallow ammonium anions. 6 N-cetyl pyridinium chloride. 7 Lycomont AR 504, from Clariant GmbH (MA content 3.5 wt.%, Mw=24000).
Young’s Modulus
The Halpin-Tsai equations, already introduced in Chapter 5, are used to interpret the
enhancement in stiffness of the PP nanocomposites with the clay content. The values
of Young’s moduli for the different set of data taken from the literature and from this
thesis are presented Figure 6.16.
It can be noticed that the Young’s modulus increases in a linear fashion, for filler
contents higher than a minimum value. The unfilled matrix, instead, often shows a
stiffness value which is incongruent with the rest of the data points. This can be
explained by an effect of polymer matrix modification (i.e. enhanced crystallinity or
change in crystal phase) induced by minute amounts of clays. In these cases, for
modelling purposes, the modulus of the matrix (E0) is extrapolated from a linear fit
of the data of composites with different filler content.
154
Page 155
CHAPTER 6 – PP / Sepiolite Nanocomposites
0 2 4 6 8 10
1500
2000
2500
3000
3500 PP+Sep-sil PP+PP-g-MA+Sep PP+C16-ME [15] PP+PP-g-MA+C16-ME [15] PP+PP-g-MA+MMT [16]
Yo
ung'
s M
odul
us [M
Pa]
Filler wt. [%]
Figure 6.16. Young’s modulus of PP/clay nanocomposites in function of the filler
wt.%. The lines are liner fits of the experimental data, excluding the pure matrix (0
wt.%).
In Figure 6.17, the increment of nanocomposites Young’s moduli relative to the
matrix moduli (E/E0) is presented, along with the model predictions for different clay
shape (plate or fibre) and aspect ratios. In order to calculate the filler vol.% from the
weight percent, the density of PP, sepiolite and montmorillonite (or hectorite) is
assumed, respectively, 0.9 gcm-3, 2.2 gcm-3 and 2.8 gcm-3. The shape factors relative
to fibres (sepiolite) and plates (montmorillonite and hectorite) are in accordance with
Paragraph 5.3.5, Chapter 5. Solid and dotted lines are, respectively, Halpin-Tsai
predictions for PP/Sep and PP/MMT (or PP/ME) nanocomposites, considering an
elastic modulus, of all types of clay, equals to 200 GPa (see 5.3.4). Moreover, the
specimens manufactured by injection moulding are supposed to have a unidirectional
155
Page 156
CHAPTER 6 – PP / Sepiolite Nanocomposites
orientation (1D) of the filler, whilst specimens manufactured by compression
moulding are supposed to have 2D randomly oriented filler (see Table 6.2).
0 1 2 3 4 5
1.2
1.6
2.0
2.4
2.8
3.2
3.6
4.0
4.4
∞→1D, s∞→2D, s
2D, s=27
2D, s=12
2D, s=4
1D, s=8
1D, s=21
PP+Sep2 PP+PP-acid+Sep PP+C16-ME [15] PP+PP-g-MA+C16-ME [15] PP+PP-g-MA+MMT [16]
E c/Em
Filler vol. [%]
Figure 6.17. Relative Young’s modulus versus filler vol.%. The lines are prediction
from the Halpin-Tsai equations for PP/Sep nanocomposites (fibre-like filler; solid
line) and PP/smectite clay nanocomposites (plate-like filler; dotted line), using true
filler aspect ratios (s) as a fitting parameter. In the graph the prediction for fibre-like
and plate-like filler for s ∞→ , corresponding to the rule of mixtures, are also
included. The abbreviations ‘1D’ and ‘2D’ stand for uniaxially oriented and 2D in-
plane randomly distributed filler, respectively.
The highest increase in elastic moduli is relative to the two PP/ME nanocomposites.
The use of PP-MA helps the platelet-like clays exfoliation, with an increased
reinforcement. However this result is to be explained mainly by the higher
orientation of the filler induced by injection moulding.
156
Page 157
CHAPTER 6 – PP / Sepiolite Nanocomposites
A way to compare the different sets of data is by fitting them with the Halpin-Tsai
equation and extrapolating the true aspect ratio (s) as a fitting parameter.
It can then be observed that the sepiolite based nanocomposites have an effective
fibre aspect ratio of s=12, which is lower than the average value estimated from TEM
micrograph in Paragraph 5.3.1 (s=27). This can be explained by a partial
agglomeration of sepiolite clay in PP (Fig. 6.1) and by a partial reduction in fibre
length induced by melt compounding (Fig. 6.2). Nevertheless, the true aspect ratio
for PP/Sep nanocomposites results to be higher than the aspect ratios of PP/MMT
nanocomposites (s=4) and PP/C16-ME nanocomposites (s=8) and close to the value
of s=21 relative to PP/PP-g-MA/C16-ME nanocomposites.
Since the aspect ratios expected from smectite clays are about 100-1000, it can be
appreciated how inefficiently plate-like clays are exfoliated into PP matrix and how
poor is their effective reinforcement. It can then be concluded that sepiolite is
comparably a more efficient nanofiller since the level of dispersion achievable is
higher.
Tensile Stress
An increase in stiffness alone is not a sufficient proof for reinforcement, since
Young’s modulus is expected to increases upon addition of inorganic fillers. Another
important mechanical property to take into account is the tensile yield stress that
depends on the components properties and particle dimensions and shape but also,
very importantly, on the filler/matrix interphase and the strength of interaction.
The results of tensile yield stress for the PP/Sep nanocomposites, from Figure 6.14,
can be interpreted in terms of the Pukanszky equation [18, 19] and compared with
the relevant scientific literature. The model assumes that an interphase forms
spontaneously in composites and yield stress changes proportionally to its actual
value as a function of composition. The composition dependence of tensile yield
stress can be described by the following equation:
157
Page 158
CHAPTER 6 – PP / Sepiolite Nanocomposites
)exp(5.21
10
ϕϕ
ϕσσ Byy +−
= Equation 6.1
where σy and σy0 are respectively the yield stress of the composite and the matrix, φ is
the volume fraction of the filler in the composites and B is a parameter related to the
load carried by the dispersed component and depends on interaction filler/matrix.
The term (1- φ)/(1+2.5 φ) expresses the effective load-bearing cross-sectional area of
the matrix. Without any interaction, the entire load is carried by the polymer and the
load-bearing cross-sectional area decreases with increasing filler content (the non-
interacting fillers act as holes). The value of the parameter B depends on all factors
influencing the load-bearing capacity of the filler, i.e. on the strength of interaction
and on the size of the contact surface. The effect of these factors on B is expressed as
0
ln)1(y
iyff lAB
σ
σρ+= Equation 6.2
where Af is the specific surface area of the filler (contact surface), ρf is its density,
while l and σyi are the thickness and the yield stress of the interphase. The latter two
parameters depend on the strength of the matrix/filler interaction.
If the model is valid, a linear correlation should be obtained when the natural
logarithm of reduced yield stress, σred (defined by Equation 6.3) is plotted against the
filler content (from Equation 6.1):
ϕϕσσ
−+
=1
5.21yred Equation 6.3
ϕσϕϕσσ Byyred +=⎟⎟⎠
⎞⎜⎜⎝
⎛−
+=
0ln
15.21lnln Equation 6.4
or, in terms of relative yield stress, σrel (defined by Equation 6.5):
158
Page 159
CHAPTER 6 – PP / Sepiolite Nanocomposites
ϕϕϕ
σσ
σ By
yrel =⎟
⎟⎠
⎞⎜⎜⎝
⎛
−+
=1
5.21lnln0
Equation 6.5
ϕϕϕ
σσ
σ By
yrel =⎟
⎟⎠
⎞⎜⎜⎝
⎛
−+
=1
5.21lnln0
Equation 6.6
Fig. 6.18 shows the tensile yield stress plotted with the filler volume fraction.
0 2 4 624
26
28
30
32
34
36
38
40
42
44
PP+Sep-sil PP+PP-acid+Sep PP+C16-ME [15] PP+PP-g-MA+C16-ME [15] PP+PP-g-MA+MMT [17]
Yiel
d St
ress
[MPa
]
Filler vol. [%]
Figure 6.18. Tensile yield stress of PP/clay nanocomposites as a function of the filler
vol.%.
Differently than the behaviour of Young’s modulus in Figure 6.16, the yield stress
doesn’t always show a monotone increase with the filler content. In analogy with the
previous paragraph, instead, the unfilled matrix often shows a stress value which is
incongruent with the rest of the data points and is excluded for modelling purposes.
This can be explained again by an effect of polymer matrix modification (i.e.
159
Page 160
CHAPTER 6 – PP / Sepiolite Nanocomposites
enhanced crystallinity or change in crystal phase) induced by minute amounts of
clays. The natural logarithm of the relative yield stress for PP/clay nanocomposites is
plotted against the filler volume fraction in Figure 6.19. From the linear fitting of the
experimental data points, a coefficient B can be extracted from the five sets of
experimental data points.
0 1 2 3 4 5
0.0
0.1
0.2
0.3
0.4
0.5
B=3.1
B=2.7
B=5.7
B=6.5
B=11.9
PP+Sep-sil PP+PP-acid+Sep PP+C16-ME [15] PP+PP-g-MA+C16-ME [15] PP+PP-g-MA+MMT [17]
Ln (σ
rel)
Filler vol. [%]
Figure 6.19. The natural logarithm of relative tensile stress of PP/clay
nanocomposites in function of the filler volume percent. From the linear fit of the
experimental data, the parameter B can be extracted.
The coefficient B varies between 2.7 and 11.9 (normally ranging from negative
values up to about 20 as a maximum [20]), which shows how sensitive this parameter
is in PP-based composites. For what PP/ME nanocomposites are concerned, for
instance, a parameter B increases four folds when PP-MA is added to the
nanocomposite. It is claimed here though, that the driving factor for such an increase
in B is more related to the difference in exfoliation/dispersion state of the nanoclays
160
Page 161
CHAPTER 6 – PP / Sepiolite Nanocomposites
rather than a significant change in the strength of the polymer/filler interface which
remains limited. In other words, referring to Equation 6.2, the change in B is related
more to Af (specific surface area of the filler) than to l and σyi. The statement above is
confirmed by the observation that PP+C16-ME nanocomposites are characterised by
a lower B parameter (Fig. 6.19) but a higher increase in Young’s modulus than
PP/Sep nanocomposites (Fig. 6.17). The higher stiffness is explained with the higher
orientation of the filler, induced by injection moulding, while the lower parameter B
is compatible with a poor exfoliation of the platelet clay and hence a lower aspect
ratio (from Fig. 6.17, s=8 is predicted) and effective contact surface.
6.4 Conclusions
Two different strategies have been followed in order to improve the dispersion and
compatibility of needle-like sepiolite nanoclay in isotactic propylene matrix: the use
of functionalised polymers as a third phase in the PP/Sep composites and the direct
functionalisation of the sepiolite surface. For what concern the former, a novel
copolymer (PP-acid) with high acid number (30) and lower molecular weight
(Mn=1800 gmol-1), was compared with the commonly used PP-g-MA, showing better
efficiency in terms of nanofiller dispersion and nanocomposites mechanical
properties. It is believed that an even better efficiency is achievable with further
optimizations of the thermodynamics of the surface-active polymers. The silanisation
of the sepiolite surface, on the other hand, is a very promising route to improve the
compatibility between PP matrix and the nanoclay. It guarantees excellent nanofiller
dispersion (up to 1-2 wt.%) and the best mechanical performances among the
different systems studied, in particular for what concern the yield stress.
In general, as for many other types of nanofillers, sepiolite considerably changes the
kinetics of crystallisation of PP, acting as heterogeneous nuclei and increasing the
crystallisation temperature. Moreover, although sepiolite did not alter the crystalline
structure and crystal polymorphism, it did seem to promote an orientation of the α-
phase crystals.
161
Page 162
CHAPTER 6 – PP / Sepiolite Nanocomposites
The addition of sepiolite into PP also significantly modify the rheology of PP melts,
reducing the frequency dependence of G’ and inducing a solid-like response for 10
wt.% of clays, which was explained by the formation a percolated network.
It was observed that the thermal degradation of PP, in oxidative atmosphere, is
substantially retarded by the presence of sepiolite and the effect is more evident for
increasing loadings of the nano-filler, up to 5 wt.%.
The mechanical performances of the best systems (PP+Sep-sil and PP+PP-acid+Sep)
are analysed with two micromechanical models (Halpin-Tsai and Pukanszky) and
compared with relevant publications in the scientific literature on more commonly
studied platelet-like clay nanocomposites. Sepiolite seams to provide a good
reinforcement in terms both of Young’s modulus and yield stress when compared
with smectite clays with equivalent level of filler orientation. The reason lays in the
better dispersion achievable with fibre-like rather than platelet-like clays instead of
specific interactions filler/matrix which are anyway very limited in the case of PP as
matrix.
6.5 References
1. G. Natta and P. Corradini, Structure and Properties of Isotactic Polypropylene.
Nuovo Cimento Suppl, 1960. 15: p. 40.
2. E. Ferrage, F. Martin, A. Boudet, S. Petit, G. Fourty, F. Jouffret, P. Micoud, P.
De Parseval, S. Salvi, C. Bourgerette, J. Ferret, Y. Saint-Gerard, S. Buratto, and
J.P. Fortune, Talc as nucleating agent of polypropylene: morphology induced
by lamellar particles addition and interface mineral-matrix modelization.
Journal of Materials Science, 2002. 37(8): p. 1561-1573.
3. F. Rybnikar, Orientation in Composite of Polypropylene and Talc. Journal of
Applied Polymer Science, 1989. 38(8): p. 1479-1490.
4. L.H. Wang and J. Sheng, Preparation and properties of polypropylene/org-
attapulgite nanocomposites. Polymer, 2005. 46(16): p. 6243-6249.
162
Page 163
CHAPTER 6 – PP / Sepiolite Nanocomposites
5. A. Pozsgay, T. Frater, L. Papp, I. Sajo, and B. Pukanszky, Nucleating effect of
montmorillonite nanoparticles in polypropylene. Journal of Macromolecular
Science-Physics, 2002. B41(4-6): p. 1249-1265.
6. B. Pukanszky and E. Fekete, Aggregation tendency of particulate fillers:
Determination and consequences. Polymers & Polymer Composites, 1998.
6(5): p. 313-322.
7. P. Svoboda, C.C. Zeng, H. Wang, L.J. Lee, and D.L. Tomasko, Morphology
and mechanical properties of polypropylene/organoclay nanocomposites.
Journal of Applied Polymer Science, 2002. 85(7): p. 1562-1570.
8. L. Shen, Y.J. Lin, Q.G. Du, W. Zhong, and Y.L. Yang, Preparation and
rheology of polyamide-6/attapulgite nanocomposites and studies on their
percolated structure. Polymer, 2005. 46(15): p. 5758-5766.
9. J.L. Ahlrichs, C. Serna, and J.M. Serratosa, Structural Hydroxyls in Sepiolites.
Clays and Clay Minerals, 1975. 23(2): p. 119-124.
10. A. Marcilla, A. Gomez, S. Menargues, and R. Ruiz, Pyrolysis of polymers in
the presence of a commercial clay. Polymer Degradation and Stability, 2005.
88(3): p. 456-460.
11. G. Tartaglione, D. Tabuani, and G. Camino, Thermal and morphological
characterisation of organically modified sepiolite. Microporous and
Mesoporous Materials, 2008. 107(1-2): p. 161-168.
12. G. Tartaglione, D. Tabuani, G. Camino, and M. Moisio, PP and PBT
composites filled with sepiolite: Morphology and thermal behaviour.
Composites Science and Technology, 2008. 68(2): p. 451-460.
13. J.L. Valentin, M.A. Lopez-Manchado, P. Posadas, A. Rodriguez, A.M. Marcos-
Fernandez, and L. Ibarra, Characterization of the reactivity of a silica derived
from acid activation of sepiolite with silane by Si-29 and C-13 solid-state NMR.
Journal of Colloid and Interface Science, 2006. 298(2): p. 794-804.
14. R. Krishnamoorti and A.S. Silva, Polymer–clay nanocomposites, ed. T.J.
Pinnavaia and G.W. Brall. 2000, New York: Wiley.
15. P. Reichert, H. Nitz, S. Klinke, R. Brandsch, R. Thomann, and R. Mulhaupt,
Poly(propylene)/organoclay nanocomposite formation: Influence of
163
Page 164
CHAPTER 6 – PP / Sepiolite Nanocomposites
compatibilizer functionality and organoclay modification. Macromolecular
Materials and Engineering, 2000. 275(2): p. 8-17.
16. C.M. Koo, J.H. Kim, K.H. Wang, and I.J. Chung, Melt-extensional properties
and orientation behaviors of polypropylene-layered silicate nanocomposites.
Journal of Polymer Science Part B-Polymer Physics, 2005. 43(2): p. 158-167.
17. L. Szazdi, B. Pukanszky, G.J. Vancso, and B. Pukanszky, Quantitative
estimation of the reinforcing effect of layered silicates in PP nanocomposites.
Polymer, 2006. 47(13): p. 4638-4648.
18. B. Pukánszky, B. Turcsányi, and F. Tüdős, Effect of Interfacial Interaction on
the Tensile Yield Stress of Polymer Composites, H. Ishida, Editor. 1988,
Elsevier: New York. p. 467-477.
19. B. Turcsanyi, B. Pukanszky, and F. Tudos, Composition Dependence of Tensile
Yield Stress in Filled Polymers. Journal of Materials Science Letters, 1988.
7(2): p. 160-162.
20. L. Szazdi, A. Pozsgay, and B. Pukanszky, Factors and processes influencing
the reinforcing effect of layered silicates in polymer nanocomposites. European
Polymer Journal, 2007. 43(2): p. 345-359.
164
Page 165
7 Oriented PP / Sepiolite Nanocomposite Tapes
7.1 Introduction
This chapter presents the study of solid-state drawn nanocomposites tapes based on
iPP and sepiolite clay, a field in which the literature is not much investigated [1-4].
In this case, the intrinsic anisotropy of sepiolite nano-fibres, allows also an
exploitation of the orientation of such filler upon drawing. The nanocomposites tapes
are fully characterised for their morphology, structure, orientation and mechanical
properties. In particular, extraordinary enhancements in mechanical properties are
found to be provided by small amounts sepiolite (<2.5 wt.%).
7.2 Experimental
7.2.1 Materials
The iPP used was a homopolymer polypropylene resin H507-03Z from DOW (MFI
3.2 g/10min at 230 °C/2.16 Kg). The sepiolite Pangel® were supplied by Tolsa
165
Page 166
CHAPTER 7 – Oriented PP / Sepiolite Nanocomposite Tapes
(Spain) and surface-modified with alkyl-silane at TNO (The Netherlands). For
simplicity the filler will be referred to as Sep throughout the chapter, although it was
differently addressed to in the previous one, in order to be distinguished from the
pristine clays.
7.2.2 Composite Tape Preparation
Rectangular specimens (50x3 mm2) were cut from thin films (100 µm in thickness),
prepared by compression moulding (220 °C for 10 min) granules of pre-compounded
nanocomposite at different concentrations (see Chapter 6). The desired draw ratio
was obtained by solid state drawing the initial rectangular specimen (Fig. 7.2) at a
temperature of 120 °C in an universal testing machine (Instron 5584) equipped with
an environmental chamber. The temperature of 120 °C is intermediate between the
melting point (~165°C) and the crystalline relaxation temperature Tα (~100°C) of
polypropylene [5, 6].
λ=1
λ=2
λ=5
λ=24
3mm50mm
Figure 7.1. Schematic illustration of nanocomposite tape preparation. A rectangular
specimen is cut from a 100 µm thick compression moulded film and drawn in the
solid state to a tape of the desired draw ratio.
166
Page 167
CHAPTER 7 – Oriented PP / Sepiolite Nanocomposite Tapes
7.2.3 Composite Tape Characterisation
Morphological Analysis
Morphological studies were carried out using Scanning Electron Microscopy (SEM)
nalysis (Jeol JSM-6300F) on gold-coated surfaces. The lateral surfaces of oriented
investigated after ductile failure induced by tensile tests.
CD camera, in transmission mode, with an exposure time of 30sec. The X-ray
as a synchrotron radiation at the EPRF (European Synchrotron Radiation
nanocomposite tapes samples at room
mperature in an Instron 5586, equipped with a 1kN load cell and Merlin data
tware. A crosshead displacement rate of 5 mm/min was used on
a
nanocomposite tapes were
WAXS
Two-dimensional wide angle X-ray diffraction (WAXS) patterns were recorded by a
C
source w
Facility), beam line BM26 Dubble (Dutch-Belgian beam line). The average
wavelength was 1.24 Å. The two-dimensional X-ray patterns were transformed into
one-dimensional patterns by performing integration of the Azimuthal intensity. All
data manipulation on WAXS results were performed with the data analysis program
FIT2D, available free for academic users
Tensile Tests
Tensile tests were conducted on the
te
acquisition sof
rectangular samples with a length of 50 mm. The thickness and width, depending on
the draw ratio, were in the range of 100-30 µm and 0.8-3 mm, respectively. The
width was measured from optical images obtained using an Olympus BX60F and
recoded with a JVC colour camera, model KY-F55BE. The thickness was measured
167
Page 168
CHAPTER 7 – Oriented PP / Sepiolite Nanocomposite Tapes
with a digital micrometer with resolutions of 1 µm. For all the samples at least five
specimens were measured and the mean value was calculated.
DSC
Differential scanning calorimetry (DSC) was performed on about 1 mg samples of
anocomposite tapes in standard aluminium pans, using a Mettler-Toledo DSC 822e.
temperature up to 220 °C at a scanning rate of 10
7.3.1 Morphology of Tapes
igure 7.2 shows the SEM micrographs of the planar surface of PP tapes and
sepiolite. The tapes, of an original draw ratio
f 20, were imaged after ductile failure induced by tensile tests. PP tapes are
n
Sample were heated from room
K/min, held at that temperature for five minutes and then cooled at 10 K/min to room
temperature. The degree of crystallisation of the nanocomposite tapes was calculated
from the integration of the endothermic peak in the first heating scan.
7.3 Results and Discussion
F
composites with 1 wt.% and 10 wt.% of
o
characterised by a highly oriented and micro-fibrillated structure (Fig. 7.2.a-b). The
same considerations can apply for the PP+1%Sep composite tapes (Fig. 7.2.c-d), for
which the addition of 1 wt.% of filler doesn’t substantially change the overall picture.
Instead, a different morphology is shown from the PP+10%Sep composite tapes (Fig.
7.2.e-f), in particular for what concerns a reduced micro-fibrillation (Fig. 7.2.e) and
168
Page 169
CHAPTER 7 – Oriented PP / Sepiolite Nanocomposite Tapes
the presence of inorganic inclusions. Therefore the incorporation of as much as 10
wt.% inorganic filler negatively affects the orientation of the tapes.
a)
b)
c)
d)
e)
f)
Figure 7.2. SEM micrographs, at different magnifications, of the lateral surface of:
a-b) PP tapes, c-d) PP+1%Sep tapes and e-f) PP+10%Sep, after ductile failure. A
white circle indicates sepiolite agglomerations.
169
Page 170
CHAPTER 7 – Oriented PP / Sepiolite Nanocomposite Tapes
Moreover, as reported in the previous chapter (Fig. 6.1.d-e), sepiolite loadings above
5 wt.% are scarcely well dispersed in polypropylene matrix and will partially
agglomerate at a micron level. These agglomerates can act as defects and stress
oncentration points which seriously compromise the stability of the tapes upon
anical properties of polymers are closely related to the polymer molecular
Many experimental techniques have been employed to determine the
scale. In this study wide angle X-
y diffraction (WAXD) has been used to investigate the polymer crystals
Figure 7.3. Scheme of WAXS measurements in the through direction.
c
drawing.
7.3.2 PP and Sepiolite Orientation
The mech
orientation.
degree of orientation in polymers on a molecular
ra
orientation. WAXS measurements have been taken in the through (out-of-plane)
direction of various nanocomposite tapes, as schematically shown in Figure 7.3.
X-ray
Drawing direction
170
Page 171
CHAPTER 7 – Oriented PP / Sepiolite Nanocomposite Tapes
2D wide angle X-ray images of PP tapes and PP/sepiolite nanocomposite tapes at
different draw ratios are presented in Figure 7.4. Each of the patterns is individually
optimised in contrast and brightness. The so-called Debye-Scherrer rings are
observed for film samples (λ = 1), which is a clear indication of random orientation.
Each ring represents a crystal plane of polymer crystal cell. Five main reflections are
observed in Fig. 7.4.a, which are typical of the PP α crystal form [7] as already
discussed in the previous chapter (Fig. 6.3). In Fig.7.4.c-d an extra ring appears
which is characteristic of the basal crystal plane of the sepiolite. Upon drawing, the
crystallites will align along the drawing direction and this can be associated to the
change in the X-ray pattern, in which the rings become arcs. At a draw ratio of 20
(Fig. 7.4.b-d-f), crystallites are perfectly aligned and the diffraction arcs are very
narrow, almost dots. It is important to underline at this stage that a full understanding
of the kind of preferred orientation that prevails in a selected sample could not
simply be obtained from a WAXS test with the fibre axis perpendicular to the direct
beam. The intensities of appropriate diffractions should be observed as a function of
the angle of tilt of the fibre axis. Furthermore, when the mode of preferred
orientation is more complex than simple axial, the intensities of certain reflections
are found to depend not only on the inclination but also on the azimuth of the
specimen. In the case of non-orthogonal crystal systems the study is even more
complicated by the fact that there are no crystalline planes normal to the chosen
crystallographic direction (usually the c-axis: the direction of polymer
macromolecules). In the case of i-PP, the α-form crystal cell is monoclinic and it can
be demonstrated that two independent sets of planes need to be evaluated to fully
describe the orientation of the polymer chains with respect to one direction [8].
171
Page 172
CHAPTER 7 – Oriented PP / Sepiolite Nanocomposite Tapes
λ=1
λ=20
a)
b)
d)c)
e)
f)
Figure 7.4. 2D WAXS patter
tapes, at λ=1 (left column)
indicate the main reflection p
(131)(041)
(111)
(110)
n
a
la
(
(040)
s
nd
n
10
(130)
of: a-b) PP, c-d) PP+5%Sep and e-f) PP+10%Sep
λ=20 (right column), respectively. Black arrows
es of PP and of sepiolite clays.
0)clay
172
Page 173
CHAPTER 7 – Oriented PP / Sepiolite Nanocomposite Tapes
However, there is an easier approach to this, which is widely used. In fact, there is a
correspondence between the intensity in a diffraction arc at a particular angle to the
meridian and the number of crystallites oriented at the same critical angle to the fibre
axis, as was firstly pointed out by Weissenberg [9]. When the fibre axis is
perpendicular to the incident beam it can be shown that, for moderate to small Bragg
angles (θ~0), the angle of inclination of the plane normal to the fibre axis (φ ) is
practically equal to the Azimuthal angle β as directly measured from the meridian
. If a me e of a quate intensity can be obtained, the
degree of the molecular chain, taken to be coincident with the c-axis, is given
directly by the Azimuthal extension of that plane. However, since meridional
reflections are usually weak, near-meridional crystalline planes can be used or even
equatorial crystalline planes as an indirect index of degree of alignment.
In this study, as often the case in the polymer field, an indicative measurement of
crystallite orientation with respect to the drawing direction, will be obtained from
sity as a function of
on the film ridional (00l) plan de
Azimuthal scans of the (110) diffraction plane, which appears as the most intense.
If the WAXS 2D images (Fig.7.4) are integrated along the 2θ axis, plots as in
Figure7.5.a-b are obtained, showing the integrated X-ray inten
the Azimuthal angle φ for PP and PP+5%Sep tapes with draw ratios of 1, 7 and 20
respectively. The background intensity is subtracted for all samples and the 0 o
represents the equatorial direction. It is observed that un-stretched films show
isotropic behaviour of polymer chains which could be determined from the constant
diffraction intensity over the whole angle range in all films. When films are stretched
under solid-state condition, the intensity increases and the peak becomes sharper,
which indicates that the drawing leads to h gher degree of orientation of the polymer
chains in both samples.
i
173
Page 174
CHAPTER 7 – Oriented PP / Sepiolite Nanocomposite Tapes
-45 -30 -15 0 15 30 45
a) PP, λ=1 PP, λ=7 PP, λ=20
Inte
nsity
[a.u
.]
Azimuthal Angle [degree]
b)
-45 -30 -15 0 15 30 45
Inte
nsity
[a.u
.]
Azimuthal Angle [degree]
PP+5% Sep, λ=1 PP+5% Sep, λ=7 PP+5% Sep, λ=10
Figure 7.5. X-ray intensity (integrated along the 2θ axis) versus the Azimuth angle
for a) PP sample and b) PP+5%Sep tapes at λ=1, 7 and 20. Solid line represents
Gaussian fitting of the data points.
174
Page 175
CHAPTER 7 – Oriented PP / Sepiolite Nanocomposite Tapes
Assuming a uniaxial Gaussian distribution, the Azimuthal peaks are fitted with a
Gaussian curve and the widely accepted Hermans’ orientation factor [10] could be
calculated for both the drawn PP and PP/sepiolite tapes. The crystal orientation
function fc is calculated from the Hermans’ orientation equation, which takes the
form:
( ) φφφ22 sin
2311cos3
21
−=−=f Equation 7.1
Where φ2cos and φ2sin represent respectively the mean-square cosine and sine
(averaged over all the crystallites) of the angle between a given crystal axis and the
fibre axis, which serves as the reference direction.
For a given crystallographic axis, φ2cos assumes values of 1 for perfect
alignment, 1/3 for random orientations, and 0 for precise perpendicularity. At the
same time assumes the respective values 1, 0 and -1/2.
In case of axial orientation with respect to a given direction Z (i.e. the drawing
direction), numerical values of the mean-square cosines, of the angles that the (hkl)
plane normals form with Z, can be calculated from the intensity distribution I (φ):
φf
∫
∫= 2/
0
2/
0
2
,2
sin)(
cossin)(cos π
π
φφφ
φφφφϕ
dI
dI
Zhkl Equation 7.2
175
Page 176
CHAPTER 7 – Oriented PP / Sepiolite Nanocomposite Tapes
where ф is the Azimuthal angle, at 90o corresponds to the drawing direction, and
ф=0 o corresponds to the transverse direction of the tapes. Figure 7.6 shows the
calculated Hermans’ orientation factors obtained from WAXD experiments for
composite tapes at different draw ratios. It is interesting to note that Hermans’ factor
of PP polymer crystals at draw ratio of 7 is already approaching 1, the maximum in
e Hermans’ factor range of values.
0.8
1.0
th
1 3 5 7 9 11 13 15 17 19 21
n Fa
ctor
0.6
0.0
0.2
0.4
PP PP+1% Sep PP+2.5% Sep PP+5% Sep PP+10% Sep
nto
igure 7.6. Orientation of PP crystals: Hermans’ orientation factor as a function of
draw ratio λ, relative to PP tapes with different concentrations of sepiolite.
The result shows that solid-state drawing is an efficient method in obtaining
significant polymer alignment at relative low draw ratio. A second important
bservation lays in the similar values of the orientation factor for tapes of equivalent
draw ratios and different amount of filler. This affirms that the polymeric matrix in
Orie
ati
Draw Ratio λ
F
o
176
Page 177
CHAPTER 7 – Oriented PP / Sepiolite Nanocomposite Tapes
the nanocomposite tapes and in the pure PP tapes possess the same degree of
crystalline orientation at a given macroscopic draw ratio. This is important since it
allows an easier understanding and comparison of data to extract the effect of
different filler content on the mechanical properties of tapes of similar draw ratio.
The solid state drawing of the composite tapes not only orients the polymer crystals
but also leads to an alignment of the sepiolite needles.
1 3 5 7 9 11 13 15 17 19 21
0.0
0.2
0.4
0.6
0.8
1.0
Orie
ntat
ion
Fact
or
Draw Ratio λ
Figure 7.7. Orientation of sepiolite: Hermans’ orientation factor for PP+5%Sep
composite tape, as a function of draw ratio λ.
In analogy with the study of the polymer crystal orientation, an Azimuthal scan can
be performed on the basal diffraction ring (100) of the clay, at 2θ about 7.2 °, in
order to study the orientation of the needle-like clays.
177
Page 178
CHAPTER 7 – Oriented PP / Sepiolite Nanocomposite Tapes
Figure 7.7 shows the Hermans’ orientation factors for composite tape with 5 wt.% of
sepiolite at different draw ratios. It can be concluded that at a draw ratio of about 7
both the polymer crystals and the needle-like nanofillers are perfectly aligned along
the tape direction.
7.3.3 Mechanical Properties
In this paragraph the mechanical properties of the oriented tapes are characterised by
tensile tests. Figure 7.9 shows the stress-strain curves of PP tapes at different draw
ratios.
100
150
200
250
300
350
400
450
500
550
600
0 5 10 15 20 250
50
400 600 800 1000
λ=24
λ=20
λ=16
λ=9
λ=1
Stre
ss [M
Pa]
%]
he mechanical performance of
polypropylene. Upon drawing to λ=24, the Young’s modulus increases from about
Strain [
Figure 7.8. Stress-strain curves of PP tapes of different draw ratios λ.
The solid-state drawing process dramatically changes t
178
Page 179
CHAPTER 7 – Oriented PP / Sepiolite Nanocomposite Tapes
1.3 GPa to 14 GPa and the ultimate tensile stress from about 50 MPa to 550 MPa. In
contrast, the strain at break is reduced to 5 %. These values are still far away from
the theoretical limit of PP, for which a stiffness of about 40 GPa is expected [11].
The reason is well established and lies in the fact that the drawability of melt-
rystallised PP achieved by solid-state drawing is limited by the presence of c
molecular entanglements [12-15].
16
18
4 6 8 10 12 14 16 18 20 22 24 26
4
6
8
10
12
14
s=27∞→s
s=12
Youn
g's
Mod
ulus
[GPa
]
Draw ratio λ
PP PP+2.5% Sep PP+10% Sep
Figure 7.9. Young’s modulus of nanocomposites tapes at different draw ratios. The
dotted lines are Halpin-Tsai predictions of PP tapes filled with 2.5 wt.% sepiolite,
completely aligned in the direction of the tape, at three aspect ratios: s=12, which
was fou aspect
ratio of sepiolite nanofibres (5.3.1), and s
nd to fit the isotropic samples (Fig. 6.15), s=27, which is the average
, which corresponds to the upper ∞→
bound of the rule of mixtures. The Halpin-Tsai equation is applied to the unfilled PP
tapes at different draw ratios upward in order to shift the elastic moduli values.
179
Page 180
CHAPTER 7 – Oriented PP / Sepiolite Nanocomposite Tapes
The effect of nanoclays on the mechanical performance of the tapes is presented in
Fig. 7.9-7.13. The addition of small amounts of sepiolite to PP (up to 2.5 wt.%)
significantly enhances the stiffness of the tapes for draw ratios as high as 20 (Fig.
7.9). For comparison, the Halpin-Tsai predictions of PP tapes filled with 2.5 wt.% of
sepiolite, fully oriented in the direction of the tapes, is also included in the same
graph (dotted lines). Three aspect ratios are considered: s=12, which is the fitted
value found for isotropic specimens in the previous chapter (see Fig. 6.15), s=27,
which is the average aspect ratio of sepiolite nanofibre (see Paragraph 5.3.1), and
, which corresponds to the rule of mixtures and represents the upper bound.
The Halpin-Tsai equation is applied individually to the unfilled PP tapes at each
draw ratio in order to shift the relative elastic modulus value upward. It is surprising
to observe that the experimental data for PP+2.5%Sep tapes, at intermediate draw
ratios (10<λ<20), lie above the upper bound predictions based on the
micromechanical model. PP+2.5%Sep tapes with extremely low or high draw ratios
(λ<7 or λ>24) instead, present moduli very close to the ones of pure PP tapes.
Therefore, in this last case sepiolite has negligible reinforcing effect on the polymer
matrix. On the other hand, nanocomposites tapes with loadings above 5 wt.% have
stiffness even inferior to those of PP tapes for the entire draw ratio range. This
ere t
s ∞→
variation with the filler content can be better represented in Fig. 7.10. In this graph
the Young’s moduli of tapes of the same draw ratio (λ=9, 16 and 20) are replotted as
a function of increasing sepiolite wt.%, showing a maximum value for systems based
on 2.5 wt.% of clay (Fig. 7.10). An analogous comment can be given for the strength
of the tapes shown in Fig. 7.11 and 7.12, wh he ultimate tensile stress reaches an
optimum value for composite tapes with a filler content of 2.5 wt.% (until λ=20).
180
Page 181
CHAPTER 7 – Oriented PP / Sepiolite Nanocomposite Tapes
0 2 4 6 8 104
6
8
10
12
14
16
Youn
g's
Mod
ulus
[Pa
]G
Filler wt [%]
λ=9 λ=16 λ=20
Figure 7.10. Young’s modulus of nanocomposite tapes of λ=9, 16 and 20, as a
function of sepiolite filler content.
6 8 10 12 14 16 18 20 22 24
200
250
300
350
400
450
500
550
UTS
[MPa
]
Draw Ratio λ
PP PP+2.5% Sep PP+10% Sep
Figure 7.11. Ultimate tensile stress of nanocomposites tapes in function of λ.
181
Page 182
CHAPTER 7 – Oriented PP / Sepiolite Nanocomposite Tapes
0 2 4 6 8 10
200
250
300
350
400
450
500
550
UTS
(MPa
)
Filler wt%
λ=9 λ=12 λ=20
Figure 7.12. Ultimate tensile stress of nanocomposites tapes in function filler wt.%.
6 8 10 12 14 16 18 20 22 24 265
6
7
8
9
10
11
12
13
14
15
Stra
in a
t bre
ak [%
]
Draw Ratio λ
PP PP+1% Sep PP+2.5% Sep PP+5% Sep PP+10% Sep
Figure 7.13. Strain at break of nanocomposites tapes.
182
Page 183
CHAPTER 7 – Oriented PP / Sepiolite Nanocomposite Tapes
There are no significant differences, instead, in the strain at break (Fig. 7.13). Failure
strain is dominated by the polymer with little effect of the sepiolite. Hence, it can be
summarised so far that PP tapes are exceptionally reinforced by the addition of small
amounts of nanoclays (best values at 2.5 wt.% of sepiolite) at intermediate draw
ratios (10<λ<20), without compromising the final strain at break. The reason for this
behaviour can not be explained by classical composite theories and further
investigations are required (see also Paragraph 7.3.4).
Nevertheless, the detrimental effects of high concentrations of sepiolite and high
draw ratios (λ>24) can already be further commented. For what concerns the first
aspect it can be explained in terms of two main factors: filler dispersion and physical
,
can not be easily dispersed in polypropylene. In this case
the clays will tend to agglomerate in micrometric bundles. Agglomerates in contrast
to individually dispersed sepiolite nanoclays, act as defects and stress concentration
points that prevent drawability and polymer alignment. With respect to the second
factor, it is helpful to refer to the rheological data in chapter 6. There it was shown
that the addition of clays increases the viscosity of PP/sepiolite melts but, for
sepiolite concentrations above 5 wt.%, there was a change in the viscoelastic
behaviour at low frequencies. A solid-like behaviour appears rather than a liquid-
like, which was attributed to a percolated physical network formed by the filler. This
means that at higher concentrations of sepiolite, the physical entanglements increase
so much that the drawability of polymer chain is seriously compromised.
Passing to analyse the negative effect of high draw ratio, instead, a primary
explanation is the imperfect
entanglements. As shown by the SEM micrographs in Chapter 6 and also in Fig. 7.2
high loadings of sepiolite
the debonding which can develop upon drawing due to
183
Page 184
CHAPTER 7 – Oriented PP / Sepiolite Nanocomposite Tapes
interfacial adhesion PP/clay (Paragraph 6.3.6). Another explanation relies on simple
nd extent it as a more general
hermal/fire
composite theories. At the beginning of the stretching process (up to λ=6-7), there is
the initial contribution from the orientation of the filler (Fig.7.7) on the matrix
reinforcement, which is hindered in this study since the draw ratios investigated are
above this threshold. However, upon further drawing, the reinforcing effect of
sepiolite progressively diminishes, since the mechanical properties of the PP matrix
considerably increases.
It is worth spending few more words on this point a
consideration. It was already mentioned that the theoretical stiffness of PP crystals is
about 40 GPa in comparison with 230 GPa of polyethylene [11]. The modulus of
sepiolite, as measured via nano-bending tests in chapter 5, is around 200 GPa. It is
obvious that it would not make any sense to try to reinforce ultradrawn PE fibres
with nanoclays since the Young’s modulus of the reinforcement is close to the values
of the matrix itself. Clearly, this is different for the case of PP. Well dispersed
sepiolite, if perfectly bonded to the polymeric matrix, is potentially an interesting
nanofiller for oriented PP tapes and fibres. It is also important to keep in mind that
the use of PP tapes or fibres is not only due to its mechanical properties. Other fibres,
such as PE, have intrinsically much higher performances. However, one of the most
interesting properties of PP, over PE, is its comparatively high melting temperature.
With the addition of small amounts of nanoclay is possible to even further increase
the utilisation temperature of PP tapes. In fact rheological results have demonstrated
that the flowability properties of PP, at a certain temperature, are significantly
reduced. Another interesting result of adding sepiolite is the improved t
resistance. In Chapter 6 it has been demonstrated, via thermo gravimetric analysis,
how PP/sepiolite composites have a significant delay in the degradation temperature.
184
Page 185
CHAPTER 7 – Oriented PP / Sepiolite Nanocomposite Tapes
7.3.4 Thermal Analysis
The increase in orientation upon solid-state drawing can be indirectly followed by
the increase in crystallinity of the different tapes. The degree of crystallinity is
mH∆ ) obtained from the first heating scan of the
:
calculated from the melting heat (
DSC measurements, according to the following equation
cm
c fH
X ×H∆
∆=
0
Equation 7.3
where 0H∆ =209 J/g is the melting enthalpy of 100 % crystalline PP and cf is a
factor that simply takes in account for the excluded mass of inorganic that does not
melt. For instance, cf is 0.95 for a 5 wt.% nanocomposite. For this specific
investigation the second heating scan of DSC does not give much information. After
melting and re-crystallisation, the oriented structure of the tape is lost and an almost
isotropic sample is obtained, as already characterised in Chapter 6. The results are
plotted in Figure 7.15, for different composite tapes as a function of draw ratio. The
nanocomposite tapes, for intermediate values of λ, have a higher crystallinity
compared with the pure PP tapes. As the draw ratio increases, the crystallinity
decreases on a relative scale and this behaviour is more pronounced for higher
concentrations of sepiolite (>5 wt.%). Figure 7.14 shows remarkable similarities with
the mechanical results presented in Figures 7.9.
185
Page 186
CHAPTER 7 – Oriented PP / Sepiolite Nanocomposite Tapes
45
55
60
65
70
2 4 6 8 10 12 14 16 18 20 22 2425
30
35
40
50
75
PP PP+1% Sep PP+2.5% Sep
X c]
PP+5% Sep
[%
Draw io λ
Figure 7.14. Degree of crystallinity of different nanocomposite tapes in function of λ.
Rat
If the Young’s modulus is plotted in function of the crystallinity of the PP tapes (Fig.
7.15), a good correlation is found between the two parameters and the sets of data
points relative to composite tapes with different filler loadings, seam to lie on the
same line. This observation suggests that the deviations of the properties of
nanocomposite tapes from the pure PP tapes (Fig.7.9 and 7.11), are partially due to
changes in polymer crystallinity and semi-crystalline structure induced by the
presence of nanoclay during solid-state drawing, rather than a direct reinforcement of
the sepiolite.
186
Page 187
CHAPTER 7 – Oriented PP / Sepiolite Nanocomposite Tapes
30 35 40 45 50 55 60 65 70 750
2
4
6
8
10
12
14
16
Youn
g's
Mod
ulus
[GPa
]
Xc [%]
PP PP+1% Sep PP+2.5% Sep PP+5% Sep
Figure 7.15. Young’s modulus of nanocomposites tapes in function of the degree of
AXS studies. Small amounts of sepiolite (< 2.5 wt.%) have an
extraordinary effect on the mechanical properties of PP tapes, for intermediate draw
ratios (10<λ<20). The DSC analysis suggests that the origin of the improved
mechanical properties is more related to the modification of the semi-crystalline
polymer structure rather than a pure reinforcement effect. Nevertheless, sepiolite
polymer crystallinity.
7.4 Conclusions
In this chapter, the effect of sepiolite nanoclay on the final properties of oriented
polypropylene tapes has been evaluated. Solid-state drawing effectively orients both
the polymer crystallites and the needle-like filler at relatively low draw ratios, as
shown by W
187
Page 188
CHAPTER 7 – Oriented PP / Sepiolite Nanocomposite Tapes
remains an interesting nanofiller for oriented polypropylene tapes. Beside improved
mechanical behaviour, sepiolite clay provides increased utilisation temperature
(lower flowability) and improved thermal and fire resistance.
7.5 References
1. X.Q. Zhang, M.S. Yang, Y. Zhao, S.M. Zhang, X. Dong, X.X. Liu, D.J. Wang,
and D.F. Xu, Polypropylene/montmorillonite composites and their application
in hybrid fiber preparation by melt-spinning. Journal of Applied Polymer
Science, 2004. 92(1): p. 552-558.
2. M. Joshi and V. Viswanathan, High-performance filaments from
compatibilized polypropylene/clay nanocomposites. Journal of Applied
A. Gerasin, B.F. Shklyaruk, L.A.
Tsamalashvili, H.R. Fischer, and I.V. Razumovskaya, Structure and
r of nanocomposites based on polypropylene and modified
clays. Polymer Science Series A, 2003. 45(11): p. 1140-1152.
Polymer Science, 2006. 102(3): p. 2164-2174.
3. E.M. Antipov, A.A. Barannikov, V.
deformation behavio
4. E.M. Antipov, M.A. Guseva, V.A. Gerasin, Y.M. Korolev, A.V. Rebrov, H.R.
Fischer, and I.V. Razumovskaya, Structure and deformation behavior of
nanocomposites based on LDPE and modified clays. Polymer Science Series
A, 2003. 45(11): p. 1130-1139.
5. B. Alcock, N.O. Cabrera, N.-M. Barkoula, C.T. Reynolds, L.E. Govaert, and
T. Peijs, The effect of temperature and strain rate on the mechanical
properties of highly oriented polypropylene tapes and all-polypropylene
composites. Composites Science and Technology, 2007. 67(10): p. 2061-2070.
188
Page 189
CHAPTER 7 – Oriented PP / Sepiolite Nanocomposite Tapes
6. T. Schimanski, T. Peijs, P.J. Lemstra, and J. Loos, Influence of Postdrawing
Temperature on Mechanical Properties of Melt-Spun Isotactic Polypropylene.
Macromolecules, 2004. 37(5): p. 1810-1815.
7. G. Natta and P. Corradini, Structure and Properties of Isotactic Polypropylene.
uppl, 1960. 15: p. 40.
Alexander, X-ray diffraction methods in polymer science. 1969, New
9.
10.
11. -ray diffraction method to the
12. prehensive Composites, T.-W.
13. I.M.
Nuovo Cimento S
8. L.E.
York.: Wiley.
K. Weissenberg, Z. Physik, 1961. 8: p. 20.
P.H. Hermans and P. Platzek, Kolloid Z., 1939. 88: p. 68.
K. Nakamae and T. Nishino, The application of X
measurement of crystal deformation and crystal modulus of high polymers.
Advances X-ray Analysis, 1992. 35: p. 545-552.
T. Peijs, M.J.N. Jacobs, and P.J. Lemstra, Com
Chou, A. Kelly, and C. Zweben, Editors. 2000, Elsevier Science Publishers
Ltd: Oxford. p. 263-302.
Ward, Structure and properties of oriented polymers. 1997, London:
Chapman & Hall.
14. P. Smith and P.J. Lemstra, Ultrahigh-Strength Polyethylene Filaments by
Solution Spinning-Drawing .2. Influence of Solvent on the Drawability.
Makromolekulare Chemie-Macromolecular Chemistry and Physics, 1979.
180(12): p. 2983-2986.
15. P. Smith, P.J. Lemstra, and J.P.L. Pijpers, Tensile-Strength of Highly Oriented
Polyethylene .2. Effect of Molecular-Weight Distribution. Journal of Polymer
Science Part B-Polymer Physics, 1982. 20(12): p. 2229-2241.
189
Page 190
8 Polyamide 6 / Sepiolite
Nanocomposites
8.1 Introduction
The first successful report of polymer-clay nanocomposites was, as mentioned
earlier, obtained via in situ intercalative polymerisation of ε-caprolactam, in the
presence of platelet-like clays [1, 2]. Although there are already commercial
applications of this new material, the simple melt compounding is much more viable
and attractive from a commercial viewpoint. In this chapter the preparation of
PA6/sepiolite clay nanocomposite, as obtained in a mini twin-screw extruder, will be
described, as well as a characterisation of the material in terms of morphology (via
SEM and TEM analysis), crystallinity and crystal structure of the semi-crystalline
matrix and mechanical performances. The tensile tests results will be interpreted in
terms of two micromechanical models, the Halpin-Tsai model for stiffness and the
Pukanszky equation for strength, and compared with the results on PA6/MMT of
selected publications.
190
Page 191
CHAPTER 8 – Polyamide 6 / Sepiolite Nanocomposites
8.2 Experimental
8.2.1 Materials
Polyamide 6 (PA6) Technyl® C206 from Rhodia (density of 1.14 gcm-3) and
sepiolite Pangel® from Tolsa (Spain) were used in this study.
8.2.2 Nanocomposites Preparation
Nanocomposites were prepared by a two-step blending process in a mini twin-screw
extruder DSM Micro 15, at 240 °C and 200 rpm for 10 min, utilising a continuous
flow of nitrogen gas into the mixing chamber, to minimise possible polymer
degradation. First, sepiolite was mixed with the PA6 to make a masterbatch at 20
wt.% of filler, which was subsequently diluted with neat PA6 to obtain nanofiller
concentrations of 0.1 wt.%, 1 wt.%, 2.5 wt.% and 5 wt.%. Both polymer pellets and
sepiolite powder were dried overnight at 80°C before being compounded.
Tensile test specimens were prepared by compression-moulding nanocomposite
pellets, previously compounded in mini-extruder, at 240 °C for 5 min under a
constant force of 40 kN, followed by a cooling step to room temperature. The
compression-moulding was realised with a Benchtop Press Rondol, and the tensile
test specimens mould was in-house made according to standard dimensions (ASTM
D-638).
8.2.3 Nanocomposites Characterisation
Morphological Analysis
Morphological studies were carried out using a Jeol JSM-6300F Scanning Electron
Microscope (SEM), on gold-coated, cold-fractured samples. The surface analysed
was the cross-section of the tensile test specimens and the brittle fracture was
191
Page 192
CHAPTER 8 – Polyamide 6 / Sepiolite Nanocomposites
obtained after immersion in liquid nitrogen. Transmission Electron Microscopy
(TEM) analyses were realised with a Jeol JEM 2010 microscope, on ultra-thin
samples obtained by a microtome.
WAXS
X-ray diffraction photographs were taken using the Cu Kα radiation, generated with
a RINT-2000 (Rigaku Co.), at 40 kV and 20 mA. The distance between sample and
detector was 37.5 mm.
DSC
Non-isothermal crystallization analyses were performed with a Differential Scanning
Calorimeter (DSC) Mettler-Toledo 822e. All samples (~4 mg) were firstly heated to
250 °C and kept at that temperature for 5min to remove any thermal history and then
cooled at a rate of 10 K/min to analyse non-isothermal crystallisation behaviour. A
successive scan at 10 K/min until 250 °C was utilised to study the melting of the
composite samples and the overall crystallinity, given that the heat of fusion for the
completely crystalline PA6 is 240 J/g.
TGA
Thermo Gravimetric Analyses were performed with a TA instrument Q500 on about
10mg samples cut from tensile test specimens. The test was performed at a scanning
rate of 20 K/min up to 900 °C, under inert atmosphere (N2) conditions.
Tensile Tests
Tensile tests were conducted in a universal testing machine (Instron 5584), equipped
with a 1 kN load cell, standard grips and Merlin software, according to the standard
ASTM D-638. The test specimens were dog-bone shaped with a length of 60 mm and
a thickness of 1 mm, according to the type V dimensions indicated by the same
standard.
192
Page 193
CHAPTER 8 – Polyamide 6 / Sepiolite Nanocomposites
8.3 Results and Discussion
8.3.1 Morphological Analysis
As already stated in previous chapters, a good dispersion of the nanofiller into the
polymeric matrix is precondition to an efficient reinforcement.
a)
b)
c)
d)
e)
f)
Figure 8.1. SEM micrographs of: a)-b) PP+1%Sep, c)-d) PP+2.5%Sep, e)-f)
PP+5%Sep, at magnification of 5000 and 10000 times respectively. A good
dispersion of sepiolite nanoclays is evident even at relative high filler content.
193
Page 194
CHAPTER 8 – Polyamide 6 / Sepiolite Nanocomposites
In this paragraph a series of SEM and TEM micrographs are presented in order to
discuss the morphology of PA6/sepiolite nanocomposites. Figure 8.1.a-f refers to
cold fractured surfaces of nanocomposites samples with different filler
concentrations (1 % to 5 %). Two magnifications are presented for each
concentration (5000 and 10000 times). We can observe an excellent distribution of
inorganic filler in its finest elemental units even at concentration as high as 5 % in
weight.
Figure 8.2, instead, shows two TEM micrographs of the PA6+5%Sep
nanocomposite. Even at the high magnifications obtained by Transmission Electron
Microscopy, no indication of nano-filler aggregation is present.
a) b)
Figure 8.2. TEM micrographs of PA6/sepiolite nanocomposites with 5 wt.% of filler
at different magnifications.
We can conclude that polyamide 6 is a promising polymeric matrix for dispersing
sepiolite nanoclays even at relative high concentrations of filler and without the need
to employ specific surface functionalisations or compatibilisers, which was the case
194
Page 195
CHAPTER 8 – Polyamide 6 / Sepiolite Nanocomposites
for polypropylene (Chapter 6). The polarity of PA6 can account for its compatibility
with hydrophilic nanoclays, such as sepiolite.
8.3.2 Non-Isothermal Crystallisation
In this section the influence of sepiolite concentration on the non-isothermal
crystallisation behaviour of PA6 is studied. Figure 8.3 presents the DSC traces
relative to the first cooling scan of PA6 and his nanocomposites.
140 160 180 200 220
Exo
10% Sep
5% Sep
2.5% Sep
1% Sep
PA6
Heat
Flo
w [W
g-1]
Temperature [°C]
Figure 8.3. DSC crystallisation peaks of PA6/sepiolite nanocomposites at different
filler concentrations.
All the nanocomposites samples have higher crystallization temperatures (Tc) than
the pure PA6 sample, which can be attributed to a nucleating effect induced by the
nanoclay [3-5]. With regards to the effect of clay concentration, it is noticed that the
195
Page 196
CHAPTER 8 – Polyamide 6 / Sepiolite Nanocomposites
crystallisation temperature of the polymer slightly decreases with increasing amount
of the filler. The explanation of this behaviour is that the introduction of more
particles hinders chain mobility and retards crystal growth [3].
Figure 8.4 shows the effect of addition of sepiolite on the melting of polyamide
matrix as taken from the second heating scan.
180 200 220 240
Endo
10% Sep
2.5% Sep
5% Sep
1% Sep
PA6
Heat
Flo
w [W
g-1]
Temperature [°C]
Figure 8.4. DSC melting peaks of PA6/sepiolite nanocomposites at different filler
concentrations.
For neat PA6, only one endothermic peak is observed at 221 °C. A second peak at
lower temperature (215 °C) appears, as a shoulder to the first peak, when clays are
added to the matrix. The formation of this second peak has been associated, by
several authors, to a less stable crystalline phase (γ phase) of PA6 [6-8]. The lower
melting point of the γ-phase is believed to be due to the lower crystalline density and
increased entropy of melting compared to the α-phase [9]. Although this hypothesis
196
Page 197
CHAPTER 8 – Polyamide 6 / Sepiolite Nanocomposites
is realistic, the appearance of low temperature melting peaks as well as broadening
effects has also been ascribed to changes in crystallite thickness and its distribution
[3]. Integrating the endothermic peaks of Fig. 8.4 and taking the heat of fusion for
the completely crystalline PA6 as 240 J/g [3], the sample crystallinity was calculated
and reported in Figure 8.5.
0 2 4 6 8 1025
26
27
28
29
30
31
32
33
34
35
X c [%
]
Filler wt [%]
Figure 8.5. Amount of crystalline phase for PA6/sepiolite nanocomposites. The heat
of fusion for the completely crystalline PA6 is taken as 240 J/g [3]. Virgin PA6 is
presented, for comparison, as open circle, while full squares refers to processed
samples.
The addition of clay results in a minor decrease in crystallinity, when compared with
the processed PA6. The presence of high concentrations of sepiolite prevents the
formation of large crystalline regions due to spatial hindrance and to specific
interaction between polymer and filler. This leads to smaller crystallite structures and
197
Page 198
CHAPTER 8 – Polyamide 6 / Sepiolite Nanocomposites
less perfect crystalline lamella. Such imperfections may also explain the lower
melting points observed for the nanocomposites (Fig.8.4).
8.3.3 WAXS - PA6 Crystal Structure
Nanocomposite samples were also analysed with the WAXS technique in order to
validate hypotheses made by the study of the DSC thermograms in the previous
paragraph. 2D wide-angle X-ray measurements have been taken in the through
direction, shown schematically in Figure 8.6, on tensile test dog-bone specimens.
X-ray
Figure 8.6. Scheme of WAXS measurements in the through direction.
The results of the measurements are shown in Figure 8.7. For neat PA6 (Fig.8.7.a),
two main diffraction rings were observed at 2θ ~ 20 ° and 23.7 ° which are
commonly associated, respectively, with the (200) and (002/202) crystal planes of
the α-phase of polyamide 6 [9-11]. The α-phase population was the dominant
crystalline phase in virgin PA6.
At relative smaller angles (2θ ~ 7.2 °), the typical basal diffraction of sepiolite clays
was observed for PA6/sepiolite nanocomposite samples (see also Chapter 5 and 7),
with the intensity increasing with clay concentration (Fig.8.7.b-c).
Two new diffraction rings also appeared, with addition of sepiolite, at 2θ ~ 10.7 °
and 21.3 ° (Fig.8.7.b-c). The latter two were attributed to the (020) and (002) crystal
planes of the γ-phase, respectively. Therefore, the addition of clay induced the
formation of a different crystal form of polyamide 6 (γ-phase) as was also suggested
from the DSC results (Fig.8.4).
198
Page 199
CHAPTER 8 – Polyamide 6 / Sepiolite Nanocomposites
a) b)
c)
(200)α (002/202)α
(002)γ
(020)γ
(100)clay
Figure 8.7. WAXS through view: a) PA6, b) PA6+1%Sep, c) PA6+5%Sep. White
arrows show the principal diffraction rings with the corresponding crystal planes.
The stabilisation of γ crystal phase in PA6 has already been reported by early
investigations on platelet-like clays [6, 12]. This phenomenon is particularly
important since a change in crystal structure may affect physical and mechanical
properties of the polymeric matrix. Ito et al. [13] showed that the stiffness of the α-
phase is higher than the γ-phase below the glass transition temperature, but it
decreases more rapidly at higher temperatures. This results in a higher heat distortion
temperature of the γ-phase. The same authors [13] also reported that the draw ratio
199
Page 200
CHAPTER 8 – Polyamide 6 / Sepiolite Nanocomposites
achieved for PA6 fibres drawn at temperature between 110 °C and 180 °C is higher
if the crystal is in the γ-form.
It is worthy mentioning that the complex crystallinity and polymorphism of PA6/clay
nanocomposites may not necessary be induced only by the presence of clays. Zapata-
Espinosa et al. [14] found that the molecular weight was the main cause of the
thermal behaviour of in situ polymerised PA6/clay hybrids, with a minimum
influence of clay concentration and molecular orientation. Moreover it is well known
that the crystal structure obtained when PA6 is crystallised from the melt is
influenced, among others, by thermal conditions, applied stress, presence of moisture
and additives. For instance, rapid cooling and low crystallisation temperature
promote the γ-form of PA6, while higher crystallisation temperature and slow
cooling leads to the α-form [15-18].
WAXS measurements have also been taken in the edge direction, as schematically
shown in Figure 8.8, on tensile test dog-bone specimens and are presented in Figure
8.9.
X-ray
Figure 8.8. Scheme of WAXS measurements in the edge direction.
Similar conclusions can be drawn, from the edge view WAXS experiments
concerning the crystal structure. The addition of sepiolite induces the formation of γ-
form of PA6, as evident by the appearance of the two diffraction rings at 2θ ~ 10.7 °
and 21.3 ° (Fig. 8.9.b-c).
200
Page 201
CHAPTER 8 – Polyamide 6 / Sepiolite Nanocomposites
a) b)
c)
(100)clay
(100)clay
Figure 8.9. WAXS, edge view: a) PA6, b) PA6+1%Sep and c) PA6+5%Sep. White
arrows shows orientation of sepiolite, as can be seen from the diffraction at 2θ ~ 7.2 °.
It is interesting to observe the basal diffraction of the sepiolite, at 2θ ~ 7.2 °. The full
ring, still present in the through view (Fig. 8.7.b-c), was transformed in two arc-like
diffractions along the equatorial direction. This phenomenon can be explained by
partial orientation of sepiolite nano-clays in the longitudinal plane of the specimen.
In order to better visualise the results obtained from WAXS investigation, a 3D
rendering of a tensile test specimen is provided in Figure 8.10.
201
Page 202
CHAPTER 8 – Polyamide 6 / Sepiolite Nanocomposites
a)
b)
Figure 8.10. Schematic 3D image of a nanocomposite tensile test specimen where
the nanofiller is aligned in-plane. Sepiolite nano-fibres are represented in white and
are not in scale with the specimen dimensions. The real length of sepiolite clay is
about 4000 times smaller than in the picture.
The top view (Fig. 8.10.a) represents a completely random orientation of the fibre-
like filler, while the edge view (Fig. 8.10.b) shows how sepiolite clays are
preferentially oriented in-plane with the sample. This particular micro-structure is the
result of the sample preparation method employed that, as already mentioned,
involves compression moulding of pre-compounded nanocomposite pellets.
202
Page 203
CHAPTER 8 – Polyamide 6 / Sepiolite Nanocomposites
8.3.4 Thermo Gravimetric Analysis
The thermo gravimetric analyses are presented in Figure 8.11. The pure PA6 sample
and the nanocomposites behave in a very similar fashion in inert atmosphere. The
presence of sepiolite induces a minor delay in the polymer thermal degradation as it
is seen from the small shift of the curves towards higher temperature.
300 400 500 600
0
20
40
60
80
100 PA6 1% Sep 2.5% Sep 5% Sep
Wei
ght L
oss
[%]
Temperature [°C]
Figure 8.11. TGA of PA6/Sep nanocomposites, in inert atmosphere (N2).
A more significant effect is in the final residue at the end of the test, which increases
with the amount of clay. In this way, the actual content of filler can be accurately
obtained, once the thermal degradation of sepiolite itself is taken in account (refer to
Chapter 5). The results are summarised in Table 8.1.
203
Page 204
CHAPTER 8 – Polyamide 6 / Sepiolite Nanocomposites
Table 8.1. Filler content of nanocomposites samples as obtained from TGA.
Nominal filler wt. [%] TGA residue (at 800°C) [%]
PA6+0.1%Sep 0.1 0.40
PA6+1%Sep 1.0 1.45
PA6+2.5%Sep 2.5 2.58
PA6+5%Sep 5.0 5.23
8.3.5 Mechanical Properties
The tensile mechanical performances of PA6 nanocomposites are displayed in Figure
8.12 by representative stress-strain curves.
0 10 20 30 40 500
10
20
30
40
50
60
70
80
90
100
110
120
Stre
ss [M
Pa]
Strain [%]
PA6 PA6+0.1% Sep PA6+1% Sep PA6+2.5% Sep PA6+5% Sep
Figure 8.12. Stress-strain curves of PA6/Sep nanocomposites at different filler
loadings.
204
Page 205
CHAPTER 8 – Polyamide 6 / Sepiolite Nanocomposites
Figure 8.13 and 8.14 show the reinforcement effect of different sepiolite loadings in
polyamide 6, in terms of enhancement of Young’s modulus and tensile stress.
0 1 2 3 4 5 62.5
3.0
3.5
4.0
4.5
5.0
5.5
Youn
g's
Mol
udus
[GPa
]
Filler wt. [%]
Figure 8.13. Young’s modulus of PA6/sepiolite nanocomposites as a function of the
filler loading.
0 1 2 3 4 5 675
80
85
90
95
100
105
110
UTS
[MPa
]
Filler wt. [%]
Figure 8.14. Ultimate tensile stress of PA6/sepiolite nanocomposites as a function of
the filler loading.
205
Page 206
CHAPTER 8 – Polyamide 6 / Sepiolite Nanocomposites
Both stiffness and strength increase proportionally with filler content up to a
concentration of 5 wt.%. In particular, the stiffness of PA6 showed an increase of 60
% with about 5 wt.% of sepiolite clays. In order to have a term of comparison, a
similar level of reinforcement is obtained with as much as double the content in
weight of glass fibres, according to data sheets from Rhodia on commercial
reinforced PA6 [19]. Moreover the specimens were probably prepared by the
common injection moulding technique, which induces much higher level of filler
orientation and overestimate the filler reinforcement efficiency.
These results are particularly interesting, if compared with the same tests on
PP/sepiolite nanocomposites (Chapter 6). In polypropylene matrix, the reinforcement
induced by the filler was decreasing with increasing sepiolite concentration. For
loadings above 2.5 wt.%, even a reduction of stiffness was shown for some
composite formulations (Fig. 6.13). Instead, in the case of polyamide 6, the
reinforcement efficiency of the filler is high even for relatively high concentrations
of filler. This phenomenon can have two explanations. First, a good level of
dispersion of individual nano-clays is easily achieved in PA6 at concentrations as
high as 5 wt.%, as demonstrated by the SEM and TEM micrographs in Figure 8.1
and 8.2. It is stressed that this result has been obtained by a simple melt-
compounding technique, without any compatibiliser as was necessary for
polypropylene. The second reason is the good compatibility of the polar polyamide 6
and a hydrophilic filler such as sepiolite. Strong hydrogen bonding interactions are
expected to take place between the amide groups of PA6 and the characteristic
hydroxyl groups of the sepiolite [20]. In fact, without an effective interaction
between matrix and reinforcing phase, leading to the formation of an extended
interphase region, the filler mainly acts as an inclusion, decreasing the effective load-
bearing cross-sectional area of the matrix and, as such, reducing the matrix strength.
Finally, the strain at break of different nanocomposites is presented in Figure 8.15.
As often in the case of particle filled thermoplastic, the strain at break decreases with
increase of reinforcing phase. This reduction though is not as dramatic as in the case
of less compatible matrices such as polypropylene. At loading of 5 % in weight of
206
Page 207
CHAPTER 8 – Polyamide 6 / Sepiolite Nanocomposites
sepiolite, PA6 still preserves 1/7th of the initial strain at break, while un-
compatibilised PP completely looses its ductility (Fig 6.9).
0 1 2 3 4 5 60
10
20
30
40
50
St
rain
at b
reak
[%]
Filler wt. [%]
Figure 8.15. Strain at break for PA6/sepiolite nanocomposites in function of the
filler loading.
8.3.6 Micromechanical models
In analogy with previous chapters, the results of the tensile tests will be benchmarked
with relevant results from the scientific literature and interpreted in terms of the
micromechanical models of Halpin-Tsai and Pukanszky, for what concerns,
respectively, the Young’s modulus and ultimate tensile stress.
Table 8.2 lists same information relative to the clays and the sample preparations
employed for PA6 nanocomposites reported in scientific publications [21-24], among
the most cited and influential in the field.
207
Page 208
CHAPTER 8 – Polyamide 6 / Sepiolite Nanocomposites
Table 8.2. Relevant PA6/clay nanocomposites reported in the literature.
Clay Sample Preparation Ref
Type Treatment
1 MMT (USA)1 Ammonium Salt2 Injection Moulding [21]
2 MMT (JP)3 Ammonium Salt2 Injection Moulding [22]
3 MMT1 Ammonium Salt4 Injection Moulding [23]
4 MMT3 - ? [24]
5 Sep - Compression Moulding 5
1 Clay source: Wyoming, USA. Commercial name: Cloisite Na+, by Southern Clay Products. 2 Bis(2-hydroxy-ethyl)methyl tallow ammonium chloride. 3 Clay source: Yamagata, Japan. Commercial name: Kunipia-P, by Kunimine Industries. 4 Methyl, hydrogenated tallow, 2-ethylhexyl ammonium methylsulfate. 5 Data from this thesis.
In particular the data relative to PA6/Sep from this chapter are compared with the
best results (entries 1-2). These refer to melt compounded PA6/MMT
nanocomposites, obtained using organo-modified montmorillonite clays from two
well known mines: Yamagata (Japan) and Wyoming (USA) [21, 22]. The difference
between the two clays is that the former has slightly larger average particle length
and hence aspect ratio.
Young’s Modulus
The Halpin-Tsai equations, already introduced in Chapter 5, are used to interpret the
enhancement in stiffness with the clay content. The increment of nanocomposites
Young’s modulus relative to the matrix modulus is presented Figure 8.16, along with
the model predictions for different clay shape, aspect ratios and degree of orientation.
In order to calculate the filler volume fraction from the weight percent, the density of
PA6, sepiolite and montmorillonite were assumed respectively, 1.14 gcm-3, 2.2 gcm-3
and 2.8 gcm-3. The shape factors relative to fibres (sepiolite) and plates
(montmorillonite) are again in accordance with Paragraph 5.3.5, Chapter 5.
208
Page 209
CHAPTER 8 – Polyamide 6 / Sepiolite Nanocomposites
0.0 0.5 1.0 1.5 2.0 2.5 3.0 3.5
1.0
1.2
1.4
1.6
1.8
2.0
2.2
2.4
2.6
1D, s=45
∞→2D, s
∞→1D, s
1D, s=36
2D, s=50
2D, s=27
PA6/Sep PA6/MMT (USA) [21] PA6/MMT (JP) [22]
E c/Em
Filler vol. [%]
Figure 8.16. Relative Young’s modulus versus filler vol.%. The lines are prediction
from the Halpin-Tsai equations for 2D randomly oriented PA6/Sep nanocomposites
(fibre-like filler; solid line) and uniaxially (1D) oriented PA6/MMT nanocomposites
(plate-like filler; dotted line), using true filler aspect ratios (s) as a fitting parameter.
The condition corresponds to the upper bound predictions of the rule of
mixtures.
∞→s
The PA6/Sep nanocomposites data points lay below the ones relatives to the
PA6/MMT. In first analysis, this could be explained by the higher aspect ratios of
MMT clay. However it must be stressed that the PA6/MMT nanocomposites
specimen are obtained by injection moulding, which induces a higher degree of
orientation of the filler compared to compression moulding, as for PA6/Sep. Solid
lines are the Halpin-Tsai predictions relative to the sepiolite nanocomposites and are
drawn considering an elastic modulus of the clay of 200 GPa (see Paragraph 5.3.4),
and assuming a 2D random distribution of filler. The above hypothesis is supported
209
Page 210
CHAPTER 8 – Polyamide 6 / Sepiolite Nanocomposites
by the WAXS results (see Figure 8.9), which showed a partial in-plane orientation of
sepiolite fibre-like clays. It can be seen that the average aspect ratio of 27 slightly
underestimates the experimental data. A best fit is found for an aspect ratio of around
50. It is very encouraging to notice that the theoretical predictions for fillers of
infinite aspect ratio, corresponding to the rule of mixtures, is not much higher,
indicating that sepiolite in PA6 has a very high reinforcing efficiency.
The dotted lines, instead, are relative to MMT nanocomposites. The platelet-like clay
is assumed to have the same elastic modulus as the sepiolite. In accordance with Ref.
[22], the composite is considered uniaxial (because of the orientation induced by
injection moulding). The fitted aspect ratios are 36 and 45 (for the USA and Japan
mine), which are lower than the values extrapolated from TEM micrographs [22] (57
and 69, respectively) and, more importantly, lower than the values expected from
fully exfoliated MMT clays (100-1000). It is very surprising that the sepiolite aspect
ratio is even higher than the MMT ones. This tells us that MMT are not as efficiently
reinforcing the matrix as predicted from Halpin-Tsai equations.
Tensile Stress
The results of tensile strengths for the PA6/Sep nanocomposites, from Figure 8.14,
can be interpreted in terms of the Pukanszky equation [25, 26], which has already
been introduced in paragraph 6.3.6. In Figure 8.17, tensile stress is plotted with the
nanoclay vol.%. PA6/Sep nanocomposites show a linear correlation. The same is true
for PA6/MMT nanocomposites with the exception of the initial value (σ0) which is
excluded from modelling purposes. This can be explained by the polymer matrix
modification (i.e. enhanced crystallinity or change in crystal phases), induced by the
presence of MMT, which obviously can not be contemplated by the model.
210
Page 211
CHAPTER 8 – Polyamide 6 / Sepiolite Nanocomposites
0.0 0.5 1.0 1.5 2.0 2.5 3.0 3.565
70
75
80
85
90
95
100
105
110
PA6/Sep PA6/MMT (USA) [21] PA6/MMT (JP) [22]
U
TS [M
Pa]
Filler vol. [%]
Figure 8.17. Ultimate tensile stress of PA6/clay nanocomposites in function of the
filler vol.%.
In Figure 8.18, the natural logarithm of the relative tensile stress for PA6/Sep and
PA6/MMT nanocomposites is plotted against the filler vol.%. From the linear fitting
of the experimental data points, a coefficient B can be extracted from the three sets of
experimental data points. It is reminded here that B is a parameter related to the load
carried by the dispersed phase (filler) and depends on interaction filler/matrix (see
Pag. 154). The coefficient B varies between 11 and 13, which can be considered as a
very good result if compared with values obtained for other systems, ranging from
negative values up to about 20 as a maximum [27]. This shows a remarkably good
interaction between PA6 and clay. Moreover, the parameter B relative to PA6/Sep, is
slightly higher that that of the two PA6/MMT nanocomposites. This result is
particularly interesting if compared to the Young’s modulus analysis, for which
211
Page 212
CHAPTER 8 – Polyamide 6 / Sepiolite Nanocomposites
PA6/Sep nanocomposites showed a smaller increase in stiffness with filler content
compared with PA6/MMT (which was explained by a different filler orientation).
0.000 0.005 0.010 0.015 0.020 0.025 0.030
0.00
0.05
0.10
0.15
0.20
0.25
0.30
0.35
0.40
PA6/Sep Melt PA6/MMT(USA) Melt [21] PA6/MMT(JP) Melt [22]
B=12.6
B=11.6
B=13.1
Ln (σ
rel)
Filler Vol. fraction
Figure 8.18. The natural logarithm of relative tensile stress of PA6/Sep and
PA6/MMT nanocomposites in function of the filler vol.%. From the linear fit of the
experimental data, the parameter B can be extracted.
Referring to equation 8.8 and given that the surface area, for exfoliated platelet-like
clay (Paragraph 5.3.2), and the density of MMT is higher than those of sepiolite, the
higher value of the coefficient B must be the consequence of a thicker and stronger
interphase ( l and iσ ) between sepiolite and PA6 rather than montmorillonite and
PA6. This can be explained by the silanol groups present on the sepiolite surface (but
not on MMT), which can strongly interact with the characteristic amide group of
PA6, via hydrogen bonds. For this reason also, no functionalisation was necessary
212
Page 213
CHAPTER 8 – Polyamide 6 / Sepiolite Nanocomposites
for sepiolite while montmorillonite were cation exchanged with quaternary
ammonium salts.
8.4 Conclusions
PA6/sepiolite nanocomposites have been successfully prepared by melt
compounding in a mini-extruder apparatus. The morphology, as investigated by SEM
and TEM, showed a homogeneous dispersion of the nanoclays into the polar
polymeric matrix. According to non-isothermal crystallisation tests conducted with
DSC, sepiolite didn’t nucleate the crystallisation of PA6 and didn’t increase the total
amount of crystallinity (slightly diminished). WAXS confirmed the appearance of γ-
phase crystals, against the more stable α-phase, induced by the presence of sepiolite
in PA6. Edge view X-ray tests also established partial orientation of sepiolite nano-
fibres in the longitudinal plane of tensile test specimen.
Notable enhancements in stiffness and strength were obtained with only little weight
percentage of filler although this was accompanied by a decrease in strain at break.
The mechanical performances were interpreted in terms of two micromechanical
models (Halpin-Tsai and Pukanszky equation) and compared with the results of
PA6/MMT taken from selected literature publications. The better reinforcement in
Young’s modulus induced by the platelet-like clay was attributed to the higher
degree of particle orientation.
Sepiolite, instead, showed a remarkable enhancement in tensile stress, explained by
strong hydrogen bonds between silanols groups on sepiolite surface and the amide
groups of the matrix, which are instead missing in montmorillonite even after surface
functionalisation.
213
Page 214
CHAPTER 8 – Polyamide 6 / Sepiolite Nanocomposites
8.5 References
1. A. Okada, M. Kawasumi, A. Usuki, Y. Kojima, T. Kurauchi, and O.
Kamigaito. Synthesis and properties of nylon-6/clay hybrids. in MRS
Symposium Proceedings. 1990. Pittsburgh.
2. A. Usuki, Y. Kojima, M. Kawasumi, A. Okada, Y. Fukushima, T. Kurauchi,
and O. Kamigaito, Synthesis of Nylon 6-Clay Hybrid. Journal of Materials
Research, 1993. 8(5): p. 1179-1184.
3. T.D. Fornes and D.R. Paul, Crystallization behavior of nylon 6
nanocomposites. Polymer, 2003. 44(14): p. 3945-3961.
4. Y.P. Khanna, R. Kumar, and A.C. Reimschuessel, Memory Effects in
Polymers .3. Processing History Vs Crystallization Rate of Nylon-6
Comments on the Origin of Memory Effect. Polymer Engineering and
Science, 1988. 28(24): p. 1607-1611.
5. Y.P. Khanna, A barometer of crystallization rates of polymeric materials.
Polymer Enginnering and Science, 1990. 30(24): p. 1615-1619.
6. L.M. Liu, Z.N. Qi, and X.G. Zhu, Studies on nylon 6 clay nanocomposites by
melt-intercalation process. Journal of Applied Polymer Science, 1999. 71(7):
p. 1133-1138.
7. K. Varlot, E. Reynaud, M.H. Kloppfer, G. Vigier, and J. Varlet, Clay-
reinforced polyamide: Preferential orientation of the montmorillonite sheets
and the polyamide crystalline lamellae. Journal of Polymer Science Part B-
Polymer Physics, 2001. 39(12): p. 1360-1370.
8. T.C. Li, J.H. Ma, M. Wang, W.C. Tjiu, T.X. Liu, and W. Huang, Effect of
clay addition on the morphology and thermal behavior of polyamide 6.
Journal of Applied Polymer Science, 2007. 103(2): p. 1191-1199.
9. S.M. Aharoni, n-Nylons, their synthesis, structure, and properties. 1997,
Chichester; New York: Wiley. 2259–68.
10. D.R. Holmes, C.W. Bunn, and D.J. Smith, Journal of Polymer Science, 1955.
17: p. 159–77.
214
Page 215
CHAPTER 8 – Polyamide 6 / Sepiolite Nanocomposites
11. N.S. Murthy, Metastable Crystalline Phases in Nylon-6. Polymer
Communications, 1991. 32(10): p. 301-305.
12. Y. Kojima, A. Usuki, M. Kawasumi, A. Okada, Y. Fukushima, T. Kurauchi,
and O. Kamigaito, Mechanical-Properties of Nylon 6-Clay Hybrid. Journal of
Materials Research, 1993. 8(5): p. 1185-1189.
13. M. Ito, K. Mizuochi, and T. Kanamoto, Effects of crystalline forms on the
deformation behaviour of nylon-6. Polymer, 1998. 39(19): p. 4593-4598.
14. A. Zapata-Espinosa, F.J. Medellin-Rodriguez, N. Stribeck, A. Almendarez-
Camarillo, S. Vega-Diaz, B.S. Hsiao, and B. Chu, Complex isothermal
crystallization and melting behavior of Nylon 6 nanoclay hybrids.
Macromolecules, 2005. 38(10): p. 4246-4253.
15. G. Gurato, A. Fichera, F.Z. Grandi, R. Zannetti, and P. Canal, Crystallinity
and Polymorphism of 6-Polyamide. Makromolekulare Chemie-
Macromolecular Chemistry and Physics, 1974. 175(3): p. 953-975.
16. M. Kyotani and Mitsuhas.S, Studies on Crystalline Forms of Nylon-6 .2.
Crystallization from Melt. Journal of Polymer Science Part a-2-Polymer
Physics, 1972. 10(8): p. 1497-&.
17. N.S. Murthy, S.M. Aharoni, and A.B. Szollosi, Stability of the Gamma-Form
and the Development of the Alpha-Form in Nylon-6. Journal of Polymer
Science Part B-Polymer Physics, 1985. 23(12): p. 2549-2565.
18. D.M. Lincoln, R.A. Vaia, Z.G. Wang, B.S. Hsiao, and R. Krishnamoorti,
Temperature dependence of polymer crystalline morphology in nylon
6/montmorillonite nanocomposites. Polymer, 2001. 42(25): p. 9975-9985.
19. http://www.rhodia_ep.com.
20. S.S. Ray and M. Okamoto, Polymer/layered silicate nanocomposites: a
review from preparation to processing. Progress in Polymer Science, 2003.
28(11): p. 1539-1641.
21. T.D. Fornes, P.J. Yoon, H. Keskkula, and D.R. Paul, Nylon 6
nanocomposites: the effect of matrix molecular weight. Polymer, 2001.
42(25): p. 9929-9940.
215
Page 216
CHAPTER 8 – Polyamide 6 / Sepiolite Nanocomposites
22. T.D. Fornes, D.L. Hunter, and D.R. Paul, Effect of sodium montmorillonite
source on nylon 6/clay nanocomposites. Polymer, 2004. 45(7): p. 2321-2331.
23. K. Masenelli-Varlot, E. Reynaud, G. Vigier, and J. Varlet, Mechanical
Properties of Clay-Reinforced Polyamide. Journal of Polymer Science, Part
B: Polymer Physics, 2002. 40: p. 272-283.
24. N. Hasegawa, H. Okamoto, M. Kato, A. Usuki, and N. Sato, Nylon 6/Na–
montmorillonite nanocomposites prepared by compounding Nylon 6 with Na–
montmorillonite slurry. Polymer, 2003. 44: p. 2933–2937.
25. B. Pukánszky, B. Turcsányi, and F. Tüdős, Effect of Interfacial Interaction on
the Tensile Yield Stress of Polymer Composites, H. Ishida, Editor. 1988,
Elsevier: New York. p. 467-477.
26. B. Turcsanyi, B. Pukanszky, and F. Tudos, Composition Dependence of
Tensile Yield Stress in Filled Polymers. Journal of Materials Science Letters,
1988. 7(2): p. 160-162.
27. L. Szazdi, A. Pozsgay, and B. Pukanszky, Factors and processes influencing
the reinforcing effect of layered silicates in polymer nanocomposites.
European Polymer Journal, 2007. 43(2): p. 345-359.
216
Page 217
9 In Situ Polymerised Polyamide 6 /
Sepiolite Nanocomposites
9.1 Introduction
After the successful preparation and characterisation of PA6/sepiolite
nanocomposites obtained by simple and industrial-friendly melt compounding
method (Chapter 8), this chapter will present two different nanocomposites formed
by in situ polymerisation [1, 2] of PA6 polymerised either in presence of unreactive
pristine sepiolite or grafted from amino-silane functionalised sepiolite. These
represent two distinct model cases, differing in the interfacial interactions between
matrix/filler. It will be demonstrated how the interphase is crucial for the final
properties of the nanocomposite.
9.2 Experimental
9.2.1 Materials
Two different sepiolite nanoclays were employed: a natural sepiolite (Pangel®) and
an aminopropyltriethoxysilane (Dynasylan HS2909 from Degussa) functionalised
sepiolite, both supplied by Tolsa (Spain). They will respectively be referred to as Sep
217
Page 218
CHAPTER 9 – In-Situ Polymerised PA 6 / Sepiolite Nanocomposites
and Sep-NH2, from now on in this chapter. The silanisation of the nanoclay was
carried out by Tolsa following a reported procedure [3] and the amount of surface
functionalisation was quantified in 3 wt.%, from which it can be calculated a
concentration of 0.26 nmol of primary amine groups per gram of clay. Independent
researchers have disclosed that the silanes bonding covalently bonded through
condensation reaction with the silanol groups on the surface of sepiolite, were about
30 % while the rest was simply adsorbed [4, 5].
For the polymerisation reaction, the monomer (ε-caprolactam 99 %) and the initiator
(1-hexadecylamine) were purchased from Aldrich, while the catalyst (Phosphinic
Acid H3PO2) was purchased from Fluka. They were all used as received. The
commercial PA6 used for the compounding was the Technyl® C206 from Rhodia.
9.2.2 Masterbatches Preparation - Polymerisation
Two masterbatches, with 20 wt.% inorganic phase, were produced by in situ
polymerisation of ε-caprolactam in presence of pristine and amino functionalized
sepiolite. A typical procedure involved drying about 4 g of Sep-NH2 at 100 °C
overnight, followed by drying under vacuum at room temperature for 24 hours to
avoid the presence of water that could hydrolyse the monomer. 16g of ε-caprolactam
were added to the clays together with 0.037 ml of the catalyst H3PO2 (Mw= 66,
d=1.21 g/ml), in a ratio of 0.25 mol% relative to the monomer. The mixture, in a
sealed glass vessel and under vacuum, was initially heated up to 100 °C, in an oil
bath, for 1 hour and vigorously stirred to obtain a homogeneous suspension. The
polymerisation was carried out at 250 °C for 24 hours. In the case, above, of the
amino functionalised sepiolite the polymerisation is initiated directly from the
primary NH2 groups on the surface of the clay and thus can be described as a grafted-
from polymerisation.
For pristine sepiolite, the polymerisation was carried out following a similar method
as above. However, as unfunctionalised sepiolite doesn’t possess any chemical
groups able to initiate the polymerisation of ε-caprolactam, an external primary
amine, 1-hexadecylamine (Mw= 241), was introduced. The amount of initiator was
218
Page 219
CHAPTER 9 – In-Situ Polymerised PA 6 / Sepiolite Nanocomposites
0.25 g for 16 g of monomer, which is equivalent to the moles of clay-bound amine in
the Sep-NH2 case.
All solid samples obtained from the above polymerisations were subsequently
pulverised at cryogenic temperature (in liquid N2) and unreacted caprolactam and
higher oligomers were removed by subsequent washing with hot distilled water (90
°C) for 24 hours.
The in situ polymerised PA6/Sep-NH2 masterbatch was subjected to washing with 99
% Formic Acid in order to roughly estimate the amount of grafted PA6 chains on the
sepiolite. 3 g of the composite were added to 80 ml of solvent followed by
centrifugation of the suspension to eliminate the supernatant. The procedure
described above was repeated three times, after which the weight percent of
inorganic was evaluated by TGA.
9.2.3 Masterbatches Dilution - Melt Compounding
The two masterbatches, previously prepared by in situ polymerisation, were diluted
with neat commercial PA6 to obtain nanofiller concentrations of 0.1 wt.%, 1 wt.%,
2.5 wt.%, 3 wt.% and 5 wt.%. The different nanocomposites were prepared by means
of a mini twin-screw extruder DSM Micro 15, operating at 200 rpm of screw speed
for 10 min at a temperature of 240 °C. Nitrogen gas was purged in the mixing
chamber during compounding in order to minimise the polymer degradation.
Polymer pellets and the in situ polymerised masterbatches powders were dried
overnight at 80 °C before compounding.
9.2.4 Nanocomposites Characterisation
Gel Permeation Chromatography (GPC)
GPC sample preparation and tests were performed by RAPRA on the commercial
PA6, the in situ masterbatches, and the nanocomposites prepared after dilution of the
masterbatches. The solvent used was 1,1,1,3,3,3-hexafluoro-2-propanol (HFIP). The
219
Page 220
CHAPTER 9 – In-Situ Polymerised PA 6 / Sepiolite Nanocomposites
test specimen consisted of 5-10 mL of solution with a polymer concentration of
approximately 2 mg/mL. Solutions were left overnight and, after thorough mixing,
filtered through a 0.45 µm PTFE filter. A refractive index detector was used and the
data were collected and analysed with the Polymer Laboratories ‘Cirrus’ software.
The GPC set-up was calibrated with polymethylmethacrylate (PMMA) and the
results are expressed as ‘PMMA equivalent’ molecular weight. Samples are run in
duplicates.
TGA
Thermo Gravimetric Analyses were performed with a TA Instrument Q500 on
samples of about 10 mg. The test was performed at a scanning rate of 20 K/min up to
1000 °C, in inert (N2) or oxidative (air) atmosphere.
Morphological Analysis
Morphological studies were carried out using a Jeol JSM-6300F Scanning Electron
Microscope, on gold-coated, cold-fractured samples. The surface analysed was the
cross-section of the tensile test specimens and a brittle fracture was induced after
immersion, for sufficient time, in liquid nitrogen. Transmission Electron Microscopy
(TEM) analyses were also performed with a Jeol JEM 2010 instrument, on ultra-thin
samples obtained by ultra-microtome.
DSC
Non-isothermal crystallization analyses were performed with a Differential Scanning
Calorimeter (DSC), Mettler-Toledo 822e. All samples (~4 mg) were firstly heated to
250 °C and kept at that temperature for 5 min, to remove any previous thermal
history, and then cooled at a rate of 10 K/min to analyse non-isothermal
crystallisation behaviour. A successive scan at 10 K/min until 250 °C was utilised to
study the melting of the composite samples and the overall crystallinity, given that
the heat of fusion for the completely crystalline PA6 is 240 J/g.
220
Page 221
CHAPTER 9 – In-Situ Polymerised PA 6 / Sepiolite Nanocomposites
Tensile Tests
Tensile tests were conducted in a universal testing machine (Instron 5584), equipped
with a 1 kN load cell, standard grips and Merlin software, according to the standard
ASTM D-638. The test specimens were dog-bone shaped with a length of 60 mm and
a thickness of 1 mm, according to the type V dimensions indicated by the same
standard. At least 10 specimens have been tested for each sample and the average
values and standard deviations calculated. Specimens were obtained by compression
moulding at 240 °C with a Rondol bench press and were dried at 80 °C under
vacuum overnight before being tested. The toughness of the specimens was
estimated by the integration of the area of the force-displacement tensile tests curves.
DMA
Dynamic Mechanical Analyses were carried out with a TA Instrument DMA Q800,
in tensile mode, equipped with film/tape clamps. The specimen were nanocomposite
tapes of dimensions 40x3x0.1 mm3, cut from thin films obtained by compression
moulding at 240 °C with a Rondol bench press. The tests were performed at a
heating rate of 3 K/min and constant frequency of 1 Hz. The specimens were dried at
80 °C under vacuum overnight before being tested.
9.3 Results and Discussion
9.3.1 Gel Permeation Chromatography
Table 9.1 summarises the results of the GPC tests on the commercial PA6, the two in
situ masterbatches and the nanocomposites obtained by dilution of the masterbatches
with commercial PA6. The commercial PA6 from Rhodia presents a Mw of about
55000 g/mol, which can be considered as a normal value for this polyamide. The in
situ PA6+20%Sep-NH2 has a molecular weight which is slightly smaller
(Mw=47000) than that of the commercial PA6 but very close to it, while the in situ
PA6+20%Sep masterbatch Mw is only half of it. The reason for such a small value is
221
Page 222
CHAPTER 9 – In-Situ Polymerised PA 6 / Sepiolite Nanocomposites
attributed to a comparatively much higher number of NH2 groups initiating the
polymerisation. It is reminded here that the in situ PA6+20%Sep masterbatch is
initiated by an amount (in mole) of 1-hexadecylamine equivalent to the moles of
primary amines available on the functionalised clays, which instead directly initiated
the polymerisation of the in situ PA6+20%Sep-NH2 masterbatch. It may well be that
1-hexadecylamine is a more efficient initiator than the primary amines attached on
the clay surface and/or that the number of active primary amino groups on the
functionalised sepiolite are overestimated since a part of them might be shielded in
the clay coating layer and be inaccessible to the initiation of ε-caprolactam. The
higher amount of the monofunctional initiator results in an imbalance of end groups
(NH2 and COOH) that have to undergo a condensation reaction, which consequently
limits the molecular weight obtainable in a linear polymer as PA6 [6].
Table 9.1. GPC results of molecular weight averages (Mw and Mn) and
polydispersity (Mw/Mn) of the commercial PA6, the two in situ masterbatches, and
the nanocomposites obtained after dilution of the masterbatches with commercial
PA6. Samples are run in duplicates.
Sample Run No Mw [g/mol] Mn [g/mol] Mw/Mn
Commercial PA6 1 54800 25700 2.1
2 54900 25600 2.1
In situ PA6+20%Sep 3 26700 10800 2.5
4 26200 10400 2.5
In situ PA6+20%Sep-NH2 5 46700 20200 2.3
6 47100 20400 2.3
In situ PA6+3%Sep 7 48100 21900 2.2
8 47700 21800 2.2
In situ PA6+3%Sep-NH2 9 51700 23600 2.2
10 52000 24000 2.2
Nevertheless, the difference in molecular weight between the two masterbatches is
almost annulled after compounding with commercial PA6. For instance the in situ
222
Page 223
CHAPTER 9 – In-Situ Polymerised PA 6 / Sepiolite Nanocomposites
PA6+3%Sep and in situ PA6+3%Sep-NH2 nanocomposites have a very close value
of Mw and the same polydispersity (Mw/Mn). This observation is very important
since it excludes that differences in physical/mechanical properties of in situ
polymerised nanocomposites are caused by different molecular weight and molecular
weight distribution and it allows simple comparisons and discussions.
9.3.2 TGA – Estimation of Inorganic Residue and
Purification of In Situ Masterbatches
As explained earlier, two masterbatches have been produced by in situ
polymerisation. In the case of Sep-NH2, the polymerisation is initiated by the amino
groups attached (or adsorbed) on the clay, from which the polymer chains grow.
100 200 300 400 500 600 700 800 900 1000
20
40
60
80
100
3rd extraction 2nd extraction 1st extraction PA6+20% Sep-NH2
Mas
s [%
]
Temperature [°C]
Figure 9.1. TGA of in situ PA6/Sep-NH2 masterbatch as produced and after three
successive extractions in formic acid (from bottom to top).
223
Page 224
CHAPTER 9 – In-Situ Polymerised PA 6 / Sepiolite Nanocomposites
The amount of covalently bonded PA6 can be roughly estimated by thermo
gravimetric analysis. In Fig. 9.1, the TGA traces of the PA6/SepNH2 masterbatch
subjected to three consecutive washings in formic acid are presented.
Most of the adsorbed, non-covalently linked PA6 chains are probably extracted by
the solvent with the first washing. The amount of inorganic residue stabilises at about
64 wt.%, after the third washing. If it is taken into account that the initial
concentration of inorganic in the PA6/20%Sep-HN2 masterbatch is about 20 %, the
organic grafted to the sepiolite is evaluated in about 11 wt.%. This value comprises
the silane surface functionalisation and the polyamide chains.
The polymerisation of ε-caprolactam to polyamide 6 never goes to completion since
it is an equilibrium reaction [6]. This means that in the course of the process, the
system reaches a point where the concentration of reactants (ε-caprolactam) is in
equilibrium with the concentration of products (polyamide 6) or, in other words, the
rate of the forward reaction is equals to the rate of the reverse reaction.
100 200 300 400 500 600
20
40
60
80
1007 %
Mas
s [%
]
Temperature [°C]
Before Extraction After Extraction
Figure 9.2. TGA in inert atmosphere (N2) of in situ PA6/20%Sep-NH2 masterbatch,
before (solid line) and after (broken line) purification in hot distilled water.
224
Page 225
CHAPTER 9 – In-Situ Polymerised PA 6 / Sepiolite Nanocomposites
An amount of 7-10 wt.% of ε-caprolactam is typically found after the polymerisation
reaction. It is common practise in the nylon industry to extract this unreacted
monomer and reuse it. Taking advantage of the reverse reaction also forms the basis
for the recycling of PA6 by de-polymerisation into ε-caprolactam [7-9]. In this study,
the unreacted monomer in the in situ polymerisation is extracted by hot water and
evaluated by TGA. Fig. 9.2 shows the temperature scans of the PA6/Sep-NH2
masterbatch before and after monomer extraction. In the polymerised compound
before washing, a first step is evident at about 200 °C in the TGA scan, which is
attributed to the degradation/volatilisation of the monomer still present (but also
partially to water). After purification, however, the step almost disappears. This
confirms that the hot water extraction is a simple and viable method to eliminate ε-
caprolactam from the polymer.
In table 9.2, an estimation of the monomer content in the two masterbatches, before
and after purification, is given as a result of the TGA results in oxidative and inert
atmosphere.
Table 9.2. Monomer content in the in situ polymerised masterbatches, PA6/Sep and
PA6/Sep-NH2, before and after extraction in hot water.
Before Purification After Purification
PA6/Sep PA6/Sep-NH2 PA6/Sep PA6/Sep-NH2
N2 Air N2 Air N2 Air N2 Air
Monomer wt. [%]
7.5
8.4
6.7
7.8
2.5
3.2
1.3
1.4
Following the polymerisation and monomer extraction, the two in situ masterbatches
were diluted, by melt compounding with a commercial PA6, to nominal
concentrations of filler of 0.1, 1, 2.5 and 5 wt.%. The real filler content though was
estimated by the inorganic residue after TGA tests. The results are presented in Table
9.3.
225
Page 226
CHAPTER 9 – In-Situ Polymerised PA 6 / Sepiolite Nanocomposites
Table 9.3. Filler content of the different nanocomposites, calculated by the residue of
inorganic phase after TGA tests.
Nominal Filler Content
wt. [%]
TGA Residue (at 900°C)
wt. [%]
In situ PA6+0.1%Sep 0.1 0.75
In situ PA6+1%Sep 1 1.75
In situ PA6+2.5%Sep 2.5 3.35
In situ PA6+5%Sep 5 5.15
In situ PA6+0.1%Sep-NH2 0.1 0.9
In situ PA6+1%Sep-NH2 1 1.7
In situ PA6+2.5%Sep-NH2 2.5 2.95
In situ PA6+5%Sep-NH2 5 5.15
9.3.2 Morphological Analysis
It has already been shown earlier in this thesis how important is the level of
nanofiller dispersion on the final properties of the nanocomposite. The morphology
of the nanocomposites obtained by dilution of the two in situ polymerised
masterbatches is discussed in this paragraph based on SEM and TEM micrographs.
Figure 9.3.a-d, refers to SEM pictures of cold fractured surfaces of the in situ
PA6+5%Sep and in situ PA6+5%Sep-NH2 nanocomposites. In both samples, the
sepiolite (white spots) appears perfectly dispersed in the polymeric matrix (dark
areas). There is a striking difference between the two sets of pictures, though,
specifically the size of the sepiolite particles. It is reminded here that the pictures are
taken from the cross-sectional area of tensile tests specimens. The needle-like
sepiolite clays are sticking out of the plane of the picture in different directions. Most
of the clay particles, in these SEM micrographs, show circular shapes that represent
the projection of the nano-needles in the plane of the cross-section. The bright spots
in the pictures give an approximate but realistic indication of the diameter of the
sepiolite. If Fig.9.3.a is compared with Fig. 6.1.e (Chapter 6), it seems that PA6
226
Page 227
CHAPTER 9 – In-Situ Polymerised PA 6 / Sepiolite Nanocomposites
nanocomposites have a higher filler concentration than PP nanocomposites, although
this is denied by TGA results (Table 9.3). This can be explained by a better
interfacial interaction PA6/Sep rather than PP/Sep. A coating layer of PA6 forms on
sepiolite surface, which makes the sepiolite nanofibres appear bigger and smoother
in PA6/Sep nanocomposites rather than in PP/Sep nanocomposites.
a)
b)
c) d)
Figure 9.3. SEM micrographs of: a)-b) In situ PA6+5%Sep and c)-d) In situ
PA6+5%Sep-NH2, at magnifications respectively of 10000 (left column) and 50000
times (right column).
In the case of in situ PA6/Sep-NH2 (Fig.9.3.d), the diameters of the nano-clays
appear to be more than double the size of those in the in situ PA6/Sep
nanocomposites. This can be explained by the sizing agent of the Sep-NH2 and, more
importantly, by the PA6 chains grafted on the clays.
In Figure 9.4, the TEM micrographs of in situ PA6+5%Sep-NH2 nanocomposites are
also presented. The dispersion of sepiolite is at the level of individual nano-clays, as
already anticipated by the SEM pictures (Fig. 9.3). Moreover, a good interface
227
Page 228
CHAPTER 9 – In-Situ Polymerised PA 6 / Sepiolite Nanocomposites
matrix/filler can be seen with the polymer wetting the sepiolite and forming a low
contact angle.
a) b)
c) d)
Figure 9.4. TEM micrographs of in situ PA6+5%Sep-NH2.
9.3.3 Crystallisation Behaviour
The different nanocomposites based on the two in situ masterbatches were subjected
to DSC tests in order to study the crystallisation and the melting behaviour. The main
results are summarised in Table 9.4. The degree of crystallinity is calculated from the
melting heat (∆Hm), according to the following equation:
cm
c fHH
X ×∆∆
=0
Equation 9.1
Where =240 J/g is the melting enthalpy of 100 % crystalline PA6 [10] and is
a factor that takes in account the excluded mass of inorganic that doesn’t melt. For
0H∆ cf
228
Page 229
CHAPTER 9 – In-Situ Polymerised PA 6 / Sepiolite Nanocomposites
instance, is 0.95 for a 5 wt.% nanocomposite. It can be concluded that there are
no significant variations either in the degree of crystallinity or in the temperature of
crystallisation (T
cf
c) between different concentrations of natural or functionalised
sepiolite.
Table 9.4. Summary of the crystallinity and temperature of crystallisation of the in
situ PA6 nanocomposites.
Sample ∆Hm [J/g] Xc [%] Tc [°C]
PA6 75.6 31 193
PA6+0.1%Sep 75.5 31 193
PA6+1%Sep 75.3 31 193
PA6+2.5%Sep 75.6 31 193
PA6+5%Sep 72.6 30 193
PA6+0.1%Sep-NH2 73.8 31 192
PA6+1%Sep-NH2 75.1 31 193
PA6+2.5%Sep-NH2 77.6 32 193
PA6+5%Sep-NH2 74.5 31 193
9.3.4 Mechanical Properties
The tensile tests of the PA6 nanocomposites, obtained from the two in situ
masterbatches, are displayed in Fig. 9.5 by representative stress-strain curves.
The mechanical properties are summarised in Fig. 9.6-9.9, showing the Young’s
modulus, ultimate tensile stress, strain at break and toughness of the nanocomposites.
As often found in the literature and in this thesis, the presence of sepiolite generally
enhances the stiffness and tensile strength of the polymeric matrix, reducing,
however, the strain at break and the toughness. The stiffness and strength of the in
situ PA6/Sep and in situ PA6/Sep-NH2 nanocomposites are very similar, and the
values slightly diverge only for higher filler content (Fig. 9.6-9.7).
229
Page 230
CHAPTER 9 – In-Situ Polymerised PA 6 / Sepiolite Nanocomposites
a)
0 10 20 30 40 50-10
0102030405060708090
100110120
St
ress
[MPa
]
Strain [%]
PA6 PA6+0.1% Sep PA6+1% Sep PA6+2.5% Sep PA6+5% Sep
b)
0 10 20 30 40 500
10
20
30
40
50
60
70
80
90
100
110
120
Stre
ss [M
Pa]
Strain [%]
PA6 PA6+0.1% Sep-NH2 PA6+1% Sep-NH
2 PA6+2.5% Sep-NH2 PA6+5% Sep-NH2
Figure 9.5. Stress-strain curves of: a) In situ PA6/Sep and b) In situ PA6/Sep-NH2
nanocomposites, at different nominal filler loadings.
230
Page 231
CHAPTER 9 – In-Situ Polymerised PA 6 / Sepiolite Nanocomposites
0 1 2 3 4 52.5
3.0
3.5
4.0
4.5
5.0
5.5
Youn
g's
Mol
udus
[GPa
]
Filler wt. [%]
In-Situ PA6 / Sep In-Situ PA6 / Sep-NH2
Figure 9.6. Elastic Moduli for in situ PA6/Sep and PA6/Sep-NH2 nanocomposites at
different filler loadings.
0 1 2 3 4 575
80
85
90
95
100
105
110
115
UTS
[MPa
]
Filler wt. [%]
In-Situ PA6 / Sep In-Situ PA6 / Sep-NH2
231
Page 232
CHAPTER 9 – In-Situ Polymerised PA 6 / Sepiolite Nanocomposites
Figure 9.7. Ultimate tensile stress for in situ PA6/Sep and PA6/Sep-NH2
nanocomposites at different filler loadings.
Main differences between the two nanocomposites appear, however, in the strain at
break and the toughness. The nanocomposites obtained from the functionalised
sepiolite (Sep-NH2) fails at higher elongations than the nanocomposites from pristine
sepiolite (Sep), as show in Figure 9.8. It is stressed at this point that, although the
data points are quite scattered, the results are statistically valid since they are average
of at least 10 specimens each.
0 1 2 3 4 50
10
20
30
40
50
Stra
in a
t bre
ak [%
]
Filler wt. [%]
In-Situ PA6 / Sep In-Situ PA6 / Sep-NH
2
Figure 9.8. Strain at break for in situ PA6/Sep and PA6/Sep-NH2 nanocomposites at
different filler loadings.
Similar results are provided by Figure 9.9, where the toughness was calculated
simply by integrating the engineering tensile tests curves over the strain, which gives
an indication of the total energy needed to bring the sample to failure. The in situ
PA6/Sep-NH2 nanocomposites appear tougher that the in situ PA6/Sep
nanocomposites in particular at higher concentration of filler, with 100 % increase
relative to 5 wt.% of sepiolite. The reason for this significant difference in ductility
232
Page 233
CHAPTER 9 – In-Situ Polymerised PA 6 / Sepiolite Nanocomposites
and toughness can be related to the nanocomposite structure. As previously
mentioned in the discussion of Fig.9.3, the in situ PA6/Sep-NH2 nanocomposites
present a peculiar morphology, where the sepiolite needles, coated with
propylaminosilane and grafted-from polymerised PA6, are dispersed in the matrix
(commercial PA6). It is suggested that the nano-clay coating can act as a soft
interphase between matrix and filler and hence modify the nanocomposites
deformation mechanism [11-13], without compromising stiffness and strength.
0 1 2 3 4 50
500
1000
1500
Toug
hnes
s (J
m-2)
Filler wt. [%]
In-Situ PA6 / Sep In-Situ PA6 / Sep-NH
2
Figure 9.9. Toughness of in situ PA6 / Sep and PA6 / Sep-NH2 nanocomposites at
different filler loadings, calculated from the integration of the tensile tests curves
force-displacement.
9.3.5 Dynamic Mechanical Analysis
In order to further corroborate the theory of a soft interphase around the
reinforcement phase in the in situ PA6/Sep-NH2, dynamic mechanical analyses
(DMA) are performed on the different nanocomposites. A typical DMA curve of
PA6, over a range of temperature between -140 °C and 150 °C, is provided in Fig.
233
Page 234
CHAPTER 9 – In-Situ Polymerised PA 6 / Sepiolite Nanocomposites
9.10. Generally, the storage modulus decreases with increase of the temperature; the
stiffness dramatically drops from about 3 GPa to about 400 MPa in correspondence
to a relative small interval of temperature (centred in 70 °C).
-150 -100 -50 0 50 100 150
0
1000
2000
3000
4000
5000
6000
Temperature [°C]
Stor
age
Mod
ulus
[MPa
]
0.00
0.02
0.04
0.06
0.08
0.10
0.12
0.14
γβ
α
Tan δ
Figure 9.10. DMA: storage modulus and tan δ curves of PA6.
This phenomenon is associated with the α-relaxation. Generally, viscoelastic
relaxations correspond to the onset of various types of internal molecular motions.
The α-relaxation is characteristic of the amorphous part of the polymer and
corresponds to the relaxation of cooperatively rearranging regions some tens to
hundreds of repeat units. Such a transition can be easily evidenced by the tanδ curve,
that shows a main peak at about 70 °C, a characteristic temperature also known as
the glass transition temperature (Tg). Phenomenologically, the Tg is the temperature
at which the amorphous part of the polymer experiences the transition from glassy to
rubbery state (and vice versa). The tanδ curve also shows two other minor peaks at
about -50 °C and -120 °C, which are normally referred to the β and γ-relaxation
respectively and which are related to the relaxation of much shorter chain segments
and chain folds [6, 11]. The same relaxations are present in the PA6 nanocomposites.
234
Page 235
CHAPTER 9 – In-Situ Polymerised PA 6 / Sepiolite Nanocomposites
The attention is focused on the α-relaxation. In Figure 9.11, the Tg of the
nanocomposites prepared from the two in situ masterbatches is plotted against
sepiolite loadings.
0 1 2 3 4 564
66
68
70
72
74
76
78
T g [°C
]
Filler Content [%]
In-situ PA6 / Sep In-situ PA6 / Sep-NH2
Figure 9.11. Tg of in situ PA6/Sep and in situ PA6/Sep-NH2 nanocomposites vs.
filler loadings.
The in situ PA6/Sep nanocomposites present glass transition temperatures
statistically invariable with the filler content, if we exclude the effect of extremely
low weight percentages. The Tg of in situ PA6/Sep-NH2 nanocomposites, however,
decreases with increasing amount of sepiolite and reaches values as much as 8 °C
lower than in situ PA6/Sep, for less than 5 wt.% of filler. This behaviour is believed
to be related to the nano-clay coating and to what has already been proposed in the
previous paragraph, as a “soft interphase” between matrix and filler.
It is widely documented in the literature that the Tg of nanocomposites, with well
dispersed nanofillers, can exhibit substantial deviations from the values of the bulk
235
Page 236
CHAPTER 9 – In-Situ Polymerised PA 6 / Sepiolite Nanocomposites
polymer [14-16]. It is generally accepted that this depends on the nature of the
interactions forming between polymer and filler. The Tg should increase in
correspondence to “wetted” polymer/filler interfaces characterised by attractive
interactions (i.e. hydrogen bonds) while the Tg should decrease for weak interfaces.
The two cases above are closely related to two model systems amply studied: thin
polymeric films on a substrate (supported films) with good interfacial interactions,
and thin films at the free surface (free-standing films) [17-20]. The perturbations
induced by the presence of a substrate or a free surface extend for up to 100 nm into
the film, but with different results. At the substrate, interfacial bonds suppress
cooperative segmental mobility, which lead to an increase in Tg, while at the free
surface there is enhanced cooperative segmental mobility and reduced Tg.
In the case of in situ PA6/Sep-NH2 nanocomposites, it is believed that the reduction
of Tg with filler content is induced by the effect of the nanoclay coating that shields
the hydrogen-bond interactions between bulk PA6 and sepiolite, present instead in
the in situ PA6/Sep nanocomposites. This exemplifies the concept of “soft
interphase” polymer/nanofiller proposed previously.
9.4 Conclusions
Two model in situ PA6/sepiolite nanocomposites have been successfully prepared,
differing exclusively in the interfacial interactions: in situ PA6/Sep and in situ
PA6/Sep-NH2. Both nanocomposites have been characterised in terms of
morphology, thermal behaviour, semi-static tensile tests and dynamic mechanical
tests. The morphology, as investigated by SEM, shows a homogeneous dispersion of
the nanoclays into the polar polymeric matrix. Notable enhancements in stiffness and
strength are obtained with only little weight percentage of filler, without modifying
the total amount of crystallinity of the matrix. Interestingly, the grafted-from
nanocomposites (in-situ PA6/Sep-NH2) presented an enhanced strain at break and
toughness (up to 100 % for 5 wt.% of filler) compared with the in situ PA6/Sep
nanocomposites. It is believed that the reason for this difference lie in the modified
236
Page 237
CHAPTER 9 – In-Situ Polymerised PA 6 / Sepiolite Nanocomposites
interface matrix/filler. The in situ PA6/Sep-NH2 comprises what can be described as
a soft interphase, as demonstrated by SEM micrographs and by the reduction in glass
transition temperature, with leads to an enhancement in the energy dissipation.
9.5 References 1. A. Okada, M. Kawasumi, A. Usuki, Y. Kojima, T. Kurauchi, and O.
Kamigaito. Synthesis and properties of nylon-6/clay hybrids. in MRS
Symposium Proceedings. 1990. Pittsburgh.
2. A. Usuki, Y. Kojima, M. Kawasumi, A. Okada, Y. Fukushima, T. Kurauchi,
and O. Kamigaito, Synthesis of Nylon 6-Clay Hybrid. Journal of Materials
Research, 1993. 8(5): p. 1179-1184.
3. P. Liu and J. Guo, Polyacrylamide grafted attapulgite (PAM-ATP) via surface-
initiated atom transfer radical polymerization (SI-ATRP) for removal of Hg(II)
ion and dyes. Colloids and Surfaces A: Physicochemical and Engineering
Aspects, 2006. 282: p. 498-503.
4. E. Franchini, Structuration of nano-objects in eposy-based polymer systems :
nanoparitcles and nanoclusters for improved fire retardant properties. 2007,
INSA: Lyon.
5. E. Duquesne, S. Moins, M. Alexandre, and P. Dubois, How can nanohybrids
enhance polyester/sepiolite nanocomposite properties? Macromolecular
Chemistry and Physics, 2007. 208(23): p. 2542-2550.
6. M. Kohan, Nylon Plastics. 1973, New York, London: Wiley-Interscience.
7. JP564550.
8. US3182055.
9. US5869654.
10. T.D. Fornes and D.R. Paul, Crystallization behavior of nylon 6
nanocomposites. Polymer, 2003. 44(14): p. 3945-3961.
11. J.P. Bell and T. Murayama, Relations between dynamic mechanical properties
and melting behavior of nylon 66 and poly(ethylene terephthalate). Journal of
Polymer Science Part A-2: Polymer Physics, 1969. 7(6): p. 1059-1073.
237
Page 238
CHAPTER 9 – In-Situ Polymerised PA 6 / Sepiolite Nanocomposites
12. W. Jincheng and Y. Gencang, The energy dissipation of particle-reinforced
metal-matrix composite with ductile interphase. Materials Science and
Engineering: A 2001. 303(1): p. 77-81.
13. K. Ding and G.J. Weng, Plasticity of particle-reinforced composites with a
ductile interphase. Journal of Applied Mechanics-Transactions of the Asme,
1998. 65(3): p. 596-604.
14. J.L. Keddie, R.A.L. Jones, and R.A. Cory, Size-Dependent Depression of the
Glass-Transition Temperature in Polymer-Films. Europhysics Letters, 1994.
27(1): p. 59-64.
15. J.A. Forrest, K. Dalnoki-Veress, J.R. Stevens, and J.R. Dutcher, Effect of Free
Surfaces on the Glass Transition Temperature of Thin Polymer Films. Physical
Review Letters, 1996. 77(10): p. 2002-2005.
16. C.J. Ellison and J.M. Torkelson, The Distribution of Glass Transition
Temperatures in Nanoscopically Confined Glass Formers. Nature Materials,
2003. 2: p. 695-700.
17. R.D. Priestley, C.J. Ellison, L.J. Broadbelt, and J.M. Torkelson, Structural
Relaxation of Polymer Glasses at Surfaces, Interfaces, and In Between Science,
2005. 309(5733): p. 456 - 459.
18. P. Rittigstein and J.M. Torkelson, Polymer-nanoparticle interfacial
interactions in polymer nanocomposites: Confinement effects on glass
transition temperature and suppression of physical aging. Journal of Polymer
Science Part B: Polymer Physics, 2006. 44(20): p. 2935 - 2943.
19. M.K. Mundra, S.K. Donthu, V.P. Dravid, and J.M. Torkelson, Effect of Spatial
Confinement on the Glass Transition Temperature of Patterned Polymer
Nanostructures. Nano Letters, 2007. 7: p. 713-718.
20. P. Rittigstein, R.D. Priestley, L.J. Broadbelt, and J.M. Torkelson, Model
Polymer Nanocomposites Provide Understanding of Confinement Effects in
Real Nanocomposites. Nature Materials, 2007. 6: p. 278 - 282.
238
Page 239
10 Conclusions and Future Work
10.1 Summary
In the last two decades, polymer-clay nanocomposites have attracted great interests
because of the remarkable enhancements in mechanical and physical properties with
minute amount of nano-filler, promising to eliminate the typical compromise
between properties and processability of composite materials. Despite the
expectations created by nano-clays in the academic and industrial communities, their
success has been so far limited. The reasons being (i) the poor dispersion of nano-
clays in polymer matrices, (ii) the often weak interfacial interaction with polymers,
and (iii) the lack of control of nano-clay orientation.
In this thesis, all of the aspects mentioned above have been tackled, studying the
potentials of sepiolite ‘needle-like’ clay as nanofiller in two thermoplastic polymers:
PP and PA6. A particular emphasis is given throughout the thesis on the comparison
of needle-like sepiolite with the more widely investigated ‘platelet-like’ smectite
nanoclays (i.e. montmorillonite MMT).
A full understanding of the characteristics of the constituent phases is essential
before manufacturing any composite materials and to interpret their final properties.
This was exactly the inspiring motto behind Chapter 5, in which sepiolite nanoclay
was thoroughly studied for its morphological, structural, thermal and mechanical
properties. The elementary particles are rigid needles of 650 nm in length and 24 nm
239
Page 240
CHAPTER 10 – Conclusions and Future Work
in diameter on average, but with a quite broad dimensional distribution. In fact the
mean aspect ratio (L/D) is 27 but it ranges from 10 to 130. Sepiolite is one of the
clays with the highest specific surface area (300 m2g-1, compared with 25-40 m2g-1
for MMT), which is an indicator of its open structure and accessible external surfaces
and its potential ease in dispersing these fibre-like rather than plate-like nanoclays in
polymer matrices. For the first time in literature, the mechanical properties of the
nanoclay have been evaluated via nano-bending tests on individual sepiolite
particles; the elastic modulus of sepiolite was found to be about 200 GPa. With this
preliminary information in place, the reinforcing potential of needle-like (1D)
sepiolite nanofillers was evaluated by means of the shear-lag model and Halpin-Tsai
equations and compared with platelet-like (2D) clays. Theoretically, sepiolite is
expected to give a more effective reinforcement in 1D uniaxially oriented
composites. Vice versa platelet-like clays should provide a higher reinforcement in
the case of 3D random composites.
In Chapter 6, sepiolite is melt compounded in polypropylene. The nanofiller
dispersion in such hydrophobic matrix was unsatisfactory and it was improved by
use of functionalised polymers, as a third phase in the PP/Sep composites, and the
direct functionalisation of the sepiolite surface. Surface modification of the sepiolite
(silanisation) resulted as a very promising route to improve the compatibility
between PP matrix and nanoclays. It guaranteed excellent nanofiller dispersion (up to
1-2 wt.%) and the best mechanical performances among the different systems studied
(in particular for what concerns the yield stress), without the addition of any
compatibiliser. Moreover, in all cases it was interesting to observe that the thermal
degradation of PP, in oxidative atmosphere, is substantially retarded by the presence
of sepiolite and the effect is more evident for increasing loadings of nano-filler, up to
5 wt.%. The mechanical properties of PP/Sep nanocomposites were further analysed
with two micromechanical models (Halpin-Tsai and Pukanszky) and compared with
relevant publications in the scientific literature. Sepiolite seemed to provide a better
reinforcement in terms both of Young’s modulus and yield stress, when compared
with smectite clays with equivalent levels of filler orientation and this was explained
by a better dispersion achievable with needle-like rather than platelet-like clays.
240
Page 241
CHAPTER 10 – Conclusions and Future Work
The real advantage of needle- or fibre-like nanofillers rather than plate-like
nanoclays is expected to be experienced for 1D composites, as demonstrated in
Chapter 5. Hence highly oriented PP/sepiolite nanocomposite tapes are prepared by
means of solid-state drawing (Chapter7). The orientation of both the polymer
crystallites and the needle-like filler in the tapes was demonstrated by WAXS
studies. Small amounts of sepiolite (< 2.5 wt.%) had an extraordinary effect on the
mechanical properties of PP tapes, for intermediate draw ratios (10 < λ < 20).
However, the DSC analysis suggested that the origin of the improved mechanical
properties was more related to the modification of the semi-crystalline polymer
structure rather than a pure composite reinforcement effect. Whichever the reasons,
sepiolite was demonstrated as an interesting nanofiller for oriented polypropylene
tapes. In fact, beside improved mechanical behaviour, sepiolite clay provides
increased utilisation temperature (lower flowability) and improved thermal and fire
resistance.
PA6/sepiolite nanocomposites were prepared both by melt compounding (Chapter 8)
and in situ polymerisation (Chapter 9). PA6 disperses sepiolite well without any
needs of compatibilisers or clay surface functionalisation. The simple and
environmentally friendly melt-compounding proved as efficient as the in situ
polymerisation for what concerned the dispersion state of nano-filler, making it a
good candidate for industrial and commercial applications. WAXS confirmed the
appearance of γ-phase crystals, against the more stable α-phase, induced by the
presence of sepiolite in PA6. Edge view X-ray tests also established partial
orientation of sepiolite nano-fibres in the longitudinal plane of tensile test specimens.
Notable enhancements in stiffness and strength were obtained with only small
amounts of filler although this was accompanied by a decrease in strain at break. The
mechanical performances were interpreted in terms of two micromechanical models
(Halpin-Tsai and Pukanszky equation) and compared with the results of PA6/MMT
taken from selected literature publications. Sepiolite showed a notable enhancement
in tensile stress compared with MMT, explained by strong hydrogen bonds between
silanols groups on sepiolite surface and the amide groups of the matrix, which are
instead missing in montmorillonite, even after surface functionalisation.
241
Page 242
CHAPTER 10 – Conclusions and Future Work
Finally, an in situ polymerisation method (Chapter 9) was utilised in particular to
create two PA6/Sep nanocomposite model systems to study the effect of different
interfacial interactions: in situ PA6/Sep and in situ PA6/Sep-NH2. The former is a
simple polymerisation of PA6 “in presence of” natural sepiolite, while the last is a
polymerisation “grafted from” the functionalised surface of sepiolite (Sep-NH2).
Interestingly, the “grafted from” nanocomposites (in situ PA6/Sep-NH2) presented an
enhanced strain at break and toughness (up to 100 % for 5 wt.% of filler) compared
with the in situ PA6/Sep nanocomposites, without compromising Young’s modulus
and tensile strength. It is believed that the reason for this difference laid in the
modified interface matrix/filler. The in situ PA6/Sep-NH2 showed what can be
described as a soft interphase, as demonstrated by SEM micrographs and by the
reduction in glass transition temperature, with leads to an enhancement in energy
dissipation.
10.2 Future Work
From both a theoretical and experimental point of view, this thesis indicates that
sepiolite is a promising nanofiller, particularly for unidirectionally oriented (1D)
nanocomposite, in comparison with the more investigated smectite clays (i.e. MMT).
The main reasons are the peculiar needle-like shape (instead of the plate-like shape),
the relative ease in dispersing sepiolite in polymeric matrices and the presence of
silanol groups on the sepiolite surface which allows viable and effective
functionalisation, necessary for hydrophobic polymers as PP, or directly strong
interactions with hydrophilic polymers as PA6. It seems natural to focus future works
principally in the area of unidirectional polymer/sepiolite nanocomposites. PP/Sep
nanocomposites tapes have already shown interesting physical properties (Chapter 7)
that can find commercial applications. These can be in the area of synthetic textile
fibres (mainly constituted by polyolefin, polyamide and polyester fibres) or in the
niche but more profitable market of all-PP composites such as Curv® or PURE®.
242
Page 243
CHAPTER 10 – Conclusions and Future Work
All-PP are self-reinforced composite materials, in which bulk isotropic PP (matrix) is
reinforced by highly oriented and anisotropic polypropylene films, tapes or fibres [1-
3]. Such composites are characterised by high stiffness, low weight, high impact
strength and 100 % recyclability, and have already applications in automotive,
construction and anti-ballistic fields, among others [4]. Sepiolite could be used to
reinforce the highly oriented PP phase while at the same time improve the thermal
and fire resistance, and barrier properties. This strategy can be seen as providing
another hierarchical level to the material engineering at the nanometre scale, without
adding more complexity to the manufacturing of the composite. In fact it could be
easily implemented just by using PP masterbatches loaded with small amounts of
sepiolite clay, on established manufacturing line.
Very interesting results can be also expected from oriented nanocomposites based on
polyamide or polyester matrices. In fact, strong interfacial interaction between matrix
and filler and excellent dispersion of sepiolite in PA6 were already observed in
Chapter 8, without the need of any compatibilisers or surface modification.
Another way to produce unidirectional nanocomposites is via the technique of
electrospinning. The electrospun polymers and composites reported in literature are
already numerous, including nanoclay composites [5-8]. To the best of the author’s
knowledge sepiolite has never been attempted to be included in electrospun fibres.
Figure 10.1 presents some initial work on fibres of a blend of HPC and PEO filled
with sepiolite, successfully prepared via electrospinning. The TEM micrograph in
Fig.10.1.a-c show small bundles of sepiolite in a HPC/PEO fibre (100-150 nm in
diameter). It is also possible to organise single electrospun fibres into a given fibrous
structure, by simply changing the fibre collecting set-up. Fig.10.1.d and Fig.10.1.e,
for instance, show how to achieve aligned fibres or how these can be twisted into
yarns.
243
Page 244
CHAPTER 10 – Conclusions and Future Work
a) b)
c) d)
e)
Figure 10.1. TEM micrographs of: a)-c) HPC/PEO electrospun fibres filled with
sepiolite needle-like clay, d) aligned electrospun fibres and e) electrospun fibres
twisted into a yarn. The electrospun fibres in the Figures 10.1.a-c are about 200nm
in diameter, which gives a scale for those micrographs.
Beside the search for applications of sepiolite clay in the area of oriented
nanocomposites, fundamental research is still to be carried out and basic questions to
be answered.
244
Page 245
CHAPTER 10 – Conclusions and Future Work
One is certainly the effect of melt compounding on the aspect ratio of the sepiolite
itself. In Chapter 6, breakage of the nano-needles was already observed. For the
future a more systematic study of the effect of processing on the aspect ratio of the
sepiolite is to be carried out.
Also, the beneficial effect of sepiolite on the thermal resistance of PP was shown via
TGA tests (Chapter 6), suggesting a fire-retardant effect in such a matrix. However
the most recognised apparatus for fire tests is the Cone Calorimeter. Such tests will
be performed in the future on sepiolite nanocomposites.
Finally more nano-mechanical tests can be performed. For the first time the Young’s
modulus of nanoclay has been measured. Future work will be focus on the ultimate
tensile strength and the strain at break of sepiolite. Another interesting research
objective will be to evaluate the strength of the interphase polymer/clay by
specifically designed pull-out tests. In analogy with some work on carbon nanotubes
[9, 10], sepiolite could be attached to a SPM tip, embedded in a liquid resin and
pulled out from it after solidification or curing.
10.3 References
1. J. Loos, T. Schimanski, J. Hofman, T. Peijs, and P.J. Lemstra, Morphological
investigations of polypropylene single-fibre reinforced polypropylene model
composites Polymer, 2001. 42(8): p. 3827-3834.
2. B. Alcock, N.O. Cabrera, N.-M. Barkoula, J. Loos, and T. Peijs, The
mechanical properties of unidirectional all-polypropylene composites.
Composites, Part A: Applied Science and Manufacturing, 2006. 37(5): p. 716-
726.
3. B. Alcock, N.O. Cabrera, N.-M. Barkoula, C.T. Reynolds, L.E. Govaert, and T.
Peijs, The effect of temperature and strain rate on the mechanical properties of
highly oriented polypropylene tapes and all-polypropylene composites.
Composites Science and Technology, 2007. 67(10): p. 2061-2070.
4. http://www.pure-composites.com.
245
Page 246
CHAPTER 10 – Conclusions and Future Work
5. W.E. Teo and S. Ramakrishna, A review on electrospinning design and
nanofibre assemblies. Nanotechnology, 2006. 17: p. R89-R106.
6. Z.-M. Huang, Y.-Z. Zhangb, M. Kotakic, and S. Ramakrishna, A review on
polymer nanofibers by electrospinning and their applications in
nanocomposites. Composites Science and Technology, 2003. 63(15): p. 2223-
2253.
7. L. Li, L.M. Bellan, H.G. Craighead, and M.W. Frey, Formation and properties
of nylon-6 and nylon-6/montmorillonite composite nanofibers. Polymer, 2006.
47: p. 6208-6217.
8. V.K. Daga, M.E. Helgeson, and N.J. Wagner, Electrospinning of Neat and
Laponite-Filled Aqueous Poly(ethylene oxide) Solutions. Journal of Polymer
Science, Part B: Polymer Physics, 2006. 44: p. 1608–1617.
9. A.H. Barber, S.R. Cohen, and H.D. Wagner, Measurement of carbon nanotube-
polymer interfacial strength. Applied Physics Letters, 2003. 82(23): p. 4140-
4142.
10. A.H. Barber, S.R. Cohen, A. Eitan, L.S. Schadler, and H.D. Wagner, Fracture
transitions at a carbon-nanotube/polymer interface. Advanced Materials, 2006.
18(1): p. 83-87.
246
Page 247
List of Author’s Publications [1-7] 1. E. Bilotti, H. Deng, R. Zhang, D. Lu, W. Bras, H.R. Fischer, and T. Peijs,
Highly oriented multifunctional polypropylene / sepiolite clay nanocomposite
tapes. Submitted to Polymer.
2. E. Bilotti, H. Deng, R. Zhang, D. Lu, W. Bras, H.R. Fischer, and T. Peijs, PA6
nanocomposites based on needle-like sepiolite nanoclay. To be published.
3. H. Deng, T. Skipa, R. Zhang, D. Lellinger, E. Bilotti, I. Alig, and T. Peis, Effect
of melting and crystallisation on the conductive network in conductive polymer
composite. Submitted to Polymer.
4. H. Deng, R. Zhang, E. Bilotti, and T. Peijs, Effective reinforcement of carbon
nanotubes in polypropylene matrices. Submitted to Journal of Applied Polymer
Science.
5. H. Deng, R. Zhang, E. Bilotti, J. Loos, and T. Peijs, Conductive polymer tape
containing highly oriented carbon nanofillers. Accepted in Journal of Applied
Polymer Science, 15 October. DOI 10.1002 / app.29624.
6. E. Bilotti, H.R. Fischer, and T. Peijs, Polymer nanocomposites based on
needle-like sepiolite clays: Effect of functionalized polymers on the dispersion
of nanofiller, crystallinity, and mechanical properties. Journal of Applied
Polymer Science. 107(2): p. 1116-1123.
7. J. Ma, E. Bilotti, T. Peijs, and J.A. Darr, Preparation of polypropylene/sepiolite
nanocomposites using supercritical CO2 assisted mixing. European Polymer
Journal. 43(12): p. 4931-4939.
247